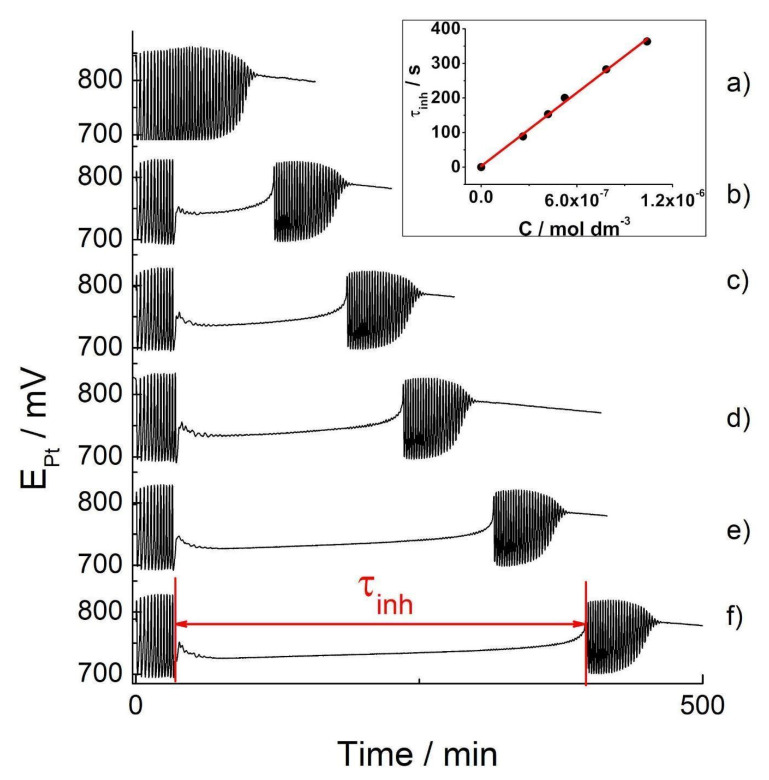
Figure 4.
The Pt Electrode BR oscillograms: the basic BR oscillogram (a) and the oscillograms obtained by the addition of tested concentrations of the indigo carmine in food dye: 2.62 × 10⁻⁷ mol dm−3 (b); 4.19 × 10⁻⁷ mol dm−3 (c); 5.24 × 10⁻⁷ mol dm−3 (d); 7.84 × 10⁻⁷ mol dm−3 (e); 1.04 × 10⁻⁶ mol dm−3 (f): inserted picture: the calibration curves obtained from the concentrations of indigo carmine of the food dye when added to the oscillating Briggs–Rauscher reaction.

