

Abstract
Oral drug delivery, which requires surviving the harsh environment in the gastrointestinal (GI) tract and penetrating the intestinal epithelium, has not been achieved using simple formulation nanoparticles (NPs). Medicinal natural products (MNPs) have been widely used in traditional medicine for disease management through oral consumption. However, most pharmacologically active compounds within MNPs do not have the properties suitable for oral applications. We hypothesize that some MNPs contain natural nanomaterials that can convert those compounds into oral formulations by forming NPs. After screening 66 MNPs, we identified five classes of small molecules that form NPs, many of which are capable of efficient drug encapsulation and GI penetration. We show that one of them, dehydrotrametenolic acid (DTA), is capable of mediating oral delivery for effective disease treatment. We determine that DTA NPs assemble through hydrogen bonding and penetrate the GI tract via apical sodium-dependent bile acid transporter. Our study reveals a novel class of single component, small molecule- assembled NPs for oral drug delivery, and suggests a novel approach to modernizing MNPs through nanomaterial discovery.
Keywords: natural material, oral drug delivery, nanoparticle, dehydrotrametenolic acid
Graphical Abstract
Medicinal natural products are widely used in traditional medicine for disease management through oral consumption. Here we report five classes of molecules that form single small molecule-assembled nanoparticles, many of which are capable of efficient drug encapsulation and oral delivery.
1. Introduction
Oral drug delivery is a major challenge, as it requires overcoming a series of physiological barriers in the gastrointestinal (GI) tract, including highly acidic environments, enzymatic degradation, and the intestinal epithelium [1, 2]. Recently, nanotechnology has emerged as a promising approach to overcome those limitations. Nanoparticles (NPs) not only provide physical protection to the encapsulated cargo, but they also are the optimal size for GI penetration and blood circulation [1, 3, 4]. However, oral drug delivery using NPs synthesized from existing nanomaterials, mainly polymers, lipids, or inorganic materials, often suffers from two major limitations. First, most of these NPs are sensitive to acidic pHs, resulting in low stability in the acidic stomach environments. Second, most of these NPs do not interact with the intestinal epithelium, and require surface conjugation of ligands that target receptors expressed in the intestinal epithelium, such as the vitamin B12 receptor [5] and the neonatal Fc receptor for oral drug delivery [6]. This degree of complexity may hinder their clinical translation. Simple formulation NPs that are stable in the GI tract and have intrinsic capabilities for GI penetration are ideal for oral drug delivery.
Medicinal natural products (MNPs), which can be derived from plants, fungi, bacteria, and animals, have been widely used in traditional medicine [7]. In recent years, the modernization of traditional medicine has focused on isolating single pharmacologically active compounds from MNPs. This focus has led to the discovery of over half of the small molecule drugs developed between 1981 and 2010 (Fig. 1) [8]. A major obstacle in MNP-based drug discovery, however, is that over 90% of the isolated compounds cannot be used as drugs because of their poor stability, solubility, or pharmacokinetics. Instead, they require chemical alterations or formulation for clinical applications [9]. Although these bioactive compounds have limited bioavailability, they are able to exert their pharmacological activities in traditional medicine through oral consumption after processing, such as boiling/cooling or emulsification, into soup (Fig. 1) [10]. It appears that following the processing, bioactive compounds with low bioavailability are converted by other components in MNPs to an orally bioavailable form.
Figure 1.
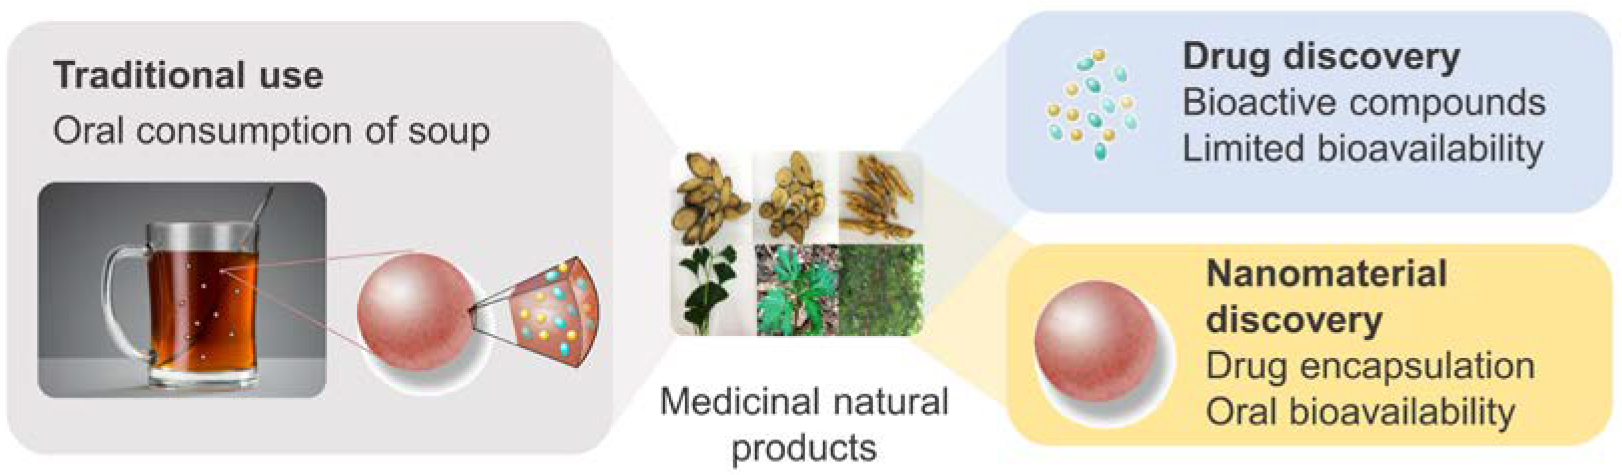
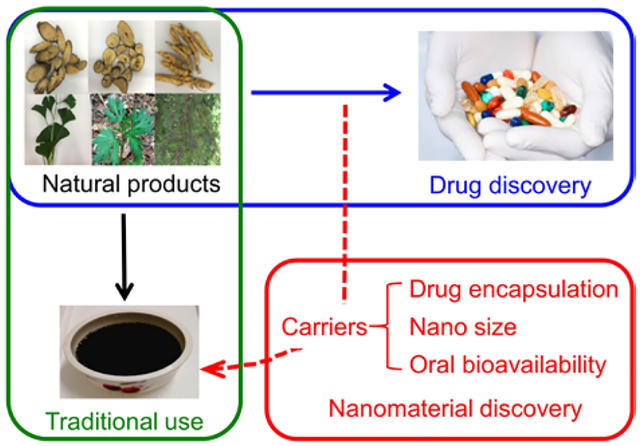
MNPs as a resource for discovery of novel nanomaterials. Traditionally, MNPs are processed into soup and consumed through oral administration. In recent years, MNPs have emerged as a major source for discovery of drugs, which, without modifications or formulation, often have limited bioavailability. We hypothesize that, in addition to bioactive compounds, certain MNPs contain nanomaterials that form NPs for oral drug delivery.
We hypothesized that, in addition to these bioactive compounds, certain MNPs contain natural materials that can convert non-bioavailable, bioactive compounds to their orally bioavailable forms through the formation of NPs during processing (Fig. 1). Due to their nanoscopic size and interaction with the gastrointestinal (GI) epithelium, such NPs are able to penetrate the GI tract and circulate in the blood stream [1, 4]. If the hypothesis is correct, we will be able to isolate natural nanomaterials for oral drug delivery from MNPs. To test this hypothesis, we developed a chemical extraction approach to magnetically isolating nanocarriers from MNPs using superparamagnetic iron oxide (SPIO) as a cargo agent. With this approach, we screened 66 MNPs commonly used in TCM and identified five classes of small molecules that are capable of forming NPs suitable for oral drug delivery. Additional analysis of one of the identified NPs, dehydrotrametenolic acid (DTA), revealed that the structure of NPs is determined by intermolecular hydrogen bonding. We further demonstrated that the DTA NPs penetrate the gastrointestinal (GI) tract by hijacking the ASBT-based intestinal transport system and are capable of efficiently delivering therapeutics for effective disease treatment.
2. Experimental
2.1. Materials and cell culture
Human epithelial colorectal adenocarcinoma cell line Caco-2 and human breast cancer cell line MDA-MB-231 were purchased from American Type Culture Collection (ATCC). Cells were grown in Dulbecco’s modified Eagle’s medium (DMEM, Invitrogen) supplemented with 10% fetal bovine serum (FBS, Invitrogen), 100 units/mL penicillin, and 100 μg/mL streptomycin (Invitrogen) in a 37 °C incubator containing 5% CO2. MNPs used in this study were purchased from Beijing Tong Ren Tang Chinese Medicine Co Ltd. SPIO nanodots were synthesized according to our previously reported procedures [11]. Caco-2 with overexpression of ASBT was generated through lentiviral transduction and selected by puromycin. Lentiviral construct was established by subcloning ASBT cDNA (also called SLC10A2, R&D Systems) into pCDH-MCS-T2A-Puro vector (System Biosciences). Artificial lentiviruses were produced using a second generation of packing systems, including pMD2.G and psPAX2 (Addgene) according to our previous reports [12, 13]. Other reagents, if not specified, were purchased from Sigma-Aldrich.
2.2. Natural medicinal products and chemical agents
In total, 67 natural medicinal products (MNPs, as listed in Table S1) were purchased from Anguo medicinal market, Hebei, China. All the samples were authorized by Prof. Rufeng Wang, Beijing University of Chinese Medicine, China, and all voucher specimens have been deposited in the herbarium of the Laboratory of Natural Products, College of Biological Science and Technology, Beijing Forestry University. Analytical-grade methanol, petroleum ether, ethanol, trichloromethane and methylene dichloride were purchased from Sigma Chemical Co. (St. Louis, MO, USA). Silica gel (200–400 mesh) and silica gel G thin layer chromatographic (TLC) plates were obtained from Qingdao Haiyang Chemical Co., Ltd. (Qingdao, China). Sephadex LH-20 was obtained from GE Healthcare Bio-Sciences AB (Uppsala, Sweden). HPLC grade methanol and acetonitrile was obtained from Fisher Scientific Co. (Waltham, USA).
2.3. Natural nanomaterial extraction and characterization
For the boiling/cooling approach, 0.5 g of selected MNPs powder was mixed with SPIO nanodots (0.5%, w/w) and boiled for 1.5 h. After cooling down, debris in the soup was removed by centrifugation at 3000 rpm for 10 min. SPIO-encapsulated NPs were collected using a magnet on the side of the tube for 1 h. Then, the SPIO-encapsulated NPs were washed twice with water and finally resuspended in water or lyophilized for further analysis. For chemical extraction approach, 0.5g MNPs powder was soaked in 15 mL of DCM for 2 d. After filtration, DCM extract of MNPs was obtained and then emulsified with SPIO nanodots using the standard emulsion procedures described below. SPIO-encapsulated NPs were collected using a magnet. After lyophilization, SPIO-encapsulated NPs were re-dissolved in DCM. SPIO nanodots were removed using magnetic force. From these procedures, drug encapsulation materials were obtained. Further purification and structural characterization of nanomaterials was performed as described in the supplementary information. Individual compounds were selected based on their ability to form NPs using the standard emulsion procedures described below.
2.4. Synthesis of NPs
NPs were synthesized using the standard emulsion procedures [14–17]. For synthesis of NPs encapsulated with hydrophobic cargos, including SPIO, Rho, IR780, and PTX, the selected cargo was dissolved together in mixed organic solution of DCM (1ml) and methanol (0.1 ml), and added dropwise to a solution of 4 ml 2.5% PVA (aqueous phase). The resulting emulsion was sonicated on ice for 40 s (5 s on, 5 s off) and added to a stirring solution of 0.3% PVA in water (aqueous phase, 50 ml). After evaporation at 4°C overnight, NPs were collected by centrifugation at 18000 rpm for 30 min. Then, the pellets were suspended in 40 ml of water and collected by centrifugation at 18000 rpm for 30 min to obtain the NP pellets. Finally, the NP pellets were suspended with 5 ml of water, sonicated for 3 min, and then lyophilized for storage. For synthesis of GLP-1(7–37)-loaded DTA NPs, about 1.0 mg GLP-1(7–37) powder was dissolved in 40 μl of DMSO, and then mixed with 1.0 ml of DTA solution (10 mg/ml) in DCM. The mixture was immediately emulsified with the same emulsion procedure as described above.
2.5. Characterization of NPs
Scanning electron microscopy (SEM)
The morphology and size of NPs were characterized using SEM and ImageJ, respectively. Samples were mounted on carbon tape and sputter-coated with gold, under vacuum, in an argon atmosphere, using a sputter current of 40 mA (Dynavac Mini Coater, Dynavac, USA). SEM imaging was carried out with a Philips XL30 SEM using a LaB electron gun with an accelerating voltage of 10 kV. The mean diameter and size distribution of the particles were determined by image analysis using image analysis software (ImageJ, National Institutes of Health). These micrographs were also used to assess particle morphology.
Dynamic light scattering (DLS)
The hydrodynamic diameter of NPs was measured using dynamic light scattering. A transparent cuvette was filled NPs in HPLC-grade water. The capped cuvette was placed in a Zetasizer (Malvern), and dynamic light scattering data or zeta potential was read.
Transmission electron microscopy (TEM)
For imaging of SPIO-loaded NPs, NP suspension was applied to holey carbon-coated copper grids (SPI, West Chester, PA, USA) and imaged using a TEM microscope (FEI Tecnai TF20 TEM). The same method was used for imaging of DTA- and PAA- NPs, except that the NPs were first stained with uranyl acetate.
Single-crystal X-ray diffraction (SXRD)
DTA crystals in colorless needles were formed in a mixed solvent of methanol/trichloromethane (4:1, v/v) at 4 °C in a monoclinic system, with space group at C 2 and unit cell dimensions of a= 24.1453(16) Å, b= 6.7531(3) Å, c= 33.339(2) Å, β= 92.992(6)°, V= 5428.7(6)Å3, Z = 4, Z’ = 8. The formula and density of DTA are (C30H46O3)2•H2O and 1.135 g cm−3, respectively. A single crystal with dimensions of 0.30 × 0.05 × 0.01 mm3 was used for the X-ray measurements. Diffraction intensity data were collected with a Bruker Smart APEX II CCD diffractometer employing graphite monochromated CuKα radiation (λ=1.54184 Å) at 100K. The crystal structure was solved by the direct method using SHELXS-97, expanded by difference Fourier techniques, and refined through full-matrix least-squares refinement on F2 with anisotropic displacement parameters for non-H atoms using SHELXL-2016. The hydrogen atoms were fixed at their calculated positions.
X-ray diffraction (XRD)
XRD experiments were performed using a Rigaku D/MAX 2550 X-ray Differactometer equipped with a Cu X-ray source (λ = 1.5418 Å) operating at 45 kV and 150 mA. Sample powder was placed on a quartz zero-background holder before analysis. Scans were measured at 2θ in the range of 3–40° using a 0.02 step. The diffractograms were plotted with a constant y-offset for representative purposes.
Fourier-transform infrared spectroscopy (FTIR)
Lyophilized NPs were pressed into the diamond crystal of ATR with a standardized pressure using a manometer. The FTIR spectra were recorded at room temperature on a Thermo Fisher Nicolet 6700 spectrometer with a diamond Attenuated Total Reflectance (ATR) cell.
X-ray photoelectron spectroscopy (XPS)
XPS was carried out using an ESCA 300 XPS machine equipped with a high resolution Scienta-ESCA300 spectrometer. The instrument uses monochromatized AlKα/CrKβ X-ray source, a high power (18kW) rotating anode, a multi-element electron lens, a multi-channel detector, a hemispherical electron energy analyzer, and a large, seven crystal, double focusing monochromator, which focuses the X-rays to a line image, 6 by 0.5 mm on the sample. The pressure of the fast entry chamber, preparation chamber, and sample analysis chamber was set as 2 × 10⁻⁶ mbar, 4 × 10⁻⁸ mbar, and 4 × 10⁻⁹ mbar, respectively. The analyzer slit width was set for 0.8 mm, and the resulting overall energy resolution was 0.35 eV. SCIENTA software was used for data acquisition and data analysis.
2.6. In vitro cytotoxicity evaluation
Cells were plated in a 96-well plate. After overnight incubation, cells were treated with NPs. After 72 h, cell proliferation was quantified using a standard dimethyl thiazolyl diphenyl tetrazolium salt (MTT) assay. 10 mg/mL MTT in PBS was added to the cells resulting in a final MTT concentration of 1 mg/mL. The cells were incubated for an additional 4 h at 37°C. Afterward, the medium was removed and 150 μL DMSO was added to each well to dissolve the formazen crystals. The absorption was measured at 570 nm using a BioTek Instrument ELx800 microplate reader. Each sample was prepared in triplicate and the data were reported as mean ± SD. The percentage cell viability of each sample was determined relative to the control (untreated) cells.
2.7. In vitro drug release
Drug-loaded NPs (3 mg) were suspended in 1 mL buffer and incubated at 37°C with gentle shaking. At each sampling time, NPs were centrifuged for 10 min at 12,000 rpm. The supernatant was collected for quantification of the encapsulated agent and 1 mL buffer was added for continued monitoring of release. The amounts of dye and non-fluorescent agents in supernatant were quantified based on fluorescence using a BioTek microplate reader and HPLC, respectively.
2.8. Bio-distribution of NPs in tumors
Female athymic (NCr-nu/nu) nude mice were used for this study and maintained in a sterile environment. This project was approved by the Yale University IACUC. Mice received subcutaneous flank injections of 1×10⁶ MDA-MB-231 tumor cells. Tumor size was measured weekly using traceable digital vernier calipers (Fisher). Tumor volume was determined by measuring the length (l) and width (w), and then calculating the volume (V) using the following formula: V = lw2 × 0.5. When the tumor volume reached ~300 mm3 (day 1), mice were received oral administration of IR780-loaded NPs, or intravenous treatment of IR780 or IR780-loaded NPs (normalized based on fluorescence). Twenty-four hours later, mice were euthanized and perfused, and the tumors were harvested for imaging using IVIS.
2.9. Determination of the efficacy for cancer treatment
MDA-MB-231 tumor-bearing mice were established as described above. When tumor volumes reached ~50 mm3, mice were randomly divided into four groups (n=7) and received oral administration of PBS, free PTX (25 mg/kg), DTA NPs (150 mg/kg), or PTX-loaded NPs (180 mg/kg, equivalent to 25 mg/kg free PTX). Tumor size and mouse weight were measured three times a week. Mice were euthanized and perfused when tumor volume reached ~1000 mm3. The tumors were then excised and fixed in formalin for immunohistochemistry. Serial sections were obtained and stained using terminal deoxynucleotidyl transferase dUTP nick end labeling (TUNEL) for analysis of cellular apoptosis. The growth curve was plotted using the mean of the tumor volumes for each treatment group, at each time point.
2.10. Determination of the efficacy for glucose regulation
Experiments were performed in BALB/c (age 6–7 w) mice. Sixteen hours after fasting, mice received an i.p. injection of glucose (1.5 g kg−1), immediately followed by oral delivery of GLP-1(7–37)-loaded NPs. Blood samples were collected via tail snipping at 15 min, 30 min, 1 h, 2 h, 4 h, and 8 h time points. Serum glucose was determined using a Bayer’s CONTOUR® blood glucose meter. Insulin was quantified using mouse/rat insulin enzyme-linked immunosorbent assay (ELISA) kits (EMD Millipore). Mean plasma concentration of glucose or insulin – time curves were plotted. AUCs were calculated using MATLAB.
2.11. Oral uptake mechanism study
For flow cytometry analysis, stable ASBT-overexpressing Caco-2 cells and vector control cells were generated through lentiviral transduction in the preliminary study and treated with Rho-loaded NPs. After 4 h incubation, cells were harvested, fixed, and stained with anti-ASBT antibody (R&D Systems) and analyzed by flow cytometry. For the ligand competition study, BALB/c mice received oral administration of 500mg/kg ursodeoxycholic acid suspended in 0.6% carboxyl methyl cellulose. After 5 min, Rho-loaded NPs were administered. Control mice received NPs without pretreatment. At each time point, 20 μL of blood was collected from the tail vein and mixed with 300 μL of methanol. After sonication, the mixture was centrifuged at 10,000 rpm for 10 min. Then, 100 μL of supernatant was transferred into a 96-well plate. The fluorescence emission was read at 627 nm with excitation 553 nm. Mean blood concentration of Rho – time curves were plotted. AUCs were calculated and compared.
2.12. Imaging of DTA NPs after oral administration
One hour after injection of DTA NPs with encapsulation of IR 780 and Rho, the mice were euthanized. The GI tract was isolated, extensively washed, and imaged by in vivo imaging systems (IVIS). The intestinal region where NPs accumulated was dissected, fixed, sliced, and subjected to confocal analysis using a spinning disk microscope (UltraVIEW Vox, PerkinElmer). The quadruple images were taken under a 20x objective lens with the laser lines of 405 nm assigned for DAPI and 640 nm for NPs. Representative images were presented by a single projection image at 10 μm of optical Z-stack.
2.13. In vitro transcytosis assay
Transepithelial transcytosis assay was performed using a 24-well Transwell plates (Costar). ASBT-overexpressing- or vector control- Caco-2 cells were plated at 5×10⁴ per transwell. After 24-hour incubation, 50 μg of Rho- DTA NPs were added to the top chamber. Ursodeoxycholic acid (UA, Sigma-Aldrich) was added to the ASBT-blocking group at a final concentration of 1 μM. Twenty-four h after incubation, the medium in the bottom chamber was collected and read using a BioTek Instrument ELx800 microplate reader.
2.14. Statistical analysis
Data were collected in triplicate and reported as mean and standard deviation. Comparison between the groups were performed using a t-test or one-way ANOVA with multiple comparisons by GraphPad Prism 7.0. *p < 0.05, **p < 0.01 and ***p < 0.001 were considered significant.
3. Results and Discussion
3.1. Isolation of natural nanomaterials from MNPs
To determine if MNPs contain nanomaterials, we analyzed Poria cocos, a saprophytic fungus widely used as an adjuvant component in traditional Chinese medicine (TCM) formulas [18]. Following the traditional processing procedures, Poria cocos powder was prepared and boiled in water. After cooling to room temperature, the supernatant was collected through centrifugation. Analysis of the supernatant by transmission electron microscopy (TEM) revealed both spherical and rod-shaped particles (Fig. S1(a)). Additional analysis of the lyophilized powder by scanning electron microscopy (SEM) confirmed the presence of NPs (Fig. S1(b)).
In order to isolate NPs capable of drug encapsulation, we used hydrophilic, oleic acid-coated SPIO nanodots in a diameter of 5–8 nm [11], as a model cargo. Poria cocos powder was soaked in dichloromethane (DCM). The DCM extract was obtained through filtration and emulsified with SPIO nanodots (Fig. 2(a), Step I). SPIO-encapsulated NPs were collected using magnets. Encapsulation of SPIO was confirmed by transmission electron microscope (TEM) (Fig. 2(b)). After lyophilization, the SPIO-encapsulated NPs were dissolved in DCM. Free SPIO nanodots were removed by magnetization (Fig. 2(a), Step II). The resulting extractant was separated using column chromatography (Fig. 2(a), Step III). Different fractions were evaluated for their abilities to form NPs. Based on these procedures, we obtained two compounds that form NPs. 1H-NMR, 13C-NMR, and mass spectrometry analyses identified them as dehydrotrametenolic acid (DTA) and poricoic acid A (PAA) (Fig. 2(c) and (e), Fig. S2). Through standard single emulsion procedures, both PAA and DTA formed rod-shaped NPs in a length of ~400 nm and a diameter of ~70 nm (Fig. S1(c–f)). Inclusion of polyvinyl alcohol (PVA), a surfactant commonly used in NP synthesis, in the emulsion procedure improved the morphology of NPs and reduced aggregation (Fig. 2(d) and (f)). Therefore, PVA was included in NP synthesis in the remainder of the study.
Figure 2.
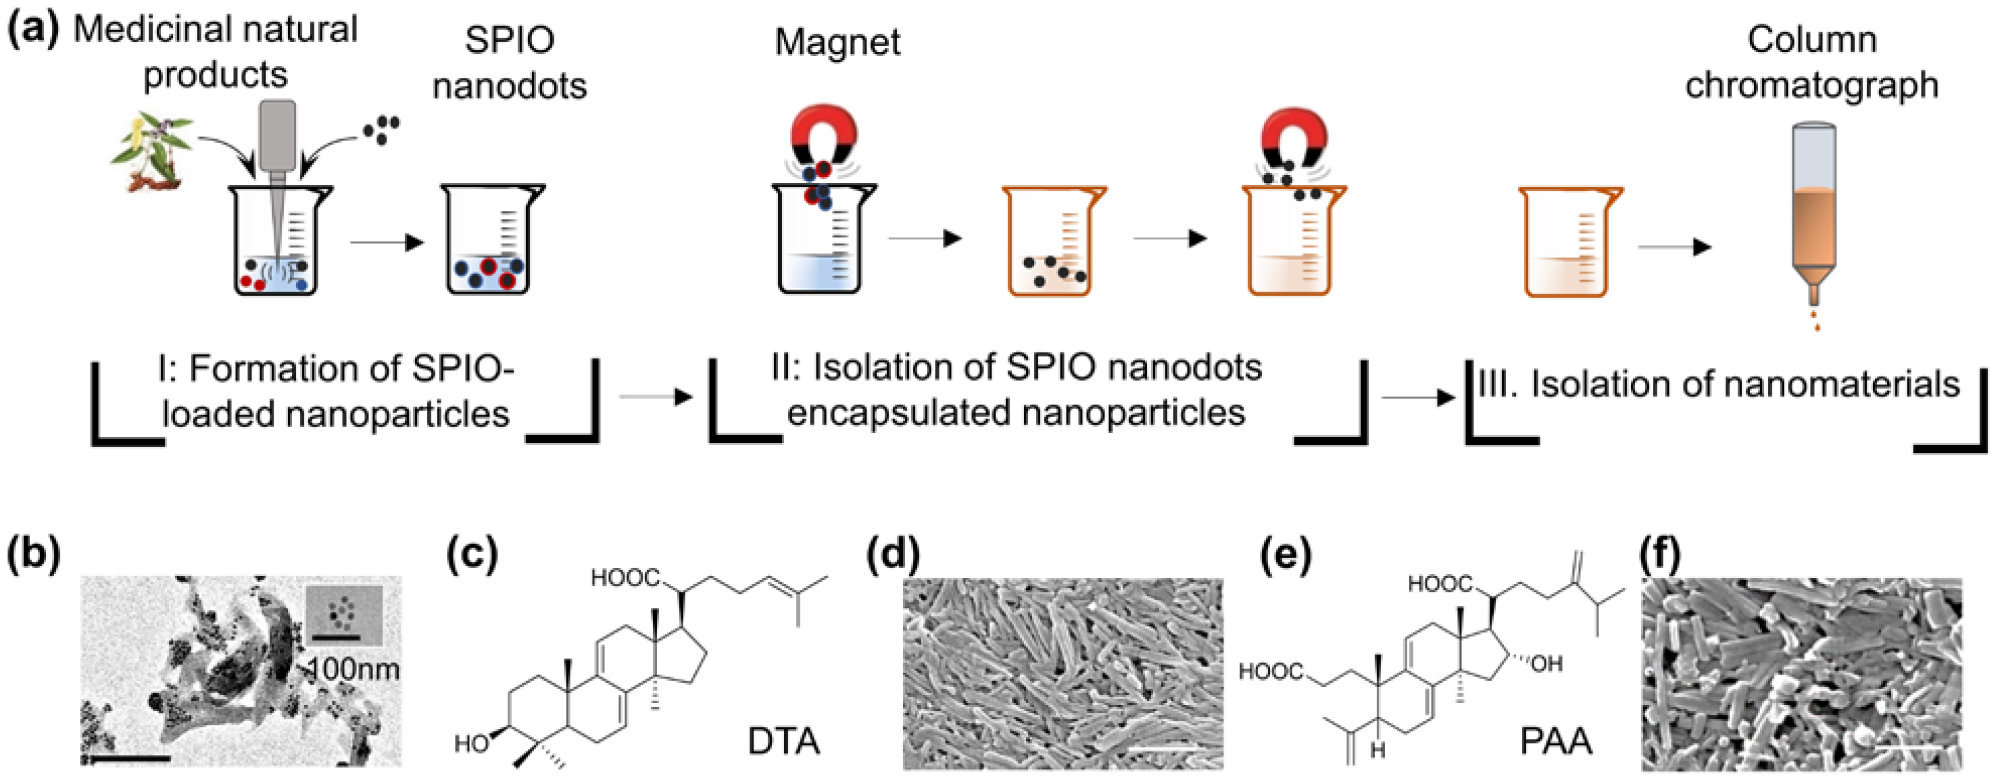
Isolation of natural nanomaterials from Poria cocos. (a) Procedures for nanomaterial isolation. (b) Representative TEM images of SPIO (insert) and SPIO-encapsulated NPs. Molecular structures of DTA (c) and PAA (e). Representative SEM images of DTA NPs (d) and PAA NPs (f). Scale bar: 500 nm.
3.2. MNP screen for identification of natural nanomaterials suitable for oral drug delivery
To further identify nanomaterials from MNPs, we took the same approach and screened 65 additional MNPs (Table S1). In total, we identified five classes of nanomaterials (Fig. 3(a)), including: 1) diterpene resin acids, such as abietic acid (AA) and isopimaric acid (PA); 2) phytosterols, such as stigmasterol (ST) and ß-sitosterol (BT); (3) lupane type pentacyclic triterpenes, such as lupeol (LP); 4) oleanane type pentacyclic triterpenes, such as glycyrrhetic acid (GA) and sumaresinolic acid (SA); and 5) lanostane-type triterpenes and derivatives, such as DTA and PAA. Representative procedures for compound isolation and characterization are shown in Fig. S3–9. LP, GA, SA, PA, and AA formed spherical NPs with diameters ranging from 130 to 218 nm; other nanomaterials formed nanorods with a diameter of ~70 nm and lengths of ~400 nm (Fig. 3(a)). All NPs exhibited negatively charged surfaces with zeta potential ranging from −18.2 mV to −25.6 mV. Paclitaxel (PTX), a MNP-derived compound that has a limited oral bioavailability [19, 20], was used as a model drug for studying oral drug delivery. We found that all of these nanomaterials were capable of encapsulating PTX. Among them, NPs consisting of GA, DTA, AA, and BT demonstrated the greatest encapsulation efficiencies ranging from50% to 68% (Fig. 3(b)). In traditional medicine, MNPs are processed and taken through oral administration. If they are the functional carriers in MNPs, NPs derived from the isolated natural nanomaterials are likely capable of mediating oral drug delivery as well (Fig. 1). To test this hypothesis, we synthesized rhodamine (Rho)-loaded NPs and administered them to mice via oral gavage. We found that NPs demonstrated varying NPs derived from the isolated natural nanomaterials are likely capable of mediating oral drug delivery as well (Fig. 1). To test this hypothesis, we synthesized rhodamine (Rho)-loaded NPs and administered them to mice via oral gavage. The oral bioavailability of NPs was determined by quantifying the levels of Rho fluorescence in the blood and calculating the area under the curve (AUC). We found that NPs demonstrated varying degrees of oral bioavailability. Among them, NPs consisting of DTA exhibited the greatest oral delivery efficiency (Fig. 3(c), Fig. S10). We evaluated the toxicity of all the NPs by determining their inhibitory effects on the growth of Caco-2 human intestinal cells. All NPs, except AA, SA, GA, and PA, exhibited favorable toxicity at the tested concentrations (Fig. 3(d), Fig. S10).
Figure 3.
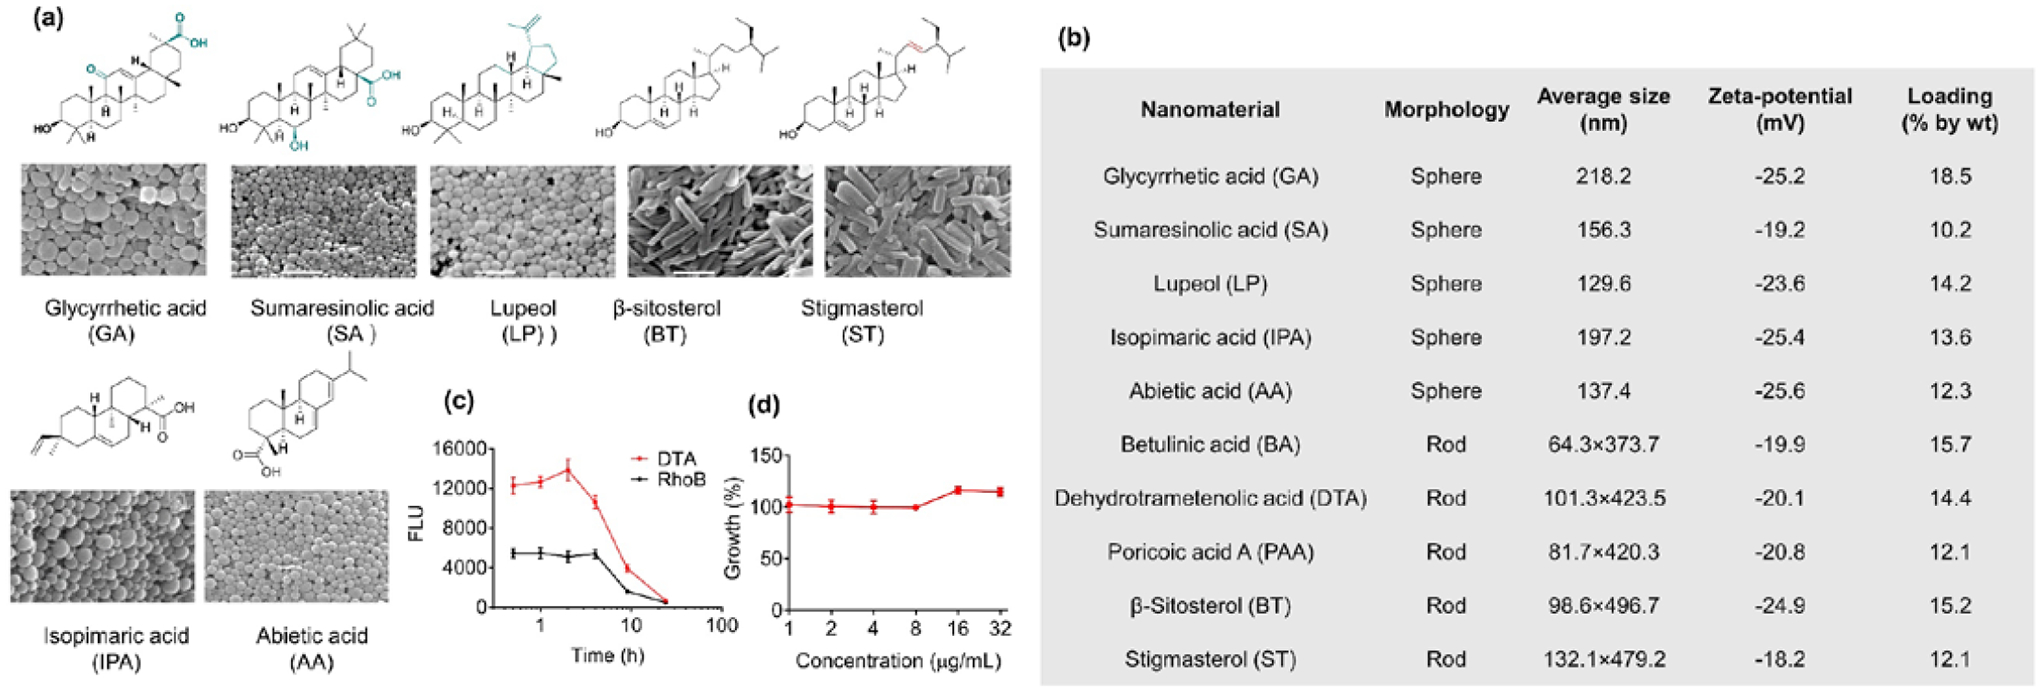
MNP screen for identification of novel nanomaterials for oral drug delivery. (a) Molecular structures of isolated nanomaterials and NPs derived from those materials. Scale bar: 500 nm. (b) Characterization of NPs derived from the isolated nanomaterials. Drug loading capacity was determined by using PTX as the model drug with 20% feed respect to the weight of nanomaterials (20 mg PTX in 100 mg indicated nanomaterial). (c) Mean levels of Rho fluorescence in the blood – time curves after oral administration of free Rho and Rho-loaded DTA NPs. (d) Growth of Caco-2 cells after treatment with DTA.
Among all the tested NPs, DTA NPs demonstrated the greatest oral bioavailability (Fig. 3(c), Fig. S10), efficient drug encapsulation (Fig. 3(b)), and limited cytotoxicity (Fig. 3(d)), and, therefore, were selected for further characterization.
3.3. DTA NPs for oral delivery of therapeutics
To confirm that DTA NPs are capable of penetrate the GI tract with intact structure; we fed mice with 5 mg DTA NPs through oral gavage. After 4 hours, mice were euthanized, and the blood was extracted. Cells in the blood were lysed in water and removed by centrifugation. The obtained supernatant was lyophilized and examined by SEM. Results in Fig. S11 revealed the presence of rod shape NPs. High-performance liquid chromatography (HPLC) analysis validated that those NPs were consisted of DTA.
We evaluated DTA NPs for oral delivery of chemotherapy drugs for cancer treatment in mouse xenografts derived from human breast cancer MDA-MB-231 cells. We first determined the biodistribution of DTA NPs after oral administration. DTA NPs were synthesized with encapsulation of IR780, a near-infrared (NIR) dye, and administered orally to tumor-bearing mice. After 24 hours, mice were euthanized. Major organs were isolated and imaged. We found that DTA NPs efficiently accumulated in tumors. Based on fluorescence quantification, the average concentration of DTA NPs in tumors was comparable to that in the liver, and was greater than those in the heart, spleen and lung (Fig. 4(a)). The efficient accumulation of DTA NPs in tumors is likely due to the enhanced permeability and retention (EPR) effect [21].As when the same amount of IR780 was given intravenously, the amount of dye enriched in tumors in mice receiving IR780- loaded DTA NPs was 4.9 times greater than that in mice receiving free IR780 (Fig. 4(b) and (c)). Next, we determined if DTA NPs could be employed for oral delivery of chemotherapy drugs by using PTX as a model. Encapsulation of PTX did not alter the morphology of DTA NPs (Fig. 4(d)). PTX-loaded DTA NPs and free PTX exhibited comparable toxicity on human breast cancer MDA-MB-231 cells in vitro (Fig. 4(e)). Exposure to pH 1.0 did not change the release of PTX from DTA NPs (Fig. 4(f)). Encapsulation via DTA NPs significantly enhanced the oral bioavailability of PTX: oral administration of PTX-loaded DTA NPs (PTX-NPs) at 25 mg/kg resulted in an AUC comparable to that of intravenous administration of free PTX at 5 mg/kg in a mixture of Cremophor EL and ethanol (Fig. 4(g), (h)). Finally, we determined the therapeutic benefit of PTX-NPs after oral administration. Compared to the saline treated control group, oral administration of PTX-NPs reduced tumor volumes by 73%. By contrast, treatments with free PTX or empty DTA NPs reduced tumor volumes by only 21% and 17%, respectively (Fig. 4(i), Fig. S12(a)). Oral administration of PTX-NPs did not induce obvious toxicity as no weight loss was observed in any treatment groups (Fig. S12(b)). Histologically, tumors from animals treated with PTX-NPs exhibited a much lower cellular mass, a lower nuclear-cytoplasmic ratio, and a marked increase in the number of apoptotic cells than tumors from control treatments (Fig. S12(c)).
Figure 4.
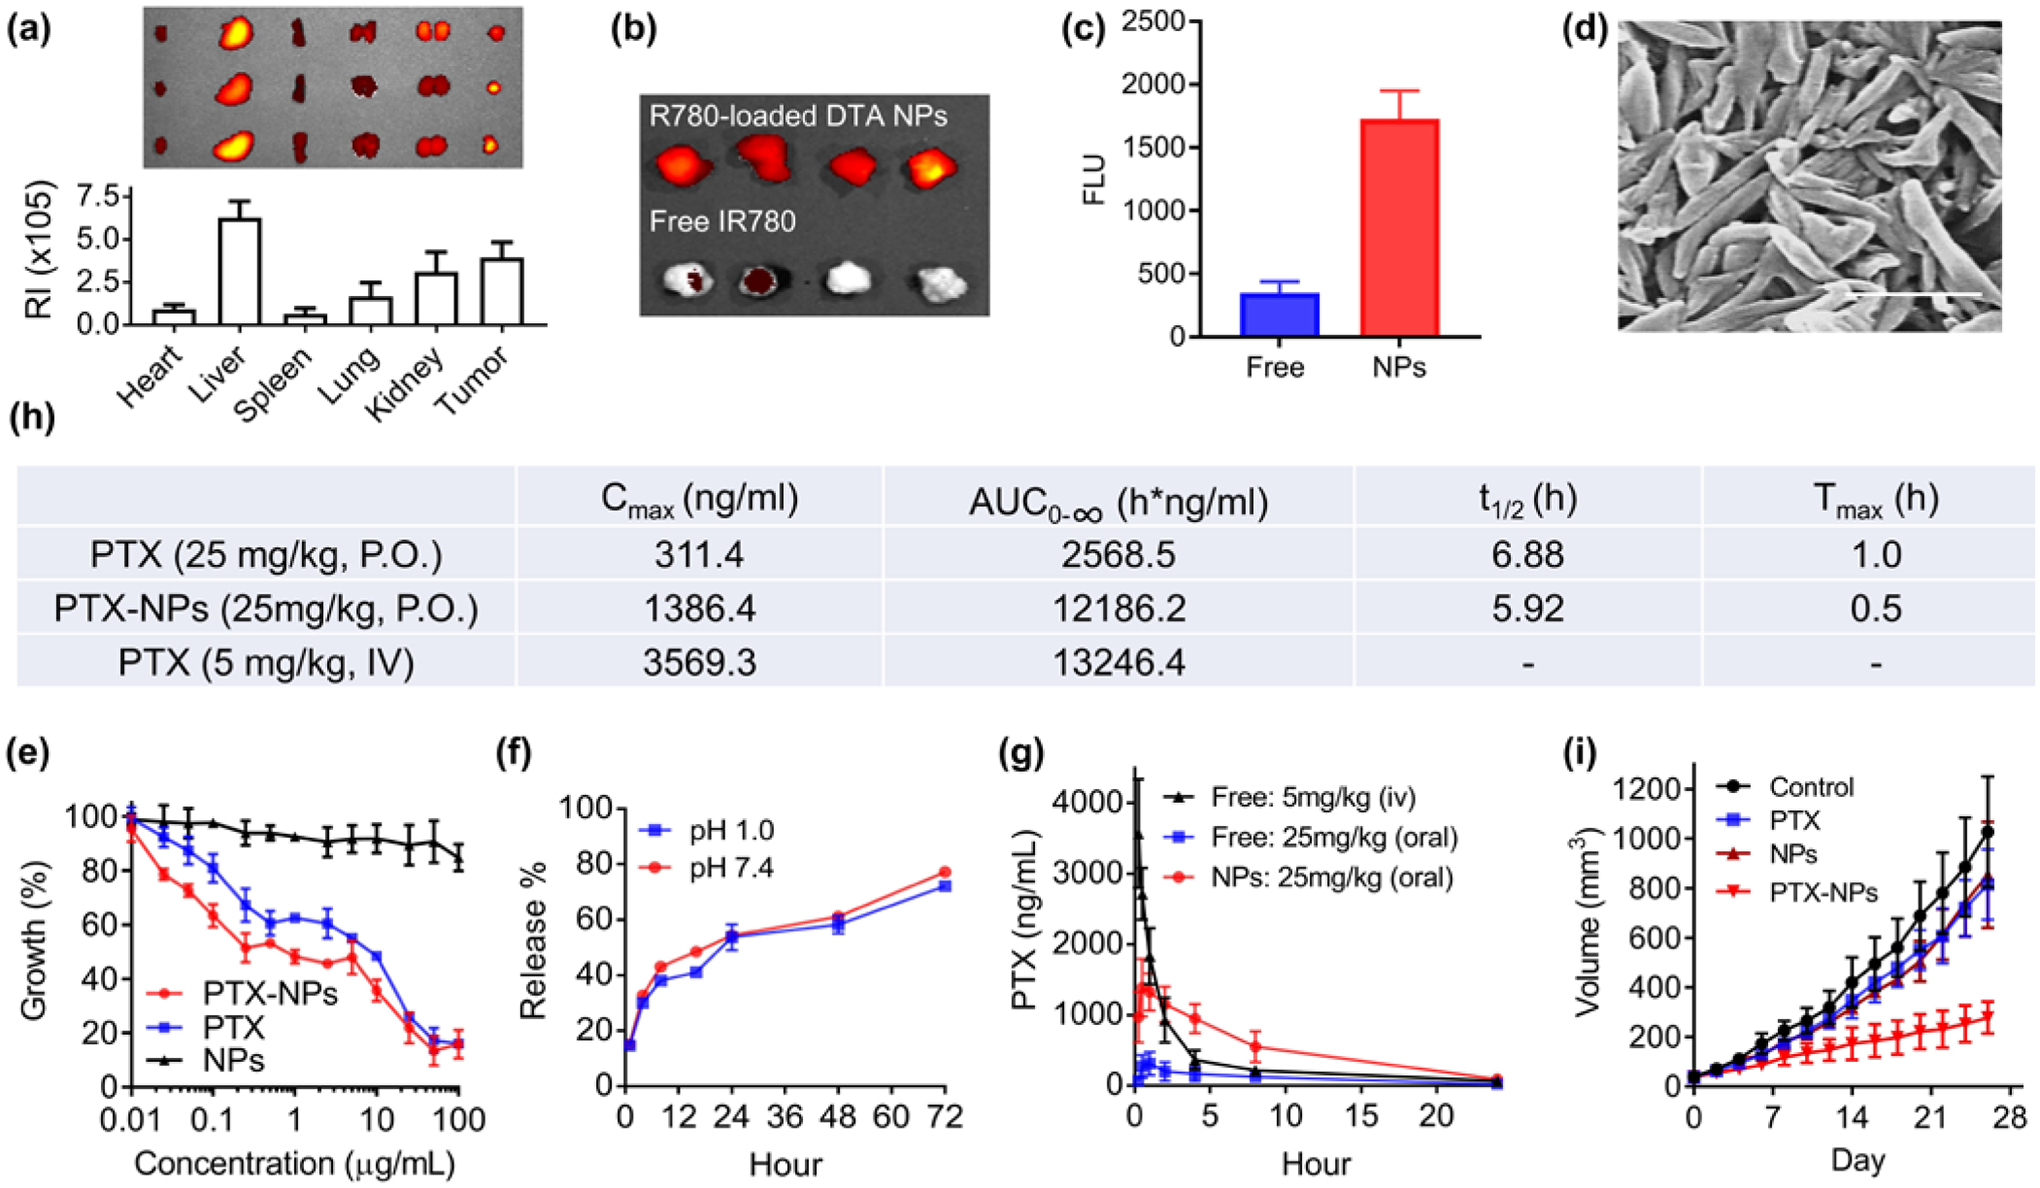
DTA NPs for oral delivery of PTX for cancer treatment. (a) Imaging and semi-quantification of DTA NPs in the indicated organs after oral administration. RI: Radiance efficiency (p sec−1cm−2sr−1uw−1cm−2), which was determined using Living Image 3.0 by dividing the fluorescence signal intensity with area of region of interest. (b) Representative fluorescence images of tumors isolated from mice receiving intravenous administration of IR-780 with and without encapsulation in DTA NPs. (c) Quantification of fluorescence intensities in mice received indicated treatments. (d) SEM characterization of PTX-loaded DTA NPs. Scale bar: 500 nm. (e) Toxicity of PTX, DTA NPs, and PTX-NPs on MDA-MB-231 cells. Cells were treated at the indicated concentrations. Growth of cells were determined 3 d after treatment by the standard MTT assay. (f) Release of PTX from NPs in PBS at the indicated pH 1.0 and pH 7.4 at 37°C. (g) Mean plasma concentration of PTX – time curves of PTX, DTA NPs, and PTX-loaded DTA NPs. (h) Pharmacokinetic parameters of PTX in the indicated formulations after oral administration. (i) Changes in tumor volume over time in mice receiving the indicated treatments (n = 6).
We further assessed if DTA NPs could deliver therapeutics beyond small molecules. We synthesized and evaluated DTA NPs with encapsulation of GLP-1, a 30-aa peptide that is a promising therapeutic for type 2 diabetes [22, 23]. Clinical translation of GLP-1 therapy has been hindered by its short half-life (< 2 min) in the circulatory system [22]. Several long-acting, engineered GLP-1-based therapeutics have received FDA approval for clinical use. However, all of them are delivered by intravenous injection, which is associated with poor patient compliance. In addition, long-acting GLP-1 formulations provide drug exposure for time periods exceeding the normal postprandial phase and thus induce significant side effects [24]. Therefore, it is ideal to administer GLP-1 orally with meals to limit the exposure time. The resulting DTA NPs, termed GLP-1-NPs, contained 6.7% GLP-1 fragment 7–37 (GLP1(7–37)) by weight and had the same morphology as the NPs without encapsulation (Fig. 5(a)). Similar to PTX-NPs, GLP-1-NPs released over 70% GLP-1(7–37) over three days in a controlled manner, and the release rate was not changed in pH 1.0 (Fig. 5(b)). GLP-1-NPs were evaluated in BALB/c mice based on the intraperitoneal (i.p.) glucose tolerance test (IPGTT). After 16 h of fasting, mice received an i.p. injection of glucose (1.5 g/kg), followed by oral delivery of GLP-1-NPs (750 μg/kg GLP-1 equivalent). We found that oral delivery of GLP-1-NPs decreased the glucose level in the blood by 38%, which is comparable to the level of reduction (31%) by subcutaneous (s.c.) injection of free GLP-1 (33 μg/kg) (Fig. 5(c), (d)). Significant decrease of glucose was not seen in free GLP-1 oral groups. Consistent with the change in blood glucose, we found that the level of insulin increased with time after oral administration of GLP-1-NPs (Fig. S12(d)). These results suggest that DTA NPs are a promising vehicle for oral delivery of GLP-1 for serum glucose regulation.
Figure 5.
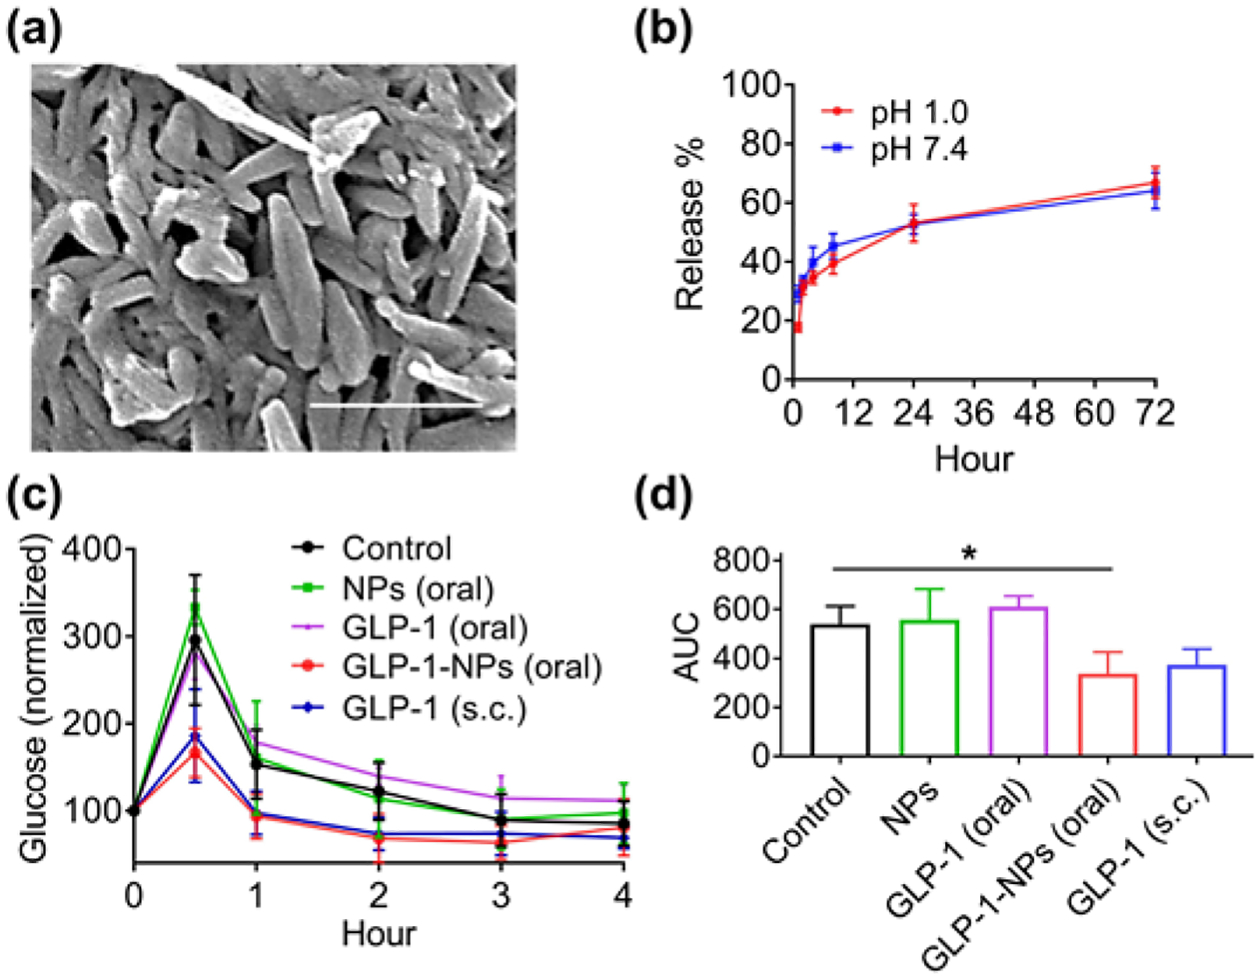
DTA NPs for oral delivery of GLP-1. (a) SEM characterization of GLP-1-NPs. Scale bar: 500 nm. (b) Release of GLP-1 from NPs in PBS at indicated pH 1.0 and pH 7.4. (c, d) Mean plasma concentration (c) and AUC (d) of glucose over time in mice receiving indicated treatments (n = 6). **: p < 0.005. Each individual mouse has a blood glucose baseline different from others. Data in c were normalized based on the reading at time 0, which was set as 100, for each mouse.
3.4. Mechanism of DTA NP assembly
To determine the molecular mechanism of DTA NP assembly, we solved the structure of DTA crystals using SXRD. DTA was crystallized in the monoclinic system, with space group at C 2 and unit cell dimensions of a = 24.1453(16) Å, b = 6.7531(3) Å, c = 33.339(2) Å, β = 92.992(6)°, V = 5428.7(6) Å3, Z = 4, and Z’ = 8. The formula and density of DTA are (C30H46O3)2•H2O and 1.135 g cm−3, respectively. The total number of independent reflections in DTA crystal was 8277, of which 6393 were observed (|F|2≥2σ|F|2). The final indices were R1 = 0.1052, wR2 = 0.2616, and S = 1.030. SXRD analysis suggests that each asymmetric unit includes two DTA molecules, which are in different conformations resulting from rotation of the single bond in the side-chain substituents (Fig. S13). Two types of classic hydrogen bonds were found in the molecular conformations. The first type was a R(22 8) hydrogen bond formed among the rings via carboxyl O2-H2…O6 and O5-H5…O3. The second type was a hydrogen bond formed between hydroxyl group O (O4, O1) and the water molecule (O7), which led to the formation of a five ring constructed lasso extend along the b-axis. Detailed structure of DTA assembly units are shown in Fig. 6(a). The lengths and angles of O–H∙∙∙O are listed in Table S2.
Figure 6.
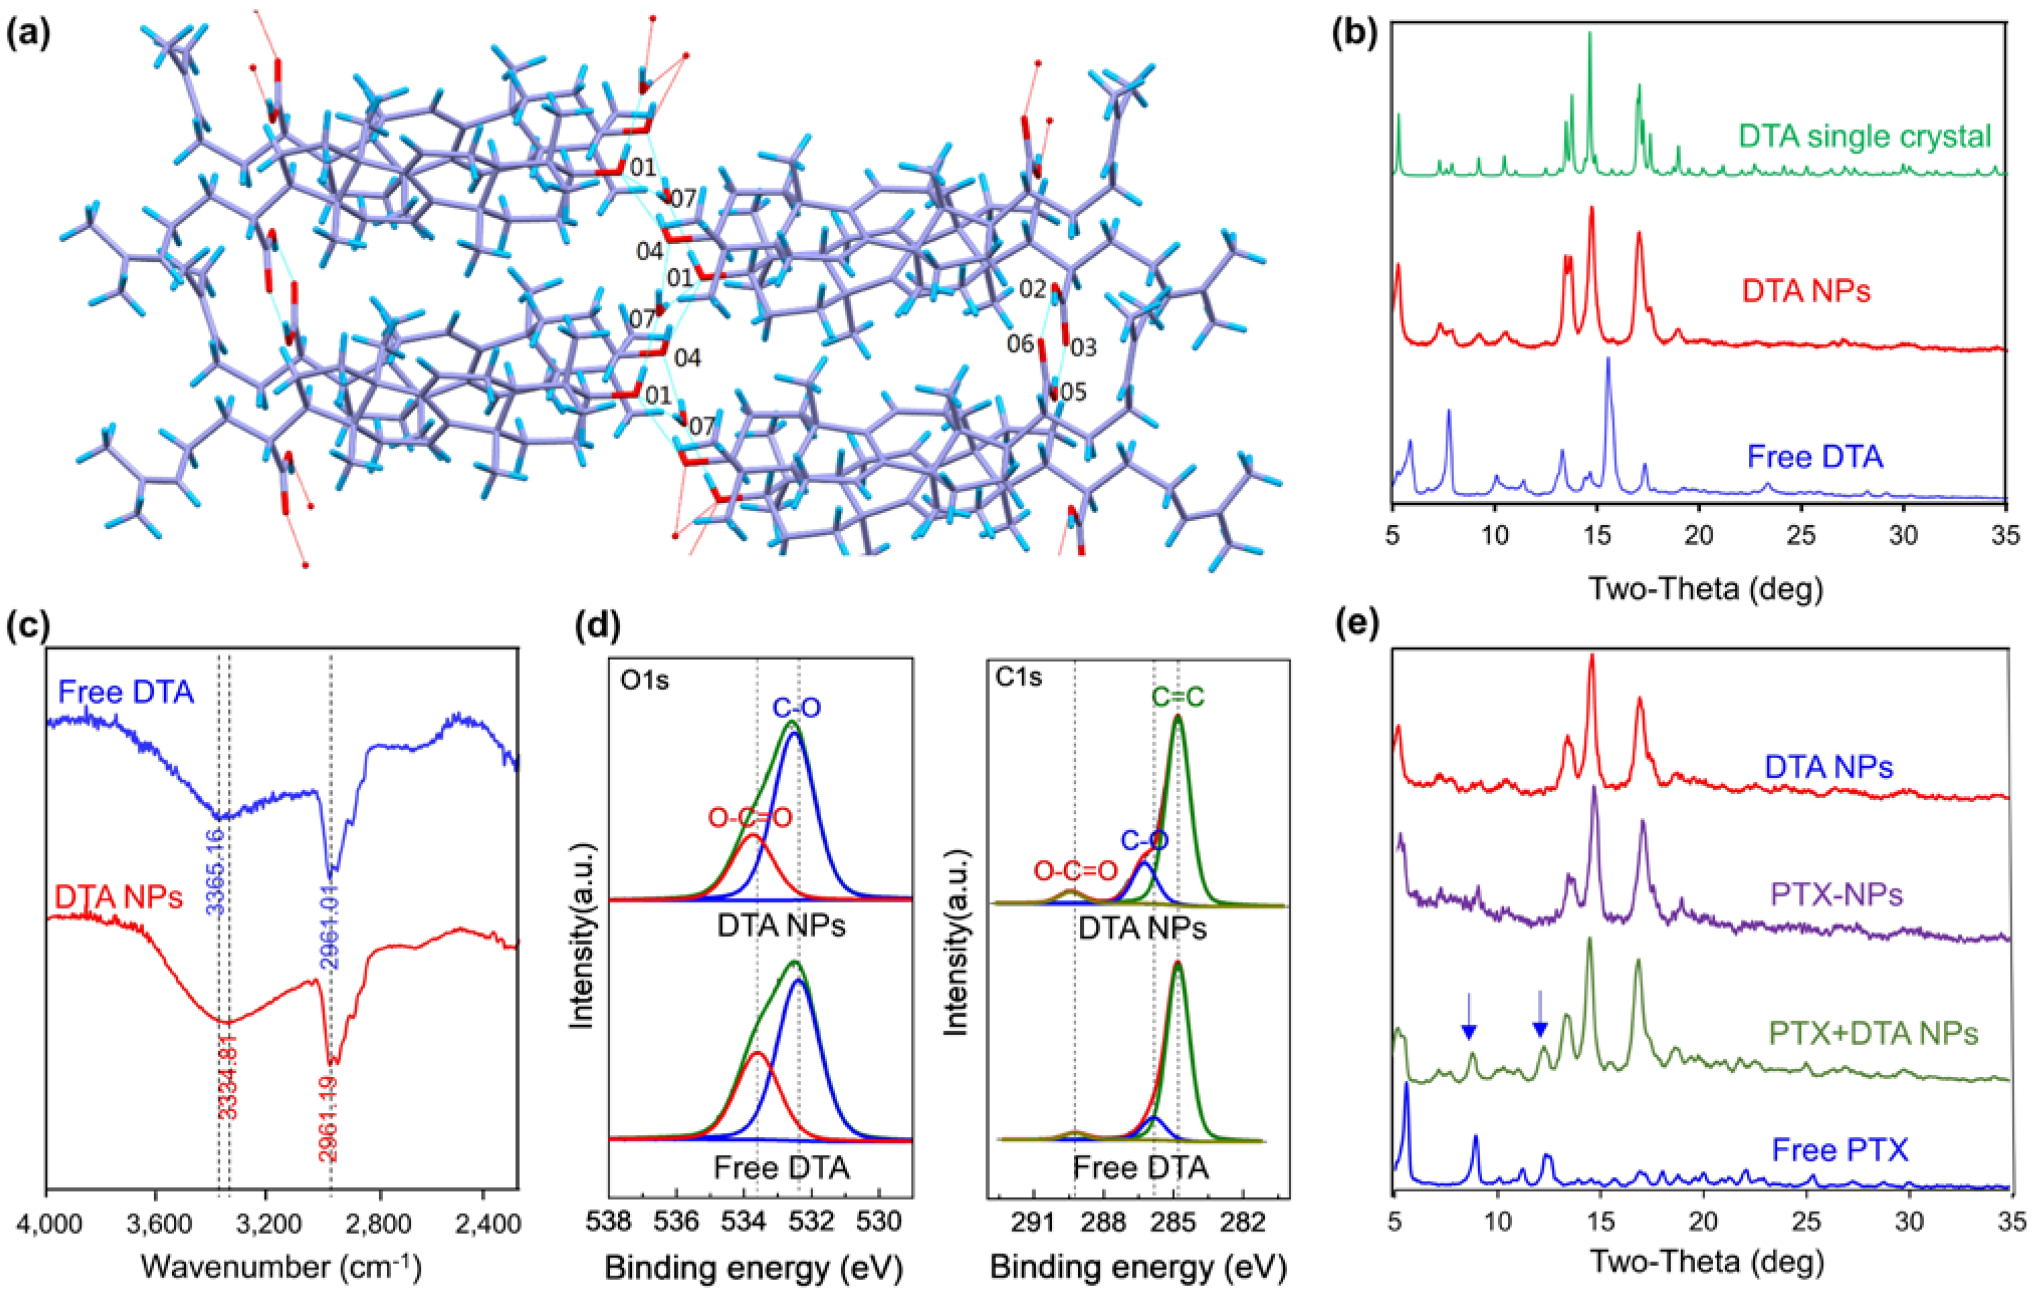
Mechanism of DTA NP assembly. (a) Capped sticks representation of DTA packing and the associated intramolecular interactions. (b) XRD patterns of DTA NPs, free DTA, and simulated XRD patterns of DTA crystals. (c) FTIR spectra of DTA NPs and free DTA. (d) C1s (left) and O1s (right) XPS spectra of DTA NPs and free DTA. (e) XRD patterns of DTA NPs, PTX- DTA NPs, PTX+DTA NPs, and free PTX.
We studied if the same molecular forces are present in DTA NPs. XRD patterns of bulk DTA powder and DTA NPs were determined, and compared to the simulated XRD patterns of a DTA single crystal. Results in Fig. 6(b) showed that the XRD patterns of DTA NPs are distinct from those of bulk DTA powder but comparable to the simulated XRD pattern of a DTA crystal. These results suggest that, unlike free DTA, DTA NPs and single crystals are in a similar phase. Therefore, the assembly of DTA NPs is likely also driven by the analogous hydrogen bonds identified in the DTA crystals. The existence of strong hydrogen bonds in DTA NPs was further confirmed by FTIR and XPS. Compared to that of bulk DTA powder, the FTIR spectrum of DTA NPs identified a significant shift of 30 cm−1 in the O-H stretching band (3365 cm−1 for bulk DTA powder vs. 3334 cm−1 for DTA NPs) (Fig. 6(c)). The shift of the O-H stretching vibration to a lower frequency is considered to be a hallmark of hydrogen bonding [25, 26]. Consistent with these findings, XPS analyses further confirmed the presence of strong hydrogen bonds within DTA NPs. Compared to those in the spectra for bulk DTA powder, both O 1s and C 1s peaks are significantly upshifted in the spectra for DTA NPs (Fig. 6(d)). The peak area percentages of C-O and O-C=O in DTA NPs were 17% and 4.8%, respectively, compared to 11% and 3% for free DTA. These changes can be attributed to analogous hydrogen bonds within DTA NPs [27].
We assessed the impact of drug encapsulation on the structure of DTA NPs. The XRD patterns for PTX-NPs were determined and compared to those for DTA NPs and DTA-NPs/PTX. DTA-NPs/PTX were prepared by mixing DTA NPs with the same amount of free PTX that was encapsulated in PTX-NPs. We found that PTX-NPs share the same XRD patterns as DTA NPs (Fig. 6(e)). Compared to those for PTX+DTA NPs, the XRD patterns for PTX-NPs lack two peaks that can be attributed to free PTX. Both DTA NPs and SPIO-loaded DTA NPs also have the same XRD patterns, which do not include the typical peak for SPIO (Fig. S14). These results suggest that encapsulation of cargo agents does not alter the structure of DTA NPs.
3.5. Mechanism of NP oral uptake
To elucidate the mechanism accounting for oral uptake, we synthesized DTA NPs with encapsulation IR780, which were administered to mice via oral gavage. After 1 h, the GI tract was isolated, extensively washed, and imaged by in vivo imaging systems (IVIS). Unlike free IR780, which was located mostly in the stomach and duodenum, the majority of DTA NPs located in the ileum. Further imaging with confocal microscopy identified a substantial quantity of DTA NPs inside the villi on the basolateral side of the epithelial cells. By contrast, mice that were treated with free dye had limited fluorescence (Fig. 7(a)). These results suggest that DTA NPs can survive in the GI tract and cross the intestinal epithelium. To confirm their stability in the GI environment, we incubated DTA NPs in simulated gastric fluid (SGF, pH 1.2) and simulated intestinal fluid (SIF, pH 6.8) for 2 h. SEM imaging showed that incubation in both SGF and SIF did not change the morphology of DTA NPs (Fig. 7(b)). To determine the molecular mechanism involved in penetration of the intestinal barrier, we investigated the apical sodium-dependent bile transporter (ASBT). We chose to study the ASBT for three reasons. First, ASBT is highly expressed on the apical membrane of enterocytes in the region where DTA NPs were identified [28, 29]. Second, the ASBT-mediated uptake system is highly efficient and is responsible for the daily transport of ~20g of bile acids [28, 29]. In addition to small molecules, ASBT was recently shown to transport nanoscale objects through a receptor-mediated transcytosis mechanism [30]. Third, DTA is structurally similar to bile acids, leading to speculation that the transport of DTA NPs might be mediated through ASBT. To characterize the role of ASBT, we overexpressed ASBT in Caco-2(Caco-2ASBT) cells. Expression of ASBT was confirmed by flow cytometry (Fig. S15). Caco-2 cells with and without ASBT overexpression were treated with Rho-loaded DTA NPs. We found that overexpression of ASBT enhanced the uptake of DTA
Figure 7.
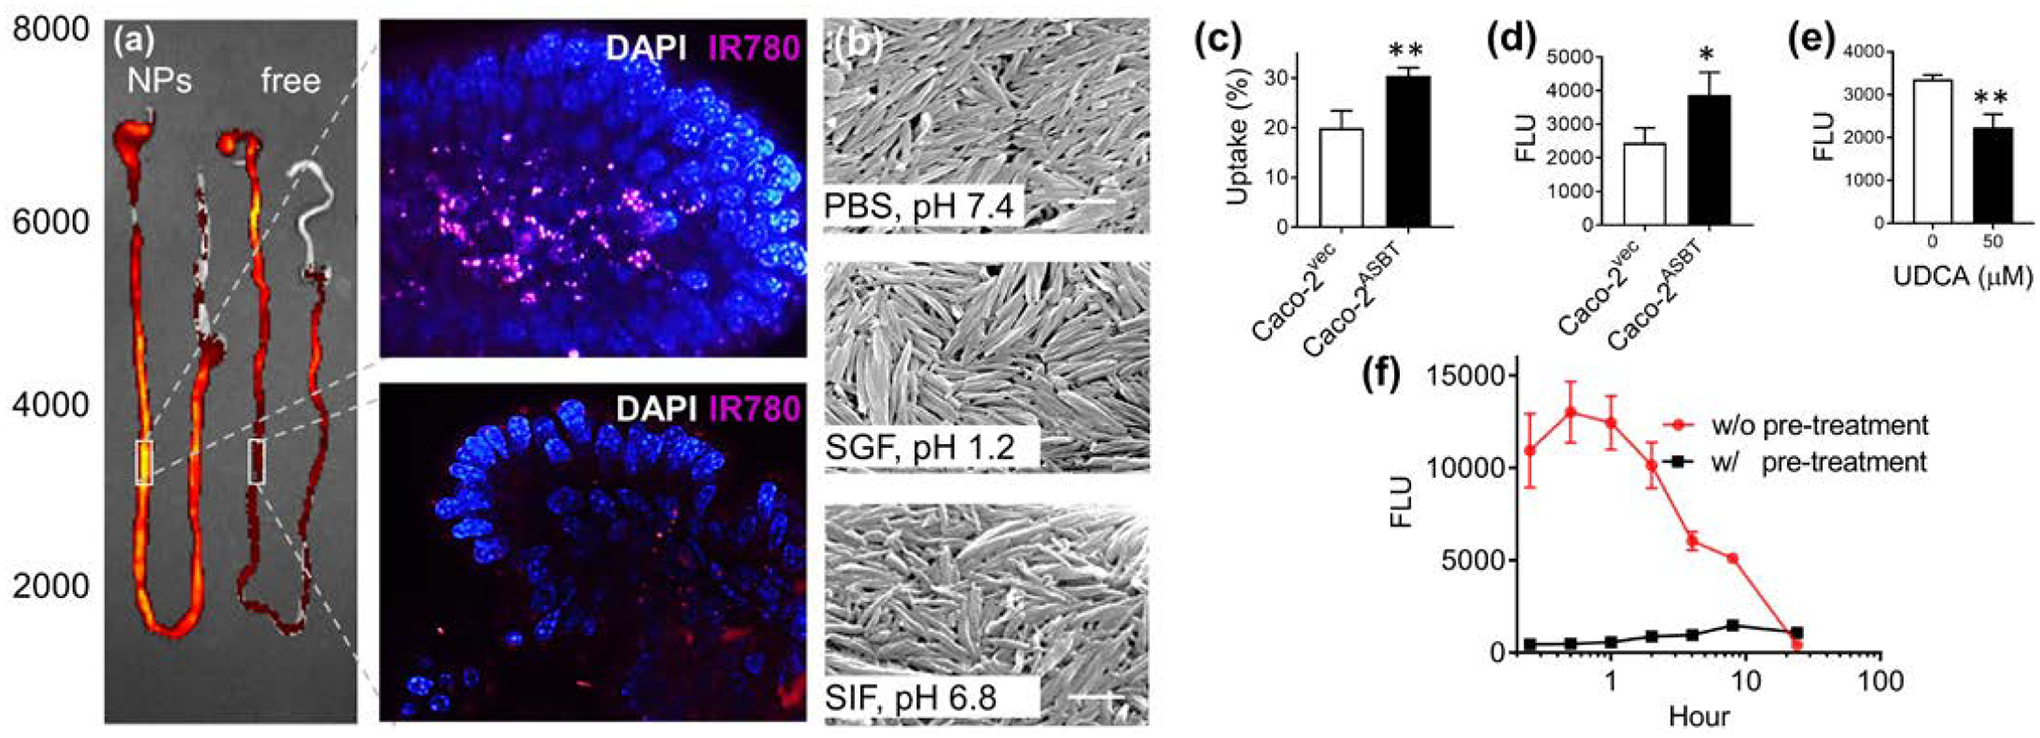
Molecular mechanism of DTA NP oral uptake. (a) Representative images of the entire GI tract (left) or the indicated intestinal regions isolated from mice received oral administration of IR780-loaded DTA NPs or free dye. Scale bar: 10 μm. (b) SEM images of the DTA NPs after incubation in the indicated medium for 2h. Scale bars: 500 nm. (c) Uptake of DTA NPs increased with ASBT overexpression as determined by flow cytometry. (d) In vitro transport of DTA NPs across monolayers of Caco-2 cell with and without ASBT overexpression. (e) In vitro transport of DTA NPs across monolayers of ASBT overexpressing Caco-2 cells with and without treatment of UDCA. (f) Pretreatment with 500 mg/kg UDCA inhibited the uptake of DTA NPs. *: p < 0.05; **: p < 0.005.
NPs by 53% (Fig. 7(c)). Consistently, in vitro transepithelial transport assays confirmed that overexpress of ASBT enhanced the penetration of NPs by 58% (Fig. 7(d)). This observation provided further evidence that ASBT mediates transcytosis of the NPs. This enhancement could be abolished by treatment with ursodeoxycholic acid (UDCA), a substrate of ASBT (Fig. 7(e)) [31]. In line with the in vitro findings, we found that pretreatment with UDCA prior to NP administration effectively reduced the penetration of DTA NPs to the circulatory system in mice (Fig. 7(f)). Taken together, these results suggest that the uptake of DTA NPs in the small intestine is mediated by the ASBT.
This study is significant in two major fronts. First, although NPs assembled from small molecules have been previously reported [32–34], discovery and application of such NPs for efficient drug encapsulation and oral delivery have not been previously reported. Considering the wide molecular diversity of MNP-derived compounds, additional nanomaterials structurally different from these discovered in this study are expected to be identified through further screen. Our finding may significantly impact drug delivery research and development through diversification of nanomaterials suitable for oral drug delivery. The simplicity and inherited multifunctionality of these single-component NPs may facilitate the development of new drug formulations and expedite their clinical translation. Second, this study suggests a new approach to modernizing traditional medicine through identification of novel drug carriers. MNPs have been a major source of drug discovery [8, 35]. However, the value of MNPs may not be limited to drug discovery. Based on our results, MNPs will likely emerge as a valuable source of nanomaterials for drug delivery.
4. Conclusion
We have identified a novel class of nanomaterials for oral drug delivery and demonstrated that DTA NPs are capable of delivering therapeutics for effective disease treatment. Due to their unprecedented efficiency in crossing the GI tract, their capacity to accommodate and deliver cargo agents of different sizes, and their formulation from natural materials with low toxicity, we anticipate that DTA NPs can serve as a ground-breaking approach for oral drug administration. Equally important, our study suggests a new direction for understanding and modernizing traditional medicine, which may lead to the expansion of possible sources of nanomaterials for drug delivery.
Supplementary Material
Acknowledgements
We are thankful to Prof. Yung-Chi Cheng for his insightful discussion. This work was supported by NIH Grant NS095817 (JZ), and 18TPA34170180 (JZ), and NSFC grants 31770614 (CM), 21233003 (LF), and 21573019 (LF).
References
- [1].Pridgen EM;Alexis F; Farokhzad OC Polymeric nanoparticle drug delivery technologies for oral delivery applications. Expert opinion on drug delivery 2015, 12, 1459–1473. [DOI] [PMC free article] [PubMed] [Google Scholar]
- [2].Pfeiffer P;Mortensen JP;Bjerregaard B;Eckhoff L;Schonnemann K;Sandberg E;Aabo K; Jakobsen A Patient preference for oral or intravenous chemotherapy: a randomised cross-over trial comparing capecitabine and Nordic fluorouracil/leucovorin in patients with colorectal cancer. Eur J Cancer 2006, 42, 2738–2743. [DOI] [PubMed] [Google Scholar]
- [3].Blanco E;Shen H; Ferrari M Principles of nanoparticle design for overcoming biological barriers to drug delivery. Nature biotechnology 2015, 33, 941–951. [DOI] [PMC free article] [PubMed] [Google Scholar]
- [4].Agrawal U;Sharma R;Gupta M; Vyas SP Is nanotechnology a boon for oral drug delivery? Drug Discov Today 2014, 19, 1530–1546. [DOI] [PubMed] [Google Scholar]
- [5].Chalasani KB;Russell-Jones GJ;Yandrapu SK;Diwan PV; Jain SK A novel vitamin B12-nanosphere conjugate carrier system for peroral delivery of insulin. Journal of controlled release : official journal of the Controlled Release Society 2007, 117, 421–429. [DOI] [PubMed] [Google Scholar]
- [6].Pridgen EM;Alexis F;Kuo TT;Levy-Nissenbaum E;Karnik R;Blumberg RS;Langer R; Farokhzad OC Transepithelial transport of Fc-targeted nanoparticles by the neonatal fc receptor for oral delivery. Sci Transl Med 2013, 5, 213ra167. [DOI] [PMC free article] [PubMed] [Google Scholar]
- [7].Farnsworth NR;Akerele O;Bingel AS;Soejarto DD; Guo Z Medicinal plants in therapy. Bulletin of the World Health Organization 1985, 63, 965–981. [PMC free article] [PubMed] [Google Scholar]
- [8].Newman DJ; Cragg GM Natural Products As Sources of New Drugs over the 30 Years from 1981 to 2010. J Nat Prod 2012, 75, 311–335. [DOI] [PMC free article] [PubMed] [Google Scholar]
- [9].Kumari A;Kumar V; Yadav SK Nanotechnology: A Tool to Enhance Therapeutic Values of Natural Plant Products. Trends in Medical Research 2012, 7, 34–42. [Google Scholar]
- [10].Sucher NJ Insights from molecular investigations of traditional Chinese herbal stroke medicines: implications for neuroprotective epilepsy therapy. Epilepsy Behav 2006, 8, 350–362. [DOI] [PubMed] [Google Scholar]
- [11].Strohbehn G;Coman D;Han L;Ragheb RR;Fahmy TM;Huttner AJ;Hyder F;Piepmeier JM;Saltzman WM; Zhou J Imaging the delivery of brain-penetrating PLGA nanoparticles in the brain using magnetic resonance. Journal of neuro-oncology 2015, 121, 441–449. [DOI] [PMC free article] [PubMed] [Google Scholar]
- [12].Chen Y;Gou X;Kong DK;Wang X;Wang J;Chen Z;Huang C; Zhou J EMMPRIN regulates tumor growth and metastasis by recruiting bone marrow-derived cells through paracrine signaling of SDF-1 and VEGF. Oncotarget 2015, 6, 32575–32585. [DOI] [PMC free article] [PubMed] [Google Scholar]
- [13].Zhou J;Wulfkuhle J;Zhang H;Gu P;Yang Y;Deng J;Margolick JB;Liotta LA;Petricoin E 3rd; Zhang Y Activation of the PTEN/mTOR/STAT3 pathway in breast cancer stem-like cells is required for viability and maintenance. Proc Natl Acad Sci U S A 2007, 104, 16158–16163. [DOI] [PMC free article] [PubMed] [Google Scholar]
- [14].Han L;Cai Q;Tian D;Kong DK;Gou X;Chen Z;Strittmatter SM;Wang Z;Sheth KN; Zhou J Targeted drug delivery to ischemic stroke via chlorotoxin-anchored, lexiscan-loaded nanoparticles. Nanomedicine 2016, 12, 1833–1842. [DOI] [PMC free article] [PubMed] [Google Scholar]
- [15].Han L;Kong DK;Zheng MQ;Murikinati S;Ma C;Yuan P;Li L;Tian D;Cai Q;Ye C;Holden D;Park JH;Gao X;Thomas JL;Grutzendler J;Carson RE;Huang Y;Piepmeier JM; Zhou J Increased Nanoparticle Delivery to Brain Tumors by Autocatalytic Priming for Improved Treatment and Imaging. ACS nano 2016, 10, 4209–4218. [DOI] [PMC free article] [PubMed] [Google Scholar]
- [16].Zhou J;Patel TR;Fu M;Bertram JP; Saltzman WM Octa-functional PLGA nanoparticles for targeted and efficient siRNA delivery to tumors. Biomaterials 2012, 33, 583–591. [DOI] [PMC free article] [PubMed] [Google Scholar]
- [17].Zhou J;Patel TR;Sirianni RW;Strohbehn G;Zheng M-Q;Duong N;Schafbauer T;Huttner AJ;Huang Y;Carson RE;Zhang Y;Sullivan DJ Jr.;Piepmeier JM; Saltzman WM Highly penetrative, drug-loaded nanocarriers improve treatment of glioblastoma. Proc Natl Acad Sci U S A 2013, 110, 11751–11756. [DOI] [PMC free article] [PubMed] [Google Scholar]
- [18].Pharmacopoeia of People’s Republic of China (Part I), B. C. M. S. P 2010.
- [19].Bardelmeijer HA;Beijnen JH;Brouwer KR;Rosing H;Nooijen WJ;Schellens JH; van Tellingen O Increased oral bioavailability of paclitaxel by GF120918 in mice through selective modulation of P-glycoprotein. Clinical cancer research : an official journal of the American Association for Cancer Research 2000, 6, 4416–4421. [PubMed] [Google Scholar]
- [20].Beijnen JH;Huizing MT;ten Bokkel Huinink WW;Veenhof CH;Vermorken JB;Giaccone G; Pinedo HM Bioanalysis, pharmacokinetics, and pharmacodynamics of the novel anticancer drug paclitaxel (Taxol). Semin Oncol 1994, 21, 53–62. [PubMed] [Google Scholar]
- [21].Jain RK Transport of molecules across tumor vasculature. Cancer Metastasis Rev 1987, 6, 559–593. [DOI] [PubMed] [Google Scholar]
- [22].Koliaki C; Doupis J Incretin-based therapy: a powerful and promising weapon in the treatment of type 2 diabetes mellitus. Diabetes Ther 2011, 2, 101–121. [DOI] [PMC free article] [PubMed] [Google Scholar]
- [23].Nauck MA;Kleine N;Orskov C;Holst JJ;Willms B; Creutzfeldt W Normalization of fasting hyperglycaemia by exogenous glucagon-like peptide 1 (7–36 amide) in type 2 (non-insulin-dependent) diabetic patients. Diabetologia 1993, 36, 741–744. [DOI] [PubMed] [Google Scholar]
- [24].Garber AJ Incretin-based therapies in the management of type 2 diabetes: rationale and reality in a managed care setting. Am J Manag Care 2010, 16, S187–194. [PubMed] [Google Scholar]
- [25].Fornaro T;Burini D;Biczysko M; Barone V Hydrogen-bonding effects on infrared spectra from anharmonic computations: uracil-water complexes and uracil dimers. J Phys Chem A 2015, 119, 4224–4236. [DOI] [PubMed] [Google Scholar]
- [26].Huggins CM; Pimentel GC Systematics of the Infrared Spectral Properties of Hydrogen Bonding Systems: Frequency Shift, Half Width and Intensity. Journal of Physical Chemistry 1956, 60, 1615–1619. [Google Scholar]
- [27].Kerber SJ;Bruckner JJ;Wozniak K;Seal S;Hardcastle S; Barr TL The nature of hydrogen in x-ray photoelectron spectroscopy: General patterns from hydroxides to hydrogen bonding. J Vac Sci Technol A 1996, 14, 1314–1320. [Google Scholar]
- [28].Stellaard F;Sackmann M;Sauerbruch T; Paumgartner G Simultaneous determination of cholic acid and chenodeoxycholic acid pool sizes and fractional turnover rates in human serum using 13C-labeled bile acids. J Lipid Res 1984, 25, 1313–1319. [PubMed] [Google Scholar]
- [29].Kuipers F;Bloks VW; Groen AK Beyond intestinal soap-bile acids in metabolic control. Nat Rev Endocrinol 2014, 10, 488–498. [DOI] [PubMed] [Google Scholar]
- [30].Al-Hilal TA;Chung SW;Alam F;Park J;Lee KE;Jeon H;Kim K;Kwon IC;Kim IS;Kim SY; Byun Y Functional transformations of bile acid transporters induced by high-affinity macromolecules. Sci Rep 2014, 4, 4163. [DOI] [PMC free article] [PubMed] [Google Scholar]
- [31].Craddock AL;Love MW;Daniel RW;Kirby LC;Walters HC;Wong MH; Dawson PA Expression and transport properties of the human ileal and renal sodium-dependent bile acid transporter. Am J Physiol 1998, 274, G157–169. [DOI] [PubMed] [Google Scholar]
- [32].Sun Z;Ma CH;Yang L;Zu YG; Zhang RR Production of Ursolic Acid Nanoparticles by Supercritical Antisolvent Precipitation. Adv Mater Res-Switz 2011, 233–235, 2210–2214. [Google Scholar]
- [33].Xia XJ;Liu HW;Lv HX;Zhang J;Zhou JP; Zhao ZY Preparation, characterization, and in vitro/vivo studies of oleanolic acid-loaded lactoferrin nanoparticles. Drug Des Dev Ther 2017, 11, 1417–1427. [DOI] [PMC free article] [PubMed] [Google Scholar]
- [34].Zhou M;Zhang X;Yang Y;Liu Z;Tian B;Jie J; Zhang X Carrier-free functionalized multidrug nanorods for synergistic cancer therapy. Biomaterials 2013, 34, 8960–8967. [DOI] [PubMed] [Google Scholar]
- [35].Cragg GM; Newman DJ Natural products: a continuing source of novel drug leads. Biochimica et biophysica acta 2013, 1830, 3670–3695. [DOI] [PMC free article] [PubMed] [Google Scholar]
Associated Data
This section collects any data citations, data availability statements, or supplementary materials included in this article.