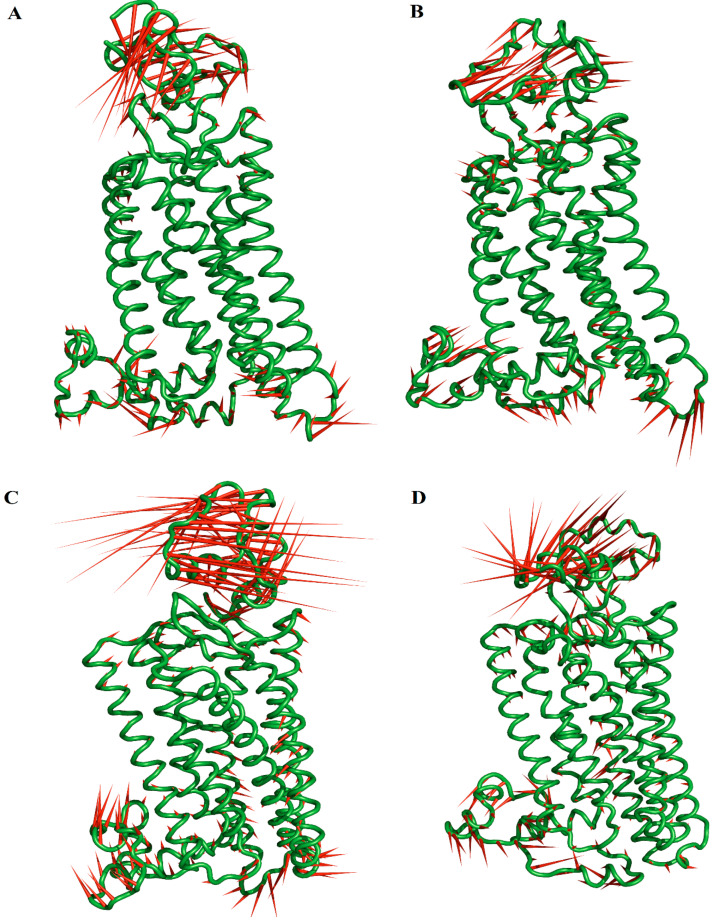
Figure 4.
Graphic representation of the two extreme projections of the free and bound hMOR systems. Graphical depiction of the two extreme projections along PC1 vs. PC2 for the free hMOR (A), hMOR–naltrexone (B), hMOR–NTXOL (C), and hMOR–HMNTXOL (D) systems. The direction and magnitude of motions are depicted as porcupine depictions.

