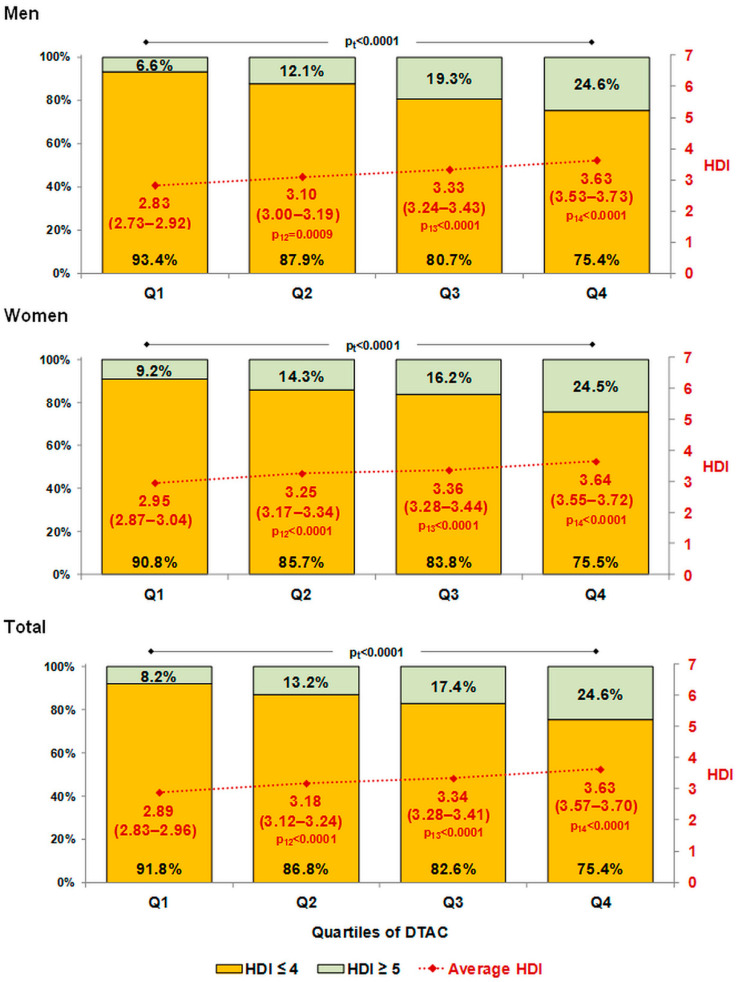
Figure 1.
Distribution of HDI score (HDI ≥ 5 vs. HDI ≤ 4) and average HDI score (95% CI) by quartiles of DTAC. Mean HDI adjusted for age in men and women and additionally for sex in the total group. pt—p-value for trend test; p12, p13, and p14—p-values for comparisons with reference quartile Q1. DTAC—dietary total antioxidant capacity; HDI—Healthy Diet Indicator. Difference between average HDI was tested using a general linear model with Tukey–Kramer adjustment for multiple comparisons, while the distribution of HDI was tested by Cochran–Armitage test for trend.

