Abstract
Transcription-coupled DNA repair (TCR) is presumed to be a minor sub-pathway of nucleotide excision repair (NER) in bacteria. Global genomic repair (GGR) is thought to perform the bulk of repair independently of transcription. TCR is also believed to be mediated exclusively by Mfd – a DNA translocase of a marginal NER phenotype. Here, we combined in cellulo crosslinking mass spectrometry with structural, biochemical, and genetic approaches to map the interactions within the TCR complex (TCRC) and to determine the actual sequence of events leading to NER in vivo. We demonstrate that RNA polymerase (RNAP) serves as the primary DNA damage sensor and platform for the recruitment of NER enzymes. UvrA and UvrD associate with RNAP continuously, forming a surveillance pre-TCRC. In response to DNA damage, pre-TCRC recruits a second UvrD monomer to form a helicase-competent UvrD dimer that promotes TCRC backtracking. The weakening of UvrD-RNAP interactions renders cells sensitive to genotoxic stress. TCRC then recruits a second UvrA molecule and UvrB to initiate the repair process. Contrary to the conventional dogma, we show that TCR accounts for a vast majority of chromosomal repair events, i.e. TCR thoroughly dominates over GGR. We also show that TCR is largely independent of Mfd. We propose that Mfd plays an indirect role in this process: it participates in removing obstructive RNAPs in front of TCRCs and also in recovering TCRCs from backtracking after repair has been completed.
Introduction
NER is the general pathway for the removal of bulky helix-distorting lesions caused by UV light and by various chemical mutagens1. In bacteria, the execution phase of NER begins when the UvrA/UvrB complex bound to the site of DNA damage recruits the UvrC endonuclease that cuts the impaired strand on both sides of the lesion. DNA polymerases then fill in the gap at the site of the damaged oligonucleotide2. An ongoing challenge is to understand how the site of damage can be promptly detected during NER and discriminated from the bulk of non-damaged DNA. It is currently assumed that UvrAB effectively detect most of the DNA lesions in vivo independently of transcription via the so-called global genomic repair (GGR) pathway. As UvrA and UvrB have only a limited capacity of scanning DNA3, NER also relies on RNA polymerase (RNAP) for speedy damage location in a process known as transcription-coupled DNA repair (TCR)4. Two opposing models of TCR have been described in bacteria5,6. The traditional Mfd model postulates that the ATP-dependent translocase Mfd removes stalled RNAP from a lesion site by terminating transcription, followed by the recruitment of UvrA to the site of damage7. However, mfd mutants display only a marginal phenotype8–12, implying that either TCR contributes little to NER (the current dogma), or that Mfd is not important for TCR.
An alternative TCR model gained traction recently as the predominant TCR pathway13,14. UvrD helicase plays a crucial role in this pathway by forcing RNAP to backtrack from the site of DNA damage, exposing the latter to NER machinery15. Transcription elongation factor NusA and bacterial alarmone ppGpp assist UvrD in this process5,8,9,15–17.
Here, we developed an integrated structure-functional approach to study NER in vivo and to address the most fundamental questions regarding this process: the mechanism of UvrABD recruitment and damage detection, the contribution of TCR to NER, and the actual role of Mfd in TCR. In particularly, we have created an automated, score-driven experimental and computational pipeline, which employs in cellulo covalent crosslinking of RNAP complexes, followed by mass spectrometry-assisted discovery of their composition and inter-protein crosslinks. The latter are used to generate unambiguous distance restraints between crosslinked amino acids, which then guide machine-driven protein-protein docking, culminating in physically realistic and biologically relevant structural models of NER complexes as they assemble in vivo.
TCR complex formation in vivo
To monitor the dynamics of the TCR complex (TCRC) formation in response to genotoxic stress in vivo we combined a high-affinity RNAP pull-down assay with quantitative Western and mass-spectrometry analysis. We constructed a panel of E. coli strains carrying a chromosomal copy of 6xHis-tagged β’ subunit of RNAP together with the NER genes individually FLAG-tagged at their native chromosomal locations (Fig. 1a). The advantage of FLAG is that the same robust anti-FLAG monoclonal antibody can be used for quantitation regardless of the target protein to be co-purified with RNAP, thus allowing for a direct comparison between pull-down experiments. In each case, we confirmed that the presence of FLAG did not sensitize cells to UV, i.e. it did not interfere with the NER functioning (Extended Data Fig. 1).
Fig. 1. Recruitment of NER enzymes and Mfd to RNAP in vivo.
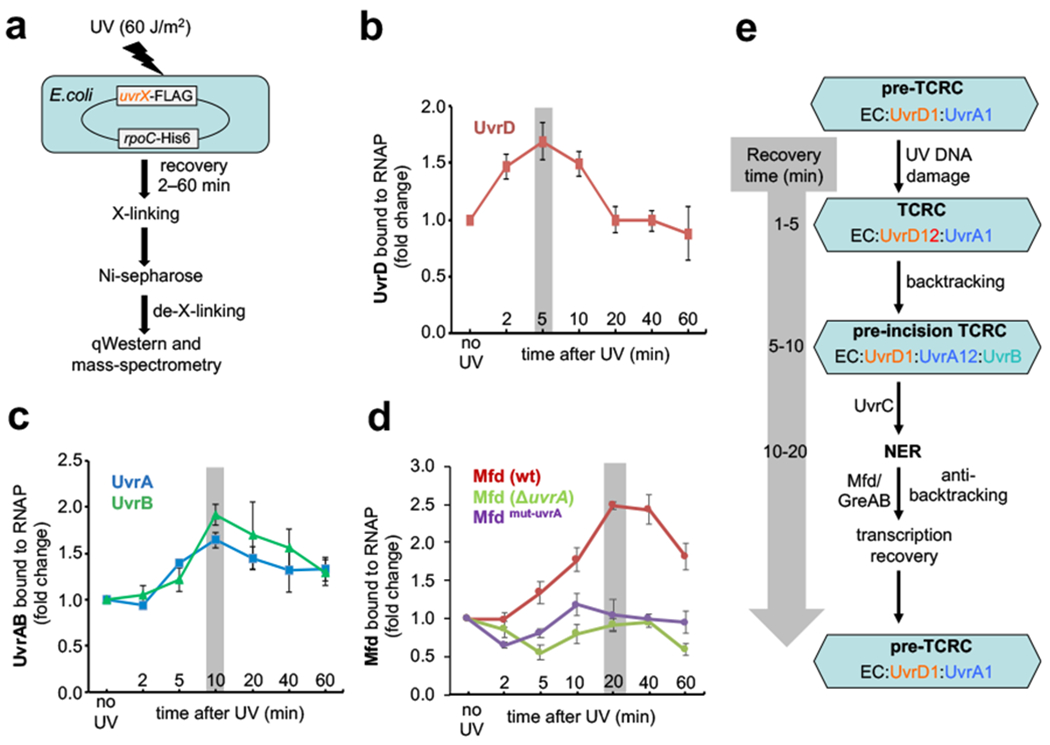
a, Experimental setup to measure the dynamics of UvrABD and Mfd recruitment to RNAP using chromosomal FLAG-tagged UvrABD or Mfd and His6-tagged RNAP. All strains behave as the wild type in UV irradiation tests (Extended Data Fig. 1). b, Relative change in the UvrD binding to RNAP during a recovery from UV irradiation. Gray bar marks the highest level of UvrD recruitment, which occurs at 5 min post-UV. c, Relative change in the UvrA and UvrB binding to RNAP during a recovery from UV irradiation. Gray bar marks the highest level of UvrAB recruitment, which occurs at 10 min post-UV. d, Relative change in the Mfd binding to RNAP during a recovery from UV irradiation in uvrA-proficient (wt) and uvrA-deficient (ΔuvrA) cells. Gray bar marks the highest level of Mfd recruitment, which occurs at 20 min post-UV in wt cells. Values are means ± SD (n≥3). e, Model of E. coli TCR based on the results presented in this work (see the main text).
Exponentially growing cells were treated with formaldehyde before or shortly after UV irradiation to preserve the intracellular protein interactions, followed by RNAP affinity chromatography, complete nucleic acid digestion, washing, de-crosslinking, and qWestern (Fig. 1a). The analysis of the UvrABD signals reveals that, during the first 5 min of recovery following UV irradiation, the fraction of UvrD bound to RNAP almost doubled (Fig. 1b). It then went back to the pre-UV level over the next 15 min. The fractions of UvrA and UvrB bound to RNAP also spiked by approximately two-fold, reaching their maximum at around 10 min post-UV, followed by a gradual receding over the next 30 minutes (Fig. 1c).
A substantial fraction of UvrD and UvrA associates with RNAP prior to UV exposure, as detected by Western (Extended Data Fig. 2a), quantitative mass spectrometry (Extended Data Fig. 2b), and by in vivo crosslinking (Supplementary Table 1; see below), supporting the existence of the pre-TCRC (Fig. 1e). These results are also supported by the co-IP of RNAP with UvrA from the nucleoid fraction before and after UV18. Quantitation of the IP signals before and after UV suggests that UV triggered transient UvrD dimerization followed by the recruitment of UvrA2/UvrB to form the TCRC.
In contrast to UvrD, in which association with RNAP peaked at 5 min post-UV, the level of Mfd interacting with RNAP reached its maximum by ~20 min post-UV, i.e. by the time a substantial fraction of UvrD has been released from RNAP (Fig. 1d) and many lesions have been repaired (see below). Remarkably, this UV-stimulated Mfd recruitment depends on UvrA: the deletion of uvrA drastically diminished the amount of RNAP-Mfd species (Fig. 1d). Furthermore, the chromosomal mutations in Mfd (R165A-R181A-F185A) that specifically disrupt its interaction with UvrA, without affecting its binding to RNAP and/or DNA19, also suppressed Mfd recruitment (Fig. 1d). Thus, it appears that the pre-TCRC/TCRC (which already contain UvrA) help to recruit Mfd in vivo (Fig. 1e), not the other way around, as postulated by in vitro-based models7,20.
General architecture of the pre-TCR and TCR complexes
The in vivo pulldown results imply that RNAP serves as a platform for the assembly of TCRC (Fig. 1e). To test this hypothesis and to facilitate discovery and structural interrogation of the pre-TCRC and TCRC in vivo, before and after genotoxic stress, we have developed an experimental and computational pipeline based on mass spectrometry-assisted mapping of in cellulo inter-protein chemical crosslinking (in vivo XLMS). Briefly, E. coli cells engineered to produce His10-tagged copy of RNAP largest subunit, RpoC (rpoC::His10), were treated with cell-permeable chemical crosslinker (DSS or EDC). In vivo crosslinked RNAP complexes were purified through a combination of Ni-affinity and size exclusion chromatography (SEC), the identity of the proteins in these complexes were determined by enumerative proteomics, whereas identity of crosslinked peptides and amino acids (protein-protein crosslinks) was determined by XLMS. Output of this pipeline was a list of pairwise protein-protein interactions withing RNAP-bound complexes, expressed as unique crosslinked peptides (see Methods for details). To induce genotoxic stress, cells were treated with 4-nitroquinoline oxide (4NQO; 25 μM) for 20 min before supplementing the culture with DSS/EDC to initiate in vivo crosslinking.
We then used XLMS-guided docking (see Methods) to model pre-TCRC and TCRC structures (Fig. 2). The pre-TCRC was modeled by first docking E. coli UvrA (homology model) to E. coli elongation complex (EC) consisting of RNAP and NusA (PDB 6X6T)21. E. coli UvrD in its apo form (PDB 3LFU)22 was subsequently docked to the top EC-UvrA complexes (Fig. 2a,b; see Methods). Likewise, the TCRC was modeled by first docking UvrA1 to the EC (PDB 6X6T) then docking UvrA2 to the top solutions from the first round, and filtering to the highest satisfaction of in vivo crosslinks. Both the apo and closed forms of UvrD (PDB 2IS1)23 were separately docked to the top EC-UvrA12 models, and a dimer-assembly algorithm was developed to find the pairs of UvrD solutions with the highest satisfaction of RNAP-UvrD and UvrD-UvrD crosslinks. Finally, complexes with the highest satisfaction of in vivo crosslinks were filtered for post-docking analysis and examined for agreement with the available UvrA dimer structure (PDB 2R6F)24 and in accord with the alignment of the UvrABD DNA-binding regions with the DNA path in the EC (see Methods).
Fig. 2. Structural organization of the pre-TCR and TCR complexes in cellulo.
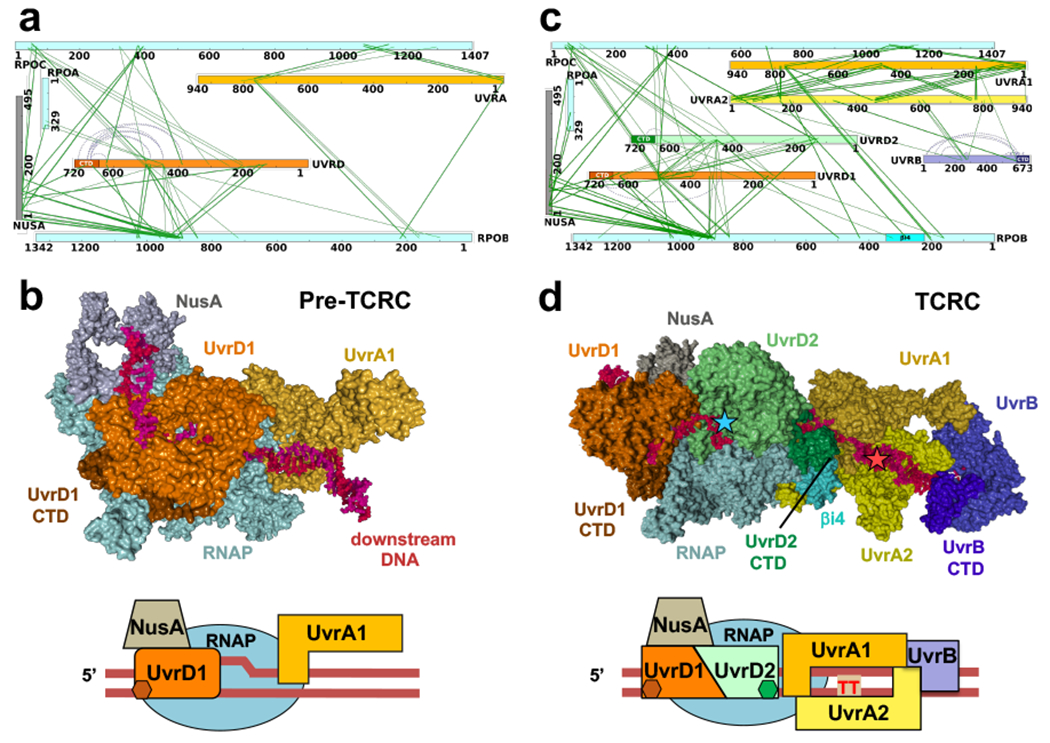
a,b, Architecture of the pre-TCRC based on in vivo and in vitro XLMS. a, Network view of highly confident non-redundant inter-protein crosslinks between RNAP subunits, NusA, UvrA, and UvrD. In vivo crosslinks were generated prior to genotoxic stress. Crosslinks were aggregated from DSS and EDC datasets (Supplementary Table 1). b, XLMS-driven pre-TCRC model. The model was built by crosslink-guided docking using PatchDock and the workflow described in Extended Data Fig. 18 and Methods. The cartoon shows the positioning of UvrAD monomers relative to the nucleic acid scaffold and RNAP. CTD of UvrD1 is shown as a brown hexagon. RNA is not shown. c,d, Architecture of the TCRC based on in vivo XLMS. c, Network view of highly confident non-redundant inter-protein crosslinks between RNAP subunits, NusA, UvrA, UvrB, and UvrD. Crosslinks were aggregated from in vitro DSS, in vivo DSS, and EDC datasets generated 20 min after 4NQO treatment (Supplementary Table 1). d, XLMS-driven TCRC model (see also Movie 1). The model was built by crosslink-guided docking using PatchDock and the workflow described in Extended Data Figs. 18, 19, and Methods. The cartoon shows the positioning of UvrABD monomers relative to the nucleic acid scaffold and a hypothetical CPD lesion (TT) in the backtracked TCRC. CTD of UvrD2 is shown as green hexagon. RNA is not shown.
In the pre-TCRC model, UvrA1 (color: gold) interacts with RNAP near the downstream DNA (Fig. 2b). The N-terminal and Signature II domains of UvrA1 (aa 600-940) form the main RNAP binding interface with the β’ jaw (aa 1149–1208) and the C-terminus clamp arm (aa 1260–1368) (crosslinks #1-3, 12-15) (Fig. 2a; Supplementary Table 1). UvrD1 (color: orange) is positioned near the upstream fork of the transcription bubble and in direct proximity to an exposed segment of the non-template strand, consistent with our previous biochemical results15. UvrD1 forms an interface with RNAP α-CTD, β flap (aa 835-935) and β’ zipper (aa 40-50) (crosslinks #55-56, 61-63, and 78-84, respectively), while its CTD is proximal to βi9 (crosslinks #72-73) (Fig. 2b; Supplementary Table 1). Additionally, it forms an interface with NusA-NTD (color: grey; crosslinks #114-118).
In the TCRC model (Fig. 2c,d; Movie 1), UvrA2 (color: yellow) is mainly bound to UvrA1, forming the same binding interface observed in the experimental dimer structure (PDB 2R6F)24 UvrA2 also interacts with RNAP, its UvrB-binding domain fits tightly within the secondary channel (crosslinks #6-9) (Fig. 2c,d; Supplementary Table 1). UvrB is bound to the distal end of the UvrA12 dimer, based on the UvrA-UvrB structural models (PDB 3FPN25; and 3UWX26; crosslinks #34-40). The orientation of UvrAB in the complex is such that the DNA damage-sensing domain of UvrB (β hairpin of the RecA-like domain)27 faces DNA in front of RNAP (Fig. 2d), exactly where the lesion is expected to reside after backtracking. UvrD2 (color: light green) forms interfaces with the β lobes and β’ clamp (aa 131–347; crosslinks #59-71 and 80-89) (Fig. 2c,d; Supplementary Table 1), in addition to the dimer interface between the 2B domains (aa 378-550) of the two UvrD monomers28 (crosslinks #93-113), while the UvrD2-CTD interacts with the RNAP βi4 domain (aa 225-345) (crosslinks #57-58) (Fig. 2c,d; Supplementary Table 1).
To provide biochemical support for the in vivo XLMS-driven structural model of TCRC, we used SEC to isolate individually purified NusA, UvrA, UvrB, and UvrD associated with RNAP. All factors co-eluted with RNAP as a major single peak (Extended Data Fig. 3a), demonstrating that the protein-protein interactions are indeed responsible for the TCRC formation. The dynamic light scattering (DLS) analysis shows that the RNAP:NusA:UvrABD complex is uniform and monodispersed. Its size, based on the Raleigh sphere approximation, corresponds to 908 kDa, i.e. to 1RNAP:1NusA:2UvrD:2UvrA:1UvrB molecules (Extended Data Fig. 3b). UvrD1 and UvrD2 can bind RNAP independently of UvrAB (Extended Data Fig. 4). In vitro XLMS and XLMS-driven docking, as applied to the reconstituted TCRC, are consistent with the results of in vivo XLMS (Extended Data Fig. 3b), suggesting that the TCRC formed in vitro effectively recapitulates essential characteristics of its in vivo counterpart.
Together, the above experiments suggest the following steps towards the TCRC formation in E. coli (Fig. 1e; Extended Data Fig. 14, Movie 2): Monomers of UvrD and UvrA bind RNAP under normal growth conditions making an omnipresent pre-TCRC. Shortly after the genotoxic stress, a second UvrD monomer (UvrD2) is recruited to the pre-TCRC, in part via its interaction with the βi4 domain of RNAP (see below). UvrD12 represents a helicase competent form of UvrD28, capable of backtracking the pre-TCRC15 and positioning UvrA1 around the lesion. Backtracking leads to a widening of the secondary channel between βi4 and β’ clamp arm29,30 facilitating UvrA2 binding. The backtracked pre-TCRC naturally recruits UvrA2 and UvrB to form the TCRC. Binding of UvrB may facilitate the release of UvrD2, as UvrB is likely to compete with the RNAP βi4 for the same CTD domain of UvrD2 (Extended Data Fig. 5), hence a rapid reversal of the RNAP-bound UvrD signal at 10 min post-UV (Fig. 1b). The UvrA12 dimer binds to DNA and UvrB tightly on damage detection, and becomes ready to load DNA on UvrB for damage verification and UvrC recruitment27 (Movie 2).
UvrD CTD-β pincer complex: structure and function
The CTD of UvrD has been implicated in UvrD binding to RNAP31–33. According to our XLMS-driven structural model (Fig. 2c), it is the allosteric UvrD monomer (UvrD2) that contacts RNAP via its CTD, whereas RNAP β pincer acts as the anchor point. To further study these interactions, we determined a 1.7 Å crystal structure of the binary complex of UvrD-CTD and RNAP β2i4 (Supplementary Table 2). The structure shows that the tudor-fold UvrD-CTD docks into a V-shaped cavity formed by RNAP β2 and βi4 domains, where it buries 509 Å2 of otherwise solvent-exposed surface (Fig. 3a; Extended Data Fig. 6a,b). Two antiparallel β-strands of RNAP βi4 invade into a shallow groove on the surface of UvrD-CTD and form the major interface with UvrD-CTD. Residues Ile302 and Leu309 of βi4 insert into the UvrD-CTD hydrophobic groove created by residues Phe681, Trp709, Leu710, Val711, and Tyr714; and the interaction is further strengthened by a H-bond network involving residues Asp300, Thr306, Gly307, Glu308 of UvrD-CTD and residues His678, Arg697, Lys708 of βi4 (Extended Data Fig. 6c). Mutating key interface residues impairs interaction of UvrD and RNAP in YTH and Strep-tag pull down experiments, suggesting importance of such interface for UvrD/RNAP interaction (Extended Data Fig. 6d,e). Protein sequence alignment of RNAP and UvrD from 316 non-redundant proteobacteria reveals that most interface residues are conserved (Extended Data Fig. 6f).
Fig. 3. Structure and function of the UvrD-CTD/RNAP β pincer complex.
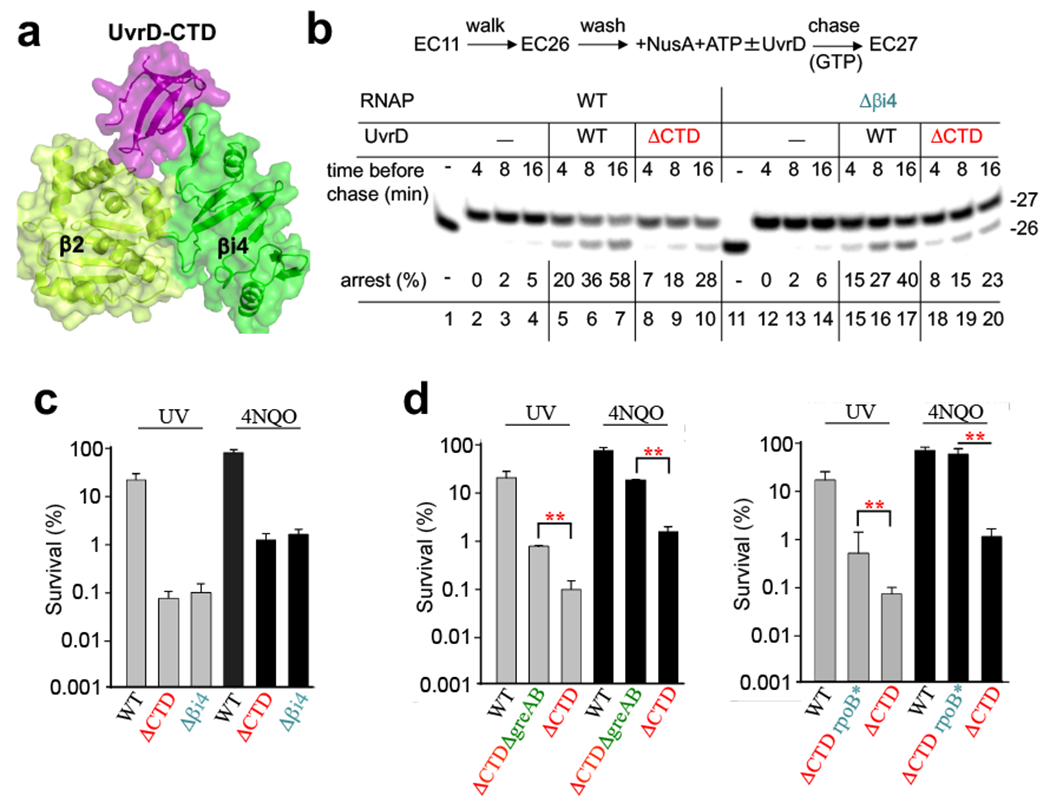
a, The crystal structure of UvrD-CTD/RNAP-β2i4 complex. The UvrD-CTD (purple), RNAP-β2 (light green), and RNAP-βi4 (green) domains were shown as cartoon and half-transparent surface. b, Deletions of the CTD of UvrD and βi4 of RNAP partially compromise UvrD-mediated backtracking (arrest formation). Plasmid-born His6-tagged EC11WT or EC11Δβi4 was walked to position 26, NusA+ATP were added followed by the addition of UvrD or UvrDΔCTD. EC26 was incubated for the indicated times prior to its chase with GTP. A fraction of inactivated EC26 is indicated as “%”. c, Chromosomal deletions of UvrD CTD and RNAP βi4 sensitize cells to UV and 4NQO. d, Deleting the anti-backtracking factors GreA and GreB (left panel), or introducing a backtracking-prone rpoB*35 allele (right panel), suppress uvrDΔCTD sensitivity to UV and 4NQO. Values are means ± SD (n≥3), **P <0.01 (Student’s t-test; equal variance).
To further validate the interaction of UvrD-CTD and RNAP βi4 observed in the crystal structure, we performed a Cys pair crosslinking experiment. Residues Glu690 of UvrD-CTD and Asn357 of RNAP βi4 are close to each other (~5 Å between Cβ atoms of the two residues) in our crystal structure, but nonessential for the complex formation (Extended Data Fig. 6b,d). Thereby, the two residues were mutated to cysteines to test whether they were able to form an intermolecular disulfide bond in UvrD/RNAP complex. The results show that a protein band (with a molecular weight close to a covalently linked RNAPβ/UvrD) appears only when RNAP (βN357C) and UvrD (E690C) were incubated together, and such band disappears when the complex was incubated in reducing condition (Extended Data Fig. 6g), indicating the formation of a disulfide bond precisely between the two modified residues and further confirming direct proximity of UvrD-CTD and RNAP βi4 in the RNAP-UvrD complex.
To demonstrate the functional role of interactions between UvrD-CTD and RNAP-βi4, we first examined the effect of the corresponding deletions on UvrD-mediated backtracking in vitro. In the runoff assay, the appearance of UvrD-mediated transcriptional pauses and disappearance of the full-length RNA products are indicative of extensive RNAP backtracking9,15. In this assay, UvrDΔCTD and RNAPΔβi4 compromised UvrD-mediated backtracking to about the same extent (Extended Data Fig. 7a). In a complementary assay, we monitored the rate of backtracking (arrest formation) of an isolated EC on a superhelical plasmid. Without UvrD, only a small fraction of EC spontaneously backtracks under specified conditions15 (Fig. 3b). UvrD accelerates this process substantially. UvrDΔCTD also promotes arrest of ECWT, but less efficiently (lanes 8-10). Likewise, UvrD promotes arrest of ECΔβi4 at the same slow rate as that of ECWT (lanes 15-17. Spontaneous inactivation of ECΔβi4 was indistinguishable from that of ECWT (lanes 2-4 and 12-14). It has been shown that the CTD deletion does not affect UvrD helicase activity significantly34. Indeed, UvrDΔCTD is even stronger ATPase than UvrDWT (Extended Data Fig. 7b). Thus, we conclude that the lack of CTD compromises UvrD ability to cause backtracking due to its failure to bind RNAP βi4, supporting the structural model (Fig. 2).
To determine whether this partial deficiency in UvrD-mediated backtracking has a physiological significance, we made chromosomal deletions of UvrD CTD and RNAP βi4. Both strains display no obvious growth defects under normal conditions (Extended Data Fig. 7c), but they became equally more sensitive to UV and 4NQO (Fig. 3c). Deleting anti-backtracking factors GreAB or introducing the backtracking-prone mutation in RNAP (rpoB*35)9 partially suppressed uvrDΔCTD phenotypes (Fig. 3d). We conclude that even a relatively mild deficiency in UvrD-mediated backtracking has a substantial impact on NER.
TCR drives global NER
In bacteria, TCR is presumed to be a sub-pathway of NER that is of limited importance. This is because Mfd-deficient cells are minimally sensitive to UV and DNA damaging agents8–12 (Extended Data Fig. 1). However, because Mfd appears to play a superficial role in TCR (Martinez et al., co-submitted)35 (Fig. 1e; discussed below), the question arises about the actual role of TCR in NER. To address this fundamental issue, we examined the impact of active transcription on genomic NER.
We first examined the effect of specific transcription inhibitor rifampicin (Rif) on NER by monitoring the removal of CPDs from genomic DNA as T4 endonuclease V (T4endoV)-sensitive sites11. Cells were briefly UV irradiated (50 J/m2) and allowed to recover. At each time point the high molecular weight (HMW) genomic DNA was isolated, treated with T4endoV, and then resolved by denaturing alkali agarose gel. The presence of CPDs (T4endoV-sensitive sites) results in the loss of HMW DNA products (Extended Data Fig. 8a).
DNA remained HMW in all cases during post-UV recovery without T4endoV or UV irradiation (Extended Data Fig. 8a). Immediately following UV irradiation, the loss of HMW DNA from wt cells after T4endoV treatment is indicative of multiple CPDs (Extended Data Fig. 8). The amount of HMW products gradually restored over time, demonstrating that at 40 min of recovery most of genomic DNA has been fully repaired (Fig. 4a; Extended Data Fig. 8a). However, a pre-treatment of cells with high Rif (750 μg/ml) almost completely abolished the CPD removal during recovery (Fig. 4a,c; Extended Data Figs. 8 and 9). A near absolute inhibition of NER by Rif was also observed ex vivo, in the nucleoid fraction from E. coli18. This drastic deficiency of NER caused by Rif was comparable to that observed in ΔuvrA and ΔuvrD cells (Fig. 4a,c; Extended Data Fig. 8a), arguing that the continuous transcription is critical for NER.
Fig. 4. Global NER fully depends on ongoing transcription and UvrD, but not Mfd.
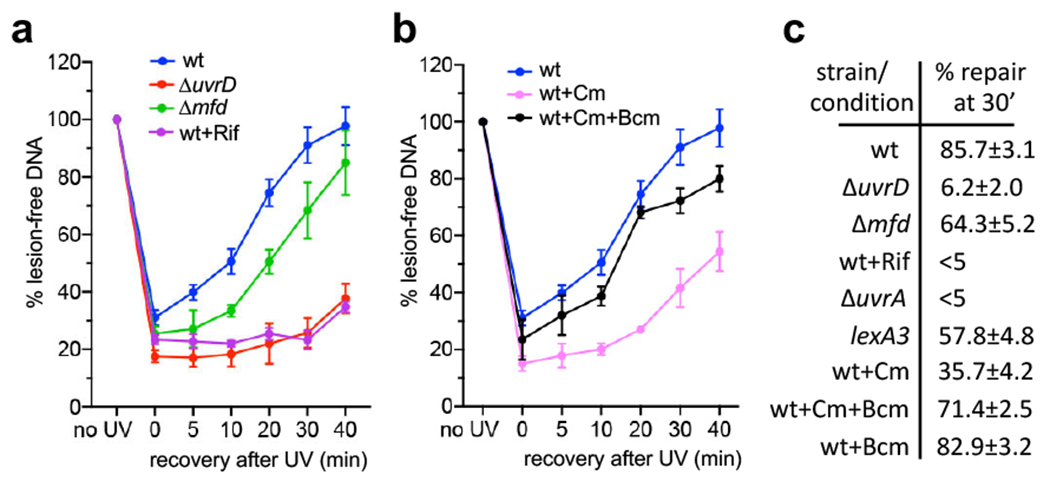
a, Transcriptional shutdown by rifampicin (Rif) abolishes NER. Wild type (wt; blue), ΔuvrD (red), and Δmfd (green) cells were briefly UV irradiated at 50 J/m2 and allowed to recover for the indicated times. Wild type cells were also pretreated with high Rif prior to UV irradiation. Rif did not decrease the cellular level of NER enzymes during the time of the experiment (Extended Data Fig. 10). Genomic DNA was isolated and treated with T4 endonuclease V (T4endoV) at the indicated times, and then resolved on alkali-agarose gels. Representative gels are shown in Extended Data Fig. 8. The percentage of repaired (lesion-free) DNA in T4endoV-treated samples is plotted for each time point relative to the untreated samples. Data are the mean ± SEM from at least three independent experiments. b, Chloramphenicol (Cm) delays NER primarily due to excessive Rho-dependent transcription termination, not due to the translational shutdown per se. Experimental setup is as in (a), except that wt cells were pretreated with Cm (pink) or Cm together with bicyclomycin (Bcm; black) prior to UV irradiation. Genomic DNA was isolated and treated with T4endoV at the indicated times, and then resolved on alkali-agarose gels. Representative gels are shown in Extended Data Fig. 8. The percentage of repaired DNA is plotted for each time point relative to the untreated samples. Data are the mean ± SEM from at least three independent experiments. c, Summary of all T4endoV results at the 30 min of a post-UV recovery. Representative gels and DNA repair plots for ΔuvrA and lexA3 mutants are shown in Extended Data Fig. 8. Numbers are the mean ± SEM from at least three independent experiments.
As UV irradiation causes a modest induction of uvr genes during the SOS response36,37, a remote possibility existed that the transcription interruption by Rif caused a sudden shortage of NER enzymes, thereby abolishing NER. We thus examined the rate of NER in lexA3 cells carrying the mutant LexA repressor that is persistently active and incapable of inducing the SOS response38. lexA3 cells displayed only a mild delay in NER (Fig. 4c; Extended Data Fig. 8a), arguing that SOS-mediated accumulation of NER enzymes is largely dispensable for NER.
Likewise, pretreating cells with a large amount of translation inhibitor chloramphenicol (Cm) to cease any de novo production of NER enzymes during the experiment, inhibited repair only partially, as compared to Rif (Fig. 4; Extended Data Fig. 8a). Moreover, most of the inhibitory effect of Cm on NER was due to excessive Rho-dependent transcription termination, not translation deficiency per se. Indeed, halting ribosomes by Cm uncouples translation from transcription, thereby triggering Rho-dependent transcription termination within the coding regions39. Accordingly, the addition of a subinhibitory amount of specific Rho inhibitor bicyclomycin (Bcm) largely restored the rate of repair in Cm-treated cells (Fig. 4b,c; Extended Data Fig. 8a).
Thus, any potential accumulation of NER enzymes during UV stress contributes only mildly to NER, and cannot account for its nearly absolute dependency on continuous transcription. Western analysis confirms that the intracellular concentration of all principle NER enzymes (UvrABCD) remains steady during Rif experiments (Extended Data Fig. 10).
In comparison to Rif, the deletion of mfd only slightly delayed NER (Fig 4a; Extended Data Fig. 8a). Taken together, the above results demonstrate that active transcription and UvrD are essential for NER, whereas Mfd is relatively unimportant.
Notably, Rho-mediated transcription termination appears to be a significant factor that modulates NER. Excessive termination compromises repair, as in the case with Cm, presumably by terminating potential pre-TCRCs and TCRCs (Martinez et al., cosubmitted)35, whereas the deficiency in transcription termination can also delay repair because the ECs that shield the lesion sites from TCRCs cannot be promptly removed from DNA40.
Transcription coupling is essential for NER
To obtain an independent direct evidence for the principal role of the transcription coupling in NER, we measured the CPD removal as a function of local transcription (Fig. 5a–e). To tightly control transcription within a region of interest (ROI) we engineered a chromosomal transcription unit driven by a highly responsive and minimally leaky tetracycline-inducible promoter (PLtet-O1)41. We engineered wt (MG1655), Δmfd, and ΔuvrD strains to express the TetR repressor and replaced a native promoter of lacZ with PLtet-O1. All strains showed a proportional transcriptional response to the increased concentrations of anhydrotetracycline (aTc), as detected by RT-qPCR (Fig. 5b). Next, we studied the kinetics of CPD removal as a function of PLtet-O1-lacZ induction during recovery from UV irradiation (Fig. 5c–e). After the indicated time intervals, genomic DNA was isolated, treated with T4endoV, and CPD density within the ROI was quantified using a semi-long-range qPCR (Fig. 5a) (see Methods)42. In the absence of aTc, cells displayed very little transcription and consistently poor CPD repair within the ROI. Increasing concentrations of aTc resulted in a progressively higher level of transcription and proportionally faster and robust CPD removal in wt and Δmfd cells (Fig. 5c,d), but not in ΔuvrD cells, where no significant repair occurred even at the highest aTc concentration (Fig. 5e). Notably, the Δmfd cells exhibited similar overall dependence on lacZ transcription in repairing CPDs as the wt cells, indicating that TCR is essentially independent of Mfd. The modest stimulation of TCR by Mfd is noticeable only at the highest level of promoter induction (Fig. 5d), supporting our observations that the Mfd contribution to NER is generally limited to the most highly transcribed genes35.
Fig. 5. Local transcription enables NER (independently of Mfd).
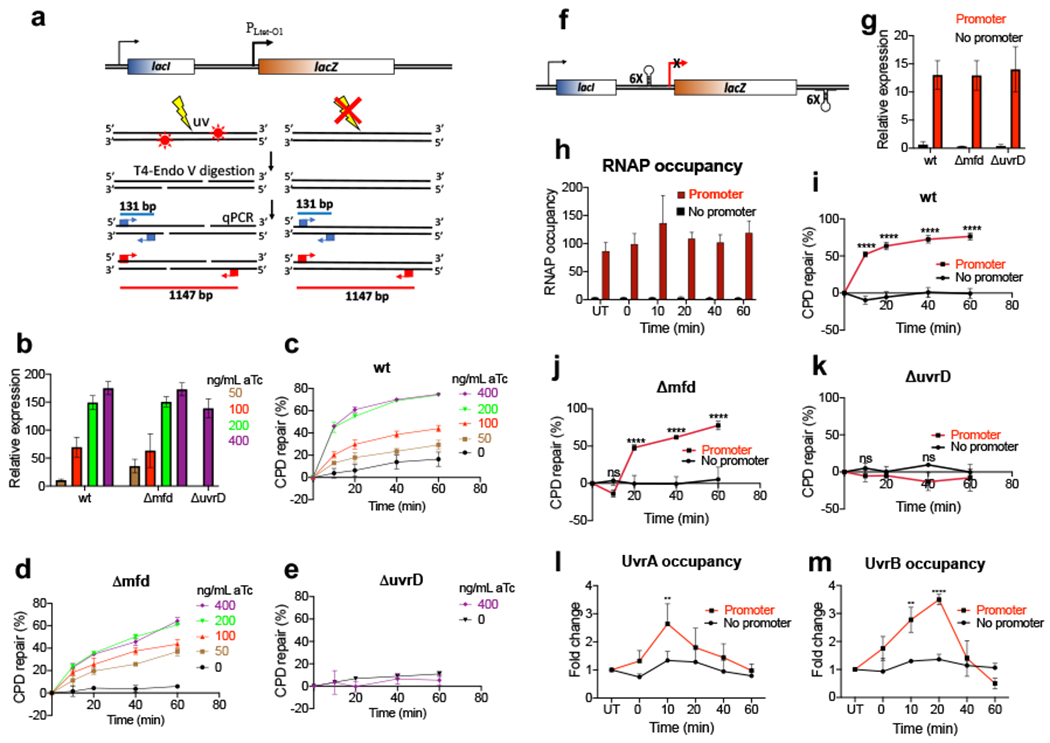
a, Schematic illustration of the semi-long-range (SLR)-qPCR assay to quantitate CPDs within the ROI (see Methods). Cells were exposed to UV followed by the isolation of genomic DNA (top). DNA was treated with T4endoV to convert CPDs to single strand breaks (SSBs) (middle). In the subsequent qPCR step the undamaged ROIs of 1147 bp (red) are successfully amplified, whereas SSBs abrogate PCR in damaged ROIs. Short fragments of 131 bp (blue) serve as a reference. Accumulating CPDs increase ΔCp of qPCR (bottom) allowing for an accurate CPD quantitation per 10 kb. b-e, The rate of local CPD repair as a function of promoter strength. b, Induction of chromosomal PLtet-O1-lacZ by the increasing concentration of anhydrotetracycline (aTc), as determined by RT-qPCR relative to a reference constitutive gene (cysG). Values are means ± SD (n = 3). c-e, Repair of CPDs within the PLtet-O1-lacZ ROI in wt (c), Δmfd (d), and ΔuvrD (e) cells. Transcription was induced by the indicated amounts of aTc as in (b) followed by UV irradiation (40 J/m2). Cells recovered in dark for the indicated time intervals followed by CPD quantitation as in (a). Values are the means ± SD (n = 3). f-k, Depriving a genomic locus of transcription abolishes its NER (irrespectively of Mfd) (see also Extended Data Fig. 11). f, Schematics of the lacZ insulator. Chromosomal lacZ, with or without its native promoter, was insulated from a possible upstream and downstream transcriptional readthrough with the intrinsic terminator cassettes. g, Expression of lacZ from the insulator upon IPTG induction, as determined by RT-qPCR. Values are means ± SD (n = 3). h, Occupancy of RNAP before (UT) and after UV irradiation, as determined by chromatin immunoprecipitation followed by qPCR (ChIP-qPCR). Cells were induced with IPTG followed by UV irradiation (40 J/m2) and recovery for the indicated time intervals. Values are means ± SD (n = 3). i-k, CPD repair within the insulator. Bulk of CPD repair in wt (i) and Δmfd (j) cells strictly depends on promoter-initiated transcription. No significant repair within the insulator with or without promoter was detected in ΔuvrD cells (k). Cells were induced with IPTG followed by UV irradiation (40 J/m2) and recovery in the dark for the indicated time intervals. CPD density was determined by SLR-qPCR as in (a) and used to calculate the percentage of repaired CPDs. Values are means ± SD (n=3), **P < 0.01, ****P < 0.0001 (Student’s t test; equal variance). l,m UvrAB recruitment to the UV-damaged DNA strictly depends on local transcription (see also Extended Data Fig. 11). Recruitment of UvrA (l) and UvrB (m) to the lacZ insulator (with or without promoter) was determined by ChIP-qPCR as in (h). Results are shown as a fold change in the occupancy of UvrAB within the insulator following UV irradiation. **P < 0.01, ****P < 0.0001 (Student’s t test; equal variance).
As some marginal NER could still be detected without aTc (Fig. 5c), we wondered if this residual repair were coupled to background transcription, or were the result of genuine, albeit highly inefficient, GGR. To address this point, we engineered chromosomal transcriptional insulators designed to devoid an ROI of any potential transcription. To prevent a possible transcriptional readthrough from upstream or downstream genes, a cluster of strong intrinsic terminators was engineered to flank an ROI on both sides (Fig. 5f). The lacZ insulator was either driven by a cognate IPTG-inducible promoter (lacp::lacZ) or deprived of transcription due to promoter deletion (Δlacp::lacZ) (Fig. 5f). This native insulator was engineered in wt, Δmfd, and ΔuvrD cells. IPTG induction resulted in robust transcription within the lacp::lacZ insulator, but a complete lack of it in the case of Δlacp::lacZ insulator in all three strains (Fig. 5g,h). Next, all cells were induced by IPTG followed by UV irradiation and CPD detection (as in Fig. 5a). WT and Δmfd cells displayed fast repair of UV photoproducts within the IPTG-activated lacp::lacZ insulator, but not even residual repair within the Δlacp::lacZ insulator (Fig. 5i,j). ΔuvrD cells lacked repair within the insulator irrespective of its transcription status (Fig. 5k). These results demonstrate that essentially all NER is coupled to transcription within this ROI, and that Mfd has no significant role in this process.
To generalize these results, we constructed two more insulators in different chromosomal locations (tam and nupG) using an mCherry cassette driven by the lacZ promoter or lacking a promoter sequence (Extended Data Fig. 11). The choice of these loci was based on their positional effect on transcription43: a fully activated tam-mCherry insulator exhibited weaker transcription and lower RNAP occupancy than a nupG-mCherry insulator (Extended Data Fig. 11b–d), thus allowing for a direct comparison of the impact of transcription on NER between the two insulators. As with the lacZ insulator, CPD repair occurred only when transcription was allowed into the tam-mCherry or nupG-mCherry insulators (Extended Data Fig. 11e,f). Notably, the rate of repair was significantly faster within nupG-mCherry than tam-mCherry, i.e. proportional to the relative transcription efficiency between the two insulators.
Next, we examined the effects of local transcription on NER of DNA lesions other than CPDs (Extended Data Fig. 12). To this end, wt and Δmfd cells were challenged with UV-C, 4-NQO, NFZ, or cisplatin. UV-C produces 75% CPDs and 25% 6-4PPs44; 4-NQO, NFZ, and cisplatin generate a wide range of bulky NER substrates8,45. To monitor repair of all these diverse types of lesions we utilized SLR-qPCR as a direct probe for genomic integrity (see Methods). The lack of local transcription resulted in near absolute repair deficiency for UV-C, 4-NQO, and NFZ lesions in both wt and Δmfd cells (Extended Data Fig. 12). A fraction of cisplatin adducts was repaired independently of transcription, possibly due to multiple recombination-based pathways that repair cisplatin adducts in parallel with NER46. The contribution of Mfd to TCR in all cases was relatively small (Extended Data Fig. 12). We conclude that Mfd-independent TCR is responsible for a vast majority of NER events irrespectively of the type of NER substrates.
Taken together, these results demonstrate that the local transcription is indispensable for NER, and that the rate of repair within a chromosomal locus directly proportional to its rate of transcription.
An apparent requirement for the transcribing RNAP in NER implies that without ongoing local transcription there is limited, if any, specific recruitment of UvrAB to DNA lesions in vivo. To test this conjecture, we performed chromatin immunoprecipitation coupled with quantitative PCR (ChIP-qPCR) to determine DNA association of UvrAB as a function of local transcription after UV stress. As expected, we detect a robust RNAP signal (β subunit) within all three insulators upon the IPTG induction, but only if the corresponding promoters were in place (Fig. 5h, Extended Data Fig. 11c,d); essentially no RNAP signal within the ROIs occurred without promoters. In the wt and Δmfd cells, we observe similarly significant enrichment of UvrAB within the insulators following UV irradiation (Fig. 5l,m and Extended Data Figs. 11g–j and 13). UvrA and UvrB reached their respective peaks at approximately 10- and 20-min post UV, suggesting a sequential recruitment. No enrichment of UvrA or UvrB over the background of untreated cells was evident within any of the insulators lacking their promoter (Fig. 5l,m and Extended Data Figs. 11g–j and 13). Thus, UvrAB recruitment to damaged DNA strictly depends on local transcription, regardless of Mfd.
New principles of TCR
The model of NER we formulate here deviates substantially from the traditional model that separates it into GGR and TCR, i.e. the major (transcription-independent) and minor (transcription-dependent) sub-pathways, respectively, based on their relative contribution to NER in bacteria. We introduce the concept of RNAP scaffolding for the assembly of NER complexes in vivo, in which a dedicated subpopulation of transcribing RNAPs carrying UvrA and UvrD continuously scouts genomic DNA for bulky lesions. Such pre-TCRC complexes stalled at damage sites can be rapidly converted to a TCRC capable of initiating NER (Extended Data Fig. 14; Movie 2; Extended Discussion). Our in vivo XLMS and RNAP pulldown experiments suggest that the majority of UvrA and UvrD molecules engage with RNAP at any given moment. The pre-TCRC/TCRC concept explains the high efficiency of NER in vivo as it relies on energy-driven 1D DNA surveillance instead of 3D diffusion-limited search for the lesions by UvrAB. The latter must be immensely complicated by intracellular molecular crowding, DNA compaction, numerous competing DNA binding proteins, and vastly excessive undamaged DNA (Extended Discussion).
As transcription coupling appears to be essential for NER in E. coli, our findings imply that the whole bacterial genome must be transcribed to ensure NER. Indeed, a phenomenon of pervasive transcription has been well established in bacteria47, and our genomic study demonstrates pervasive TCR that occurs within the antisense genome and intergenic regions (Martinez et al., co-submitted)35. Thus, a traditional approach to estimate TCR as a ratio of repair between transcribed and “non-transcribed” strands48 is inadequate, as both strands must be transcribed. In other words, uncoupling GGR from TCR may not be possible in bacteria, and it is the local transcription efficiency and processivity that determine the rate of NER.
Mfd translocase is believed to be the only TCR factor in E. coli48, even though genetic and biochemical evidence argue to the contrary5,8–11,15,16,49. Because mfd phenotype is marginal relative to other NER players8–12, this long-standing dogma inexorably pictured TCR as a minor sub-pathway of NER. We now demonstrate that TCR is the essential part of NER responsible for most DNA damage detection and recruitment of NER enzymes. We propose that Mfd influences this process indirectly and discuss an alternative Mfd model that explains its relatively modest contribution to NER (Extended Data Fig. 15 and 16; Movie 2 and 3; Extended Discussion).
The basic principles of TCR we established here for bacteria are relevant to eukaryotes as well. The Mfd paradigm has influenced the eukaryotic field for decades. However, the accumulating evidence suggests that mammalian TCR may be conceptually similar to that we described for E. coli5,14,50. Indeed, the essential NER translocases XPB and XPD may act similarly to UvrD by pulling RNAP II backwards to initiate NER, whereas CSB/Rad26 (presumed mammalian/yeast analogs of Mfd) may influence DNA repair indirectly, acting as bona fide transcription factors and chromatin remodelers51–53, and also facilitate transcription recovery post-repair by “pushing” backtracked RNAP forward5,54–60.
Methods
Strains and Plasmids
Bacterial strains, plasmids, and oligonucleotides used in this study are listed in Supplementary Tables 2 and 3. The position of the lac::mCherry insertion site is given in base pairs with respect to the coordinate system origin. Genome editing of Escherichia coli MG1655 was performed using the CRISPR/cas971. The wild-type (MG1655) strain of E. coli with C-terminally 6xHis-tagged β’ (rpoC) was used for the purification and quantitation of the RNAP associated proteins. In vivo XLMS studies were conducted using MG1655 with chromosomal copy of rpoC tagged at the C-terminus with 10xHis Ni-affinity sequence. For the quantitation of NER proteins, 3X-FLAG fusion was created at the C-terminus of UvrA, UvrB, UvrC, UvrD, and Mfd proteins in the E. coli MG1655 with 6xHis-tagged β’ using the λ-red expression plasmid system72,73. Replacement of UvrA, UvrB, UvrC, UvrD, and Mfd with 3X-FLAG fusion at the C-terminal were confirmed by PCR and Western blot analysis. All the created strains were tested for their sensitivity for genotoxic/UV stress to ensure that the tagged version functions properly. To study their specific role in the NER, the deletion construct of the uvrA::kan, uvrB::kan, uvrD::Cm, and mfd::Cm were obtained from Keio collection or created using the λ-red expression plasmid pKD46 system and used in the study. The plasmids, pCA24N and pMfd were obtained from ASKA overexpression plasmid library74. To construct the E. coli His10-tagged copy of NusA (nusA::His10; at the C-terminal), PCR with the flanking region was used and transformed into wt-E. coli with the λ-red expression plasmid system and recombination was selected by growth on LB-Kan plates. The E. coli MG1655 6xHis-tagged β’ and its derivative strains were grown in Luria–Bertani (LB) broth at 37 °C with agitation or on LB medium containing 1.5 % (w/v) agar with appropriate antibiotics. Antibiotics were used at the following concentrations μg/ ml): kanamycin (50), and chloramphenicol (25) unless otherwise specified. PCRs were carried out using Phusion DNA Polymerase following the manufacturer’s instructions. All the DNA oligonucleotides were from IDT. All the mutants generated were confirmed by PCR and sequencing (Macrogen USA).
Measuring the sensitivity to DNA damage and bicyclomycin
E. coli strains were cultured in LB medium overnight. The cultures were diluted in M9 medium and appropriate tenfold serial dilutions were spotted on LB agar plates or LB agar plates containing 25 μM bicyclomycin (BCM). This was followed by irradiation with an UV (254) lamp at a dose rate of 1 J/m2/s. The plates were incubated overnight at 37 °C. Percent survival under each condition was determined using CFU and expressed as percent difference in survival between wt and mutant cells.
Affinity purification and quantitation of in vivo RNAP-associated NER enzymes
The E. coli rpoC-6X-His and its derivative strains were grown at 37 °C in Luria–Bertani (LB) broth with agitation (250 rpm) till OD600 0.3 ± 0.05 and crosslinked with 1 % formaldehyde (methanol free, Polysciences) for 10 min at room temperature followed by neutralization with 250 mM glycine for 5 min. For UV irradiation, cells were exposed to UV (60 J/m2) and samples were recovered in dark for 0, 5, 10, 20, 40, and 60 minutes followed by formaldehyde cross-linking and neutralization. The cells were washed twice with cold 1X PBS and stored in −80 °C for further use. For the purification of the RNAP complexes, the cells were lysed in lysis buffer (500 mM NaCl; 50 mM HEPES (pH 7.5), and 5 % glycerol) with protease cocktail inhibitor using lysozyme (2 mg/ml) treatment and sonication. Cell-free extract was prepared by centrifugation at 20,800 g for 10 min at 4 °C and incubated with benzonase (25 units/ml) for 1 h at room temperature followed by overnight binding with pre-equilibrated His-Mag-Sepharose Excel beads (GE Healthcare Life Sciences) in cold room. The RNAP complexes were washed with 5X with wash buffer (lysis buffer + 10 mM Imidazole; 10 min each), eluted in the elution buffer (lysis buffer + 500 mM Imidazole).
The RNAP complexes were de-crosslinked at 95 °C for 30 min (with 1 % SDS + 5 mM beta-mercaptoethanol), and ~10 μg of proteins were resolved on a 3-12 % SDS-PAGE gradient gel, followed by transfer to PVDF membrane via electroblotting at 25 V for 1 h. The Western blotting was performed following the general instructions with some modifications as per the antibodies used. In short, the PVDF membranes were blocked with blocking buffer (5 % skim milk in PBS (pH 7.4) with 0.05% Tween-20) for 1 h at room temperature, and incubated with commercially available monoclonal anti-FLAG M2 (Sigma-Aldrich; F1804) and anti-6X His tag antibodies (Abcam; Ab9108). The fluorescent probe conjugated secondary antibodies, donkey anti-rabbit (Alexa Fluor 647, Invitrogen, A-31573) and donkey anti-mouse (Alexa Fluor 488, Invitrogen, A-21202) IgG were used, and developed with FluorChem R. The intensities of the corresponding protein bands for RNAP (β’-subunit), UvrA, UvrB, UvrD, and Mfd were measured using the ImageJ 1.51k software75. To normalize the intensities, the ratio of each time point was divided by the ratio of the control (mock treated) samples and represented as a fold change. The fold change for UvrA, UvrB, UvrD, and Mfd were calculated with no UV control and plotted as a function of the time recovered in the dark.
In vivo chemical crosslinking and label-free MS quantitation (LFQ) of proteins
The E. coli NusA-10X-His tagged (C-terminal) strain was used for chemical-crosslinking and label free quantitation (LFQ) of RNAP-bound proteins using mass spectrometry. The NusA was used for the enrichment and purification of the transcription-elongation complexes. For each sample, secondary culture was initiated from an over-night grown primary culture in a 600 mL LB-broth at 37 °C and grown to an early log-phase (OD600 0.3 ± 0.05). The cells were centrifuged and washed once with PBS and dissolved in fresh M9-media (1X M9 salt, 0.4 % glucose, 2 mM MgSO4, 0.1 mM CaCl2, and 1 mM thiamine hydrochloride, 1 mM). A heterobifunctional zero-length cross-linker, EDC (1-ethyl-3-(3-dimethylaminopropyl) carbodiimide hydrochloride, Thermo Scientific, 77149) with Sulfo-NHS (N-hydroxysulfosuccinimide, 24510) was used for cross-linking, and the casamino acid was omitted from the M9-media to increase the efficiency76–78. The cells were crosslinked with 10 mM EDC and 5 mM Sulfo-NHS followed by neutralization with 5-fold molar excess of beta-mercaptoethanol79,80. For UV recovery, the cells were exposed to UV (60 J/m2) and returned at 37 °C to allow recovery in dark for 0, 5, and 10 minutes followed by crosslinking and neutralization. The cells were centrifuged and washed twice with cold 1X-PBS and stored in −80 °C for further use. The cells were lysed, washed, and the NusA bound transcription-elongation complexes were purified as method described above for the affinity purification of RNAP complexes.
For the label-free quantitative proteomics of the ECs, 20 μg of the protein samples were reduced with 2 mM TCEP-HCL (GoldBio, TCEP2) at 37 °C for 60 min and alkylated with 5 mM iodoacetamide (Sigma) in the dark for 60 min at room temperature before overnight digestion with sequencing grade Trypin/Lys-C (Promega). The digestion reactions were stopped by mixing sample buffer (4X-2 % TFA in 20 % acetonitrile) and clarified by centrifugation at 20,800g for 10 min. Peptides were desalted using C18 spin tips (G-Biosciences, 786-930) following the manufacturer’s protocol, dried under vacuum, and dissolved in 20 μL 0.1 % formic acid in water. Approximately, 2 μg tryptic peptides were resolved on a 500 mm long EASY-Spray RPLC C18 column on the Dionex UltiMate 3000 (Thermo Scientific) liquid chromatography system using 180 min linear gradient from 96 % buffer A (0.1 % formic acid in water) to 60 % buffer B (0.1 % formic acid in acetonitrile) followed by 98 % buffer B over 5 min with a flow rate of 200 nL/ min and analyzed on an online Orbitrap Fusion Lumos mass spectrometer (Thermo Scientific). MS scans were acquired at a resolution of 120,000 between 400 and 1500 m/z with an AGC target of 4.0E5 was followed by data-dependent MS/MS scans for 5 topmost abundant peptides after HCD fragmentation. Quadrupole isolation window was set to 3 m/z, precursors with charge state 4 to 6 were selected for fragmentation with collision energy set to 32. Monoisotopic precursor selection was enabled, and a dynamic exclusion window was set to 60 s.
The raw data was processed with MetaMorpheus (Version-0.0.312) and proteins were identified by searching MS and MS/MS data of peptides against UniProtKB Escherichia coli (K12) database81. The FDR threshold was derived by analyzing the decoy database. Carbamidomethylation of C was set as fixed modification. Oxidation (M), acetyl (Protein N-term), and acetyl (K) were set as variable modifications. EDC modifications (D, E, and K) were set for GPTMD modification search. False discovery rate (FDR) thresholds were specified at 1 % for protein, peptide, and modification sites. Minimum peptide length was set at 7. All the other parameters in MetaMorpheus were set to default values. Protein abundance was calculated based on spectral protein intensity using the total protein approach, normalized to RpoC or NusA concentration82.
XLMS of RNAP-nucleated TCR complexes
In vitro crosslinking:
DSS (Proteochem) was dissolved in LC-MS oxygen-depleted anhydrous DMSO (ZerO2, Millipore Sigma), at 50 mM. Crosslinker was added to the target complex (1 mg/ml) prepared in NHS-ester non-reactive buffer (50 mM HEPES (pH 7.5), 500 mM NaCl, 2 mM MgSO4, 1 mM TCEP) to the final concentration of 0.1-0.5 mM. Reactions were performed at 25 °C in disposable inert cuvette (UVette, Eppendorf), and monitored by continuous looped dynamic light scattering measurements of polydispersity (Pd<10 %; DynaPro NanoStar, Wyatt)83. Cross-linking was quenched after 30 min incubation by addition of Tris-HCl pH 8.0) to final concentration of 5 mM.
In vivo cross-linking:
cells were grown in 0.5 X Terrific Broth (Thermo Fisher Scientific), 37 °C, with agitation (250 rpm) till OD600=0.5 and supplemented with 350 mM DSS (Proteochem) in DMSO (ZerO2, Millipore Sigma), to final concentration of 2 mM. The reaction was quenched after 45 min incubation by addition of Tris-HCl; pH 8.0 to final concentration of 5 mM. Cells were harvested by centrifugation at 4 °C, 6000 g, 5 min, and processed immediately or stored at −80 °C. When needed, 4NQO (Sigma Millipore) was added to 25 μM at OD600=0.5, and cells were incubated additional 20 min before addition of the cross-linker.
Ni-affinity purification of His10-tagged complexes:
The cells were suspended in the lysis buffer (50 mM HEPES (pH 7.5), 500 mM NaCl, 2 mM MgSO4, 5 mM ZnSO4, 1 mM TCEP, 1X ProBlock Gold Bacterial 2D, Gold Bio) and lysed by the combined action of Lysonase (Sigma Millipore) and ultrasonication. Cell-free extract was prepared by centrifugation at 4 °C, 29 500 g, 45 min, and His10-tagged proteins were purified using His Mag Sepharose Ni (GE Healthsciences), according to manufacturer protocol.
Size-exclusion chromatography of RNAP complexes:
Ni-affinity purified material was pooled and loaded onto Superose 6 Increase 10/300 column (GE Healthscience) equilibrated with SEC buffer (50 mM HEPES (pH 7.5), 500 mM NaCl, 2 mM MgSO4, 5 mM ZnSO4, 1 mM TCEP), fractionation was carried out at 0.5 ml/min rate at 4 °C. Peaks eluting between the start of fractionation and purified RNAP core (used for column calibration) were pooled and used for LC/MS-MS analysis.
Mass spectrometry and data analysis:
Samples were dialyzed against 100 mM ammonium bicarbonate, reduced with 50 mM TCEP at 60 °C for 10 min and alkylated with 50 mM iodoacetamide in the dark for 60 min at 25 °C. Digestion was carried out at 37 °C overnight with 125 ng/ml sequencing grade modified trypsin (Promega) in 30 mM ammonium bicarbonate. Reaction mix was supplemented with trifluoroacetic acid to final concentration of 0.1%. The resulting peptides were passed though C18 Spin Tips (Thermo Scientific) before elution with 40 μL of 80 % acetonitrile (ACN) in 0.1 % TFA. Eluted peptides were dried and resuspended in 20 μL 0.1 % formic acid for MS analysis. Peptides were analyzed in the Orbitrap Fusion Lumos mass spectrometer (Thermo Scientific) coupled to an EASY-nLC (Thermo Scientific) liquid chromatography system, with a 2 μm, 500 mm EASY-Spray column. The peptides were eluted over a 120-min linear gradient from 96 % buffer A (water) to 40 % buffer B (ACN), then continued to 98 % buffer B over 20 min with a flow rate of 250 nL/min. Each full MS scan (R = 60,000) was followed by 20 data-dependent MS2 (R = 15,000) with high-energy collisional dissociation (HCD) and an isolation window of 2.0 m/z. Normalized collision energy was set to 35. Precursors of charge state ≤ 3 were collected for MS2 scans in enumerative mode, precursors of charge state 4-6 were collected for MS2 scans in cross-link discovery mode (both were performed for each sample); monoisotopic precursor selection was enabled and a dynamic exclusion window was set to 30.0 s. raw files obtained in enumerative mode were analyzed by pFind3 software84 in open search mode, using entire MG1655 proteome as the search space (Uniprot UP000000625). fasta sequences of identified proteins formed the search space for cross-link discovery by pLink285; protein modifications inferred by pFind3 and comprising >0.5 % of total protein were included as the variable modifications in pLink2 search parameters. pLink2 results were filtered for FDR (<5 %), e-value (<10−3), score (<10−2), and abundance (PSMs≥5).
UV induced DNA damage and repair rates (global genomic repair assay)
For the estimation of UV induced DNA damage and repair, the wild-type E. coli, ΔuvrA, ΔuvrD, Δmfd, and lexA3 mutants from single colony were inoculated in LB-broth with appropriate antibiotics. The overnight cultures were diluted 1:100 and grown in M9 medium (1X M9 salt, 0.4 % glucose, 0.2 % casamino acids, 2 mM MgSO4, 0.1 mM CaCl2, and 1 mM thiamine hydrochloride) at 37 °C till an OD600 0.3 ± 0.05. The cells were UV irradiated (50 J/m2) and were returned at 37 °C to allow recovery in dark for 0, 5, 10, 20, 30, and 40 minutes. 1 ml of culture was collected and mixed with pre-chilled 2X NET buffer (1X NET buffer - 100 mM NaCl, 10 mM Tris; pH 8.0, 20 mM EDTA; pH 8.0) with control (mock irradiated) sample (−5 min) and store on ice. The cells were centrifuged and used for the isolation of genomic DNA or stored in −20 °C for further use.
The assay for the estimation of the UV induced DNA damage and repair was adapted from the described procedure11,86 with some modification. The genomic DNA was isolated using the Lucigen Master Pure™ Complete DNA and RNA purification kit following the manufacturer’s protocol. The isolated genomic DNA was dissolved in 35 μl of T10E1 and 15 μl of each DNA samples was treated with reaction buffer supplemented with either no enzyme or 3U of T4 Endonuclease V for 30 min at 37 °C. Both the undigested and digested genomic DNA samples were then electrophoresed on a 0.5 % alkaline agarose gels in 30 mM NaOH, 1 mM EDTA at 25 V for 18-20 h, stained and visualized with SYBR Gold. To estimate the DNA repair upon transcription inhibition, the wt cells were treated with rifampicin (750 μg/ml) for 60 min followed by UV irradiation. The cells were centrifuged to remove the rifampicin-containing M9 media before UV irradiation and rifampicin was added immediately after UV exposure. To access the change in the protein expression levels of UvrA, UvrB, UvrC, and UvrD before and after rifampicin treatment, 50 μg of the cell lysates was loaded on the SDS-PAGE and Western blot analysis and was carried out as described above. The protein expression labels before and after Rif-treatment were also confirmed by quantitative mass spectrometric analysis. To measure the effect of transcription-termination on the NER from UV exposure, the wt-cells were treated with chloramphenicol (Cm 200 μg/ml; 30 min) and bicyclomycin (BCM-25 μg/ml; 30 min) to measure the effect of transcription-termination in the UV induced-TCR. To study the effect of Mfd over-expression, the cells harboring pMfd and vector control (pCA24N) were grown to an OD600 of ~ 0.2, induced with 0.1 mM IPTG for 2 h followed by UV irradiation, and the lesion-free DNA were estimated and plotted as described above. The intensity of each high-molecular band was determined using the ImageJ software (V1.51k) and the fraction of lesion-free DNA was quantified as a ratio of the T4 Endo V digested with no enzyme treatments. To normalize for any nicks in the DNA before the treatment before UV irradiation, the ratio of each time point was divided by the ratio of the control (mock treated) sample.
Local genomic repair assay
UV irradiation of bacterial cultures was performed as reported49. An overnight culture was diluted 50-fold in Luria broth and grown at 37 °C. Cells were harvested by centrifugation at an optical density of 0.3 and resuspended in equal volume of M9 medium. A portion of the cells were spread in a petri dish and irradiated with UV-C light (254 nm) at a dose rate of 1J/m2/sec. The irradiated cells were diluted 2-fold in 2X Luria broth and incubated at 37 °C for varying times. At the end of the incubation period, cells were treated with 1X NET buffer (100 mM NaCl, 10 mM Tris [pH 8.0], 20 mM EDTA [pH 8.0]) and harvested by centrifugation followed by isolation of genomic DNA. All manipulations from UV irradiation to DNA isolation were performed in dark to prevent reversal of cyclobutane pyrimidine dimers (CPDs) by photoreactivation.
Alternately, cells resuspended in M9 medium were exposed to either 4-nitroquinoline 1-oxide (4-NQO) (0.1mM), nitrofurazone (NFZ) (0.2mM) or cisplatin (0.08mM) and incubated at 37 °C with agitation (250 rpm) for 60 minutes. The control cultures were incubated with the carrier solvent dimethylformamide (DMF). At the end of 60 minutes cells were treated with 1X NET buffer. Cells were harvested by centrifugation and washed twice with M9 medium and finally resuspended in Luria broth. Cells were allowed to recover at 37 °C and aliquots withdrawn at indicated time intervals. Cells were treated again with 1X NET buffer and collected by centrifugation. Genomic DNA was isolated using Monarch DNA isolation kit (NEB).
CPD lesion density was estimated in the lacZ loci using semi-long-range PCR(SLR-PCR)42,87–89. Briefly, 2 μg of genomic DNA was treated with 4 units of T4 endonuclease V for 1 h to convert CPDs into the DNA breaks. DNA was purified using PCR purification kit (Qiagen) and used to quantify DNA lesions using real-time PCR analysis. T4 endonuclease V treatment and subsequent column purification was omitted for samples treated with 4-NQO, NFZ, cisplatin and the experiments labeled UVC (Extended Data Fig. 11). The PCR reactions were carried out using QuantStudio 7 (Applied biosystems) in 96-well plate. PCR amplification was monitored in real time by intercalation of fluorescent dye ResoLight (Roche). Two sets of primers, yielding a short (131 bp) and a long (1147 bp) fragment provide data representative of total amount of template (an internal normalization control) and undamaged DNA respectively. The probability for a lesion formation within the short amplicon is very low. This is based on the fact that for a small amplicon the cycle threshold (Ct) values of the UV treated sample and of the undamaged control are nearly identical. In the second reaction, where a long amplicon is produced, the amplicon synthesis is more efficient in the untreated sample when compared to the UV treated sample, which is reflected in the Ct values. At every time point, the Ct values of the long amplicon were normalized to that of the short amplicon for the respective sample. Both the short and long PCR products were inside the insulated region of interest (ROI). The forward primer annealed to the transcribed strand whereas the two reverse primers (one for the short and the other for the long amplicon) annealed to the non-transcribed strand. The assay takes into consideration lesions on both strands. All primers yielded a single PCR product as determined by melt curve analysis and agarose gels. The reaction mixture contained 1X Amplitaq master mix, 0.05 X LightCycler 480 Resolight dye, 500 nM of each primer and 1 ng of template DNA in a total volume of 20 μl per well. DNA lesions per 10 kb were calculated using a modified version of 2ΔΔCt method42. We assumed that the number of CPDs at time 0 minutes to be the total number of CPDs that need to be repaired. Percent CPDs repaired at a given time point was calculated as a fraction of CPDs at time 0-minute remaining at that time. Each experiment was repeated thrice independently.
Immuno-slot-blotting for CPDs detection
To estimation the amount of UV-induced CPDs (Extended Data Fig. 9b), the overnight cultures were diluted at 1:100 and grown in M9 medium at 37 °C till an OD600 0.3 ± 0.05. The cells were UV irradiated (200 J/m2) and were returned at 37 °C to allow recovery in dark for 0, 10, 20, and 40 minutes. 5 ml of culture was collected and mixed with pre-chilled 2X NET buffer with a control (mock irradiated) sample (5 min) and stored on ice. The cells were treated with rifampicin (50 and 750 μg/ml) for 60 min. After Rif treatment, cells were centrifuged to remove the Rif containing M9 media before UV irradiation, and Rif was added immediately after UV exposure. The cells were returned to 37 °C to allow recovery in dark for 0 - 40 min. The cells were centrifuged, washed with cold PBS, and used for the isolation of genomic DNA or stored at −20 °C for further use. Genomic DNA was isolated using the Monarch® Genomic DNA Purification Kit (T3010S) following the manufacturer’s protocol and an immune-slot blot was used to measure CPDs as described90–92 with some modifications. 200 ng of DNA was denaturation by heating at 95 °C for 10 min in NaOH (400 mM) and neutralized with an equal volume of ice-cold ammonium acetate (2M). The DNA samples were loaded onto a nitrocellulose membrane (EP4HY00010, Nitro Bind, GE Water) pre-soaked in 6X SSC buffer and washed with 200 μl of 6X SSC. To immobilize the DNA onto the membranes after loading, it was kept in the slot blot apparatus under vacuum for 10 min and was baked under vacuum for 2 h at 80 °C using a gel dryer. After baking, the membranes were incubated in the blocking buffer (5 % skim milk, 0.05 % Tween-20 in PBS [pH 7.4]) overnight. The membrane was incubated for 3 h in the presence of a mouse monoclonal CPDs antibody (CAC-NM-DND-001-Clone TDM-2, Cosmo Bio) diluted 1:2500 in the blocking buffer. The membranes were washed three times with PBST (10 min each) and incubated for 1 h with a fluorescent probe conjugated secondary antibody, donkey anti-mouse IgG (Alexa Fluor 488, Invitrogen, A-21202) diluted 1: 2,500 in the blocking buffer. The membranes were washed three times with PBST (10 min each), and developed with FluorChem R. The intensities of the corresponding DNA bands were measured using the ImageJ 1.51k software75. For the loading control, the membranes were incubated with 1× SYBR Gold Nucleic Acid Gel Stain (S11494, Thermo Fisher Scientific) that was diluted in PBS on a shaker at room temperature for 30 min, washed with PBST two times (5 min each) and the SYBR Gold signals were detected in FluorChem R.
Chromatin immunoprecipitation and qPCR analysis
Chromatin immunoprecipitation followed by qPCR was used to quantify the amount of RNAP, UvrA and UvrB occupancy within the ROI following UV irradiation. E. coli cultures were subjected to UV irradiation as described earlier49. Following UV irradiation aliquots of the cultures were withdrawn at various time intervals and rapidly crosslinked using formaldehyde to a final concentration of 1 %. Cells were incubated for a further 20 min with formaldehyde at room temperature. Excess formaldehyde was quenched using glycine to a final concentration of 100 mM. Chromatin immunoprecipitation was performed as described previously93. RNAP was immunoprecipitated using antibody raised against the RNAP beta subunit (Biolegend Clone 8RB13) while anti-flag antibody (Sigma) was used to immunoprecipitate flag tagged UvrA and UvrB. Immunoprecipitated DNA was quantified using qPCR. The oligonucleotides used to amplify various ROIs are listed in Supplementary Table 3.
Quantitation of lacZ mRNA
An overnight bacterial culture was diluted 50-fold in Luria broth and grown at 37 °C with agitation (250 rpm). lacZ expression was induced with 0.1 mM IPTG for 30 minutes. At an optical density of 0.3, cells were treated with rifampicin; either 50 μg/mL for 10 mins or 750 μg/mL for 60 mins. At the end of the incubation period, cells were harvested by centrifugation followed by two washes with M9 buffer. Total RNA was extracted from the cell pellets using Direct-zol RNA Microprep kit (Zymo research). RNA was quantified and cDNA generated from 100 ng total RNA using Quantitect reverse transcription kit (Qiagen).
Absolute quantification of lacZ transcripts was performed essentially as described94 . Briefly, lacZ gene was amplified using E. coli genomic DNA as template. A 10-fold serial dilution series of lacZ PCR product ranging from 1016 to 1023 copies/μL was used to construct standard curve for lacZ. Real-time qPCR amplification was performed using Quantstudio 7 (Applied Biosystems) in a 96-well plate. The real-time qPCR mixture contained 1X SYBR Green master mix, 500 nM of each primer and 1 μL of template in a reaction volume of 20 μL. CT values from each dilution were measured in triplicates using real-time QPCR. CT values were determined for control and rifampicin treated samples. Absolute copy number/μL cDNA of lacZ were estimated for control and rifampicin treated samples by interpolation.
ATPase assay
20 nM UvrD protein (wt or ΔCTD) were mixed in 60 μL of TB100 buffer [20 mM Tris-HCl (pH=8.0), 10 mM MgCl2, 100 mM NaCl] with 10 μM polyC (Sigma) and incubated for 5 min. The ATPase reaction was started by adding 2.5 mM ATP spiked with γ-ATP P32 (1/10 by volume). 10 μL samples were removed at indicated time intervals and quenched by 0.1 mM EDTA. All reactions were carried out at 22 °C. 5 μL aliquots from each time point were loaded at PEI-TLC plates (Sigma), air-dried 30 min, and run in a vertical chromatographic chamber with 0.5 M ammonium sulfate for 2 h at room temperature. Resulting chromatogram was air-dried 30 min and exposed to a phosphor-screen. The results were visualized and quantified using ImageQuant software (GE).
In vitro transcription assays
Fig.3b:
E. coli RNAP, UvrD and NTPs were purified as described previously15. DNA templates were produced using PCR amplification with biotinylated DNA oligonucleotides (IDT) as needed and purified from an agarose gel. To measure UvrD-induced transcriptional arrest, the reaction was initiated by combining 1 pmol of RNAP (WT or Δβi4 mutant enzymes) with an equimolar amount of the DNA template (Template 4)95 in TB50 buffer (40 mM Tris-HCl; pH 8.0, 10 mM MgCl2, 50 mM NaCl, 0.003 % Igepal-60) for 5 min at 37 °C. 10 μM ApUpC RNA primer, 25 μM ATP and GTP were added for 5 min at 37 °C. Resulting EC (EC11) was immobilized on Neutravidin beads (~10 μl; Thermo Scientific™) in the presence of 1.5 mg ml−1 heparin for 5 min at room temperature. RNA was labelled with 2 μCu α-[32P]-CTP (3,000 Ci mmol−1; Perkin Elmer) for 5 min at room temperature. Resulting EC20 was washed twice with 1 ml of TB1000 (TB with 1 M NaCl), twice with 1 ml of TB100 (TB with 100 mM NaCl) and walked to position 26 with 5 μM NTPs in two steps: first, with ATP, UTP and GTP for 3 min (EC23) and then ATP and CTP for 1 min (EC26). EC23 was washed four times with 1 mL of TB100 and EC26 was washed four times with 1 mL of TB150 (TB with 150 mM NaCl). EC26 was mixed with 1 μM NusA, 1mM ATP and the sample was immediately split into three 30 μL aliquots. To test the effect of UvrD-induced backtracking, EC26 samples were mixed with 3 μM UvrD (WT or ΔCTD) or equal amount of mock buffer and incubated at room temperature for the indicated time intervals. Next, 10 μL aliquots were withdrawn and mixed with 0.1 mM UTP 5 min at room temperature. All reactions were stopped by equal volume of Stop Buffer (SB, 1×TBE buffer, 8 M Urea, 20 mM EDTA, 0.025 % xylene cyanol, 0.025 % bromophenol blue) and the products were separated at 15 % PAGE with 8 M UREA in TBE. Percentage of the transcriptional arrest was measured as a ratio between the non-extended EC26 to combined EC26 and EC27 in each lane. Image-Quant (GE) software was used for quantifications in all cases.
Extended Data Fig.7a:
To measure UvrD induced transcriptional pausing and arrests during elongation, labeled EC20 was formed with the T7A1-based 650 bp-long template DNA (Template 1)15 and WT or Δβi4 RNAP in TB150 using the same conditions as above but without immobilization on beads. Samples were split into 10 μL aliquots, mixed with 0.3 μM UvrD (WT or ΔCTD) or equal amount of mock buffer and incubated for 5 min at room temperature. Samples were chased with 0.1 mM CTP, GTP, UTP and 1 mM ATP for 5 min at 37 °C and quenched with 10 μL SB. Products were separated on 6 % PAGE with 8 M UREA in TBE. Percentage of run-off (full-length) product was calculated as a ratio between the full-length product and the sum of all other products in each lane.
XLMS-guided molecular docking
To model UvrABD (ligands), E. coli UvrA and UvrB were modeled using the homology modeling server I-TASSER69. The model with the highest C-score was selected in both cases. As the top UvrA model was based on the inactive form (PDB 3ZQJ)96, a second run was executed to generate an additional UvrA model by excluding 3ZQJ from the template list, and the top resulting model was selected. E. coli UvrDapo structure (PDB 3LFU)22 and UvrDclosed (PDB 2IS1)23 were downloaded from RCSB Protein Data Bank. For optimal rigid-body docking, UvrD models were trimmed to the first 640 residues.
To model RNAP (receptor), multiple models were tested to account for possible conformational changes. Chains corresponding to RNAP subunits (α, β, β’, and ω) and NusA were extracted from existing structures in the PDB. Only the structures of ECs were considered in modeling RNAP in the pre-TCRC, while additional transcription complexes exhibiting backtracked RNAP structural features were included for the TCRC. As NusA and ppGpp can act in tandem to modulate transcription97, ppGpp promotes clamp opening in E. coli30, and backtracking involves widening of the secondary channel98, models reflecting these structural features would best approximate likely RNAP conformation changes in the backtracked state. Finally, E. coli UvrDCTD was added to TCRC receptor models by superpositioning the UvrD-CTDβi4 crystal structure described elsewhere in this paper.
For all PDB-based models, unmodeled residues and sequence conflicts were remodeled using the loop-building function in YASARA Structure99 and refined using the built-in energy minimization protocol with the YASARA2 force field prior to docking67.
An automated crosslink-guided docking and validation pipeline was designed by expanding on the previously described modeling protocol68. To accommodate the large size of the target complexes, the following modifications have been made to the original workflow. First, the efficient rigid-body docking was performed using the surface-geometry-based package PatchDock100,101. Second, calculation of solvent accessible surface distance (SASD) for crosslink validation was performed using the parallelized algorithm Jwalk102. Third, due to the lack of a dimeric UvrD structure, a simple crosslink-based dimer-assembly component was designed to model the UvrD dimer in the TCRC, and incorporated into the pipeline as described below. The pipeline workflow is outlined in Extended Data Figs. 18 and 19.
Refined PDB models were docked with PatchDock using crosslinks as distance restraints. Cross-links were grouped into sets based on proximity of receptor residues, and the upper distance target was set to 35 Å and 23 Å for DSS and EDC-based crosslinks, respectively68, and provided as input to PatchDock with the corresponding receptor and ligand PDB files. Successful docking generates a list of spatial transformations for the ligand, ranked by geometric shape complementarity score100. Up to 35 of the top docking poses generated by each docking run were validated by calculating the SASD of cross-linked residues using Jwalk, and subsequently ranked by the number of satisfied crosslinks (SASD < 40 Å and 28 Å for DSS and EDC-based crosslinks)68, and their average SASD. Docking solutions satisfying at least 50 % of receptor-ligand crosslinks were then clustered with ProFit (V3.1)103 at an RMSD of 8 Å to filter out redundant poses.
The pre-TCRC was modeled by applying the pipeline as described to dock UvrA to the EC (PDB 6X6T)21 guided by UvrA-RNAP crosslinks, followed by docking UvrDapo guided by UvrD-RNAP crosslinks, and finally UvrDCTD guided by UvrDCTD-RNAP and UvrDCTD-UvrD crosslinks. The pre-TCRC modeling workflow is illustrated in Extended Data Fig. 20.
To model the TCRC, the first UvrA monomer was docked to the EC (PDB 6X6T)21, guided by UvrA-RNAP crosslinks, followed by docking UvrA2 to the RNAP-UvrA1 guided by UvrA-RNAP and UvrA-UvrA crosslinks. UvrDapo and UvrDclosed models were separately docked to RNAP-UvrA12 guided by UvrD-RNAP crosslinks, then combined using an additional pipeline component designed to pinpoint the UvrD12 combination with the highest satisfaction of RNAP-UvrD and UvrD-UvrD crosslinks (Extended Data Fig.14), as follows. Top scoring docked RNAP-UvrD complexes were divided into two groups based on the UvrD model used (UvrDapo or UvrDclosed). Each group was clustered using ProFit (V3.1) at 8 Å to obtain smaller sets of representative poses. Sets from the two groups were cross-matched to generate RNAP-UvrDapo-UvrDclosed complexes, and analyzed for UvrD-UvrD crosslink satisfaction and steric clashes using Jwalk and Clashscore104, respectively. Complexes with satisfied UvrD-UvrD crosslinks >2 and a Clashscore <40 were considered for manual post-docking analysis, consisting of a comparison with the available UvrA dimer structure (PDB 2R6F)24 and alignment of ligand DNA-binding regions with the DNA path in the EC. Final models were refined in explicit solvent using the built-in energy minimization protocol in YASARA Structure with the YASARA2 force field and re-analyzed with Jwalk. The TCRC modeling workflow is illustrated in Extended Data Fig. 21.
Yeast two-hybrid assay
We utilized the GAL4-based yeast two-hybrid system (MATECHMAKER GAL4 two-hybrid system3, Clontech Laboratories, Inc.) to analyze the protein-protein interaction. Yeast cells were cultured and transformed according to the handbook. The DNA fragments encoding WT/derivatives of UvrD, UvrB, and RNAP domains were cloned into the prey vector pGADT7-Rec or bait vector pGBKT7 as indicated. The bait and prey vectors were transformed into yeast Y187 cells and AH109 cells, respectively. The haploid bait colonies of strain Y187 and haploid prey colonies of AH109 were mated and in YPDA medium for 24 h, and the diploid yeast cells containing both bait and prey vectors were selected on SD (–leu, –trp) plates at 30 °C for 48 h. The colonies were inoculated into SD (–Leu, –Trp) medium and cultured at 30 °C for 24 h. The resulting cell suspensions with a series of dilution were spotted onto SD (-Leu, -Trp) and SD (-Ade, -His, -Leu, -Trp) plates and incubated at 30 °C for 4-5 days.
Strep-tag pull-down
The pull-down assays were carried out using 10xHis-tagged WT/derivatives of EcRNAP core enzyme and Strep tag II-tagged wt or derivatives of EcUvrD (Strep-UvrDs). Strep-GFP protein was used as negative control. The Strep-UvrDs and Strep-GFP were affinity-purified from E. coli transformed with pET51b-UvrD and pET51b-GFP, respectively, using Streptactin-agarose (Smart Lifesciences China, Inc.), followed by anion-exchange chromatography on a 10/100 Mono Q column. RNAP core enzyme was prepared from E. coli strain BL21(DE3) (Invitrogen, Inc.) transformed with pRL706105 using protein purification procedures described previously106. The pull-down mixture (400 μL) contains 0.6 μM Strep-UvrD and 30 μL Streptactin-agarose beads (Smart Lifesciences China, Inc.) in binding buffer (100 mM Tris-HCl; pH 8.0, 150 mM NaCl, 1 mM EDTA, 5 % glycerol, and 1 mM DTT). The mixture was incubated at 4 °C for 2 h on a rotor device, and then centrifuged at 850 g, 4 °C for 2 min. The beads were washed with 1 ml binding buffer supplemented with 0.1 % BSA (Sigma-Aldrich, Inc.) and harvested by centrifuging at 850 g, 4 °C for 2 min for three times. The beads were subsequently re-suspended with 400 μL binding buffer containing 0.4 μM EcRNAP and 0.1 % BSA, incubated at 4 °C for 3 h under rotation, and collected by centrifuging at 850 g, 4 ° C for 2 min. The beads were first washed with 1 ml binding buffer supplemented with 0.1 % BSA for three times, and second washed with 1 ml binding buffer twice. The proteins were eluted by 50 μL binding buffer containing 2.5 mM D-desthiobiotin, mixed with 12 μL SDS loading buffer, and boiled at 95 °C for 5 min, separated by SDS-PAGE.
Crystal structure determination
The E. coli RNAP β2i4 and UvrD-CTD were purified from E. coli cell carrying pET28a-TEV-EcRNAP-β2i4 and pET28a-TEV-EcUvrD-CTD plasmids, respectively. The two proteins were purified by Ni-NTA affinity chromatography, subjected to TEV protease cleavage to remove the 6xHis tag, and further purified by anion-exchange chromatography on a 16/10 Mono Q column. The RNAP-β2i4 and UvrD-CTD proteins were incubated at 4 °C at a molar ratio of 1:4 and loaded on a HiLoad 16/600 Superdex 75 pg column in 10 mM Tris-HCl; pH 8.0, 50 mM NaCl, and 1 mM DTT. The UvrD-CTD/RNAP-β2i4 complex was collected and concentrated to 10 mg/ml for screen of crystallization conditions. Cubic crystals in drops containing 1 μL protein complex and 1 μL reservoir A (0.1 M HEPES; pH 7.0, 10 % w/v polyethylene glycol 4000, 10 % (v/v) isopropanol) were transferred into reservoir solution containing 20 % glycerol (Sigma-Aldrich, Inc.), and then flash-cooled in liquid nitrogen.
Diffraction data were collected at beamline BL19U in SSRF at wavelength of 0.979 Å. The initial phase was obtained by molecular replacement using a crystal structure of EcRNAP-β2i4 as the search model (PDB code: 3LTI)107 and improved by integrating weak anomalous signal using Phaser MR-SAD in CCP4108. The initial model was automatically built by Buccaner in CCP4109 and manually adjusted in Coot110. After iterative cycles of model building in Coot and refinement by Refmac111, the final UvrD-CTD/RNAP-β2i4 model has been refined to Rwork and Rfree of 0.203 and 0.234, respectively.
The T. thermophilus UvrB-NTD and UvrD-CTD were purified from E. coli cells carrying pET28a-TEV-TtUvrD-CTD and pET28a-TEV-TtUvrB-NTD plasmids, respectively. The two proteins were purified using a procedure similar as above. T. thermophilus UvrB-NTD and UvrD-CTD proteins were incubated at 4 °C at a molar ratio of 1:4 and the complex was separated by a HiLoad 16/600 Superdex 75 pg column. The UvrD-CTD/UvrB-NTD complex was concentrated to 10 mg/ml for screen of crystallization conditions. Crystals were grown in drops containing 1 μL protein complex and 1 μL reservoir B (0.1 M BIS-TRIS, pH 6.1, 15 % w/v PEG 1500), and harvested in reservoir B solution containing 35 % glycerol (Sigma-Aldrich, Inc.). The diffraction data were collected at beamline BL19U in SSRF at wavelength of 0.979 Å. The initial phase was obtained by molecular replacement using a crystal structure of UvrB as the search model (PDB code: 1D2M)112. The structure model was built and refined as above, the final UvrD-CTD/UvrB-NTD model has been refined to Rwork and Rfree of 0.215 and 0.249, respectively.
Cys-pair crosslinking
The 6xHis tagged EcUvrD was purified from E. coli cells carrying pET28a-TEV-EcUvrD using above procedure for EcUvrD-CTD. EcRNAP core enzyme was prepared from pRL706. UvrD and RNAP were incubated with a molar ratio of 4:1 at 4 °C for 4 h, and subsequently applied to a HiLoad 16/600 Superdex 200 pg column (GE Healthcare, Inc.) in 50 mM Tris-HCl; pH 8.0, 150 mM NaCl, and 5 % glycerol, and 1 mM DTT. The fractions of UvrD-RNAP complex were pooled and concentrated. The complex buffer was exchanged to 50 mM Tris-HCl, 150 mM NaCl, 5 % glycerol, 50 μM DTT and 0.45 μM CuCl2; the disulfide-bond formation was allowed for 2 h at 25 °C followed by addition of SDS loading buffer (without β-mercaptoethanol).
Extended Data
Extended Data Fig. 1. UV sensitivity of E. coli strains used in Fig. 1.

Representative efficiencies of colony formation of parent wt (MG1655) and mutant E. coli cells exposed to the indicated UV doses. Overnight cultures were diluted 1:100 with fresh LB and grown to ~ 2x10⁷. Cells were serially diluted, plated on LB agar, irradiated with UV, and incubated at 37 °C for 24 h.
Extended Data Fig. 2. Quantitation of UvrABD binding to RNAP in vivo.
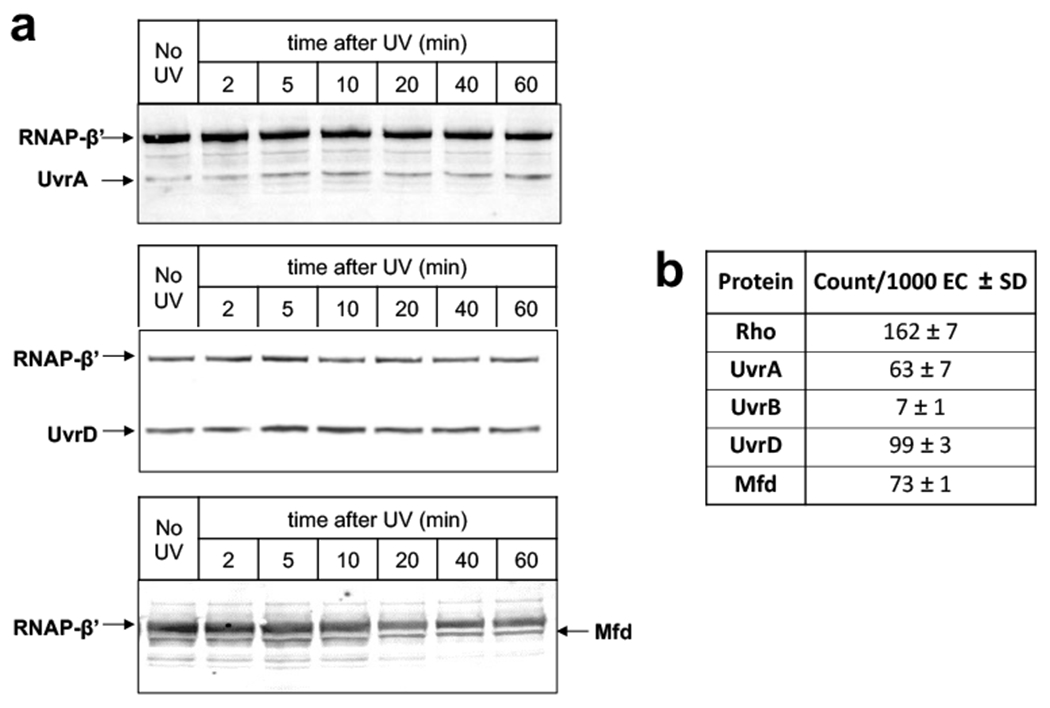
a, Representative Western blots used to generate the plots of Fig. 1b–d. b, Quantitative mass-spectrometry analysis of RNAP-associated UvrABD, Mfd, and Rho in the exponentially grown cells prior to genotoxic stress. RNAP pulldown samples were prepared as in Fig. 1. Values are normalized to that of NusA-containing RNAPs, thus reflecting the RNAP molecules engaged in elongation in vivo.
Extended Data Fig. 3. Reconstitution of the TCRC without nucleic acids.
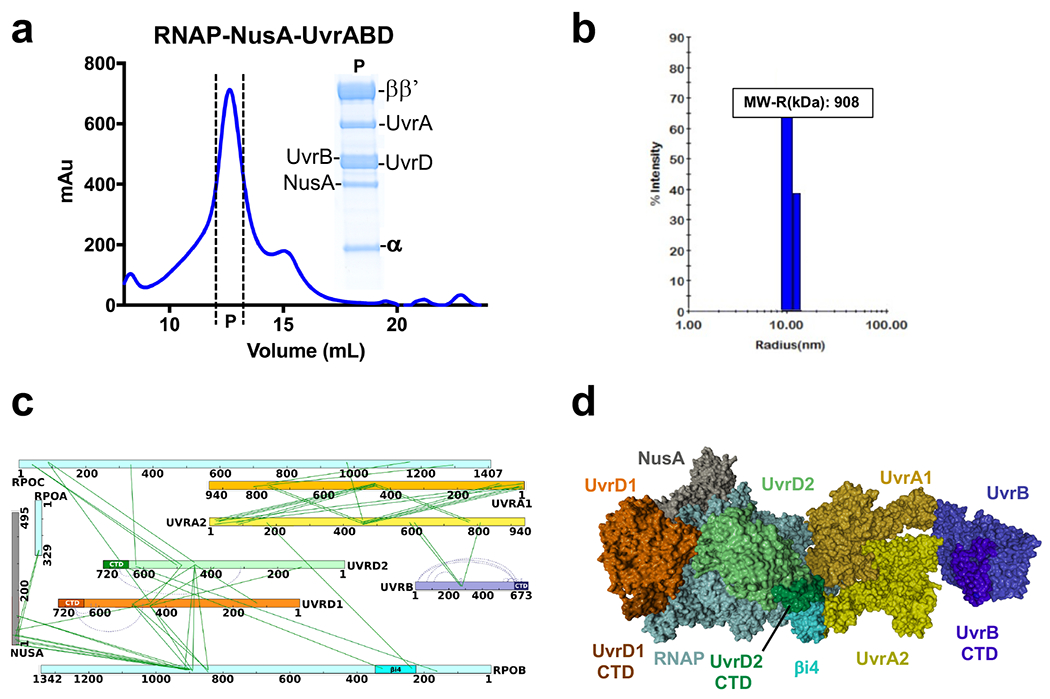
a, Isolation of the RNAP:NusA:UvrABD complex by SEC. SDS-Coomassie gel represents the protein fraction eluted from the main peak (P). b, DLS analysis of the RNAP:NusA:UvrABD complex. “P” fraction from (a) was subjected to DLS. Raleigh sphere (R) estimate of the complex molecular weight (MW = 908 kD), which deviates by only 1.7% from the theoretical MW of a uniform monodispersed complex containing 1 RNAP, 1 NusA, 2 UvrD, 2 UvrA, and 1 UvrB molecules, c, Network view of the highly confident non-redundant inter-protein crosslinks. Crosslinks were aggregated from DSS datasets (Supplementary Table 1). d, XLMS-based model of the reconstituted RNAP:NusA:UvrABD complex. The model was built based on the in vitro crosslinks using PatchDock and the workflow described in Extended Data Figs. 18, 19, and Methods.
Extended Data Fig. 4. Mapping UvrD-EC interactions in vitro.
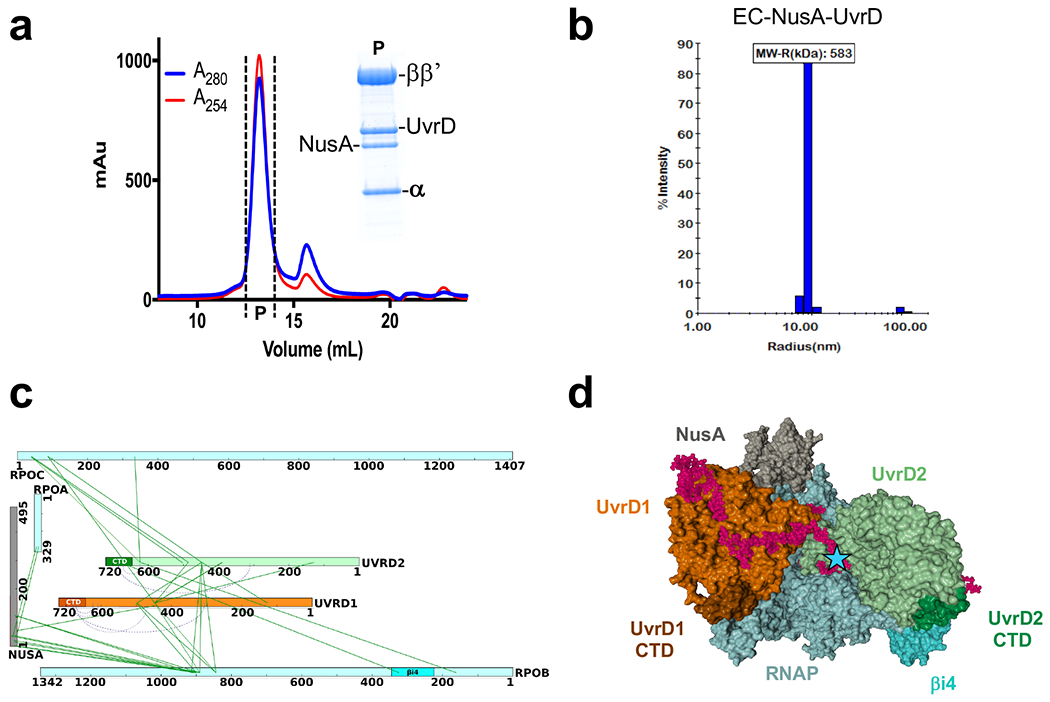
a, Isolation of the EC:NusA:UvrD complex by size exclusion chromatography (SEC). SDS-Coomassie gel represents the protein fraction eluted from the main SEC peak (P). b, Dynamic light scattering (DLS) analysis of the EC:NusA:UvrD complex. “P” fraction from (a) was subjected to DLS. Raleigh sphere (R) estimate of the complex molecular weight (MW = 583 kD), which deviates by only 4.2% from the theoretical MW of a uniform monodispersed complex containing 1 RNAP, 1 NusA, and 2 UvrD molecules, c, Network view of the highly confident non-redundant inter-protein crosslinks between RNAP subunits, NusA, and UvrD. Crosslinks were aggregated from DSS datasets (Supplementary Table 1). d, XLMS-based model of the RNAP:NusA:UvrD complex. The model was built based on the in vitro crosslinks using PatchDock and the workflow described in Extended Data Figs. 18, 19, and Methods. The model shows the positioning of UvrD monomers relative to the transcription bubble. Blue star indicates the DNA-UvrD crosslink previously mapped in the EC15. CTD of UvrD2 is shown by green hexagon. RNA is not shown.
Extended Data Fig. 5. Structural analysis of the interaction between UvrD-CTD and UvrB.
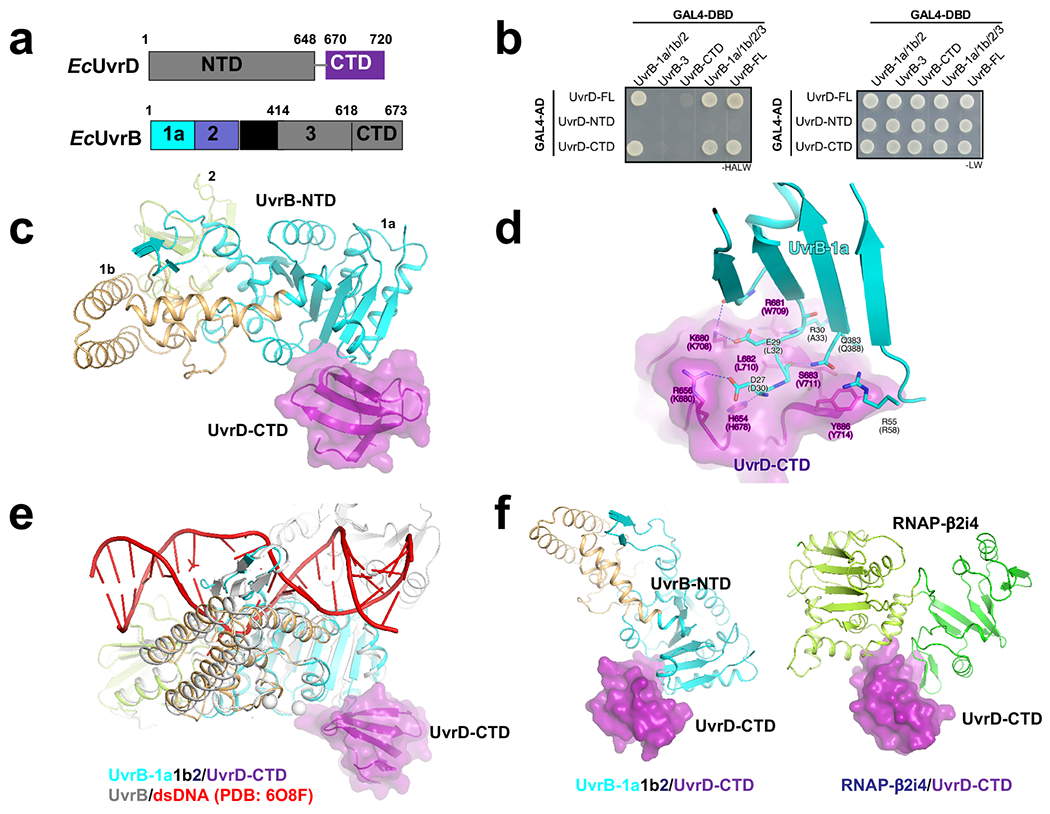
a, UvrD and UvrB domains (numbered as in E. coli). The domains observed in crystal structure are highlighted in colors. b, UvrD-CTD interacts with UvrB-1a/1b/2domain (or UvrD-NTD), consistent with a previous report34. E. coli UvrD (full-length or truncated) and UvrB (full-length or truncated) were fused to GAL4-AD and GAL4-DBD, respectively. The potential interactions were selected on SD (-HALW) plates, and the growth on SD (-LW) plates was used as input control. c, A 2.6-Å crystal structure of T. thermophilus UvrD-CTD/UvrB-NTD complex (PDB 7EGT). UvrB-1a docks on a shallow groove of UvrD-CTD. UvrD-CTD, UvrB-1a, UvrB-1b, and UvrB-2 are colored in purple, cyan, orange, and light green, respectively. d, The detailed interaction between UvrD-CTD and UvrB-1a. Residues H654, R656, K680, R681, S683 of UvrD-CTD makes a H-bond network with residues D27, E29, R30, Q383 of UvrB-1a (residues are labeled and numbered as in T. thermophilus; the corresponding residues in E. coli are indicated in parentheses). Y686 of UvrD-CTD makes stacking interaction with R55 and Q383 of UvrB-1a. e, Structural superimposition of UvrB-NTD/UvrD-CTD complex (colored as above) and UvrB/dsDNA complex (gray and red; PDB 6O8F)61 shows that UvrD-CTD binds the opposite surface of UvrB dsDNA-loading cleft, implicating UvrD doesn’t affect dsDNA loading of UvrB. f, Structural comparison between UvrD-CTD/UvrB-NTD (left) and UvrD-CTD/RNAP-β2i4 (right, PDB 7EGS) shows that UvrB and RNAP-β2i4 binds at the same cleft of UvrD-CTD, and thereby suggests that the interactions of UvrB and RNAP to UvrD are mutually exclusive.
Extended Data Fig. 6. Structural analysis of the interaction between UvrD-CTD and RNAP.
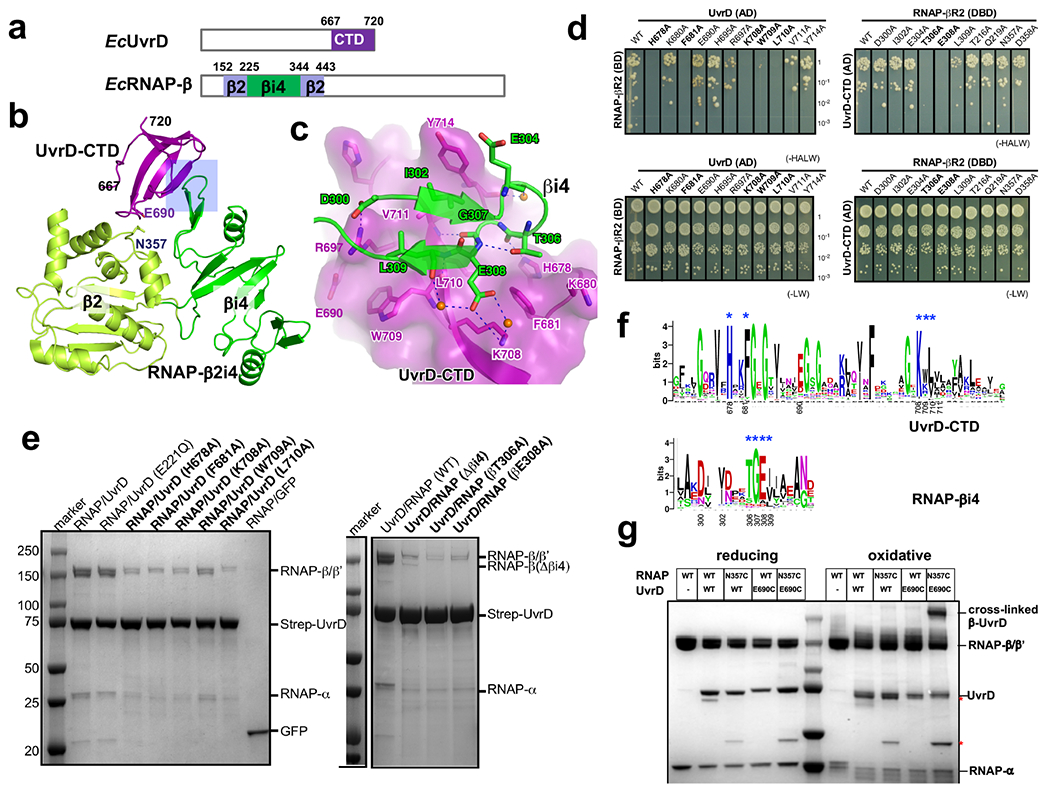
a, UvrD and RNAP β subunit domains observed in crystals structure were colored and labeled. b, The overall structure of the UvrD-CTD/RNAP-β2i4 (PDB 7EGS) binary complex. The major interface is highlighted by a rectangle. The ‘N’ and ‘C’ termini of UvrD-CTD are numbered. c, Detailed interactions between UvrD-CTD and RNAP-β2i4. Oxygen, nitrogen, and water atoms are colored in red, blue, and orange, respectively. Blue dash, H-bond. d, YTH results show that alanine substitution of interface residues on UvrD-CTD or βi4 impairs the interaction of UvrD and RNAP β pincer. The potential interactions were selected on SD (-HALW) plates, and the growth on SD (-LW) plates was used as input control, e, Strep-tag pull down results show that alanine substitution of interface residues of UvrD-CTD or βi4 impairs interaction between RNAP and UvrD. f, Sequence alignments of UvrD-CTD and RNAP-β2i4 from 316 non-redundant proteobacteria that contain βi4 insertion on RNAP. The key interface residues were labeled with blue asterisks and numbered as in E. coli. g, Cys pair cross-linking results demonstrate direct proximity of UvrD-CTD and RNAP-βi4. The wild-type or mutated UvrD-RNAP complexes were incubated in oxidative (CuCl2) or reducing (DTT) condition and separated by SDS-PAGE. The asterisk marks two major impurity bands. The position of residues E690 of UvrD and N357 of RNAP β2 are labeled in (b).
Extended Data Fig. 7. Functional analysis of UvrDΔCTD and RNAPΔβi4.
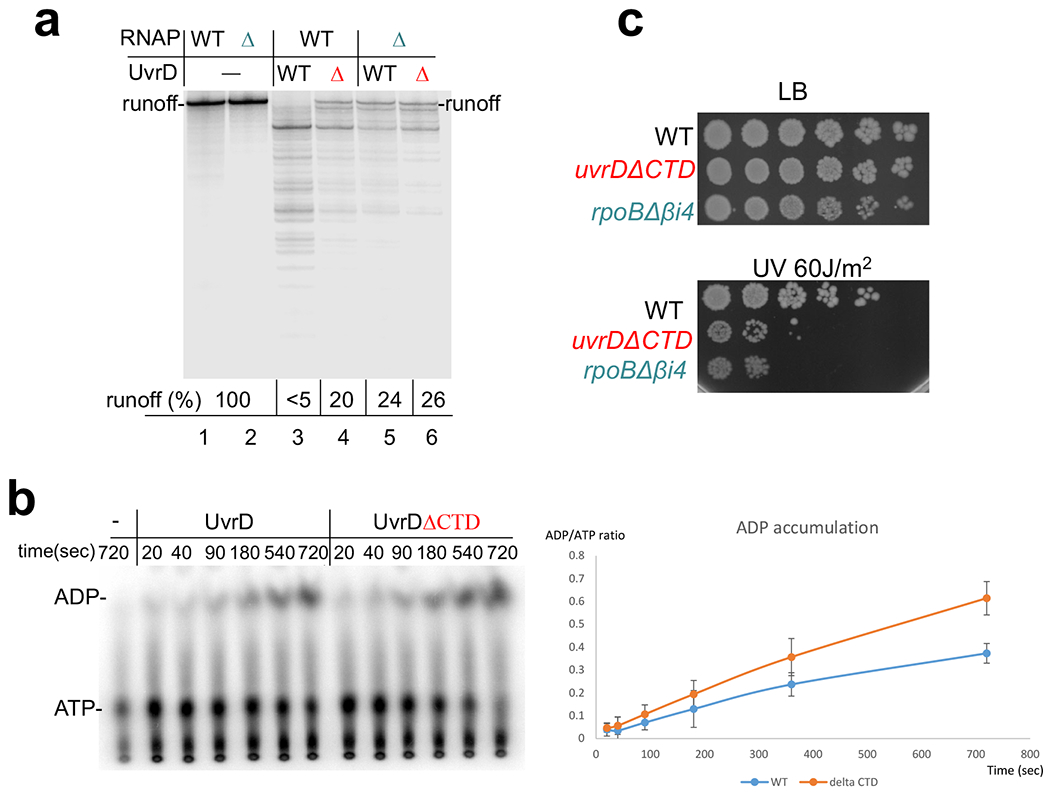
a, Deletions of the CTD of UvrD or βi4 of RNAP partially compromise UvrD-mediated backtracking. EC20 was formed by the wt RNAP or RNAP lacking βi4 (green Δ) (lanes 13 to 18) at the T7A1 DNA template and then chased in the presence of specified amounts of UvrD (red Δ). The pro-backtracking activity of UvrD was assessed as a ratio (%) between the amount of full length (runoff) product and total amounts of RNA products located below the runoff. Majority of these products are the result of UvrD-mediated backtracking and sensitive to transcript cleavage by GreB9,15. b, Deletion of the CTD does not compromise UvrD catalytic activity. The autoradiogram shows the thin layer chromatography (TLC) plate of UvrD-mediated ATP hydrolysis. The reaction was performed using polyC single stranded DNA template as described in Methods. The means ± SE from three experiments are plotted on the right. c, uvrDΔCTD and Δβi4 cells are equally more sensitive to genotoxic stress as compared to wt. Representative efficiencies of colony formation of wt (MG1655) and mutant cells following treatment with the indicated dose of UV irradiation. Cells were grown to OD600 ~0.4 and serial 10-fold dilutions were spotted on LB agar plates followed by UV irradiation and incubation in the dark at 37 °C for 24 h.
Extended Data Fig. 8. Global NER fully depends on ongoing transcription and UvrD, but not Mfd (supplemental to Fig. 4).
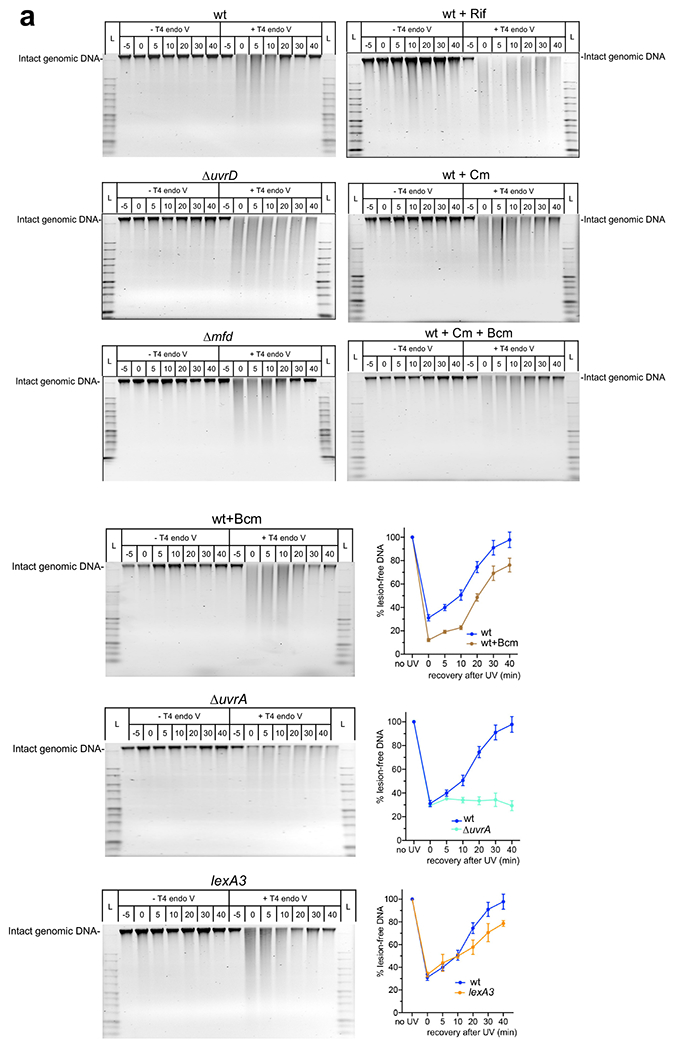
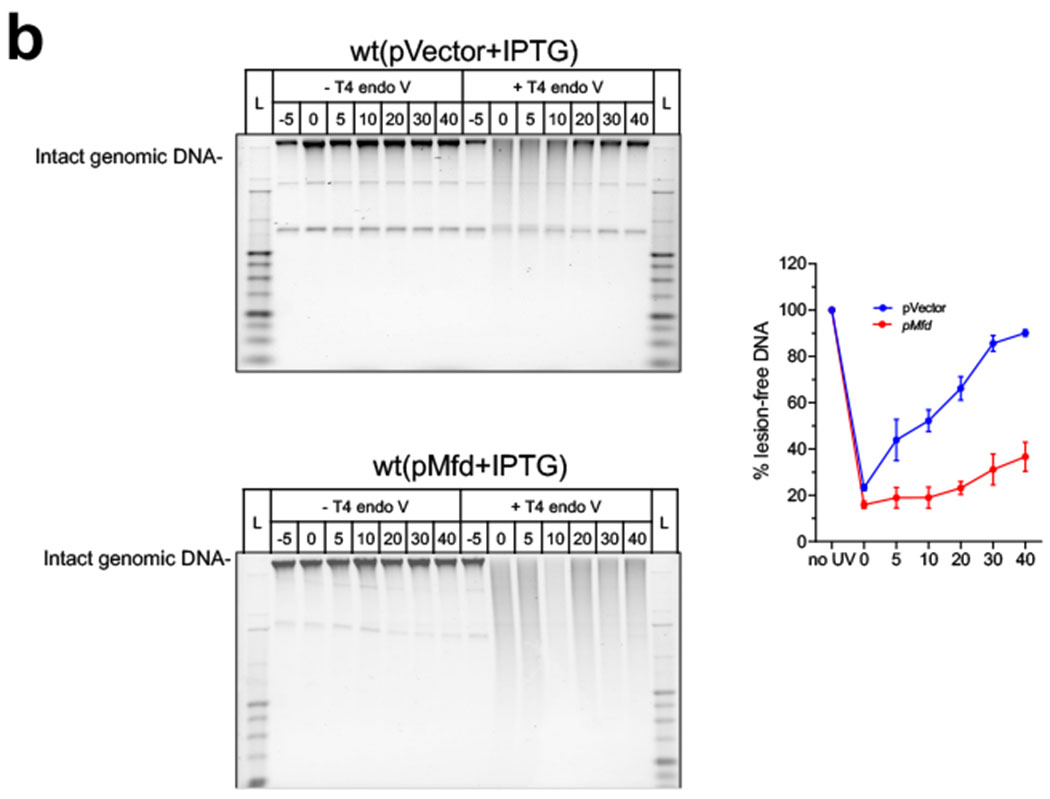
a, Wild-type (wt) and mutant cells were UV irradiated at 50 J/m2 and allowed to recover. At the indicated times, genomic DNA was isolated and either treated with T4endoV or mock treated for 30 min at 37 °C and then analyzed on alkali-agarose gels. Rifampicin (Rif; 750 μg/ml), chloramphenicol (Cm; 200 μg/ml) and/or bicyclomycin (Bcm; 25 μg/ml) were added 30 min prior to UV irradiation (see Methods). Representative gels are shown for each analyzed strain and condition. The percentage of repaired (lesion-free) DNA in T4endoV-treated samples is plotted for each time point relative to untreated samples (see Fig. 4). Data are the mean ± SEM from at least three independent experiments, b, Mfd overexpression interferes with global NER. The wt cells harboring pMfd and the “empty” vector control (pCA24N) were induced with 0.1 mM IPTG followed by UV irradiation and recovery. The percentage of repaired (lesion-free) DNA in T4endoV-treated samples is plotted for each time point relative to untreated samples. Data are the mean ± SEM from at least three independent experiments.
Extended Data Fig. 9. Effects of high (750 μg/ml) and low (50 μg/ml) Rif on E. coli transcription and NER.

a, Inhibition of chromosomal lacZ transcription by Rif. Copies/μL cDNA of lacZ transcripts was determined using absolute quantification (see Methods). A standard curve was generated using lacZ PCR product (1016 to 1023). RT-qPCR was performed using cDNA isolated from bacterial cultures treated with indicated concentrations of Rif. Number of copies of lacZ transcripts was determined by interpolation. Values are the means ± SD (n = 3). b, Inhibition of CPDs repair by high and low Rif. (Left panel) Representative slot blot probed by fluorescently labeled secondary antibody to reveal binding of primary monoclonal CPD-specific antibodies (see Methods). (Right panel) Quantitative analysis of slot blot images for the indicated recovery time points post-UV. Bars, standard errors of the means from 3 independent experiments.
Extended Data Fig. 10. Rifampicin does not compromise the level of NER enzymes during the time of the experiment (supplemental to Fig. 4).
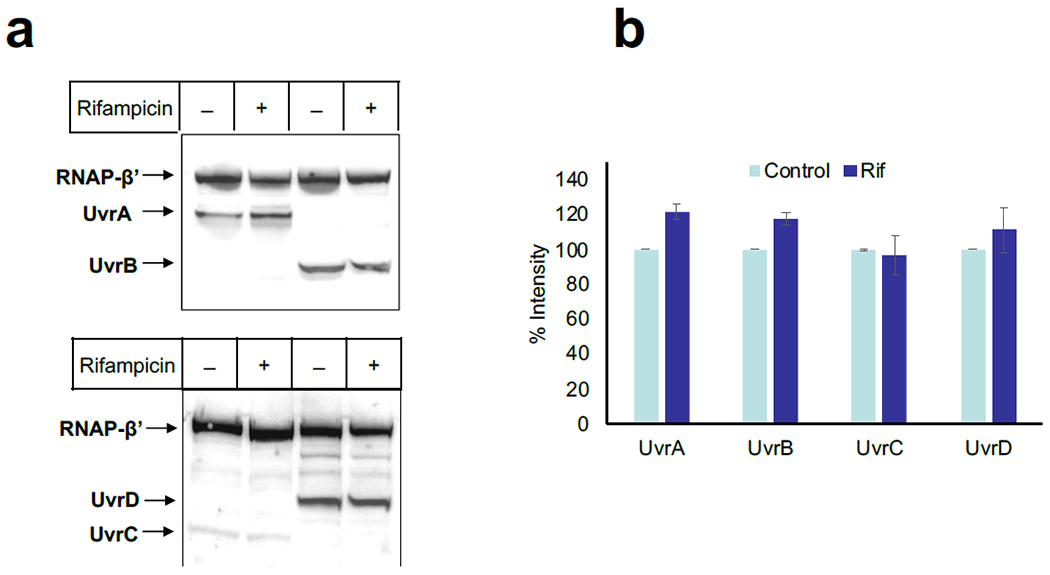
a, Representative Western blots of intracellular UvrABCD proteins during the time of Rif treatment (Fig. 4) and their quantitation (b). Data are the mean ± SEM from at least three independent experiments.
Extended Data Fig. 11. Local transcription enables NER (extension to Fig. 5).
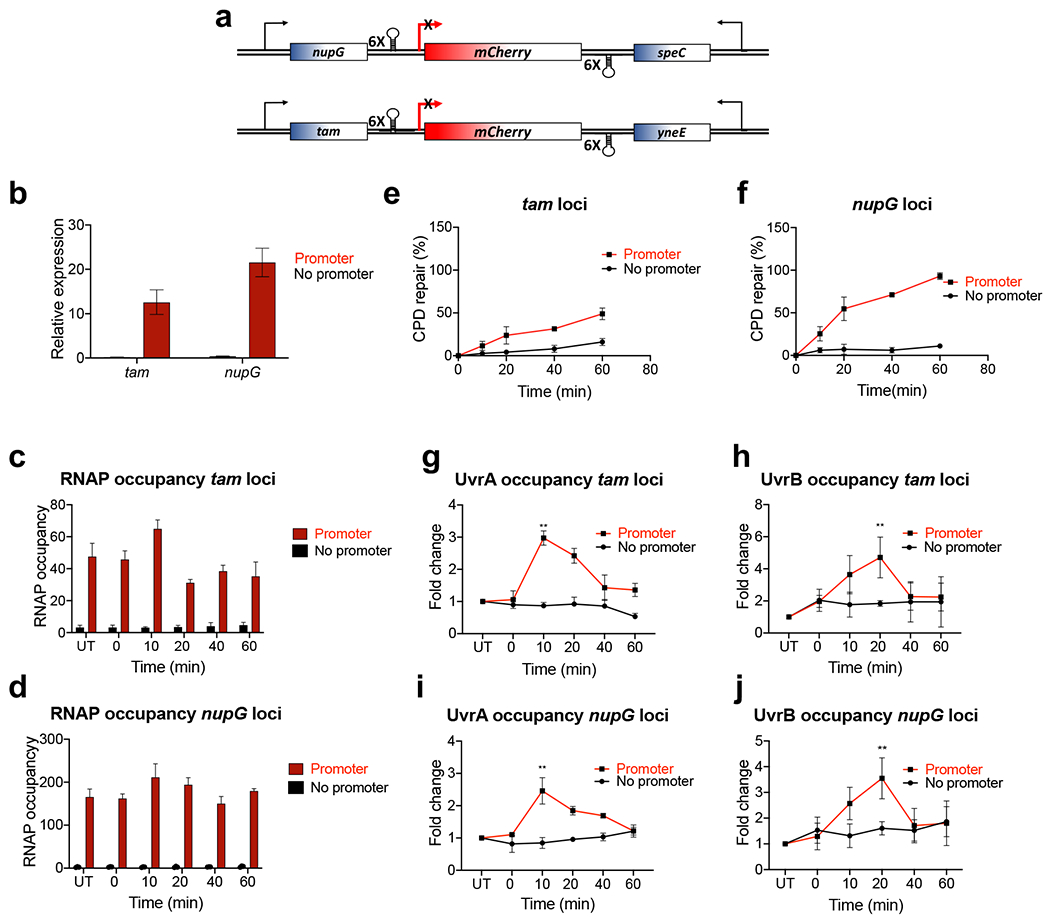
a-d, Depriving the genomic loci of transcription abolishes their NER. a, Schematics of the mCherry insulators. A transcription unit containing mCherry (with or without lacZ promoter) flanked by the terminator cassettes was inserted at the tam and nupG loci. b-d The expression of mCherry from the insulators (b) and RNAP occupancy (c, d) upon IPTG induction, as determined by RT-qPCR and ChIP-qPCR, respectively. Values are the means ± SD (n = 3). e,f CPD repair within the insulators. Most of NER strictly depends on promoter-initiated transcription. The levels of transcription and NER are stronger within the nupG insulator comparing to the tam insulator. Cells were induced with IPTG followed by UV irradiation (40 J/m2) and recovery in the dark for the indicated time intervals. CPD density was determined by SLR-qPCR as in Fig. 5a and used to calculate the percentage of repaired CPDs. Values are the means ± SD (n = 3). g-j, UvrAB recruitment to the UV-damaged DNA strictly depends on local transcription in both tam and nupG loci. Occupancy of RNAP (c,d), UvrA (g,i) and UvrB (h,j) following UV irradiation was determined by ChIP-qPCR. Cells were induced with IPTG followed by UV irradiation (40 J/m2) and recovery for the indicated time intervals. Values are the means ± SD (n = 3). Results are shown as a fold change in the occupancy of UvrAB within the insulator following UV irradiation. UT – untreated. Values are means ± SD (n = 3). **P < 0.01, ****P < 0.0001 (Student’s t test; equal variance). P values compare the percentage of DNA repair between “promoter” and “no promoter” strains for a given time point.
Extended Data Fig. 12. Local transcription enables NER irrespective of Mfd (extension to Fig. 5).
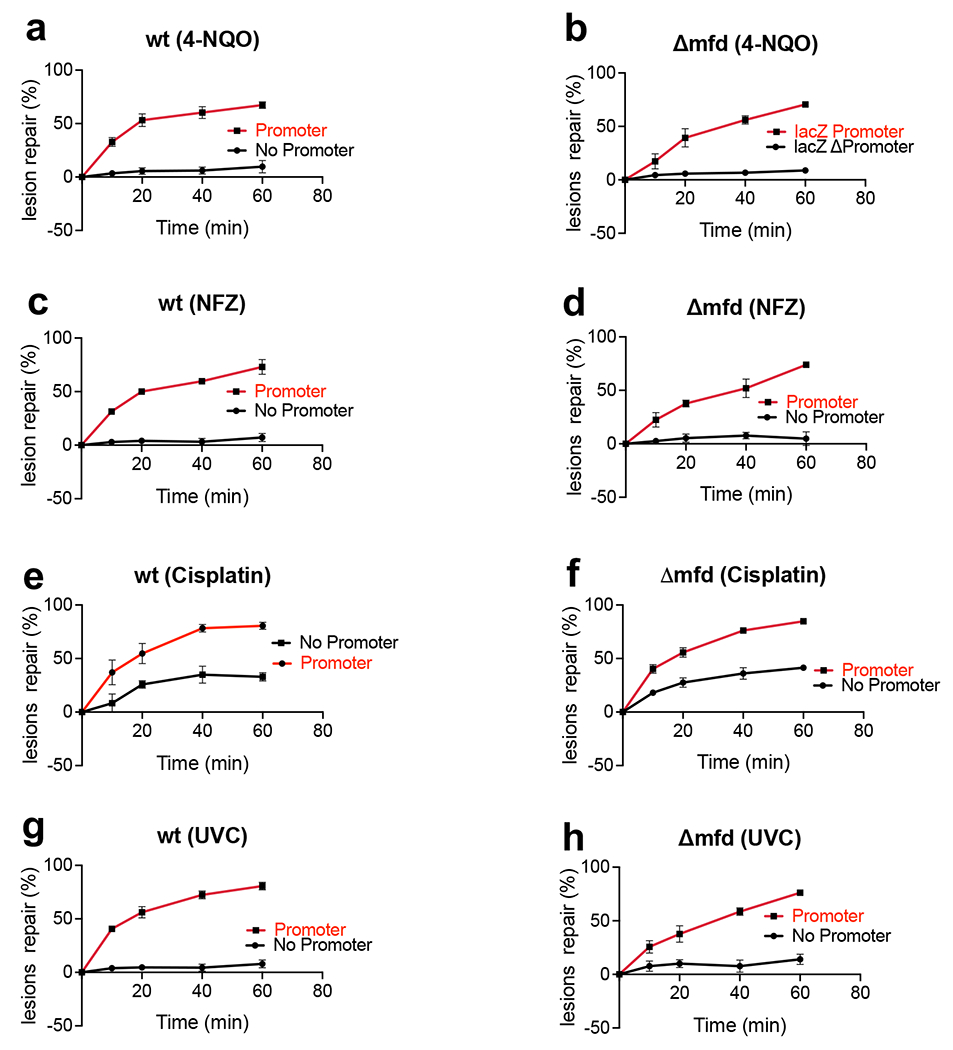
a-h, Depriving the genomic loci of transcription drastically diminished NER irrespective of Mfd. Genomic DNA repair within the insulator was monitored as described in Methods for the lesions generated by 4-NQO (a-b), NFZ (c-d), cisplatin (e-f), or UV-C (g-h). lacZ was induced with IPTG followed by the exposure to drugs or UV radiation. Cells were allowed to recover for the indicated time intervals followed by the isolation of genomic DNA. Lesion density was determined by SLR-qPCR and used to calculate the percentage of repaired lesions. Values are the means ± SD (n = 3).
Extended Data Fig. 13. UvrAB recruitment to the UV-damaged DNA strictly depends on local transcription, but not Mfd (compare to Fig. 5l,m).
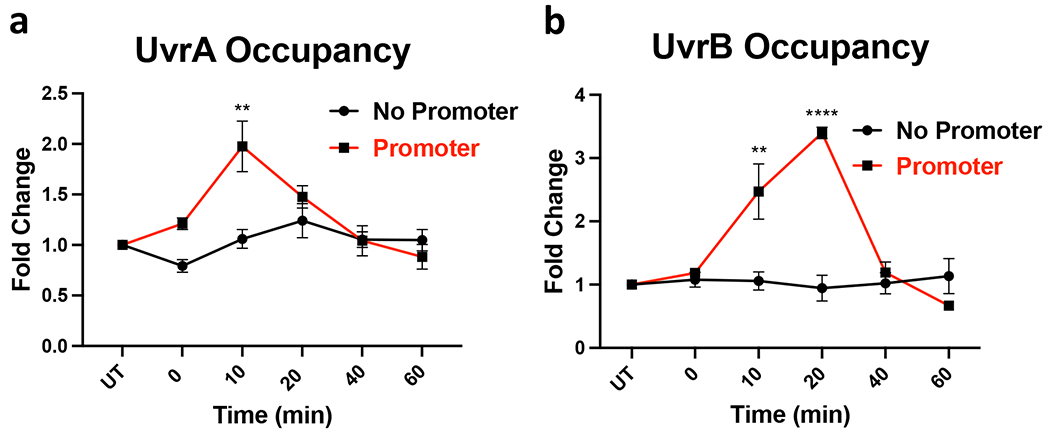
Recruitment of UvrA (a) and UvrB (b) to the lacZ insulator (with or without promoter) was determined by ChIP-qPCR in Δmfd cell as in Fig. 5h. Results are shown as a fold change in the occupancy of UvrAB within the insulator of Δmfd cells following UV irradiation. **P < 0.01, ****P < 0.0001 (Student’s t test; equal variance).
Extended Data Fig. 14. Integrated model of TCR (see also Movie 2).
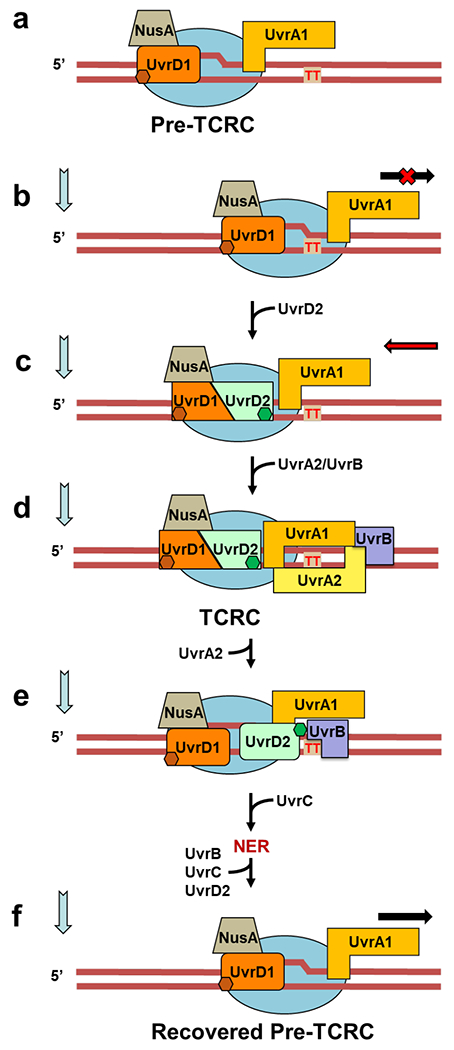
Based on the in vivo and in vitro data presented, we propose a structure-functional model of NER in E. coli in which the elongating RNAP functions as the primary lesion scanner and platform for the assembly of active NER complexes. a, A subpopulation of elongating RNAPs persistently interacts with UvrD1 and UvrA1, as shown in the structural model of Fig. 2b. The in vivo RNAP pulldowns and XLMS demonstrate that such surveillance pre-TCRCs can form even before the genotoxic stress. b,c, Upon stalling at the DNA lesion in the template strand (CPD is marked as red “TT”), the pre-TCRC recruits UvrD2 to form a helicase competent UvrD dimer. UvrD2-CTD (green hexagon) interacts with a RNAP βi4 domain to stabilize the UvrD dimer. UvrD12 pulls TCRC backward, thereby exposing a CPD to the NER enzymes15. ppGpp contributes at this stage by rendering RNAP backtracking-prone9. d, TCRC recruits UvrA2/UvrB to initiate the lesion processing. While a single UvrB monomer is sufficient for lesion verification and UvrC recruitment27,62,63, the second UvrB molecule may be recruited as well26,61,64. In vitro (Extended Data Fig. 3) and in vivo XLMS (Fig. 2c,d) are consistent with a single UvrB monomer model. This UvrB can interact with the CTD of UvrD2 (Extended Data Fig. 5), thereby displacing UvrD2 from RNAP (Movie 2). The release of UvrD2 that occurs coincidentally with the UvrA2B recruitment (Fig. 1b,c) supports such a sequence of events in vivo. UvrD2 displacement would abrogate any further UvrD-mediated backtracking, e, The pre-incision TCRC recruits UvrC and releases UvrA2B followed by the NER execution step2,62. Once repair has been completed, the backtracked pre-TCRC is promptly recovered by the anti-backtracking factors (GreB, Mfd, and a leading ribosome) to resume elongation.
Extended Data Fig. 15. A model for Mfd recruitment by UvrA to the pre-TCRC.
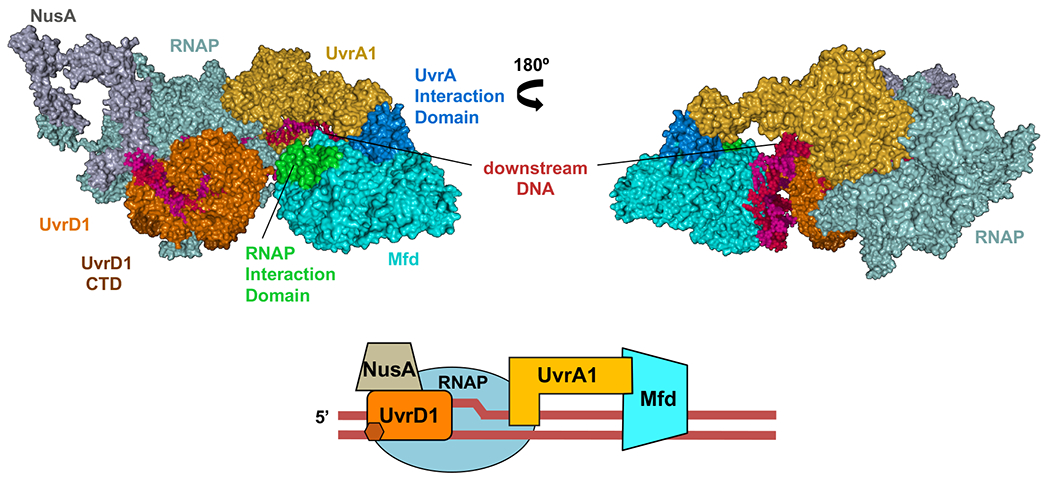
(top) E. coli Mfd (color: cyan) bound to double-stranded DNA (PDB 6XEO)65 is shown interacting with UvrA in the pre-TCRC, by structural alignment to the E. coli UvrA-Mfd core interaction complex (PDB 4DFC)66. The UvrA binding domain of Mfd (color: blue) is fully unmasked upon initial DNA binding, allowing it to be located by the pre-TCRC (Extended Data Fig. 16 and Movie 3). RNAP-binding domain of Mfd (green) is facing downstream to eventually interact with RNAPs stalled/paused ahead of the pre-TCRC and terminate or rescue them from the backtracked state. Illustrative cartoon (bottom). RNA is not shown.
Extended Data Fig. 16. Role of Mfd in TCR (see also Movie 3 and Extended Data Fig 15).
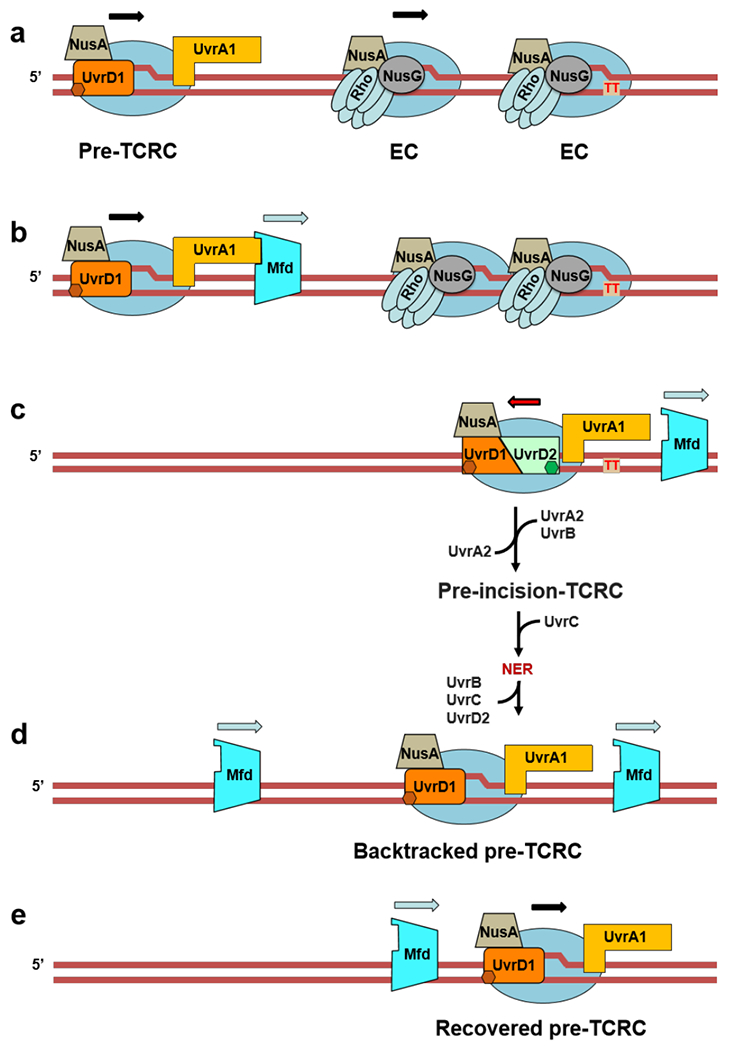
We propose that the modest contribution of Mfd to NER (Fig. 4a) is due to its ability to terminate multiple queuing ECs in front of TCRCs, thereby helping to “clean up” space between the TCRCs and DNA lesions at highly expressed genes. a,b, UvrA of the pre-TCRC facilitates Mfd recruitment and/or its transition to a processive translocase (Fig. 1d). Mfd then translocates forward (downstream of the TCRC) to “push” and terminate multiple ECs between the TCRC and CPD (red “TT”). This directionality ensures that Mfd preferentially terminates non-TCR complexes, thereby facilitating TCRC access to the sites of damage. c, TCR proceeds as described in Extended Data Fig. 14. d, Mfd continues to be recruited during the recovery phase, even after most repair has been completed (Fig. 1d). These additional Mfd molecules can now also reactivate backtracked complexes, hence the role of Mfd in facilitating transcription recovery post-UV 11 This model explains why a delay in NER in the Mfd-deficient cells occurs only within the most highly transcribed (most congested) regions and why NER of less actively transcribed regions is indifferent to, or even compromised by, Mfd activity35,48. It also explains why the overexpression of Mfd is so detrimental to NER (Extended Data Fig. 8b): excessive Mfd would prematurely terminate both ECs and TCRCs, thereby abolishing repair. Finally, the model also explains why mfd cells become more sensitive to genotoxic stress in the presence of Rho inhibitor BCM (Extended Data Fig. 17). Rho, like Mfd, can terminate ECs that obscure the lesion sites from TCRCs40. If both termination factors were inactivated, there is no obvious solution to this problem.
Extended Data Fig. 17. Rho inactivation enhances Mfd sensitivity to UV.
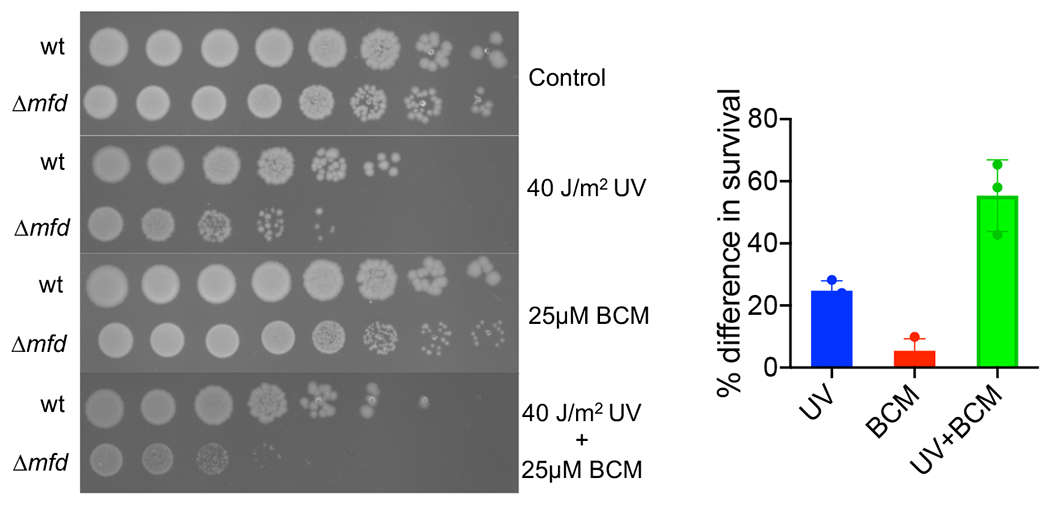
a, Representative efficiencies of colony formation of wild-type (MG1655) and Δmfd cells on LB agar, LB agar exposed to 40 J/m2 of UV, 25 μM bicyclomycin (BCM) and 25 μM BCM with 40 J/m2 of UV. Cells were spotted on LB agar plates in serial tenfold dilutions and incubated at 37 °C for 24 h. b, Data from three independent experiments was used to calculate percent difference in survival between wt and Δmfd cells. Values are means ± SD.
Extended Data Fig. 18. An outline of the automated workflow for crosslink-guided docking.

a,b, Coordinate files for all the E. coli interactors used to build the pre-TCRC and TCRC are prepared using available PDB structures, which were refined using YASARA Structure67 (see Methods). Proteins without available PDB structures were homology-modeled using I-TASSER68,69. XLMS data was converted to the distance restrains compatible with PatchDock. c, PDB files of receptor and ligand molecules were submitted to PatchDock with their corresponding distance restrains for rigid-body docking. d, The docking results were validated by examining the crosslink satisfaction using Jwalk70 (see Methods).
Extended Data Fig. 19. An overview of the automated dimer-assembly workflow.

Two monomer models (X and Y), previously and separately docked to a common receptor model (R), are combined to generate receptor-dimer models that satisfy the highest number of crosslinks between the two monomers. a,b, Top docking poses for each monomer (R-X and R-Y) are clustered to eliminate redundancies and accelerate subsequent steps. c, Representative models obtained by clustering each of the two groups are cross-matched to generate combined receptor-dimer coordinate files (R-X-Y), and analyzed for cross-links satisfied between X-Y using Jwalk. d, receptor-dimer models satisfying >2 cross-links are ranked by number and average distance of satisfied X-Y cross-links for further analysis.
Extended Data Fig. 20. Application of the docking pipeline to model the pre-TCRC.
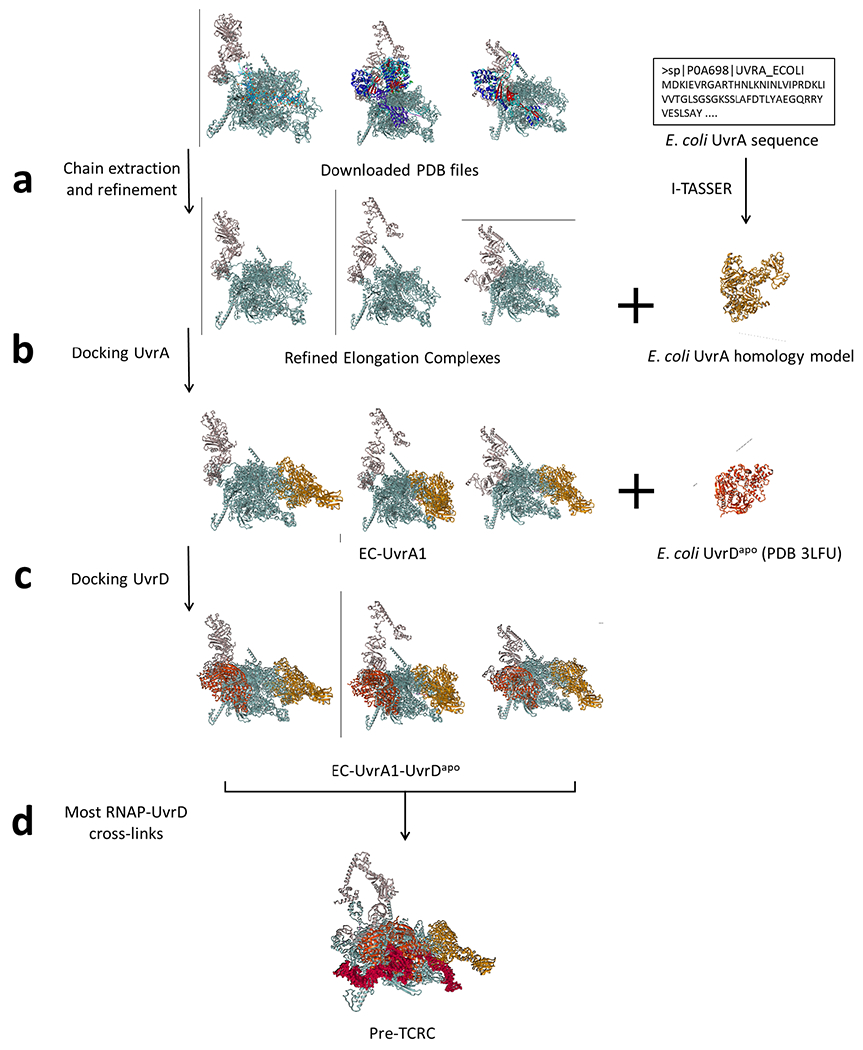
a, PDB files of E. coli elongation complexes were downloaded and prepared by extracting chains corresponding to RNAP subunits and NusA, then refined using the energy-minimization protocol included in YASARA Structure. E. coli UvrA was modeled using the homology template server I-TASSER. b, UvrA (ligand) was docked to ECs (receptors) from the previous step using PatchDock, with the RNAP-UvrA crosslinks provided as distance restraints. c, The PDB coordinates file of E. coli UvrD in the apo form was trimmed to the first 640 residues and refined using YASARA Structure, then docked to the top EC-UvrA complexes generated in the previous step, as ranked by RNAP-UvrA crosslink satisfaction. d, EC-UvrA-UvrD complexes generated in the previous step were ranked by RNAP-UvrD crosslink satisfaction and used as receptors to dock UvrD-CTD. Results were clustered using ProFit (V3.1), and finally analyzed for alignment of UvrAD DNA-binding regions with the DNA path in the EC.
Extended Data Fig. 21. Application of the docking pipeline and dimer assembly component to model the TCRC.
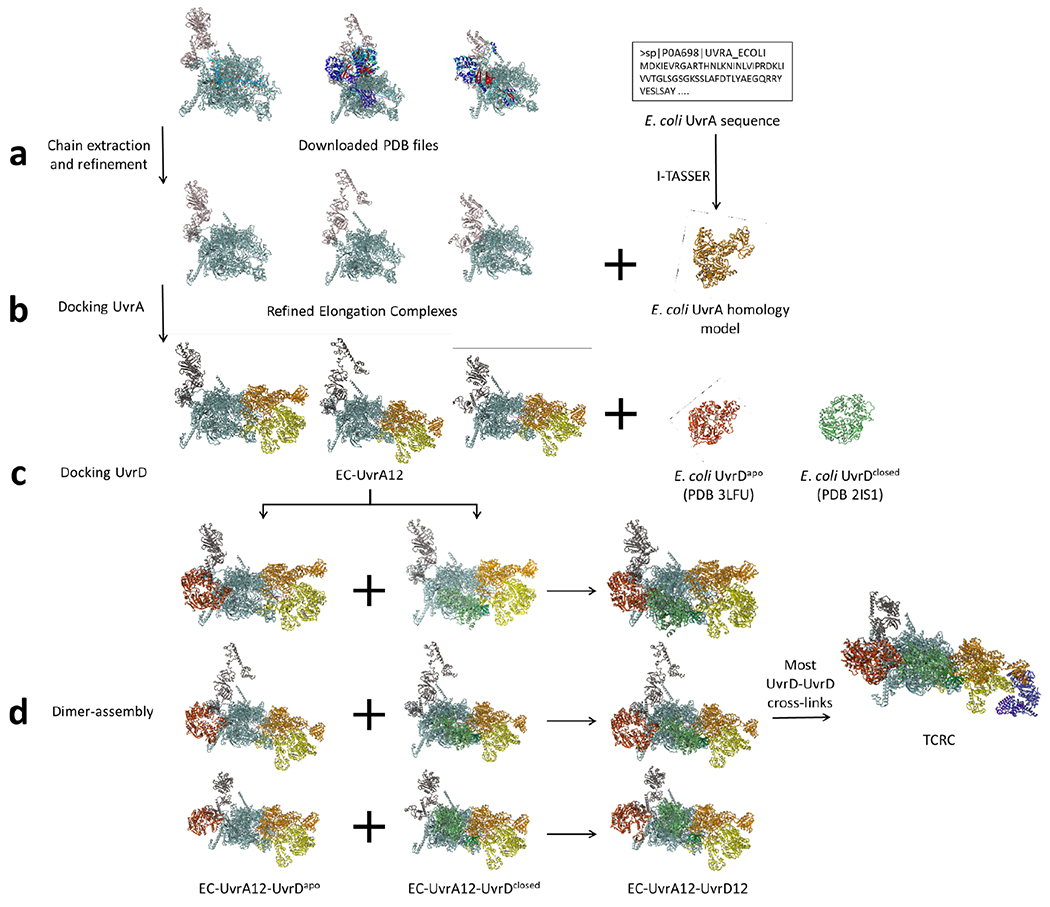
a, PDB files of E. coli ECs were downloaded and prepared by extracting chains corresponding to RNAP subunits and NusA, then refined using the energy-minimization protocol included in YASARA Structure. E. coli UvrA was modeled using the homology template server I-TASSER. b, UvrA1 (ligand) was docked to the ECs (receptors) from the previous step using PatchDock, with RNAP-UvrA crosslinks provided as distance restraints. Docking was repeated using EC-UvrA1 complexes as receptors and additional UvrA-UvrA distance restraints to generate EC-UvrA12 complexes. c, PDB coordinate files of E. coli UvrD in the apo and closed forms were trimmed to the first 640 residues and refined using YASARA Structure, then docked separately to the top EC-UvrA12 complexes generated in the previous step, as ranked by RNAP-UvrA and UvrA-UvrA crosslink satisfaction. d, Top EC-UvrA12-UvrD complexes generated in the previous step were divided into two groups based on the docked UvrD model (apo vs. closed), and used as input to the dimer-assembly component described in Methods and Extended Data Fig. 18. UvrD poses from the two groups were cross-matched to generate EC-UvrA12-UvrD12 complexes, analyzed for UvrD-UvrD crosslink satisfaction and steric clashes, and used as receptors to dock UvrD1-CTD. Results were clustered using ProFit (V3.1) and analyzed for agreement with UvrA-dimer structures and alignment of Uvr DNA-binding regions with the DNA path in the EC. Final complexes were refined with YASARA Structure and re-analyzed with Jwalk for crosslink satisfaction.
Supplementary Material
Acknowledgements:
We thank the staff at beamline BL17U1/BL18U1/BL19U1 of Shanghai Synchrotron Radiation Facility for assistance during data collection. This work was supported by Strategic Priority Research Program of the Chinese Academy of Sciences (XDB29020302), Chinese Natural Science Foundation of China (31822001), and the Shanghai Science and technology innovation program (19JC1415900) (Y. Z), and by NIH grant R01 GM126891, Blavatnik Family Foundation, and by the Howard Hughes Medical Institute (E.N.).
Footnotes
Competing interests: The authors declare no competing interests.
Data availability:
Coordinates and structure factors of X-ray crystallography structures determined in the study are deposited in the Protein Data Bank (PDB) under accession numbers listed in Supplementary Table 4. PDBs of the XLMS-driven docking models are available as supplemental material.
References
- 1.Marteijn JA, Lans H, Vermeulen W & Hoeijmakers JH Understanding nucleotide excision repair and its roles in cancer and ageing. Nat Rev Mol Cell Biol 15, 465–481, doi: 10.1038/nrm3822 (2014). [DOI] [PubMed] [Google Scholar]
- 2.Kisker C, Kuper J & Van Houten B Prokaryotic Nucleotide Excision Repair. Csh Perspect Biol 5, doi:ARTN a012591 10.1101/cshperspect.a012591 (2013). [DOI] [PMC free article] [PubMed] [Google Scholar]
- 3.Kuper J & Kisker C Damage recognition in nucleotide excision DNA repair. Curr Opin Struct Biol 22, 88–93, doi: 10.1016/j.sbi.2011.12.002 (2012). [DOI] [PubMed] [Google Scholar]
- 4.Hanawalt PC & Spivak G Transcription-coupled DNA repair: two decades of progress and surprises. Nat Rev Mol Cell Biol 9, 958–970, doi: 10.1038/nrm2549 (2008). [DOI] [PubMed] [Google Scholar]
- 5.Pani B & Nudler E Mechanistic insights into transcription coupled DNA repair. DNA Repair 56, 42–50, doi: 10.1016/j.dnarep.2017.06.006 (2017). [DOI] [PMC free article] [PubMed] [Google Scholar]
- 6.Spivak G Transcription-coupled repair: an update. Arch Toxicol 90, 2583–2594, doi: 10.1007/s00204-016-1820-x (2016). [DOI] [PMC free article] [PubMed] [Google Scholar]
- 7.Selby CP & Sancar A Molecular mechanism of transcription-repair coupling. Science 260, 53–58, doi: 10.1126/science.8465200 (1993). [DOI] [PubMed] [Google Scholar]
- 8.Cohen SE et al. Roles for the transcription elongation factor NusA in both DNA repair and damage tolerance pathways in Escherichia coli. P Natl Acad Sci USA 107, 15517–15522, doi: 10.1073/pnas.1005203107 (2010). [DOI] [PMC free article] [PubMed] [Google Scholar]
- 9.Kamarthapu V et al. ppGpp couples transcription to DNA repair in E. coli. Science 352, 993–996, doi: 10.1126/science.aad6945 (2016). [DOI] [PMC free article] [PubMed] [Google Scholar]
- 10.Ragheb MN et al. Inhibiting the Evolution of Antibiotic Resistance. Mol Cell 73, 157–165 e155, doi: 10.1016/j.molcel.2018.10.015 (2019). [DOI] [PMC free article] [PubMed] [Google Scholar]
- 11.Schalow BJ, Courcelle CT & Courcelle J Mfd is required for rapid recovery of transcription following UV-induced DNA damage but not oxidative DNA damage in Escherichia coli. J Bacteriol 194, 2637–2645, doi: 10.1128/jb.06725-11 (2012). [DOI] [PMC free article] [PubMed] [Google Scholar]
- 12.Witkin EM Radiation-Induced Mutations and Their Repair. Science 152, 1345–1353, doi:DOI 10.1126/science.152.3727.1345 (1966). [DOI] [PubMed] [Google Scholar]
- 13.Kamarthapu V & Nudler E Rethinking transcription coupled DNA repair. Curr Opin Microbiol 24, 15–20, doi: 10.1016/j.mib.2014.12.005 (2015). [DOI] [PMC free article] [PubMed] [Google Scholar]
- 14.Mullenders L DNA damage mediated transcription arrest: Step back to go forward. DNA Repair (Amst) 36, 28–35, doi: 10.1016/j.dnarep.2015.09.005 (2015). [DOI] [PubMed] [Google Scholar]
- 15.Epshtein V et al. UvrD facilitates DNA repair by pulling RNA polymerase backwards. Nature 505, 372–377, doi: 10.1038/nature12928 (2014). [DOI] [PMC free article] [PubMed] [Google Scholar]
- 16.Rasouly A, Pani B & Nudler E A Magic Spot in Genome Maintenance. Trends Genet 33, 58–67, doi: 10.1016/j.tig.2016.11.002 (2017). [DOI] [PMC free article] [PubMed] [Google Scholar]
- 17.Sivaramakrishnan P et al. The transcription fidelity factor GreA impedes DNA break repair. Nature 550, 214–218, doi: 10.1038/nature23907 (2017). [DOI] [PMC free article] [PubMed] [Google Scholar]
- 18.ClGl, Kovalsky O & Grossman L Transcription coupled nucleotide excision repair by isolated Escherichia coli membrane-associated nucleoids. Nucleic Acids Res 26, 1466–1472, doi: 10.1093/nar/26.6.1466 (1998). [DOI] [PMC free article] [PubMed] [Google Scholar]
- 19.Manelyte L, Kim YI, Smith AJ, Smith RM & Savery NJ Regulation and rate enhancement during transcription-coupled DNA repair. Mol Cell 40, 714–724, doi: 10.1016/j.molcel.2010.11.012 (2010). [DOI] [PMC free article] [PubMed] [Google Scholar]
- 20.Savery N Prioritizing the repair of DNA damage that is encountered by RNA polymerase. Transcr-Austin 2, 168–172, doi: 10.4161/trns.2.4.16146 (2011). [DOI] [PMC free article] [PubMed] [Google Scholar]
- 21.Wang CY et al. Structural basis of transcription-translation coupling. Science 369, 1359–1365, doi: 10.1126/science.abb5317 (2020). [DOI] [PMC free article] [PubMed] [Google Scholar]
- 22.Jia HF et al. Rotations of the 2B Sub-Domain of E. coli UvrD Helicase/Translocase Coupled to Nucleotide and DNA Binding (vol 411, pg 633, 2011). J Mol Biol 418, 264–265, doi: 10.1016/j.jmb.2012.02.030 (2012). [DOI] [PMC free article] [PubMed] [Google Scholar]
- 23.Lee JY & Yang W UvrD helicase unwinds DNA one base pair at a time by a two-part power stroke. Cell 127, 1349–1360, doi: 10.1016/j.cell.2006.10.049 (2006). [DOI] [PMC free article] [PubMed] [Google Scholar]
- 24.Pakotiprapha D et al. Crystal structure of Bacillus stearothermophilus UvrA provides insight into ATP-modulated dimerization, UvrB interaction, and DNA binding. Molecular Cell 29, 122–133, doi: 10.1016/j.molcel.2007.10.026 (2008). [DOI] [PMC free article] [PubMed] [Google Scholar]
- 25.Pakotiprapha D, Liu Y, Verdine GL & Jeruzalmi D A Structural Model for the Damage-sensing Complex in Bacterial Nucleotide Excision Repair. J Biol Chem 284, 12837–12844, doi: 10.1074/jbc.M900571200 (2009). [DOI] [PMC free article] [PubMed] [Google Scholar]
- 26.Pakotiprapha D, Samuels M, Shen KN, Hu JH & Jeruzalmi D Structure and mechanism of the UvrA-UvrB DNA damage sensor. Nat Struct Mol Biol 19, 291–U247, doi: 10.1038/nsmb.2240 (2012). [DOI] [PubMed] [Google Scholar]
- 27.Jaciuk M et al. A combined structural and biochemical approach reveals translocation and stalling of UvrB on the DNA lesion as a mechanism of damage verification in bacterial nucleotide excision repair. DNA Repair 85, doi:ARTN 102746 10.1016/j.dnarep.2019.102746 (2020). [DOI] [PMC free article] [PubMed] [Google Scholar]
- 28.Nguyen B, Ordabayev Y, Sokoloski JE, Weiland E & Lohman TM Large domain movements upon UvrD dimerization and helicase activation. P Natl Acad Sci USA 114, 12178–12183, doi: 10.1073/pnas.1712882114 (2017). [DOI] [PMC free article] [PubMed] [Google Scholar]
- 29.Duchi D, Mazumder A, Malinen AM, Ebright RH & Kapanidis AN The RNA polymerase clamp interconverts dynamically among three states and is stabilized in a partly closed state by ppGpp. Nucleic Acids Research 46, 7284–7295, doi: 10.1093/nar/gky482 (2018). [DOI] [PMC free article] [PubMed] [Google Scholar]
- 30.Zuo YH, Wang YM & Steitz TA The Mechanism of E. coli RNA Polymerase Regulation by ppGpp Is Suggested by the Structure of their Complex. Molecular Cell 50, 430–436, doi: 10.1016/j.molcel.2013.03.020 (2013). [DOI] [PMC free article] [PubMed] [Google Scholar]
- 31.Kawale AA & Burmann BM UvrD helicase-RNA polymerase interactions are governed by UvrD’s carboxy-terminal Tudor domain. Commun Biol 3, 607, doi: 10.1038/s42003-020-01332-2 (2020). [DOI] [PMC free article] [PubMed] [Google Scholar]
- 32.Sanders K et al. The structure and function of an RNA polymerase interaction domain in the PcrA/UvrD helicase. Nucleic Acids Res 45, 3875–3887, doi: 10.1093/nar/gkx074 (2017). [DOI] [PMC free article] [PubMed] [Google Scholar]
- 33.Urrutia-Irazabal I, Ault JR, Sobott F, Savery NJ & Dillingham MS Analysis of the PcrA-RNA polymerase complex reveals a helicase interaction motif and a role for PcrA/UvrD helicase in the suppression of R-loops. Elife 10, doi: 10.7554/eLife.68829 (2021). [DOI] [PMC free article] [PubMed] [Google Scholar]
- 34.Manelyte L et al. The unstructured C-terminal extension of UvrD interacts with UvrB, but is dispensable for nucleotide excision repair. DNA Repair 8, 1300–1310, doi: 10.1016/j.dnarep.2009.08.005 (2009). [DOI] [PMC free article] [PubMed] [Google Scholar]
- 35.Martinez B, Bharati BK, Epshtein V & Nudler E Pervasive Transcription-coupled DNA repair in E. coli. co-submitted. [DOI] [PMC free article] [PubMed] [Google Scholar]
- 36.Courcelle J, Khodursky A, Peter B, Brown PO & Hanawalt PC Comparative gene expression profiles following UV exposure in wild-type and SOS-deficient Escherichia coli. Genetics 158, 41–64 (2001). [DOI] [PMC free article] [PubMed] [Google Scholar]
- 37.Thomassen GO et al. Tiling array analysis of UV treated Escherichia coli predicts novel differentially expressed small peptides. Plos One 5, e15356, doi: 10.1371/journal.pone.0015356 (2010). [DOI] [PMC free article] [PubMed] [Google Scholar]
- 38.Lin LL & Little JW Autodigestion and RecA-dependent cleavage of Ind-mutant LexA proteins. J Mol Biol 210, 439–452, doi: 10.1016/0022-2836(89)90121-6 (1989). [DOI] [PubMed] [Google Scholar]
- 39.Richardson JP Preventing the synthesis of unused transcripts by Rho factor. Cell 64, 1047–1049, doi: 10.1016/0092-8674(91)90257-y (1991). [DOI] [PubMed] [Google Scholar]
- 40.Jain S, Gupta R & Sen R Rho-dependent transcription termination in bacteria recycles RNA polymerases stalled at DNA lesions. Nature Communications 10, doi:ARTN 1207 10.1038/s41467-019-09146-5 (2019). [DOI] [PMC free article] [PubMed] [Google Scholar]
- 41.Iyer S, Park BR & Kim M Absolute quantitative measurement of transcriptional kinetic parameters in vivo. Nucleic Acids Research 44, doi: 10.1093/nar/gkw596 (2016). [DOI] [PMC free article] [PubMed] [Google Scholar]
- 42.Rothfuss O, Gasser T & Patenge N Analysis of differential DNA damage in the mitochondrial genome employing a semi-long run real-time PCR approach. Nucleic Acids Research 38, doi:ARTN e24 10.1093/nar/gkp1082 (2010). [DOI] [PMC free article] [PubMed] [Google Scholar]
- 43.Bryant JA, Sellars LE, Busby SJW & Lee DJ Chromosome position effects on gene expression in Escherichia coli K-12. Nucleic Acids Research 42, 11383–11392, doi: 10.1093/nar/gku828 (2014). [DOI] [PMC free article] [PubMed] [Google Scholar]
- 44.Perdiz D et al. Distribution and repair of bipyrimidine photoproducts in solar UV-irradiated mammalian cells. Possible role of Dewar photoproducts in solar mutagenesis. J Biol Chem 275, 26732–26742, doi: 10.1074/jbc.M001450200 (2000). [DOI] [PubMed] [Google Scholar]
- 45.Ikenaga M, Ichikawa-Ryo H & Kondo S The major cause of inactivation and mutation by 4-nitroquinoline 1-oixde in Escherichia coli: excisable 4NQO-purine adducts. J Mol Biol 92, 341–356, doi: 10.1016/0022-2836(75)90233-8 (1975). [DOI] [PubMed] [Google Scholar]
- 46.Zdraveski ZZ, Mello JA, Marinus MG & Essigmann JM Multiple pathways of recombination define cellular responses to cisplatin. Chem Biol 7, 39–50, doi: 10.1016/s1074-5521(00)00064-8 (2000). [DOI] [PubMed] [Google Scholar]
- 47.Wade JT & Grainger DC Pervasive transcription: illuminating the dark matter of bacterial transcriptomes. Nat Rev Microbiol 12, 647–653, doi: 10.1038/nrmicro3316 (2014). [DOI] [PubMed] [Google Scholar]
- 48.Adebali O, Chiou YY, Hu JC, Sancar A & Selby CP Genome-wide transcription-coupled repair in Escherichia coli is mediated by the Mfd translocase. P Natl Acad Sci USA 114, E2116–E2125, doi: 10.1073/pnas.1700230114 (2017). [DOI] [PMC free article] [PubMed] [Google Scholar]
- 49.Kunala S & Brash DE Intragenic Domains of Strand-Specific Repair in Escherichia-Coli. J Mol Biol 246, 264–272, doi:DOI 10.1006/jmbi.1994.0082 (1995). [DOI] [PubMed] [Google Scholar]
- 50.Liam Gaul JQS Transcription-coupled Repair and the Transcriptional Response to UV-Irradiation. DNA Repair, 103208, doi: 10.1016/j.dnarep.2021.103208. (2021). [DOI] [PubMed] [Google Scholar]
- 51.Duan M, Selvam K, Wyrick JJ & Mao P Genome-wide role of Rad26 in promoting transcription-coupled nucleotide excision repair in yeast chromatin. Proc Natl Acad Sci U S A 117, 18608–18616, doi: 10.1073/pnas.2003868117 (2020). [DOI] [PMC free article] [PubMed] [Google Scholar]
- 52.Oh J, Xu J, Chong J & Wang D Molecular basis of transcriptional pausing, stalling, and transcription-coupled repair initiation. Biochim Biophys Acta Gene Regul Mech 1864, 194659, doi: 10.1016/j.bbagrm.2020.194659 (2021). [DOI] [PMC free article] [PubMed] [Google Scholar]
- 53.Velez-Cruz R & Egly JM Cockayne syndrome group B (CSB) protein: At the crossroads of transcriptional networks. Mech Ageing Dev 134, 234–242, doi: 10.1016/j.mad.2013.03.004 (2013). [DOI] [PubMed] [Google Scholar]
- 54.Ghosh-Roy S, Das D, Chowdhury D, Smerdon MJ & Chaudhuri RN Rad26, the Transcription-Coupled Repair Factor in Yeast, Is Required for Removal of Stalled RNA Polymerase-II following UV Irradiation. Plos One 8, doi:ARTN e72090 10.1371/journal.pone.0072090 (2013). [DOI] [PMC free article] [PubMed] [Google Scholar]
- 55.Gregersen LH & Svejstrup JQ The Cellular Response to Transcription-Blocking DNA Damage. Trends Biochem Sci 43, 327–341, doi: 10.1016/j.tibs.2018.02.010 (2018). [DOI] [PMC free article] [PubMed] [Google Scholar]
- 56.Jensen A & Mullenders LHF Transcription factor IIS impacts UV-inhibited transcription. DNA Repair 9, 1142–1150, doi: 10.1016/j.dnarep.2010.08.002 (2010). [DOI] [PubMed] [Google Scholar]
- 57.Li WT & Li SS Facilitators and Repressors of Transcription-coupled DNA Repair in Saccharomyces cerevisiae. Photochem Photobiol 93, 259–267, doi: 10.1111/php.12655 (2017). [DOI] [PubMed] [Google Scholar]
- 58.Mayne LV & Lehmann AR Failure of RNA synthesis to recover after UV irradiation: an early defect in cells from individuals with Cockayne’s syndrome and xeroderma pigmentosum. Cancer Res 42, 1473–1478 (1982). [PubMed] [Google Scholar]
- 59.Proietti-De-Santis L, Drane P & Egly JM Cockayne syndrome B protein regulates the transcriptional program after UV irradiation. Embo J 25, 1915–1923, doi: 10.1038/sj.emboj.7601071 (2006). [DOI] [PMC free article] [PubMed] [Google Scholar]
- 60.Xu J et al. Structural basis for the initiation of eukaryotic transcription-coupled DNA repair. Nature 551, 653-+, doi: 10.1038/nature24658 (2017). [DOI] [PMC free article] [PubMed] [Google Scholar]
- 61.Lee SJ, Sung RJ & Verdine GL Mechanism of DNA Lesion Homing and Recognition by the Uvr Nucleotide Excision Repair System. Research-China 2019, doi:Unsp 5641746 10.34133/2019/5641746 (2019). [DOI] [PMC free article] [PubMed] [Google Scholar]
- 62.Orren DK & Sancar A The (a)Bc Excinuclease of Escherichia-Coli Has Only the Uvrb and Uvrc Subunits in the Incision Complex. P Natl Acad Sci USA 86, 5237–5241, doi: DOI 10.1073/pnas.86.14.5237 (1989). [DOI] [PMC free article] [PubMed] [Google Scholar]
- 63.Zou Y & Van Houten B Strand opening by the UvrA(2)B complex allows dynamic recognition of DNA damage. Embo J 18, 4889–4901, doi: 10.1093/emboj/18.17.4889 (1999). [DOI] [PMC free article] [PubMed] [Google Scholar]
- 64.Verhoeven EEA, Wyman C, Moolenaar GF & Goosen N The presence of two UvrB subunits in the UvrAB complex ensures damage detection in both DNA strands. Embo J 21, 4196–4205, doi:DOI 10.1093/emboj/cdf396 (2002). [DOI] [PMC free article] [PubMed] [Google Scholar]
- 65.Brugger C et al. Molecular determinants for dsDNA translocation by the transcription-repair coupling and evolvability factor Mfd. Nat Commun 11, 3740, doi: 10.1038/s41467-020-17457-1 (2020). [DOI] [PMC free article] [PubMed] [Google Scholar]
- 66.Deaconescu AM, Sevostyanova A, Artsimovitch I & Grigorieff N Nucleotide excision repair (NER) machinery recruitment by the transcription-repair coupling factor involves unmasking of a conserved intramolecular interface. P Natl Acad Sci USA 109, 3353–3358, doi: 10.1073/pnas.1115105109 (2012). [DOI] [PMC free article] [PubMed] [Google Scholar]
- 67.Krieger E & Vriend G New Ways to Boost Molecular Dynamics Simulations. J Comput Chem 36, 996–1007, doi: 10.1002/jcc.23899 (2015). [DOI] [PMC free article] [PubMed] [Google Scholar]
- 68.Orban-Nemeth Z et al. Structural prediction of protein models using distance restraints derived from cross-linking mass spectrometry data. Nat Protoc 13, 1724–1724, doi: 10.1038/s41596-018-0024-7 (2018). [DOI] [PubMed] [Google Scholar]
- 69.Yang J & Zhang Y I-TASSER server: new development for protein structure and function predictions. Nucleic Acids Res 43, W174–181, doi: 10.1093/nar/gkv342 (2015). [DOI] [PMC free article] [PubMed] [Google Scholar]
- 70.Matthew Allen Bullock J, Schwab J, Thalassinos K & Topf M The Importance of Non-accessible Crosslinks and Solvent Accessible Surface Distance in Modeling Proteins with Restraints From Crosslinking Mass Spectrometry. Mol Cell Proteomics 15, 2491–2500, doi: 10.1074/mcp.M116.058560 (2016). [DOI] [PMC free article] [PubMed] [Google Scholar]
- 71.Zhao DD et al. CRISPR/Cas9-assisted gRNA-free one-step genome editing with no sequence limitations and improved targeting efficiency. Sci Rep-Uk 7, doi:ARTN 16624 10.1038/s41598-017-16998-8 (2017). [DOI] [PMC free article] [PubMed] [Google Scholar]
- 72.Baba T et al. Construction of Escherichia coli K-12 in-frame, single-gene knockout mutants: the Keio collection. Molecular Systems Biology 2, doi:ARTN 2006.0008 10.1038/msb4100050 (2006). [DOI] [PMC free article] [PubMed] [Google Scholar]
- 73.Datsenko KA & Wanner BL One-step inactivation of chromosomal genes in Escherichia coli K-12 using PCR products. P Natl Acad Sci USA 97, 6640–6645, doi:DOI 10.1073/pnas.120163297 (2000). [DOI] [PMC free article] [PubMed] [Google Scholar]
- 74.Kitagawa M et al. Complete set of ORF clones of Escherichia coli ASKA library (A complete Set of E. coli K-12 ORF archive): Unique resources for biological research. DNA Res 12, 291–299, doi: 10.1093/dnares/dsi012 (2005). [DOI] [PubMed] [Google Scholar]
- 75.Schneider CA, Rasband WS & Eliceiri KW NIH Image to ImageJ: 25 years of image analysis. Nat Methods 9, 671–675, doi: 10.1038/nmeth.2089 (2012). [DOI] [PMC free article] [PubMed] [Google Scholar]
- 76.Carter JD & LaBean TH Coupling Strategies for the Synthesis of Peptide-Oligonucleotide Conjugates for Patterned Synthetic Biomineralization. J Nucleic Acids 2011, doi:Artn 926595 10.4061/2011/926595 (2011). [DOI] [PMC free article] [PubMed] [Google Scholar]
- 77.Ghosh SS, Kao PM, Mccue AW & Chappelle HL Use of Maleimide-Thiol Coupling Chemistry for Efficient Syntheses of Oligonucleotide-Enzyme Conjugate Hybridization Probes. Bioconjugate Chem 1, 71–76, doi:DOI 10.1021/bc00001a009 (1990). [DOI] [PubMed] [Google Scholar]
- 78.Hermanson GT Bioconjugate Techniques, 3rd Edition. Bioconjugate Techniques, 3rd Edition, 1–1146 (2013).
- 79.Grabarek Z & Gergely J Zero-Length Crosslinking Procedure with the Use of Active Esters. Anal Biochem 185, 131–135, doi:Doi 10.1016/0003-2697(90)90267-D (1990). [DOI] [PubMed] [Google Scholar]
- 80.Staros JV, Wright RW & Swingle DM Enhancement by N-Hydroxysulfosuccinimide of Water-Soluble Carbodiimide-Mediated Coupling Reactions. Anal Biochem 156, 220–222, doi:Doi 10.1016/0003-2697(86)90176-4 (1986). [DOI] [PubMed] [Google Scholar]
- 81.Lu L et al. Identification of MS-Cleavable and Noncleavable Chemically Cross-Linked Peptides with MetaMorpheus. J Proteome Res 17, 2370–2376, doi: 10.1021/acs.jproteome.8b00141 (2018). [DOI] [PMC free article] [PubMed] [Google Scholar]
- 82.Wisniewski JR Label-Free and Standard-Free Absolute Quantitative Proteomics Using the “Total Protein” and “Proteomic Ruler” Approaches. Proteomics in Biology, Pt A 585, 49–60, doi: 10.1016/bs.mie.2016.10.002 (2017). [DOI] [PubMed] [Google Scholar]
- 83.Meyer A et al. Systematic analysis of protein-detergent complexes applying dynamic light scattering to optimize solutions for crystallization trials. Acta Crystallogr F 71, 75–81, doi: 10.1107/S2053230x14027149 (2015). [DOI] [PMC free article] [PubMed] [Google Scholar]
- 84.Chi H et al. Comprehensive identification of peptides in tandem mass spectra using an efficient open search engine. Nat Biotechnol 36, 1059–1061, doi: 10.1038/nbt.4236 (2018). [DOI] [PubMed] [Google Scholar]
- 85.Chen ZL et al. A high-speed search engine pLink 2 with systematic evaluation for proteome-scale identification of cross-linked peptides. Nature Communications 10, doi:ARTN 3404 10.1038/s41467-019-11337-z (2019). [DOI] [PMC free article] [PubMed] [Google Scholar]
- 86.Spivak G & Hanawalt PC Determination of Damage and Repair in Specific DNA Sequences. Methods 7, 147–161, doi: 10.1006/meth.1995.1021 (1995). [DOI] [Google Scholar]
- 87.Dannenmann B et al. Simultaneous quantification of DNA damage and mitochondrial copy number by long-run DNA-damage quantification (LORD-Q). Oncotarget 8, 112417–112425, doi: 10.18632/oncotarget.20112 (2017). [DOI] [PMC free article] [PubMed] [Google Scholar]
- 88.Lehle S et al. LORD-Q: a long-run real-time PCR-based DNA-damage quantification method for nuclear and mitochondrial genome analysis. Nucleic Acids Res 42, e41, doi: 10.1093/nar/gkt1349 (2014). [DOI] [PMC free article] [PubMed] [Google Scholar]
- 89.Zhu S & Coffman JA Simple and fast quantification of DNA damage by realtime PCR, and its application to nuclear and mitochondrial DNA from multiple tissues of aging zebrafish. BMC Res Notes 10, 269, doi: 10.1186/s13104-017-2593-x (2017). [DOI] [PMC free article] [PubMed] [Google Scholar]
- 90.Crowley DJ & Hanawalt PC Induction of the SOS response increases the efficiency of global nucleotide excision repair of cyclobutane pyrimidine dimers, but not 6-4 photoproducts, in UV-irradiated Escherichia coli. J Bacteriol 180, 3345–3352, doi: 10.1128/JB.180.13.3345-3352.1998 (1998). [DOI] [PMC free article] [PubMed] [Google Scholar]
- 91.Koehler DR, Courcelle J & Hanawalt PC Kinetics of pyrimidine(6-4)pyrimidone photoproduct repair in Escherichia coli. J Bacteriol 178, 1347–1350, doi: 10.1128/jb.178.5.1347-1350.1996 (1996). [DOI] [PMC free article] [PubMed] [Google Scholar]
- 92.Kai-Feng H, Sidorova JM, Nghiem P & Kawasumi M The 6-4 photoproduct is the trigger of UV-induced replication blockage and ATR activation. P Natl Acad Sci USA 117, 12806–12816, doi: 10.1073/pnas.1917196117 (2020). [DOI] [PMC free article] [PubMed] [Google Scholar]
- 93.Davis SE et al. Mapping E. Coli Rna Polymerase and Associated Transcription Factors and Identifying Promoters Genome-Wide. Method Enzymol 498, 449–471, doi: 10.1016/B978-0-12-385120-8.00020-6 (2011). [DOI] [PubMed] [Google Scholar]
- 94.Lee C, Kim J, Shin SG & Hwang S Absolute and relative QPCR quantification of plasmid copy number in Escherichia coli. J Biotechnol 123, 273–280, doi: 10.1016/j.jbiotec.2005.11.014 (2006). [DOI] [PubMed] [Google Scholar]
- 95.Epshtein V & Nudler E Cooperation between RNA polymerase molecules in transcription elongation. Science 300, 801–805, doi: 10.1126/science.1083219 (2003). [DOI] [PubMed] [Google Scholar]
- 96.Rossi F et al. The biological and structural characterization of Mycobacterium tuberculosis UvrA provides novel insights into its mechanism of action. Nucleic Acids Research 39, 7316–7328, doi: 10.1093/nar/gkr271 (2011). [DOI] [PMC free article] [PubMed] [Google Scholar]
- 97.Vogel U & Jensen KF NusA is required for ribosomal antitermination and for modulation of the transcription elongation rate of both antiterminated RNA and mRNA. J Biol Chem 272, 12265–12271, doi:DOI 10.1074/jbc.272.19.12265 (1997). [DOI] [PubMed] [Google Scholar]
- 98.Belogurov GA & Artsimovitch I The Mechanisms of Substrate Selection, Catalysis, and Translocation by the Elongating RNA Polymerase. J Mol Biol 431, 3975–4006, doi: 10.1016/j.jmb.2019.05.042 (2019). [DOI] [PMC free article] [PubMed] [Google Scholar]
- 99.Canutescu AA, Shelenkov AA & Dunbrack RL A graph-theory algorithm for rapid protein side-chain prediction. Protein Sci 12, 2001–2014, doi: 10.1110/ps.03154503 (2003). [DOI] [PMC free article] [PubMed] [Google Scholar]
- 100.Duhovny D, Nussinov R & Wolfson HJ 185–200 (Springer; Berlin Heidelberg: ). [Google Scholar]
- 101.Schneidman-Duhovny D, Inbar Y, Nussinov R & Wolfson HJ PatchDock and SymmDock: servers for rigid and symmetric docking. Nucleic Acids Research 33, W363–W367, doi: 10.1093/nar/gki481 (2005). [DOI] [PMC free article] [PubMed] [Google Scholar]
- 102.Bullock JMA, Schwab J, Thalassinos K & Topf M The Importance of Non-accessible Crosslinks and Solvent Accessible Surface Distance in Modeling Proteins with Restraints From Crosslinking Mass Spectrometry. Molecular & Cellular Proteomics 15, 2491–2500, doi: 10.1074/mcp.M116.058560 (2016). [DOI] [PMC free article] [PubMed] [Google Scholar]
- 103.Martin ACR & Porter CT <http://www.bioinf.org.uk/software/profit/> (2009).
- 104.Chen VB et al. MolProbity: all-atom structure validation for macromolecular crystallography. Acta Crystallogr D Biol Crystallogr 66, 12–21, doi: 10.1107/S0907444909042073 (2010). [DOI] [PMC free article] [PubMed] [Google Scholar]
- 105.Severinov K, Mooney R, Darst SA & Landick R Tethering of the large subunits of Escherichia coli RNA polymerase. J Biol Chem 272, 24137–24140, doi:DOI 10.1074/jbc.272.39.24137 (1997). [DOI] [PubMed] [Google Scholar]
- 106.Zhang Y. et al. Structural basis of transcription initiation. Science 338, 1076–1080, doi: 10.1126/science.1227786 (2012). [DOI] [PMC free article] [PubMed] [Google Scholar]
- 107.Opalka N. et al. Complete structural model of Escherichia coli RNA polymerase from a hybrid approach. PLoS Biol 8, doi: 10.1371/journal.pbio.1000483 (2010). [DOI] [PMC free article] [PubMed] [Google Scholar]
- 108.Skubak P. et al. A new MR-SAD algorithm for the automatic building of protein models from low-resolution X-ray data and a poor starting model. IUCrJ 5, 166–171, doi: 10.1107/S2052252517017961 (2018). [DOI] [PMC free article] [PubMed] [Google Scholar]
- 109.Cowtan K. The Buccaneer software for automated model building. 1. Tracing protein chains. Acta Crystallogr D 62, 1002–1011, doi: 10.1107/S0907444906022116 (2006). [DOI] [PubMed] [Google Scholar]
- 110.Emsley P, Lohkamp B, Scott WG & Cowtan K Features and development of Coot. Acta Crystallogr D Biol Crystallogr 66, 486–501, doi: 10.1107/S0907444910007493 (2010). [DOI] [PMC free article] [PubMed] [Google Scholar]
- 111.Murshudov GN et al. REFMAC5 for the refinement of macromolecular crystal structures. Acta Crystallogr D Biol Crystallogr 67, 355–367, doi: 10.1107/S0907444911001314 (2011). [DOI] [PMC free article] [PubMed] [Google Scholar]
- 112.Nakagawa N. et al. Crystal structure of Thermus thermophilus HB8 UvrB protein, a key enzyme of nucleotide excision repair. J Biochem 126, 986–990, doi: 10.1093/oxfordjournals.jbchem.a022566 (1999). [DOI] [PubMed] [Google Scholar]
- 113.Trautinger BW, Jaktaji RP, Rusakova E & Lloyd RG RNA polymerase modulators and DNA repair activities resolve conflicts between DNA replication and transcription. Molecular Cell 19, 247–258, doi: 10.1016/j.molcel.2005.06.004 (2005). [DOI] [PubMed] [Google Scholar]
Associated Data
This section collects any data citations, data availability statements, or supplementary materials included in this article.
Supplementary Materials
Data Availability Statement
Coordinates and structure factors of X-ray crystallography structures determined in the study are deposited in the Protein Data Bank (PDB) under accession numbers listed in Supplementary Table 4. PDBs of the XLMS-driven docking models are available as supplemental material.


