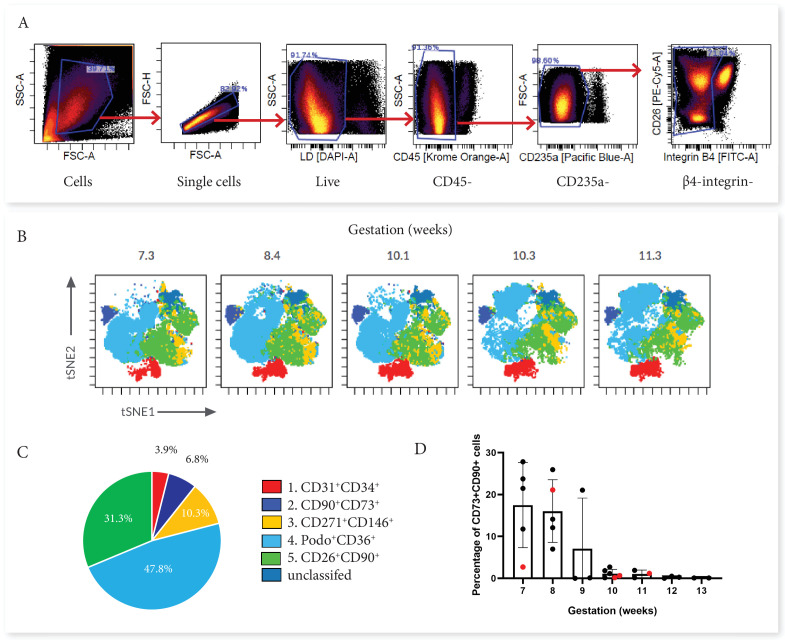
Figure 2. Categorisation of placental villus core subsets using Panel One markers.
(A) Samples were gated to exclude debris, doublets, dead cells, hematopoietic cells (CD45+ and CD235a+), and cytotrophoblasts (β4 integrin). (B) Marker expression was used to categorise five subsets that were overlaid onto viSNE plots generated in Cytobank. (C) The average percentage contribution of each subset is presented as a pie chart. (D) A scatter plot with bars depicting the mean percentage of CD73+CD90+ cells from villous core cells across first trimester analysed on an Aria II (n=24, black) or an Aurora spectral analyser (n=5, red). Error bars represent the standard deviation of the mean.

