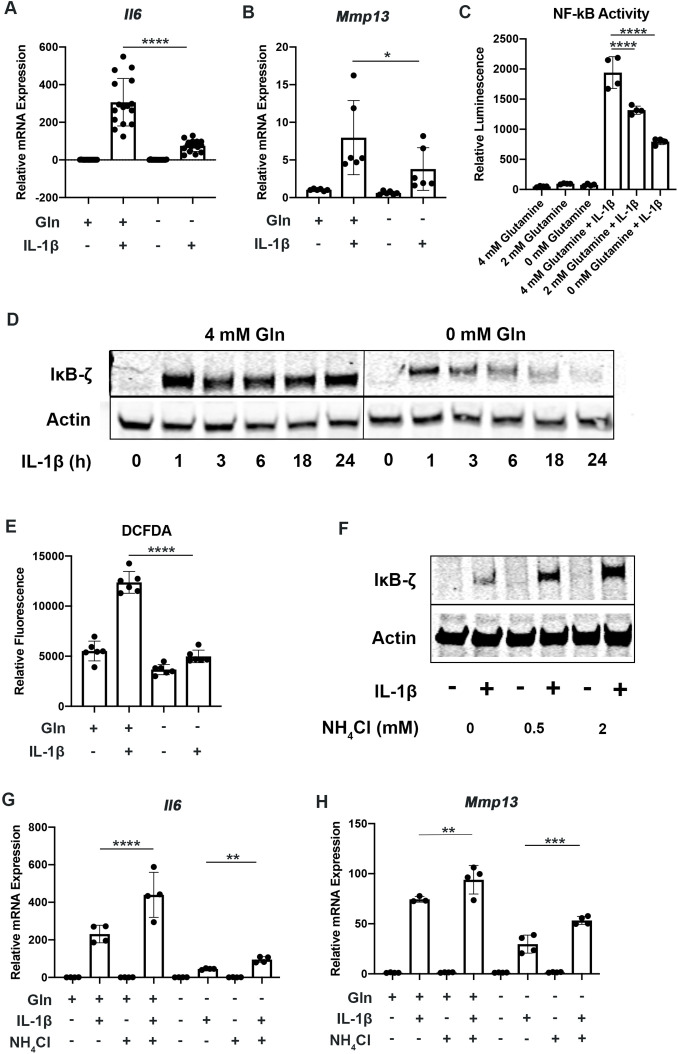
Figure 3. Glutamine deprivation inhibits the inflammatory response.
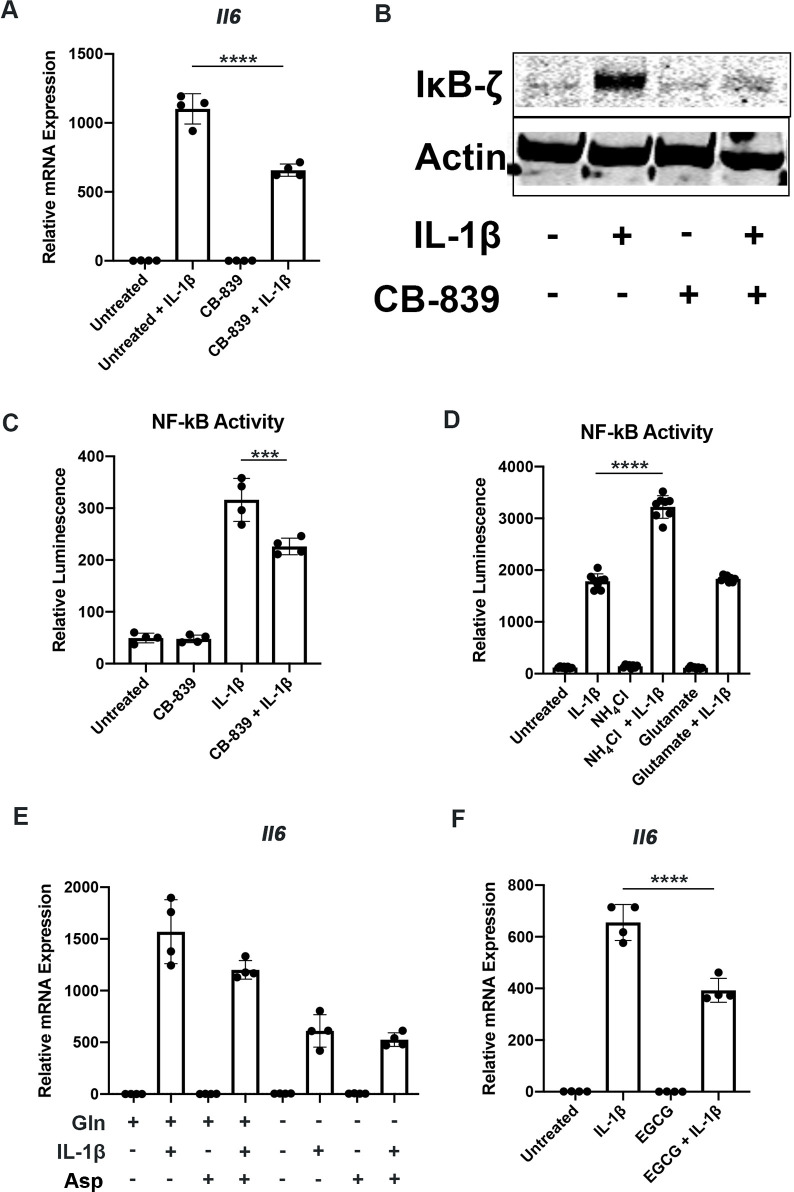
(A–B) Primary murine chondrocytes were cultured in media containing 4 mM glutamine or 0 mM glutamine for 24 hr. Cells were then treated with IL-1β (10 ng/mL) for 24 hr. Gene expression of Il6 and Mmp13 was measured by quantitative PCR (qPCR). One-way ANOVA was performed followed by Tukey’s multiple comparisons test. A:****p<0.0001 (n=16) and B: *p=0.0489 (n=6). (C) Primary murine chondrocytes were isolated from NF-κB-luciferase reporter mice. Chondrocytes were then cultured in media containing 4 mM, 2 mM, or 0 mM glutamine for 24 hr. Cells were then treated with IL-1β for 24 hr. NF-κB activity was measured by luciferase assay. n=4. One-way ANOVA was performed followed by Tukey’s multiple comparisons test. ****p<0.0001. (D) Primary murine chondrocytes were cultured in media containing 4 mM glutamine or 0 mM glutamine for 24 hr. Cells were treated with IL-1β for the indicated timepoints. IκB-ζ protein (85kDa) was measured by immunoblotting, with actin (42kDa) used as housekeeping. Image displays representative experiment. (E) Primary murine chondrocytes were cultured in media containing 4mM glutamine or 0 mM glutamine for 24 hr. Cells were then treated with IL-1β (10 ng/mL) for 24 hr. ROS levels were measured by 2’,7’ –dichlorofluorescin diacetate (DCFDA) assay using microplate reader. n=6. One-way ANOVA was performed followed by Tukey’s multiple comparisons test. ****p<0.0001. (F) Primary chondrocytes were cultured in media containing glutamine and supplemented with ammonium chloride at the indicated concentrations for 24 hr in the presence of IL-1β. IκB-ζ protein was measured by immunoblotting. (G–H) Primary chondrocytes were cultured in media containing 4 mM or 0 mM glutamine for 6 hr. Cells were then supplemented with or without 2 mM ammonium chloride. IL-1β stimulation was performed for 24 hr. Gene expression of Il6 and Mmp13 was measured by qPCR. n=4. One-way ANOVA was performed followed by Tukey’s multiple comparisons test. G: ****p<0.0001, **p=0.0065, and H: **p=0.0096, ***p=0.0005.


