

Summary:
Despite being first described over 50 years ago, periodic discharges continue to generate controversy as to whether they are always, sometimes, or never “ictal.” Investigators and clinicians have proposed adjunctive markers to help clarify this distinction—in particular measures of perfusion and metabolism. Here, we review the growing number of neuroimaging studies using Fluorodeoxyglucose-PET, MRI diffusion, Magnetic resonance perfusion, Single Photon Emission Computed Tomography, and Magnetoencepgalography to gain further insight into the physiology and clinical significance of periodic discharges. To date, however, no definitive consensus exists regarding the features of periodic discharges that warrant treatment intensification. However, an emerging consilience among neuroimaging modalities suggests that periodic discharges can induce a hyperexcitatory state with associated hypermetabolism and hyperperfusion, which may result in local metabolic failure.
Keywords: Periodic discharges, Neuroimaging, SPECT, PET, MRI
Since being first described by Chatrian et al. in 1964, periodic discharges (PDs) have been universally associated with poor neurologic outcomes.1,2 However, more than 50 years later, their causal relationship with neurologic outcomes remains unclear. No definitive consensus explains whether PDs (generalized, lateralized, or bilaterally independent) represent an epiphenomenon of acute neuronal injury (essentially harmless) or an ictal phenomenon (causing harm and potentially warranting intervention)—or both. Although some conceptualize PDs as a form of seizure activity,3 many clinicians adopt a pragmatic context-specific approach that considers PDs ictal only when associated with clinical manifestations or clinically and electrographically responding to treatment. More recently, the Salzburg criteria have operationalized definitions for nonconvulsive status epilepticus (NCSE), in which PDs qualify as NCSE when they occur at >2.5 Hz or when they occur with spatiotemporal evolution typical of seizures, with clinical accompaniments or with an electroclinical response to treatment. These criteria have also defined “possible” NCSE as PDs responding to antiseizure medications (AEDs) but without a high frequency, clear clinical accompaniment, definite evolution, or a clinical response to treatment.4 Definitions of NCSE by the International League Against Epilepsy regard PDs without electrographic spatiotemporal evolution as a borderland condition lacking the features required to meet the criteria for NCSE.5 In the absence of clinical accompaniments or clear response to treatment trials, some practitioners advocate using neuroimaging to dichotomize PDs into ictal and nonictal patterns.6
The idea of an ictal–interictal continuum (IIC) posits that PDs are not binary (ictal vs. nonictal), but instead fall on a spectrum.7 Over the past decades, there is increasing evidence that at least in some cases, PDs demonstrate ictal characteristics.8,9 New data from intracortical depth recordings with cerebral microdialysis monitoring after traumatic brain injury (TBI) reveal that PDs seem to cause metabolic crisis evidenced by the increased lactate/pyruvate ratio.10 A retrospective analysis of 90 comatose patients with high-grade spontaneous subarachnoid hemorrhage undergoing multimodal brain monitoring and scalp EEG concluded that that high frequency PDs may cause further brain injury based on evidence that they lead to increased cerebral blood flow (CBF) and reduced partial pressure of oxygen in the interstitial brain tissue.11
What current criteria and definitions lack are (1) a definition of clinical correlation includes the use of auxiliary tests to diagnose NCSE in sedated, comatose, or neurologically injured patients; and (2) a recognition that electrographic IIC reflects a physiologic continuum, in which neurodiagnostic tests may provide structural, metabolic, or hemodynamic evidence to determine when PDs are and are not leading to secondary brain injury. The aim of using such neurodiagnostic tests in cases of PDs is to identify patterns on the IIC that may benefit from more aggressive therapy in an attempt to minimize further cerebral damage. Neuroimaging abnormalities are seen in 90% to 100% of patients with lateralized PDs (LPDs), most commonly in the acute setting and involving the cortical area with adjacent subcortical structures and in a few cases with subcortical changes.1,12,13 However, most of these studies focus on structural changes and edema associated with the underlying insult that precipitated the PDs. In this review, we focus on physiologic neuroimaging changes more likely to be caused by PDs.
STRUCTURAL/DIFFUSION-BASED IMAGING
MRI/DWI and FLAIR/T2
Seizures often result in transient focal diffusion restriction on diffusion-weighted imaging (DWI) images with corresponding apparent diffusion coefficient (ADC) signal reduction.14–18 These findings result from ictal activity, namely, increased metabolism, hyperperfusion, and cytotoxic edema.15,16 Restricted diffusion (MRI-rd), reflecting cytotoxic edema, is attributed to metabolic failure and insufficient function of sodium/potassium Adenosine Triphosphatease pumps and excess release of excitatory amino acids and their derivatives. Approximately 50% of patients with status epilepticus (SE) have MRI-rd.19 In a recent study, the interval from seizure onset to the first MRI findings showing DWI restriction was 2 to 24 hours.20
In an attempt to guide therapy and gain a better understanding of the nature of PDs, multiple studies and case series have used MRI as an ancillary neurodiagnostic test (Table 1). Such approaches look for similarities between imaging findings in PDs and those seen with seizures and SE, with the assumption that similar imaging findings imply that similar harmful pathophysiological processes are seen in both SE as well as PDs.
TABLE 1.
Summary of the Studies that Reported MRI Brain Findings in Patients With PDs
| Reference Number/First Author | Number of Patients with PDs | Type of the PD (%LPD; %GPD; %BIPD) | Imaging Abnormality | Diagnosis | Treatment Guided by Neuroimagine (AED Yes/No) | Clinical Conclusion |
|---|---|---|---|---|---|---|
| Gurer et al.12 | 71 | 100% LPDs | 77.5% had MRI and rest had CT of the brain. 52.1% acute lesions; 35.2% chronic lesions; 63.4% had concordant findings. 12.7% had no lesions; 64.7% with cortical and subcortical lesions; 11.3% with cortical lesions; 4.2% with subcortical lesions; 5.6% had cortical, subcortical, and deep gray matter (basal ganglia) lesions; and 1.4% had lesion in the putamen | 28.2% stroke; 15.5% herpes encephalitis; 15.5% abscess or tumor; 15.5% epilepsy; 8.5% posttraumatic encephalomalacia; 2.8% anoxic encephalopathy; 2.8% with SSPE, 2.8% meningoencephalitis; 1.4% neuroBehect; 1.4% Listeria monositogenesis infection; 1.4% neuronal migration anomalies; and 1.4% unknown | No | Most LPDs had concordant acute anatomic lesions of the cortical and adjacent subcortical areas. |
| Huang et al.21 | 15 | 20% LPDs; 33% GPDs | LPD group: 66.67% DWI↑; ADC↑; FLAIR↑ 33.33% DWI↑; ADC -; FLAIR↑, enhancement↑; prominent vessels GPD group: 40% DWI↑; ADC -; FLAIR↑, enhancement↑; prominent vessels 20% DWI↑; ADC -; FLAIR↑, enhancement↑; 20% DWI↑; ADC↑; FLAIR-20% DWI↑; ADC↓; FLAIR↑ |
LPD group (33.33% alcohol withdrawal seizure; 33.33% NPH with VP shunt; 33.33% left frontal abscess and SLE: 66.66% with 30 minutes GCSE, followed by 5 hours versus 7 days of NCSE; 66.66% GCSE for 6 hours and later 5 days of mild GCSE. GPD group; 20% alcoholism; 80% old strokes (50% lacunar; 25% ischemic cortical; 25% hemorrhagic). 40% GCSE for 1-5 hours intermittently; 40% GCSE, followed by subtle GCSE; and 20% NCSE |
No | DWI and FLAIR images provided evidence of extent and severity of secondary neuronal injury caused by PDs in patients with SE. |
| Rennebaum et al.23 | 69 | 48% had PDs: 18.8% LPDs; among the 29% some had GPDs | LPDs: 15.4% without MRI-rd; 84.6% had DWI↑ ADC↓ 9% were cortical; 17% both thalamic and cortical; 1% thalamic only (of total patients) GPD group did not have MRI-rd |
All presented with SE; 32% postischemic gliosis; 21% subcortical lesion or multiple pathologies; 16% subdural or intracerebral hemorrhage in history; 11% subacute stroke; 11% cerebral tumor or metastases; 5% no visible lesion; 5% other; and 58% had a history of epilepsy | Unknown | Patients with peri-ictal MRI-rd had LPDs on EEG and different clinical presentation with local cortical metabolic disturbances and occasional seizures. LPDs were associated with chronic rather than acute cortical lesions. |
| Narayan et al.24 | 10 | 100% LPDs | 50% LPDs + electrographic seizures had restricted diffusion. 50% LPDs without seizures had no MRI-rd; DWI↑ ADC↓ | 50% of LPDs had seizures; 20% left frontal encephalomalacia; and 80% no structural lesions. 50% with LPDs no seizures; 20% no structural lesion; 20% nodular heterotopia; 20% left temporal edema with cavernous angioma; 20% left frontal edema with left parietal epidural hematoma and craniectomy; 20$ right intraparenchymal hemorrhage. |
Unknown | MRI could be a good biomarker in patients with PLEDs to indicate risk of seizure occurrence. |
| Newey25 | 11 | 18.2% LPDs; 27.3% GPDs, 9% had GPD + LPD 9% BiPDs | 54.5% of patients had MRI. 100% had DWI↑ ADC↓. All BiPDs had right temporo-parietal subtle MRI-rd (patient had seizures both from the left and right parieto-occipital area). All GPD + LPD combined had MRI-rd in the left more than the right bilateral fronto-temporo-occipital area (seizures arose from the left temporo-occipital region) 1/2 of the LPDs had concordant MRI-rd; 1/3 of GPDs had MRI-rd in the bilateral fronto-temporo-occipital area (seizures were from the right fronto-central) |
100% grade III/IV hepatic encephalopathy with seizures; 54.5% were due to alcohol; 18.2% hepatitis B or C; 18.2% congestive heart failure; 9.1% acetaminophen overdose; and 9.1% pancreatic cancer with portal vein thrombosis. 63.6% of all patients with in SE | Yes | DWI findings displayed cortical-subcortical and cortical abnormalities |
| Bhatt et al.26 | 1 | LPD | Bilateral subcortical edema in the temporo-occipital lobe. No MRI-rd. | Reversible posterior leukoencephalopathy and NCSE due to chemotherapeutic medication | Discontinuation of chemotherapy (etoposide) | Description of an electrographic pattern that could be a predisposing factor to SE and seizures or an indication for structural damage. |
| Skiba et al.27 | 1 | BiPDs at times occurring as GPDs | T2 and FLAIR hyperintense signal in the parieto-occipital area with extension into the temporal lobes with scattered DWI↑ in the posterior regions | PRES in the setting of thrombotic thrombocytopenic purpura-hemolytic uremic syndrome | Yes | PRES is usually reversible but when associated with PDs can have long-term neurologic sequelae |
| Kalamangalam et al.28 | 106 | LPDs | 65.1% MRI (28.3% acute cortical lesion; 17% chronic cortical lesion; 8.5% acute subcortical lesions; 7.5% chronic subcortical lesion; 3.8% normal.; 34.9% CT (12.3% acute cortical lesion; 12.3% chronic cortical lesion; 7.5% chronic subcortical lesion; 2.8% normal) | None mentioned | No | Cortical and subcortical LPDs have distinct morphologies with specific duration and stereotypical morphology |
| Kastrup et al.29 | 17 | 5.9% (1/17) LPDs | MRI showed FLAIR hyperintensities frontal, parietal and occipital subcortical, and marked cortical involvement | PRES with recurrent GTC, followed by two focal motor seizures. | Yes | No clear correlation between EEG and MRI findings. |
| Raroque et al.31 | 39 | 85% LPDs; 15% BiPDs | 82% CT; 18% MRI. 83% of the brain MRI performed had FLAIR hyperintensities 83% of BiPDs have lesions in both hemispheres; 37.5% of LPDs had unilateral lesions; 62.5% had bilateral or diffuse lesions. |
20.5% encephalomalacia; 43.6% atrophy; 30.8% periventricular lucency; 28.1% lacunar infarcts; 33.33% mass effect/effacement; 10.3% extra-axial mass. 59% of the patients had metabolic derangements within 24 hours of EEG. 100% had structural lesions. |
No | First attempt to identify the role of structural lesions and metabolic derangements in the pathogenesis of LPDs and BiPDs. Structural lesions have a more prominent role. |
| Yemisci32 | 37 | 100% GPDs | 75.7% had neuroimaging; 21.4% of these were normal. 64.3% had MRI, and 35.7% had CT. 94.4% of patients with MRI have hyperintensities on T2/FLAIR; 5.6% have hypointense cortical and subcortical lesions. 50% had both cortical and subcortical lesions. 25% had subcortical lesions; 3.6% had cortical lesions. |
59.5% metabolic or infectious etiologies. 29.7% SSPE, 10.8% CJD | No | Attempt to identify structural/anatomic correlates to GPDs. Most patients had underlying structural abnormalities but ~60% of patients presented with metabolic/infectious etiologies. |
| Sinha et al.33 | 30 | 10% LPDs | Normal brain MRI in all LPDs | 100% neurosyphilis and 25% with seizures | Yes | LPDs did not respond to lorazepam but were reversible with treatment of neurosyphilis. LPDs could represent heightened neuronal excitability. |
| Takagaki et al.34 | 2 | LPDs | #1: FLAIR hyperintensities in the cortical region of the anterior bitemporal lobes and subcortical hyperintensity in the posteromedial left frontal lobe without enhancement. #2: Left frontal leptomeningeal enhancement |
100% neurosyphilis; 50% HIV | Yes | Emphasis on consideration of neurosyphilis in the workup of LPDs. |
ADC, apparent diffusion coefficient; AEDs, anti-seizure medications; BiPD, bilateral independent periodic discharge; CJD, Creutzfeld-Jakob disease; CT, Computed tomography; DWI, diffusion-weighted imaging; FLAIR, fluid-Attenuated inversion recovery; GCSE, generalized convulsive status epilepticus; GPD, generalized periodic discharge; GTC, generalized tonic-clonic seizure; LPD, lateralized periodic discharge; MRI-rd, restricted diffusion; NCSE, nonconvulsive status epilepticus; NPH, normal pressure hydrocephalus; PD, periodic discharge; PLED, periodic lateralized epileptiform discharge; PRES, posterior reversible encephalopathy syndrome; SE, status epilepticus; SLE, systemic lupus erythematous; SSPE, subacute sclerosing panencephalitis; VP, ventroperitoneal.
In several case series, patients with PDs initially presented with SE and were found to have regional MRI-rd on DWI sequences that implicated PDs as causing ictal injury with persistence. The International League Against Epilepsy (ILAE) t1/t2 definitions of status recognize SE as a time t2 when seizures result in persistent injury, suggesting that DWI could rule in SE in the absence of seizures on monitoring. Most of these PDs were lateralized with concordant MRI findings. Some of the generalized PDs (GPDs) had MRI-rd.21 Some patients with LPDs had simultaneous and ipsilateral MRI-rd in the thalamus.21–23 Hence, some authors proposed the potential role of the thalamus in generating LPDs.21,23
Narayan et al.24 studied 10 patients with LPDs, 50% of which had MRI-rd on MRI, whereas the rest had a normal brain MRI. Those with MRI-rd had electrographic seizures on their EEG. One patient had bilateral independent PDs (BiPDs) without DWI restriction.24 The author argued that the absence of DWI findings should be a marker that LPDs are not ictal and do not warrant aggressive therapy.24 Newey et al.25 reported 11 patients with hepatic encephalopathy who had electrographic seizures and NCSE on their acute presentation. Sixty-four percent of patients had PDs after cessation of seizures (50% had GPDs and 50% had LPDs).25 All with PDs had concordant MRI-rd on brain MRI.25 All patients had MRI 1 to 4 days after the last documented seizure, and only one had an electrographic seizure while in the MRI.25 The authors proposed that the findings seen on the MRI could be due to ongoing or recent seizures.25
In a study by Rennebaum et al.,23 analysis of 19 patients presenting with SE revealed peri-ictal MRI-rd (89% had concomitant cortical and thalamic restrictions). Fifty-eight (58%) patients had LPDs on EEG along with restriction diffusion on brain MRI. Interestingly, LPDs were often accompanied by both cortical and thalamic DWI findings. They suggested that highly synchronized cortico-thalamic fibers are potential generators of LPDs. Eleven percent of the patients without MRI-rd had GPDs or BiPDs peri-ictally. Huang et al.21 analyzed 15 patients with SE; 53% had PDs (20% with LPDs and 33% with GPDs). Those with LPDs had MRI findings of MRI-rd and hyperintense fluid-attenuated inversion recovery (FLAIR) lesions; two had contrast enhancement.21 Three of these patients also had ipsilateral thalamic findings.21 All with GPDs had MRI-rd, three had FLAIR hyperintensities, and three had contrast enhancement; their MRI findings displayed bilateral cortical involvement without thalamic involvement.21
In addition to MRI-rd accompanying LPDs, a single study reported that 5.2% of patients with LPDs have subcortical white matter (WM) disorders on MRI (e.g., multiple sclerosis and posterior reversible encephalopathy syndrome [PRES]).13,26,27 In a retrospective study that analyzed acute neuroimaging findings in brain MRIs performed within 72 hours of detecting LPDs on EEG, Kalamangalam et al.28 found that 40.5% of patients had acute cortical findings, whereas 8.5% had acute subcortical findings, 29.3% had chronic cortical findings, and 15.1% had chronic subcortical findings. They redemonstrated that lesions seen in the patients with LPDs can be both cortical and subcortical as well as acute versus chronic.28 The authors concluded that acute lesions are the most common structural abnormalities seen in LPDs, whereas chronic lesions, subcortical lesions, and nonlesional scans are not uncommon.28
Kalamangalam et al.28 postulated that LPDs are generated from interconnected networks that generate different oscillations. They observed that LPDs generated from subcortical areas have shorter duration and are more stereotyped.28 In this particular study, the authors did not investigate the ictal nature of the LPDs but rather its potential generators and associated anomalous networks.28 The authors excluded patients who had seizures and LPDs on their EEG.28
Several authors reported patients with PRES presenting with LPDs and concordant MRI findings consistent with PRES.26,27,29 A case series by Kastrup et al.29 studied 49 patients with PRES, of whom one had LPDs on EEG and bilateral symmetric cortical and subcortical FLAIR hyperintensities and edema on brain MRI. Skiba et al.27 reported a patient with a history of recurrent PRES with EEG revealing BiPDs. Concomitantly, on brain MRI, there were T2 and FLAIR hyperintensities in the bilateral parietooccipital regions with extension into the temporal lobes, with diffusion-weighted imaging showing scattered areas of MRI-rd in the posterior regions.27 After resolution of PRES, serial longterm and extended EEGs were normal.27 Bhatt et al.26 also presented a case of PRES with NCSE, with brain MRI revealing bilateral subcortical edema predominantly of the temporo-occipital lobes. EEG at the time of the MRI revealed posterior quadrant PDs that resolved before the normalization of the brain MRI.26
Most retrospective analysis studies reveal that in most cases, LPDs occur in the presence of both cortico-subcortical dysfunctions.12,30,31 In postmortem analysis of 32 patients, Gloor et al.30 revealed that 5% of patients with LPDs had combined gray and WM disease and that only 6% of patients had only gray matter lesions and LPDs. This lead them to conclude that a combination of gray and WM pathology is necessary to generate LPDs.30 Raroque showed that 6/8 patients with LPDs had brain MRI that had both gray and WM structural changes.31 Gurer and colleagues reported 71 adult patients with LPDs on their EEG, 35.2% of which had chronic lesions and the rest were acute.12 Lesions were cortical, cortical-subcortical, and subcortical.12
In terms of GPDs, both cortical and subcortical T2 FLAIR hyperintense MRI changes have been seen without any MRI-rd.32 Yemisci et al.32 studied 37 patients with GPDs. Patients with GPDs (89.2%) had seizures (32.4% were in SE) within 48 hours of the GPD detection. Sixty-four percent of these patients had brain MRIs performed.32 Fifty percent had concurrent cortical and subcortical FLAIR hyperintensities (only one had Herpes simplex virus encephalitis; this patient had cortical and subcortical frontal and temporal contrast enhancement), 25% had subcortical FLAIR hyperintensities, and 3.6% had only cortical findings.32
Very few studies address the natural course of PDs or their response to therapy in relation to MRI findings. Most of the case series document resolution of LPDs with resolution of the underlying acute etiology, with or without treatment of AEDs. Sinha et al.33 described three patients with neurosyphillis and LPDs with normal brain MRIs. The LPDs resolved after antibiotic administration but not after a trial with lorazepam.33 Takagaki et al.34 reported two patients with neurosyphilis presenting with seizures and LPDs, with concordant brain MRI showing FLAIR hyperintensities both in the cortical and subcortical areas. After treating both patients with AEDs and antibiotics, 2-week followup EEG revealed resolution of LPDs along with clinical improvement.34 Chatrian et al.35 reported a patient presenting with SE with EEG revealing low-frequency LPDs and brain MRI showing T1 hypointense and T2/FLAIR hyperintense lesions in the cortical areas without any contrast enhancement. Aggressive treatment with AEDs contributed to rapid reversibility of imaging findings and improvement in clinical examination.35
Advantages of MRI in the assessment of PDs include the ability to identify the extent of anatomic cerebral dysfunction in an attempt to correlate with the underlying structural pathology associated with the discharges such as stroke, infection, PRES, etc. DWI is also an attractive MRI tool to measure the functional effect of PDs, in particular LPDs. Although it is difficult to attribute DWI changes to the ictal nature of the PDs versus primary underlying pathology resulting in a hyperexcitable cortex, nonetheless, it is an attractive sequence because it reflects not only on the metabolic activity or perfusion as many other markers do, but it is also a functional marker, showing the ability of the tissue to meet its metabolic demands. The drawback of MRI is the long duration of the study, limited availability for acutely ill patients, and the DWI sequence provides only a brief snapshot of what is in fact a dynamic process.
METABOLISM
FDG-PET
Another neuroimaging modality that can aid in further defining the nature of PDs and the necessity for treatment escalation is Fluorodeoxyglucose PET (FDG-PET). It measures cerebral metabolism by evaluating glucose uptake. It frequently displays hypermetabolism during seizures and SE.36–38 In most studies, LPDs have been associated with hypermetabolism, whereas GPDs have been associated with both hypometabolism and hypermetabolism (Figs. 1–3). In a single center analysis of 18 patients with patterns falling on the IIC, 78% had PDs, of whom 36% had GPDs and 74% had LPDs.39 Twenty-nine percent of patients with PDs (two LPDs and two GPDs) had hypometabolism on PET, whereas the rest displayed hypermetabolism.39 One patient had improvement in PET hypermetabolism concurrent with resolution of LPDs during burst suppresion, suggesting that PET avidity was a dynamic biomarker not only sensitive to structural repair or inflammation. This study concluded that in patients with cEEG patterns that fall on the IIC, FDG-PET hypermetabolism can serve as a common biomarker of electrographic and electroclinical SE and seizures.39 A second study by Franck et al.40 analyzed 25 patients with seizures, 3 (12%) of whom had LPDs on EEG. Interictally, 80% of patients had hypometabolism on PET; ictal states displayed hypermetabolism and increased CBF.40 All patients with LPDs had increased regional blood flow and local cerebral metabolic rate.40
FIG. 1.
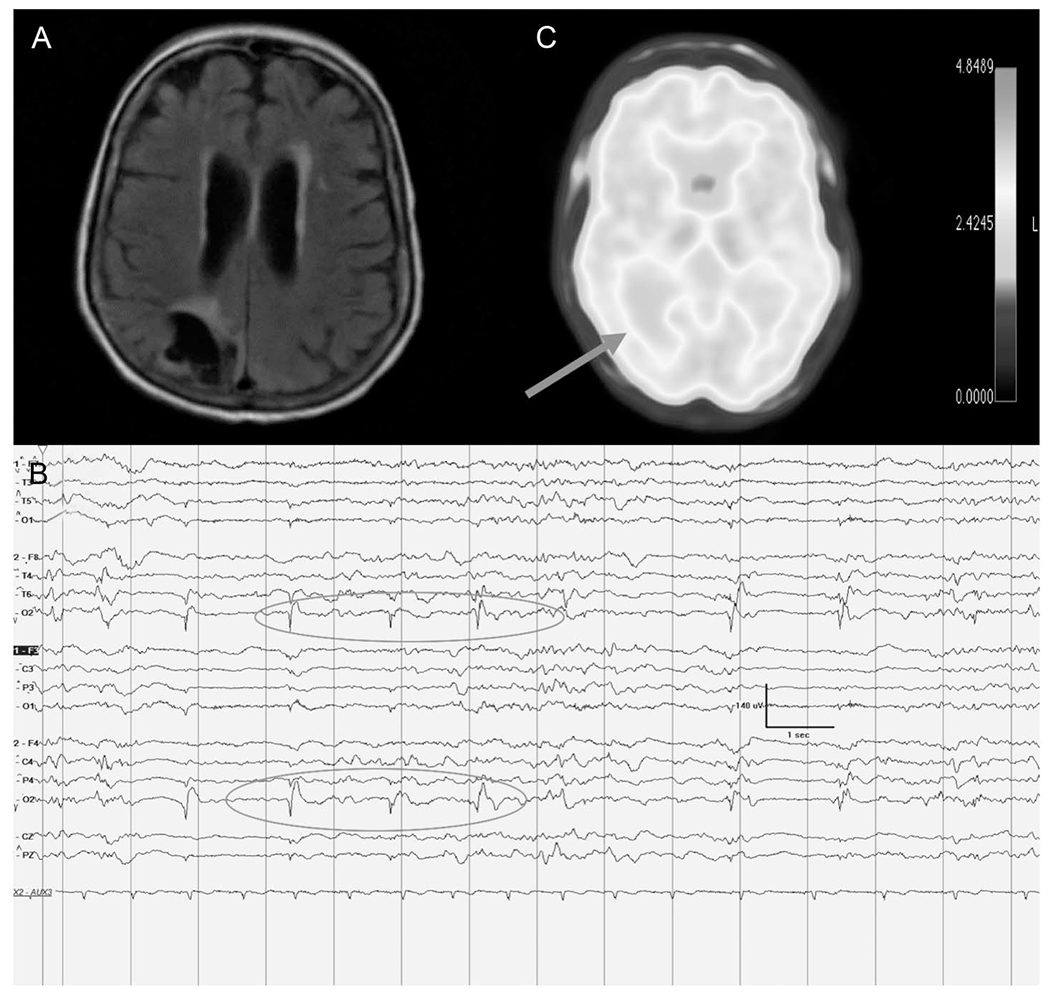
This is the case of a 74-year-old woman who has a history of right occipital ischemic stroke who presented with new-onset convulsive status epilepticus. Convulsions were aborted with anti-seizure medications. A, Brain MRI with axial FLAIR sequence reveals right occipital encephalomalacia with hyperintensity. B, cEEG at the time of the brain MRI displayed near-continuous right occipital low frequency 0.5 to 0.75 Hz LPDs. C, PET was performed to aid with medication management. It displayed hypometabolism in the right occipital area concordant with the MRI and EEG findings (see arrow). The patient’s mild hypometabolism was speculated to represent possible pseudo-normalization from more what would be expected to be a prominent hypometabolism at baseline. Focal status epilepticus was refractory to treatment including resective surgery and she was discharged with palliative goals. Continuous EEG recording is displayed on a bipolar longitudinal montage at LFF 1 Hz, HFF 70 Hz, Notch on, Timebase 30 mm/second. LFF, low frequency filter; LPDs, lateralized PDs; HFF, high frequency filter.
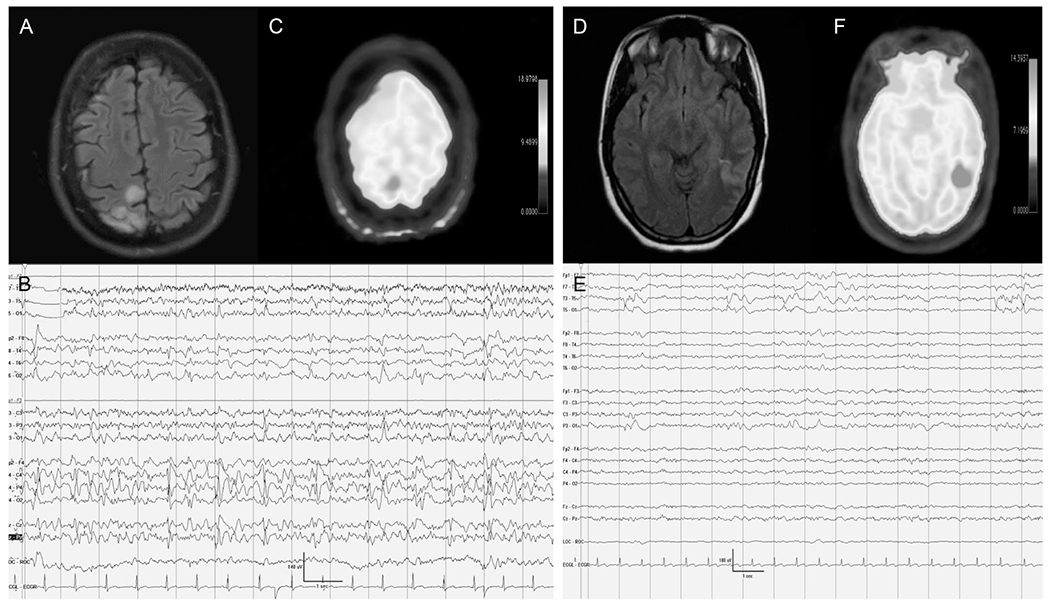
FIG. 3.
A 77-year-old man with hypertension presented with encephalopathy. Figures A–C represent the findings before initiation of IV anesthetics. A, Brain MRI FLAIR axial sequences reveal FLAIR hyperintensities in the left posterior quadrant cortical area in addition to periventricular hyperintense white matter changes. B, Continuous EEG displays bursts of high-frequency left posterior quadrant interrupted by generalized voltage attenuations. C, FDG-PET shows hypermetabolism in the right posterior quadrant concordant with the cEEG and MRI findings. Figures D–F represent the phase where the patient was initiated on IV anesthetics. D, MRI FLAIR axial sequences reveal resolution of the hyperintense cortical ribboning in the left posterior quadrant. E, Continuous EEG shows a burst suppression pattern without any periodic discharges. F, FDG-PET shows resolution of the hypermetabolism. Despite treatment with IV anesthetics and anti-seizure medications, the patient did not improve clinically and was thus transitioned to comfort care measures. FDG-PET, fluorodeoxyglucose-PET.
Other authors have reported patients with LPDs and corresponding PET findings.9,41,42 Few had concordant hypermetabolism that resolved after cessation of the LPDs with neurologic improvement.9,41 Others had focal concordant hypometabolism on PET during the LPDs.42 Administration of AEDs and treatment of the underlying etiology helped resolve the LPDs and improve the clinical state.42 Handforth et al.9 reported a patient presenting with convulsive SE that clinically aborted with AEDs. Persistent encephalopathy was associated with LPDs that displayed focal hypermetabolism on PET. Sakakibara et al.42 reported a single patient with convulsive SE and brain MRI revealing cortical thickening and cortical FLAIR hyperintensities. Five months after SE, LPDs emerged with an unremarkable brain MRI and PET displaying right temporo-parieto-occipital hypometabolism.42 While having LPDs, the patient had hemineglect, and workup revealed autoimmune encephalitis.42 After IV steroids administration, LPDs resolved along with neurologic deficit.42 In another report, Kim et al.41 described a patient with traumatic intracranial hemorrhage with focal motor SE with residual hemiplegia and encephalopathy. EEG had LPDs, and brain MRI revealed cortical concordant encephalomalacia. Administration of anti-seizure medications resulted in resolution of LPDs and clinical improvement.41 PET after LPD resolution displayed left hemispheric hypometabolism.41
The advantage of FDG-PET in the assessment of LPDs is its ability to temporally average the metabolic activity of tissue over the entire uptake period (~ 30–45 minutes), potentially making it a more sensitive marker. FDG-PET also has better spatial resolution than Single Photon Emission Computed Tomography (SPECT) and may be more specific than DWI on MRI. The DWI can be affected by decreased perfusion while PET is less sensitive to these changes, although MRI coupled with perfusion image could abrogate this concern. FDG-PET is also not readily available in many centers limiting its utility.
Cerebral Microdialysis
Over the past few years, evidence has emerged in support of multimodal monitoring in comatose patients with TBIs, intracerebral hemorrhage, and aneurysmal subarachnoid hemorrhage.43–45 Multimodal brain monitoring includes a combination of modalities—intracranial pressure, brain tissue PO2 (PbtO2), and cerebral microdialysis (CMD).43–45 These modalities are intended to diminish secondary cerebral injury by optimizing cerebral perfusion pressure, oxygen therapy, red blood cell transfusion, and metabolic control.43 Lactate–pyruvate ratio (LPR), glutamate, and extracellular glucose are CMD biomarkers of metabolic dysfunction.43,46 Of particular interest to our present topic is the utility of CMD in further understanding cerebral injury mechanisms, namely, subclinical seizures and PDs. This knowledge will be reflected on the clinical ground by optimization of cerebral perfusion and meeting the metabolic demand to prevent secondary ischemia in patients with acute brain injury (ABI).43–45
Nonconvulsive seizures and PDs may further amplify secondary brain insult in patients with ABI,10,43 particularly by resulting in metabolic crisis defined as elevated LPR and decreased extracellular glucose levels10 or brain tissue hypoxia. Causes of metabolic crisis include focal cerebral ischemia, seizures, and inflammation.10 In patients with TBI and subarachnoid hemorrhage, 21% to 25% of patients had electrographic seizures.10 Since more seizures were detected after invasive EEG monitoring in patients with TBI in comparison to the scalp EEG, Vespa et al.10 explored the hypothesis whether high rates of metabolic crisis were associated with the rates of the seizures detected on depth EEG. Using both surface and intracortical EEG recordings as part of the CMD paradigm, Vespa established a correlation between seizures and metabolic crisis.10 Similarly, pathological spreading depressions can result in significant cerebral metabolic disturbance evidenced by alterations in CMD biomarkers as reduced extracellular glucose and elevated LPR and glutamate levels.47–49 Vespa et al.50 analyzed 20 patients with moderate to severe TBI, with each undergoing continuous EEG monitoring as well as CMD. Ten patients had seizures and seven of 10 had SE.50 These resulted in episodic increases in intracranial pressure and LPR when compared with patients without seizures.50 These findings provided further impetus to better understand and treat patients with ABI. In his last work, Vespa et al. analyzed a total of 34 patients with TBI. Twenty-one of 34 had either electrographic seizures (23.5%) or PDs on depth EEG (38.2%).10 None of the PDs had clinical accompaniments. Cerebral microdialysis was performed in 20/34 patients. They concluded that PDs have similar metabolic crisis profile compared with seizures. Thus, clinicians have to approach PDs and seizures similarly and appropriately and adequately treat patients with ABI.
PERFUSION
SPECT
SPECT is used to study regional CBF, a marker of functional impairment. Increased localized isotope uptake occurs during ictal events (hyperperfusion), whereas a decreased isotope uptake could be seen interictally and postictally (hypoperfusion).51 It must be noted that SPECT is not reflective of seizure activity per se, but it reflects increased neuronal activity that could be secondary to an ictal event.52 Nonetheless, in focal seizures, 69% to 93% of the ictal SPECTs identified the ictal focus. Some believe that functional impairment in cerebral disease can precede structural abnormalities.53 For this reason, SPECT is a good tool to detect such functional abnormalities, especially when the brain MRI is unremarkable or lags in findings.
Lee et al.54 investigated the patterns of ictal perfusion and related clinical factors using SPECT in 61 patients who had epilepsy surgery. The authors classified the ictal perfusion patterns into focal hyperperfusion, hyperperfusion plus, combined hyperperfusion-hypoperfusion, and focal hypoperfusion.54 Some patients were observed to have ictal hypoperfusion at the epileptic focus, with ictal hyperperfusion in the neighboring brain regions where ictal discharges propagated.54 They proposed that a focal ictal hyperperfusion and hypoperfusion localizes an epileptic focus.54 The ictal hypoperfusion is likely to be an intraictal early exhaustion of seizure focus or a steal phenomenon associated with the propagation of ictal discharges to the neighboring areas.54
Several studies have used SPECT to elucidate the clinical significance of PDs in patients with neurologic deficits because of various etiologies. Lateralized PDs have been reported to be associated with hyperperfusion on SPECT (Table 2).55 This finding has been attributed to either being a marker of functional impairment or representing a form of focal SE.55,56 Among the studies that reported hyperperfusion on SPECT, concordant with LPDs is the study performed by Assal et al.55 He studied 18 patients who had hyperperfusion during SPECT.55 The areas of hyperperfusion were more restricted than the field of LPDs seen on scalp EEG.55 Resolution of LPDs was associated with focal hypoperfusion.55 Forty-four percent of the patients had acute findings on their neuroimaging (stroke, hemorrhage, and tumor), whereas others had old findings.55 The authors hypothesized that the increased CBF is due to abnormal vasodilatation that may be the result of a decreased oxygen extraction fraction.55 They believed that LPDs were the metabolic sign of partial neuronal damage with reparative capacity.55
TABLE 2.
Summary of the Studies that Reported SPECT Findings in Patients With PDs
| Reference Number | Number of Patients | Type of PD (%LPD; %GPD; %BIPD) | Imaging Abnormality | Diagnosis | Treatment Based on Neuroimaging (Yes/No) | Clinical Conclusion |
|---|---|---|---|---|---|---|
| Zeiler et al.52 | 1 | 100% focal SIRPDs | SPECT: Normal. MRI/MRA and DSA of brain and vessels normal except for chronic occlusion in the left ICA at origin of bifurcation with extensive collateral flow from the right hemispheric vasculature. | Respiratory arrest with recovery 3 days later with persistent focal neurologic findings. | Yes | SIRPDs could have inhibitory effect resulting in “Todd’s like paralysis effect.” They debated whether the normal SPECT could represent a pseudonormalized pattern and be hypoperfused in states of no SIRPDS |
| Aye53 | 1 | 100% LPDs | SPECT: reduction in CBF in the frontal regions Brain MRI: T2 hyperintensities in the thalamus, basal ganglia and frontal subcortical regions. |
Cerebral lupus + seizure and frontal lobe dysfunction | Yes | LPDs as biomarkers for functional impairment |
| Assal et al.55 | 18 | 100% LPDs | SPECT: 100% hyperperfusion (↑CBF) with 94% concordance with the maximal point of LPDs. 38.9% of patients had very adjacent hypoperfusion (↓CBF) Repeat SPECT in only 16.7% of patients who had clearance of LPDs, showed resolution of hyperperfusion | 100% presented with seizures. 5.6% had focal motor SE. 27.8% had atrophy and WM changes; 44.4% had stroke (hemorrhage; ischemic); 5.6% had subdural hematoma; 16.7% had tumor. C-morbidities include the following: 11.1% had dementia; 50% had alcoholism (44.4% of which had hepatic cirrhosis due to alcoholism) | No | Hyperperfusion on SPECT with LPDs could reflect a form of EPS |
| Ergun et al.56 | 1 | 100% LPDs | Brain MRI: left parietal stroke with left thalamic hematoma SPECT + LPDs: concordant ↑CBF. SPECT after resolution of LPDs: concordant ↓CBF | Stroke and focal motor seizures | Yes | LPDs could be ictal |
| Lee et al.57 | 1 | 100% LPDs | MRI: left temporal atrophy; and mild diffuse cerebral atrophy. SPECT during LPDs: ↑CBF concordant with the maximal point of the LPDs. SPECT after resolution of LPDs: ↓CBF concordant with previous area of hyperperfusion and occurrence of LPDs | Alcohol and phenytoin withdrawal | Yes | LPDs are manifestations of abnormal enhanced neuronal activity, which is clinically evidenced by deficits and seizures |
| Bozkurt et al.58 | 1 | 100% LPDs | MRI postsurgical: temporal lobectomy along with residual posterior hippocampal anomalies SPECT (72 days after surgery) hyperperfusion in the right temporal region concordant with LPDs. Repeat SPECT after resolution of LPDs: hypoperfusion | Mesial temporal lobe epilepsy status after hippocampectomy | Unknown | SPECT is a helpful tool to assess the ictal nature of LPDs. |
| Ali et al.59 | 1 | 100% LPDs | Contrasted brain MRI at the time of LPDs was normal. SPECT during LPDs: ↑CBF concordant with LPDs SPECT after resolution of LPDs: ↓CBF concordant with the area of previously noted LPDs |
Metastetic brain tumor status after resection presented with GTCs and later was in NCSE. She comatose despite optimal treatment. | Yes | SPECT played a role in differentiating the nature of the LPDs and guide further therapy |
| Kan et al.60 | 1 | 100% GPDs | Brain CT: ventriculomegaly with dilatation of cortical sulci. Serial brain CT: worsening diffuse cerebral atrophy especially in deep gray matter areas. SPECT x2: Global cerebral hypoperfusion in comparison to the cerebellum and brainstem. Last SPECT: less marked difference in perfusion between the cerebellum/brainstem and cerebrum |
CJD | No | Presence of GPDs necessitates concordant cerebral pathological/anatomic dysfunction. |
| Shih et al.61 | 1 | 100% GPDs | Brain CT: normal. SPECT: hypoperfusion in the left frontal and left parieto-temporal areas. |
CJD-autopsy confirmed | No | SPECT could provide evidence of regional neurochemical and neurophysiological dysfunction and guide in further diagnostic tests as biopsy |
| Smith et al.62 | 2 | 100% SIRPDS #1: Initially GPDs CP predominant and later transforming into SIRPDS that were GPDs with CP maximal point #2: LPDs with fast activity at times consistent with NCSE that later subsided and SIRPDs emerged that were focal (left hemispheric PDs) | #1: Brian MRI x2 (during GPD and SIRPDs) DWI sequence showed subtle bithalamic hypoxic injury with global edema #1: SPECT with and without SIRPDs: neither hypo- nor hyperperfusion and without asymmetries #2: Brain CT: ASAH and IPH with subfalcine herniation, SDH, and obstructive hydrocephalus #2: SPECT during SIRPDs: left hemisphere broad focal hypoperfusion without hyperpefusion | #1: ASAH and IPH + NCSE #2: Cardiac arrest + electrographic seizures | Yes | SPECT assists in guiding treatment in EEG patterns that fall on the IIC pattern. |
ASAH, aneurysmal subarachnoid hemorrhage; CBF, cerebral blood flow; CJD, Creutzfeldt-Jakob disease; CP, centro-parietal; CT, computed tomography; DSA, digital subtraction angiography; DWI, diffusion-weighted imaging; EPS, epilepsia partialis continua; GPD, generalized periodic discharge; GTC, generalized tonic-clonic seizure; ICA, internal carotid artery; IIC, ictal–interical continuum; IPH, intraparenchymal hemorrhage; LPD, lateralized PD; MRA, magnetic resonance angiography; NCSE, nonconvulsive status epilepticus; PD, periodic discharge; SDH, subdural hematoma; SIRPD, stimulus-induced rhythmic, periodic, or ictal discharge; WM, white matter.
Several other reports have been published with similar findings where the brain MRI was normal, the patient had acute neurologic deficits, and EEG revealed LPDs.57–59 Electroclinical improvement was time locked with resolution of hyperperfusion on SPECT.57 Another report described a patient with mesial temporal lobe epilepsy undergoing right anterior temporal lobectomy with hippocampectomy.58 About 3 months postsurgically, the patient developed LPDs, and the SPECT revealed congruent hyperperfusion with surrounding hypoperfusion. Resolution of LPDs resulted in regional hypoperfusion.58 Ali et al.59 reported a case where SPECT was used to guide escalation of therapy in a patient with a metastatic cerebral tumor status after resection who presented with focal clinical SE with cEEG revealing LPDs after clinical cessation of ictal activity. After treatment, LPDs resolved, and SPECT revealed resolution of previously seen hyperperfusion.59 Ergun et al.56 reported a patient with acute cortical stroke with thalamic hematoma who presented with focal motor seizures and LPDs on EEG. SPECT showed concordant hyperperfusion with involvement of the basal ganglia.56 The authors speculated that the basal ganglia could possibly be involved in LPD generation and that LPDs likely represent the penumbra zone.56
A few reports have described hypoperfusion on SPECT seen along with concordant PDs.60 Some cases were associated with subcortical WM changes on the brain MRI, whereas others had subacute-onset progressive dementia such as Creutzfelt–Jakob disease (CJD).53,61 Kan et al.60 reported patients with CJD who had GPDs in the middle of their third stage (last stage or advanced stages of CJD). SPECT revealed global hypoperfusion because the GPDs were diminishing in frequency and amplitude.60
Few authors have used SPECT perfusion studies to identify the epileptic nature of stimulus-induced rhythmic periodic ictal discharges and to guide medication management. Smith et al.62 reported on two such patients. One had global unilateral hemispheric hypoperfusion concordant with the side of the low frequency LPD.62 This patient had intracerebral hemorrhage, and SPECT was helpful in maintaining the same therapy without escalation and resulted in favorable outcome (patient discharged to rehabilitation).62 The second patient had cardiac arrest and developed postanoxic MRI findings including DWI changes in bithalamic areas with global edema.62 After aggressive therapy that aborted SE, the patient had emergence of stimulus-induced rhythmic periodic ictal discharges consisting of GPDs.62 During stimulus-induced GPDs, there was no hyperperfusion.62 This led to descalation of therapy.62 Another study by Zeiler et al.52 demonstrated the utility of SPECT in a patient with postcardiac arrest who had occlusion of the internal carotid artery with collateral blood flow and no infarct on brain MRI. The patient had neurologic deficits, and during arousals, the EEG revealed arousal-induced periodic and rhythmic patterns.52 She had SPECT to help determine whether the patterns were ictal or not.52 Injection was administered 5 seconds after stimulus-induced rhythmic periodic ictal discharges.52 On SPECT, there was no hyperperfusion seen in the left temporal area.52 Also, MRI did not show MRI-rd.52 The AEDs were continued without any escalation and her symptoms gradually improved.52 Her multiple MRIs did not reveal any acute stroke.52
SPECT suffers from poor spatial resolution and only captures a relatively brief snapshot of perfusion. The absence of a clearly defined interictal period in many patients with LPDs (because LPDs are often continuous) makes subtraction imaging impossible, furthering the complications of SPECT imaging. SPECT also has limited availability.
MR Perfusion
Hyperperfusion on Magnetic resonance (MR) is likely an ictal phenomenon rather than interictal, whereas hypoperfusion correlates with the postictal or interictal period.63,64 Hyperperfusion is likely due to the energy demand and the autoregulation of vessels.21 It is also hypothesized that an increase in CBF in areas showing LPDs may indicate a healthy response, allowing neurons to get required blood and oxygen.6 Venkatraman65 presented two cases, in which MR perfusion findings aided in treatment. The first patient had focal neurologic deficits, with cEEG revealing continuous LPDs.65 MR perfusion displayed concordant hyperperfusion. The patient displayed unilateral paresis that improved after aggressive therapy.65 The second patient was admitted with continuous unilateral myoclonic movements, with cEEG showing LPDs time-locked with myoclonic movements.65 MRI perfusion did not show hyperperfusion.65 Anti-seizure medications were down-titrated and discontinued. Subsequently, EEG showed resolution of LPDs.65 MR perfusion is a promising modality when coupled with DWI, FLAIR, and ADC.65 The major drawbacks are scanning time and difficulty of prolonged imaging time in critically ill patients.65
Measurement of Cerebral Blood Flow by Invasive Thermodilution Probe
Cerebral blood flow and metabolism changes are associated with LPDs, and both are associated with cortical spreading depolarizations (CSDs) associated with ABI. Cortical spreading depolarization are pathological and massive (1–2 mV) electrophysiological waves of depolarization that travels along the grey matter at an ultra-slow rate of 2–5 mm/minute.66 They occur in approximately 50% of patients with ABI from TBI, subarachnoid hemorrhage, intracerebral hemorrhage, and hemispheric ischemic stroke.67 Recovery from CSD depends on CBF and an appropriate metabolic match to the NA/K pump. The CSD represent the pathophysiological disruption of the “viable gray matter.”47,68 Negative direct waves of the CSD invade the poorly perfused penumbra and result in further depolarizations of the peri-infarct area and subsequently more damage and expansion of the infarcted core.47,68–70 Several studies have associated CSD with poor outcome.66,71 In addition, CSD has been implicated in lesional expansion in patients with ABI.47,66,68 In a single study of 53 patients with acute TBI, Hartings et al.66 found out that the occurrence of CSD in acute TBI is associated with worse clinical outcomes. In eight of nine patients, there were prolonged depolarizations that were associated with PDs on electrocorticography.66 The prolonged depolarizations likely reflected poor tissue perfusion and lesional expansion.66 Hinzman et al.49 studied 16 patients with TBI who underwent subdural electrode strip in the perilersional cortex along with cerebral microdialysate study. Their data showed that CSD is involved in secondary brain injury along with glutamate excitotoxicity and severe metabolic crisis (LPR ratio elevation) in patients with severe TBI.49
Few studies have correlated CSD with MRI findings, in particular DWI.72 Hartings et al.72 studied 23 patients with ruptured anterior communicating aneurysm who underwent clipping. Patients had brain MRI 24 to 48 hours of aneurysm treatment.72 Cortical spreading depolarization is seen mainly in patients with focal brain lesions with more prolonged depressions.72 In this study, a correlation was made between the neuroimaging findings of focal lesions (ischemic infract and intracerebral hemorrhage) versus nonfocal brain lesions and the CSD.72 Peak CSD per day was higher in patients with infarct in comparison to nonlesional patients.72 Hartings et al.72 confirm an association between CSD and early brain lesions as infarcts. They suggested the use of Electrocorticography as a diagnostic marker for early brain injury in cases where there is no evident brain lesion on neuroimaging.72,73 De Crespigny et al.74 displayed a decrease in the ADC sequences during CSD propagation patterns in rats with normal cerebral perfusion. In another study by Busch et al.,70 DWI sequences revealed that the peri-infarct depolarizations resulted in further expansion of the cerebral infarct in rats.
Optical Imaging
Functional near-infrared spectroscopy (f-NIRS) is a promising noninvasive optical imaging modality that permits continuous monitoring of cerebral tissue oxygenation, which reflects cerebral hemodynamics. It can be performed at the bedside in the epilepsy monitoring unit and in neurocritical care units simultaneously with scalp EEG recordings. Simultaneous f-NIRS and PET measurements show that changes in cerebral oxygenation correlate with changes in regional CBF.75 There is no study to date that has investigated the utility of f-NIRS in PDs. All previous studies have studied the clinical feasibility of f-NIRS in patients with epilepsy. So far, all data have been promising.
Peng et al76 have been working on implementing long-term EEG-f-NIRS acquisition at the bedside in both the epilepsy units and the neurologic intensive care units. In their study, Peng et al76 revealed that nonperiodic interictal activity seen in the 62% of patients with neocortical epilepsy has significant reduction in cerebral oxygenation corresponding to the interictal foci. Sokol et al.77 measured cerebral oxygenation preictally, peri-ictally, and postictally in 17 seizures. Their study revealed a change in cerebral oxygenation from preictal baseline in all seizures except one.77 The focal seizures displayed an increase in baseline oxygenation and the generalized ones had a decrease in cerebral oxygenation.77 Watanabe and Nguyen et al. also showed increased cerebral blood volume after ictal onset.78–80 It is noteworthy that electrographic seizures either had no changes in cerebral oxygenation or less pronounced changes. This finding will ultimately be incorporated in future analysis of PDs in comatose/sedated patients, who do not display definitive clinical findings. This subgroup of patients will require a careful analysis to prevent underestimation of their EEG-f-NIRS findings.
All these findings serve as a potential tool in evaluating the PDs and whether they are associated with increased cerebral oxygenation. Functional near-infrared spectroscopy is an exciting technique because it allows real-time continuous monitoring of LPDs, which in the acute setting are a dynamic process. Drawbacks are primarily limited brain coverage and sparse spatial sampling.
MEG
Magnetoencepgalography (MEG) measures magnetic fields associated with intracellular current flow within the neurons. MEG has a promising future role in identifying neuronal networks involved in the generation of PDs, particularly LPDs. It offers a detailed spatial and temporal understanding of the neuronal networks involved in the generation and propagation of PDs.81,82 Recently published studies have dichotomized LPDs into lesional and nonlesional cases.82 In cases of LPDs that have concordant structural anomalies on brain MRI or computed tomography, MEG reveals that PDs arise from the interface between the lesion and the surrounding normal cortex rather than within the lesion itself.82 In the nonlesional cases, the temporal lobes were implicated in the generation of LPDs.82 The morphology of LPDs has been consistent both on MEG and EEG.82
Hisada reported a patient with metastatic right parietal adenocarcinoma who had right hemispheric PDs on EEG.83 Brain MRI revealed T2/FLAIR hyperintense lesions in the right parietal lobe.83 SPECT demonstrated hypoperfusion in the area surrounding the lesion, which was concordant with MEG findings that showed dipoles in the perilesional area.83
Two studies confirmed the presence of perilesional epileptic networks in focal lesional patients.81,82 Burdette et al.81 investigated the utility of MEG in detecting neuronal activity underlying the LPDs. Their MEG results were coregistered with MRI findings.81 Twelve patients with epilepsy and LPDs on their EEG underwent MEG.81 Seventy-five percent had structural brain lesions, with MEG revealing LPDs arising from the perilesional area rather than within the lesion itself.81 In nonlesional patients (25%) and those with SE, coherence imaging suggested that epileptogenic networks involved the temporal lobe structures that may not be seen on EEG.81 This could potentially indicate propagation of LPDs associated with the patient’s highly epileptogenic state.81 The study revealed that MEG is a sensitive noninvasive test that would detect LPDs emerging from the damaged cortex.81
Shvarts et al.82 studied 13 patients with LPDs on their cEEG. Seventy-seven percent of patients had SE before clinical stabilization and evolution of the electrographic patterns to LPDs. In patients with structural pathologies on brain MRI/computed tomography, MEG showed that LPDs emerged from the area surrounding the lesion rather than the lesion itself.82 In nonlesional patients, LPDs were localized maximally to the temporal lobes regardless of EEG scalp localization.82 These patients had acute/subacute subcortical diffuse signal abnormalities and diffuse subcortical chronic abnormalities.82 This is likely due to the presence of independent networks responsible for generating and maintaining focal SE.82
A single study addressed the genesis and propagation of PDs in patients with subacute sclerosing panencephalitis (SSPE) using MEG and EEG. Velmurugan et al.84 recruited five patients with SSPE and myoclonus who had GPDs. The magnetic source imaging and electric source imaging revealed the onset of discharges from the thalami or inusla.84 Mean source localization at the earliest peak in magnetic source imaging was in the pericentral gyrus, whereas in electric source imaging in the frontal cortex.84 The MEG observations mirrored the EEG findings.84 Their analysis revealed that the discharges originated in the thalami and insula and subsequently propagated to the anterolateral cortical surfaces to the same site of onset.84
MEG is potentially useful for source localization of LPDs. However, for differentiating ictal from nonictal PDs, it is of limited utility for both practical and physiologic reasons.
DISCUSSION
Neuroimaging using PET, MRI, or in some cases SPECT can identify associated structural and metabolic anomalies, including cortical, thalamic, and other subcortical regions impacted by LPDs. Identifying the regions and severity of hypermetabolism or injury via neuroimaging might help contextualize clinical examination findings in relation to neurophysiologic findings and may increase the confidence that a patient’s LPDs represent “ictal” activity by providing evidence of hypermetabolism, hyperperfusion, or secondary tissue injury.
MRI is the most commonly available neuroimaging test in most institutions relative to other modalities. It can be used in multiple strategies. One approach is to identify if there is associated MRI-rd, which might imply that PDs are behaving in an ictal manner resulting in tissue injury. Hence, optimization and more aggressive treatment might follow a positive MRI finding. The outcome of treatment could be followed clinically, electrographically, or even by repeating the brain MRI and demonstrating the resolution of MRI-rd. There is a lack of studies that use MRI (DWI/ADC and FLAIR sequences) to determine the clinical, neuroimaging, and electrographic outcome of treating PDs with AEDs. Isolated changes in DWI/ADC are nonspecific, but when coupled with local increased perfusion, the likelihood of an ictal pathophysiology is increased.
Metabolic imaging can be used to help evaluate PDs falling on the IIC. Because hypermetabolism on FDG-PET has been associated with ictal states because of increased cerebral metabolic demand, hypermetabolism on FDG-PET concordant with PDs could be considered ictal in a comatose/sedated patient with minimal suspicious clinical accompaniments. This in itself would serve as a marker for treatment outcome in patients whose PDs are on the IIC without definitive clinical correlates. The major advantage of FDG-PET is the long uptake period, which offers the ability to temporally sum the metabolic activity. This may be relevant if PDs are intermittent rather than continuous. Studies using SPECT show hyperperfusion with concordant EEG PDs; some describe hypoperfusion potentially related to postictal hypometabolism in the setting of brief temporal resolution. Based on studies in candidates with focal epilepsy surgery, it may be that hyperperfusion is more closely aligned with ictal pathology, whereas hypoperfused regions represent more benign PDs.
Little data exist pertaining to MR perfusion studies in patients with acute or chronic LPDs. MR perfusion when coupled with DWI/FLAIR is a promising and widely available test. This will not only identify the structural pathology but will also provide evidence of functional impairments.
MEG has a promising role in research efforts to identify neuronal networks involved in the generation of PDs but is not readily available in the in-patient setting. Evidence to date suggests that in lesional cases, LPDs originate from the interface between the lesion and the surrounding normal cortex rather than within the lesion. In nonlesional cases, the temporal lobes have been implicated in the generation of LPDs. Nevertheless, MEG studies have not clarified whether PDs are ictal versus nonictal.
CONCLUSION
Multimodal and Iterative Approach to PD Diagnosis and Management
PDs exist on a continuum of both electrographic features such as duration, frequency, and prevalence, as well as physiologic factors such as perfusion, metabolism, and inflammation, which may relate to both a baseline patient state as well as temporal context. Together, these electrographic and physiologic features associated with PDs may induce secondary neuronal damage and/or reversible or irreversible neurologic deficits. Because a multimodal approach seems to reveal physiologic variation beyond what can be inferred from scalp EEG features alone, a multimodal approach may better discriminate which patients with PDs would benefit from more aggressive pharmacologic treatment. Any approach should be tailored to the patient’s presentation, comorbid risk factors, and dynamic clinical needs.
At this stage, guidelines for universal treatment of LPDs would be premature, but it would be appropriate to expand the terminology “clinical correlation” of PDs to two chief axes. First, an axis of metabolic classification should expand from semiologic correlation to diverse modalities including intermittent “electro-radiologic” correlation, dynamic “electro-metabolic” physiologic correlation, or scalp–depth electrophysiologic correlation. Second, an axis of treatment responsiveness should allow for classifying LPDs according to their change after a trial of therapy. By enriching the classification to a multimodal and interative classification, we hope that identification of distinct diagnostic phenotypes will improve the understanding of appropriate management of LPD activity in clinical practice and clinical trials.
FIG. 2.
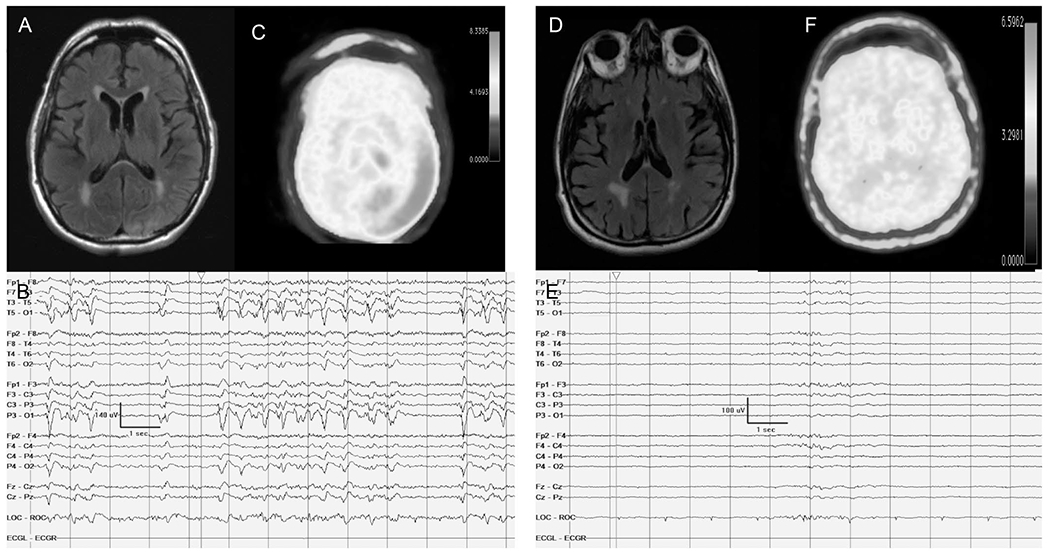
Focal hypermetabolism seen on FDG-PET that is concordant with PDs on cEEG. Case #1 (A–C): A 32-year-old woman with a history of focal epilepsy related to the underlying perinatal stroke presented with clonic movements consistent with epilepsia partialis continua. A, Brain MRI FLAIR axial sequence revealed right frontal lobe postsurgical changes, with FLAIR hyperintense findings seen in the right occipital lobe. B, continuous EEG showed continuous LPDs in addition to a breach artifact and focal anatomic slowing. Epilepsia partialis continua was refractory to medical treatment, and the patient underwent surgical resection that resulted in resolution of the status epilepticus. C, PET reveals concordant hypermetabolism in the right occipital area medially and marked hypometabolism in the right frontal area congruent with her postsurgical resection. Case #2 (D–F): 25-year-old woman presented with convulsive status epilepticus, followed by encephalopathy. D, Initial brain MRI FLAIR axial sequence revealed left parietal right FLAIR hyperintense findings. E, Continuous EEG shows intermittent bursts of low-frequency left temporo-parietal PDs. F, PET reveals concordant hypermetabolism in the left parietal area medially. The patient was treated based on the PET findings with intravenous sedatives, and AED resulted in resolution of LPDs and improvement in mental status back to baseline. FDG-PET, fluorodeoxyglucose-PET; LPDs, lateralized PDs.
Footnotes
The authors have no funding or conflicts of interest to disclose.
REFERENCES
- 1.Orta DS, Chiappa KH, Quiroz AZ, Costello DJ, Cole AJ. Prognostic implications of periodic epileptiform discharges. Arch Neurol. 2009;66:985–991. [DOI] [PubMed] [Google Scholar]
- 2.Walsh JM, Brenner RP. Periodic lateralized discharges-long term outcome in adults. Epilepsia. 1987;28:533–536. [DOI] [PubMed] [Google Scholar]
- 3.Walton NY, Treiman DM. Response of status epilepticus induced by lithium and pilocarpine to treatment with diazepam. Exp Nerurol. 1988;101:267–275. [DOI] [PubMed] [Google Scholar]
- 4.Leitinger M, Trinka E, Gardella E, et al. Diagnostic accuracy of the Salzburg EEG criteria for non-convulsive status epilepticus: a retrospective study. Lancet Neurol. 2016;10:1054–1062. [DOI] [PubMed] [Google Scholar]
- 5.Trinka E, Cock H, Hesdorffer D, et al. A definition and classification of status epilepticus-report of the ILAE task force on classification of status epilepticus. Epilepsia. 2015;56:1515–1523. [DOI] [PubMed] [Google Scholar]
- 6.Claassen J. How I treat patients with EEG patterns on the ictal-interictal continuum in the neuro ICU. Neurocrit Care. 2009;11:437–444. [DOI] [PubMed] [Google Scholar]
- 7.Chong DJ, Hirsch LJ. Which EEG patterns warrant treatment in the critically ill? Reviewing the evidence for treatment of periodic and epileptiform discharges and related patterns. J Clin Neurophysiol. 2005;22:79–91. [DOI] [PubMed] [Google Scholar]
- 8.Terzano MG, Parrino 1, Mazzucchi A, Moretti G. Confusional states with periodic lateralized epileptiform discharges; a peculiar epileptic syndrome in the elderly. Epilepsia. 1986;27:446–457. [DOI] [PubMed] [Google Scholar]
- 9.Handforth A, Cheng JT, Mandelkern MA, Treiman DM. Markedly increased mesiotemporal lobe metabolism in a case with PLEDS: further evidenced that PLEDs are manifestation of partial status epilepticus. Epilepsia. 1994;35:876–881. [DOI] [PubMed] [Google Scholar]
- 10.Vespa P, Tubi M, Claassen J. Metabolic crisis occurs with seizures and periodic discharges after brain trauma. Ann Neurol. 2016;79:579–590. [DOI] [PubMed] [Google Scholar]
- 11.Witsch J, Frey HP, Schmidt JM, et al. Electroencephalograhic periodic discharges and frequency-dependent brain tissue hypoxia in acute brain injury. JAMA Neurol. 2017;74:301–309. [DOI] [PMC free article] [PubMed] [Google Scholar]
- 12.Gurer G, Yemisci M, Saygi S, Ciger A. Structural lesions in periodic lateralized epileptiform discharges (PLEDs). Clin EEG Neurosci. 2004;35:88–93. [DOI] [PubMed] [Google Scholar]
- 13.Fitzpatrick W, Lowry N. PLEDS: clinical correlates. Can J Neurol Sci. 2007;34:443–450. [PubMed] [Google Scholar]
- 14.Chatziknonstantinous A, Gass A, Forester A, Hennerici MG, Szabo K. Features of acute DWI abnormalities related to status epilepticus. Epilepsy Res. 2011;97:45–51. [DOI] [PubMed] [Google Scholar]
- 15.Heiniger P, el-Koussy M, Schindler K, et al. Diffusion and perfusion MRI for the localization of epileptogenic foci in drug resistant epilepsy. Neuroradiology. 2000;44:475–480. [DOI] [PubMed] [Google Scholar]
- 16.Lansberg MG, Obrien MW, Norbash AM, Moseley ME, Morell M, Albers GW. MRI abnormalities associated with partial status epilepticus. Neurology. 1999;52:1021–1027. [DOI] [PubMed] [Google Scholar]
- 17.Toledo M, Munuera J, Sueiras M, Rovira R, Alvares Sabin J, Rovira A. MRI findings in aphasic status epilepticus. Epilepsia. 2008;49:1465–1469. [DOI] [PubMed] [Google Scholar]
- 18.Unrath A, Muller H, Ludolph AC, Kassubek J. Reversible cortical diffusion restriction hyperperfusion and T2 hyperintensity caused by two different types of epileptic seizures. Clin Neuroradiol. 2012;22:239–243. [DOI] [PubMed] [Google Scholar]
- 19.Aellen J, Abela E, Buerki SE, et al. Focal hemodynamic patterns of status epilepticus detected by susceptibility weighted imaging (SWI). Eur Radiol. 2014;24:2980–2988. [DOI] [PubMed] [Google Scholar]
- 20.Ohe Y, Hayashi T, Deguchi I, et al. MRI abnormalities of the pulvinar in patients with status epilepticus. J Neuroradiol. 2014;41:220–226. [DOI] [PubMed] [Google Scholar]
- 21.Huang YC, Weng HH, Tsai YT, et al. Peri-ictal magnetic resonance imaging in status epilepticus. Epilepsy Res. 2009;86:72–81. [DOI] [PubMed] [Google Scholar]
- 22.Yoshimura J, Matsumoto R, Ueda H. Status epilepticus in the elderly; Prognostic implications of rhythmic and periodic patterns in electroencephalography and hyperintensities on diffusion-weighted imaging. J Neurol Sci. 2016;370:284–289. [DOI] [PubMed] [Google Scholar]
- 23.Rennebaum F, Kasssubek J, Pinkhardt E, et al. Status epilepticus: clinical characteristics and EEG patterns associated with and without MRI diffusion restriction in 69 patients. Epilepsy Res. 2016;120:55–64. [DOI] [PubMed] [Google Scholar]
- 24.Narayan J. Can diffusion-weighted imaging be used as a tool to predict seizures in a patient with PLEDs? Epileptic Discod. 2016;18:440–446. [DOI] [PubMed] [Google Scholar]
- 25.Newey CR, George P, Sarwal A, So N, Hantus S. Electro-radiological observations of grade III/IV hepatic encephalopathy patients with seizures. Neurocrit Care. 2018;28:97–103. [DOI] [PubMed] [Google Scholar]
- 26.Bhatt A, Farooq MU, Bhatt S, Majid A, Kassab MY. Periodic lateralized epileptiform discharges: an initial electrographic pattern in reversible posterior leukoencephalopathy syndrome. Neurol Neurochir Pol. 2008;42:55–59. [PubMed] [Google Scholar]
- 27.Skiba V, Etienne M, Millder JA. Development of chronic epilepsy after recurrent episodes of posterior reversible encephalopathy syndrome associated with periodic lateralized epileptiform discharges. Seizure. 2010;20:93–95. [DOI] [PubMed] [Google Scholar]
- 28.Kalamangalam GP, Beate D, Burgess RC. Neuroimaging and neurophysiology of periodic lateralized periodic discharges: observations and hypotheses. Epilepsia. 2007;48:1396–1405. [DOI] [PubMed] [Google Scholar]
- 29.Kastrup O, Gerwig M, Fings M, Diener HC. Posterior reversible encephalopathy syndrome (PRES): electroencephalographic findings and seizure patterns. J Neurol. 2012;259:1282–1389. [DOI] [PubMed] [Google Scholar]
- 30.Gloor P, Kalabyo GN. The electroencephalogram in diffuse encephalopathies: electroencephalographic correlates of gray and white matter lesions. Brain. 1968;91:779–802. [Google Scholar]
- 31.Raroque HG Jr, Gonzales PC, Jhaveri HS, Leroy RF, Allen EC. Defining the role of the structural lesions and metabolic abnormalities in periodic lateralized epileptiform discharges. Epilepsia. 1993:34:279–283. [DOI] [PubMed] [Google Scholar]
- 32.Yemisci M, Gurer G, Saygi S, Ciger A. Generalized periodic epileptiform discharges: clinical features, neuroradiological evaluation and prognosis in 37 adult patients. Seizure. 2003;12:465–472. [DOI] [PubMed] [Google Scholar]
- 33.Sinha S, Harish T, Taly AB, Murthy P, Nagarathna S, Chandramuki A. Symptomatic seizures in neurosyphilis: an experience from a university hospital in south India. Seizure. 2008;17:711–716. [DOI] [PubMed] [Google Scholar]
- 34.Takagaki K, Morales MK, Vitantonio D. Periodic lateralized epileptiform discharges (PLEDs) in patients with neurosyphilis and HIV infection. Clin EEG Neurosci. 2016;47:247–250. [DOI] [PubMed] [Google Scholar]
- 35.Chatrian GE, Shaw CM, Leffman H. The significance of periodic lateralized epileptiform discharges in EEG; an electrographic, clinical and pathological study. Electroencephalogr Clin Neurophysiol. 1964;17:177–193. [DOI] [PubMed] [Google Scholar]
- 36.Hajek M, Antonini A, Leenders KL, Wieser HG. Epilepsia paritalis continua studied by PET. Epilepsy Res. 1991;9:44–48. [DOI] [PubMed] [Google Scholar]
- 37.Engel J Jr, Kukl DE, Phelps ME. Patterns of human local cerebral glucose metabolism during epileptic seizures. Science. 1982;218:64–66. [DOI] [PubMed] [Google Scholar]
- 38.Siclari F, Prior JP, Rossetti AO. Ictal cerebral positron emission tomography (PET) in focal status epilepticus. Epilepsy Res. 2013;105:356–361. [DOI] [PubMed] [Google Scholar]
- 39.Struck Am Westover MB, Hall LT, Deck GM, Cole AJ, Rosenthal ES. Metabolic correlates of the ictal-interictal continuum: FDG-PET during continuous EEG. Neurocrit Care. 2016;24:324–331. [DOI] [PMC free article] [PubMed] [Google Scholar]
- 40.Franck G, Sadzot B, Salmon E, et al. Study of cerebral metabolism and blood flow in partial complex epilepsy and status epilepticus in man using positron emission tomography. Rev Electroencephalogr Neurophysiol Clin. 1986;16:199–216. [DOI] [PubMed] [Google Scholar]
- 41.Kim HY, Kim JY, Kim GU, Han HJ, Shin DI. Alien hand syndrome after epilepsia partialis continua: FDG PET and MRI studies. Epilepsy Behav. 2012;23:71–73. [DOI] [PubMed] [Google Scholar]
- 42.Sakakibara E, Takahashi Y, Murata Y, Taniguchi G, Sone D, Watanabe M. Chronic periodic lateralized epileptic discharges and anti-N-Methyl-D-aspartate receptor antibodies. Epileptic Disord. 2014;16:218–222. [DOI] [PubMed] [Google Scholar]
- 43.Carteron L, Bouzat P, Oddo M. Cerebral microdialysis monitoring to improve individualized neurointensive care therapy: an update of recent clinical data. Front Neurol. 2017;13:601. [DOI] [PMC free article] [PubMed] [Google Scholar]
- 44.Le Roux P, Menon DK, Citerio G, et al. Consensus summary statement of the international multidisciplinary consensus conference on multimodality monitoring in neurocritical care: a statement for healthcare professionals from the neurocritical care society and the european society of intensive care medicine. Neurocrit Care. 2014;21(suppl 2):S1–S26. [DOI] [PMC free article] [PubMed] [Google Scholar]
- 45.Le Roux P, Menon DK, Citerio G, et al. Consensus summary statement of the international multidisciplinary consensus conference on multimodality monitoring in neurocritical care: a statement for healthcare professionals from the neurocritical care society and the European society of intensive care medicine. Intensive Care Med. 2014;40:1189–1209. [DOI] [PubMed] [Google Scholar]
- 46.Patet C, Quintard H, Zerlauth JB. Bedside cerebral microdialysis monitoring of delayed cerebral hypoperfusion in comatose patients with poor grade aneurysmal subarachnoid haemorrhage. J Neurol Neurosurg Psychiatry. 2017;88:332–338. [DOI] [PubMed] [Google Scholar]
- 47.Dreier JP. The role of spreading depression, spreading depolarization and spreading ischemia in neurological disease. Nat Med. 2011;17:439–447. [DOI] [PubMed] [Google Scholar]
- 48.Sakowitz OW, Santos E, Nagel A, et al. Clusters of spreading depolarizations are associated with disturbed cerebral metabolism in patients with aneurysmal subarachnoid hemorrhage. Stroke. 2013;44:220–223. [DOI] [PubMed] [Google Scholar]
- 49.Hinzman JM, Wilson JA, Mazzeo AT, Bullock MR, Hartings JA. Excitotoxicity and metabolic crisis are associated with spreading depolarizations in severe traumatic brain injury patients. J Neurotrauma. 2016;33:1775–1783. [DOI] [PMC free article] [PubMed] [Google Scholar]
- 50.Vespa PM, Miller C, McArthur D. Nonconvulsive electrographic seizures after traumatic brain injury result in a delayed, prolonged increase in intracranial pressure and metabolic crisis. Crit Care Med. 2007;35:2830–2836. [PMC free article] [PubMed] [Google Scholar]
- 51.Duncan R. The clinical use of SPECT in focal epilepsy. Epilepsia. 1997;38(suppl 10):39–41. [Google Scholar]
- 52.Zeiler SR, Turtzo LC, Kaplan PW. SPECT-Negative SIRPIDs argues against treatment as seizure. J Clin Neurophysiol. 2011;28:493–496. [DOI] [PubMed] [Google Scholar]
- 53.Aye SMM, Lim KS, Ramli NM, Tan CT. Periodic lateralized epileptiform discharges (PLEDS) in cerebral lupus correlated with white matter lesions in brain MRI and reduced cerebral blood flow in SPECT. Lupus. 2013;22:510–514. [DOI] [PubMed] [Google Scholar]
- 54.Lee HW, Hong SB, Tae WS. Opposite ictal perfusion patterns of subtracted SPECT: hyperperfusion and hypoperfusion. Brain. 2000;123:2150–2159. [DOI] [PubMed] [Google Scholar]
- 55.Assal F, Papazyan JP, Solosman DO, Jallon P, Goerres GW. SPECT in periodic lateralized epileptiform discharges (PLEDs): a form of partial status epilepticus? Seizures. 2001;10:260–264. [DOI] [PubMed] [Google Scholar]
- 56.Ergun EL, Salanci BV, Erbas B, Saygi S. SPECT in periodic lateralized epileptiform discharges (PLEDS): a case report on PLEDS. Ann Nucl Med. 2006;20:227–231. [DOI] [PubMed] [Google Scholar]
- 57.Lee BI, Scahuwecker DS. Regional cerebral perfusion in PLEDs: a case report. Epilepsia. 1988;29:607–611. [DOI] [PubMed] [Google Scholar]
- 58.Bozkurt MF, Saygi S, Erbas B. SPECT in patient with post-ictal PLEDs: is hyperperfusion evidence of electrical seizure? Clin Electroencephalogr. 2002;33:171–173. [DOI] [PubMed] [Google Scholar]
- 59.Ali II, Pirzade NA, Vaughn BV. Periodic lateralized epileptiform discharges after complex partial status epilepticus associated with increased focal cerebral blood flow. J Clin Neurophysiol. 2001;18:565–569. [DOI] [PubMed] [Google Scholar]
- 60.Kan R, Takahashi Y, Sato K, et al. Serial changes of SPECT in periodic synchronous discharges in a case with Creutzfeldt Jakob disease. Jpn J Psychiatry Neurol. 1992;46:175–179. [DOI] [PubMed] [Google Scholar]
- 61.Shih WJ, Markesbery WR, Clark DB, et al. Iodine-123 HPIDM brain imaging findings in subacute spongiform encephalopathy (CJD). J Nuc Med. 1987;28:1484–1487. [PubMed] [Google Scholar]
- 62.Smith CC, Tatum WO, Gupta V, Pooley RA, Freeman WD. SPECT-negative SIRPIDS: less aggressive neurointensive care? J Clin Neurophysiol. 2014;31:e6–e10. [DOI] [PubMed] [Google Scholar]
- 63.Szabo K, Poepel A, Pohlmann-Eden B, et al. Diffusion-weighted and perfusion MRI demonstrates parenchymal changes in complex partial status epilepticus. Brain. 2005;128:1369–1376. [DOI] [PubMed] [Google Scholar]
- 64.Leonhardt G, De Greiff A, Weber J, et al. Brain perfusion following a single seizures. Epilepsia. 2005;46:1943–1949. [DOI] [PubMed] [Google Scholar]
- 65.Venkatraman A, Khawaja A, Bag AK, Mirza M, Szaflarski JP, Pati SBB. Perfusion MRI can impact treatment decision in ictal-interictal continuum. J Clin Neurophysiol. 2017;34:e15–18. [DOI] [PubMed] [Google Scholar]
- 66.Hartings JA, Watanabe T, Bullock MR, et al. Spreading depolarizations have prolonged direct current shifts and are associated with poor outcome in brain trauma. Brain. 2011;1234:1529–1540. [DOI] [PubMed] [Google Scholar]
- 67.Lauritzen M, Dreier JP, Fabricius M. Clinical relevance of cortical spreading depression in neurological disorders; migraine, malignant stroke, subarachnoid and intracerebral hemorrhage, and traumatic brain injury. J Cereb Blood Flow Metab 2011;31:17–35. [DOI] [PMC free article] [PubMed] [Google Scholar]
- 68.Dreier JP, Fabricius M, Ayata C, et al. Recording, analysis, and interpretation of spreading depolarizations in neurointensive care: review and recommendations of the COSBID research group. J Cereb Blood Flow Metab. 2017;37:1595–1625. [DOI] [PMC free article] [PubMed] [Google Scholar]
- 69.Back T, Ginsberg MD, Bietrich WD, Watson BD. Induction of spreading depression in the ischemic hemisphere following experimental middle cerebral artery occlusion: effect on infarct morphology. J Cereb Blood Flow Metab. 1996;16:202–213. [DOI] [PubMed] [Google Scholar]
- 70.Busch E, Gyngell ML, Mansfred E, Hoehn-Berlage M, Hossman KA. A potassium-induced cortical spreading depressions during focal cerebral ischemia in rats: contribution to lesion growth assessed by diffusion-weighted NMR and biochemical imaging. J Cereb Blood Flow Metab. 1996;16:1090–1099. [DOI] [PubMed] [Google Scholar]
- 71.Jeffcote T, Hinzman JM, Jewell SL, et al. Detection of spreading depolarization with intraparenchymal electrodes in the injured human brain. Neurocrit Care. 2014;20:21–31. [DOI] [PubMed] [Google Scholar]
- 72.Hartings JA, York J, Carroll CP, et al. Subarachnoid blood acutely induces spreading depolarizations and early cortical infarction. Brain. 2017;140; 2673–2690. [DOI] [PMC free article] [PubMed] [Google Scholar]
- 73.Hartings JA, Shuttleworth CW, Kirov SA, et al. The continuum of spreading depolarization in acute cortical lesion development: examining Leao’s legacy. J Cereb Blood Flow Metab. 2017;37:1571–1594. [DOI] [PMC free article] [PubMed] [Google Scholar]
- 74.de Crespigny A, Rother J, van Bruggen N, et al. Magnetic resonance imaging assessment of cerebral hemodynamics during spreading depression in rats. J Cereb Blood Flow Metab. 1998;18:1008–1017. [DOI] [PubMed] [Google Scholar]
- 75.Villringer K, Minoshima S, Hock C, et al. Assessment of local brain activation. A simultaneous PET used near infrared spectroscopy study. Adv Exp Med Biol. 1997;413:149–153. [PubMed] [Google Scholar]
- 76.Peng K, Nguyen DK, Tayah T, Vannasing P, Tremblay J, Sawan M, et al. fNIRS-EEG study of focal interictal epileptiform discharges. Epilepsy Res. 2014;108:491–505. [DOI] [PubMed] [Google Scholar]
- 77.Sokol DK, Markand ON, Daly EC, Luerssen TG, Malkoff MD. Near infrared spectroscopy (NIRS) distinguishes seizure types. Seizure. 2000;9:323–327. [DOI] [PubMed] [Google Scholar]
- 78.Watanabe E, Maki A, Kawaguchi F, Yamashita Y, Koizumi H, Mayanagi Y. Noninvasive cerebral blood volume measurement during seizures using multichannel near infrared spectroscopic topography. J Biomed Opt. 2000;5:287–290. [DOI] [PubMed] [Google Scholar]
- 79.Nguyen DK, Tremblay J, Pouliot P, et al. Non-invasive continuous EEG-fNIRS recording of temporal lobe seizures. Epilepsy Res. 2012;99:112–126. [DOI] [PubMed] [Google Scholar]
- 80.Nguyen DK, Tremblay J, Pouliot P, et al. Non-invasive continuous functional near-infrared spectroscopy combined with electroencephalography recording of frontal lobe seizures. Epilepsia. 2013;54:331–340. [DOI] [PubMed] [Google Scholar]
- 81.Burdette D, Bowyer S, Moran JE, Mason K, Tepley N, Zoltay G. MEG coherence analysis of PLEDs. Abstract. 16th International Conference on Biomagnetism. August 25–29, 2000. Sapporo, Japan. Poster 2-2-8. August 27. Epilepsy Section. [Google Scholar]
- 82.Shvarts V, Zoltay G, Bowyer SM, Zillgitt A, Moran JE, Mason K, et al. Periodic discharges: insight from magnetoencephalography. J Clin Neurophyisiol. 2017;34:196–206. [DOI] [PubMed] [Google Scholar]
- 83.Hisada K, Morioka T, Nishio S, et al. Magnetoencephalographic analysis of periodic lateralized epileptiform discharges. Clin Neurophysiol. 2000;111:120–127. [DOI] [PubMed] [Google Scholar]
- 84.Velmurugan J, Sinha S, Nagappa M, et al. Combined MEG-EEG source localization in patients with sub-acute sclerosing pan-encephalitis. Neurol Sci. 2016;37:1221–1231. [DOI] [PubMed] [Google Scholar]