Significance
The prognosis for patients with glioblastoma (GBM) remains poor and novel therapeutic approaches to address this unmet clinical need are urgently required. Here we show that angiotensin II (AngII), a peptide involved in salt and water balance, is produced endogenously by GBM cells and drives proliferation via the type 2 receptor of AngII (AT2R). We repurposed a peripherally restricted AT2R antagonist, originally developed for the treatment of neuropathic pain, through the generation of a compound, A3E, that has greater efficacy in vitro and optimized central nervous system penetration and efficacy in vivo with minimal toxicity. This study demonstrates that inhibition of AT2R is a promising candidate target for systemic therapy of GBM.
Keywords: glioblastoma, renin angiotensin system, angiotensin II
Abstract
Glioblastoma (GBM) is an aggressive malignant primary brain tumor with limited therapeutic options. We show that the angiotensin II (AngII) type 2 receptor (AT2R) is a therapeutic target for GBM and that AngII, endogenously produced in GBM cells, promotes proliferation through AT2R. We repurposed EMA401, an AT2R antagonist originally developed as a peripherally restricted analgesic, for GBM and showed that it inhibits the proliferation of AT2R-expressing GBM spheroids and blocks their invasiveness and angiogenic capacity. The crystal structure of AT2R bound to EMA401 was determined and revealed the receptor to be in an active-like conformation with helix-VIII blocking G-protein or β-arrestin recruitment. The architecture and interactions of EMA401 in AT2R differ drastically from complexes of AT2R with other relevant compounds. To enhance central nervous system (CNS) penetration of EMA401, we exploited the crystal structure to design an angiopep-2–tethered EMA401 derivative, A3E. A3E exhibited enhanced CNS penetration, leading to reduced tumor volume, inhibition of proliferation, and increased levels of apoptosis in an orthotopic xenograft model of GBM.
The circulating renin–angiotensin system (RAS) is a regulator of blood pressure and volume homeostasis (1). RAS also operates locally in many tissues, including the central nervous system (CNS), where it mediates cell proliferation and growth. Its functions are regulated via angiotensin II (AngII), which binds to angiotensin II type 1 receptor (AT1R) and type 2 receptor (AT2R). These receptors are proposed to have opposing actions, whereby AT1R promotes cell growth and angiogenesis and AT2R counteracts these effects by functioning as an endogenous antagonist of the AT1R (2). The dysregulation of RAS through the aberrant expression of its components has been reported in many pathophysiological conditions, including cancer, where overexpression of AT1R has been correlated with more aggressive disease (3–5). Thus, AT1R antagonists such as the sartans have been proposed as agents for systemic anticancer therapy (6).
Glioblastoma (GBM) is a common, aggressive, primary malignant brain tumor with limited therapeutic options and poor prognosis, for which standard-of-care management extends median survival to 15 mo, but 5-y overall survival remains less than 10% (7). There is, therefore, a clear unmet clinical need and urgent requirement for novel therapeutic approaches. Of note, a retrospective study reported improvements in clinical outcomes in patients treated with RAS inhibitors in combination with radiotherapy and temozolomide (TMZ) (8). These studies have prompted further clinical trials in GBM (9). While the involvement of AT1R in cancer has been well studied due to the availability of several selective ligands (10), the role of AT2R is largely unexplored and unexploited. Studies of AT2R are challenging because of its generally low expression and knowledge of expression in human tumors is sparse. However, a limited number of selective AT2R ligands have been described, including the nonpeptide antagonist PD123319 (11) and derivatives such as EMA401 (2), the partial agonist CGP42112A (12), the nonpeptide agonist compound 21 (13), and more recently, our highly selective agonist [Y]6-AII (2, 14–16).
Here, we provide evidence that in GBM, AT2R has an oncogenic role whereby it contributes to tumor growth, invasiveness, and angiogenesis. Furthermore, we demonstrate that EMA401, a selective AT2R antagonist developed for the management of peripheral neuropathic pain, can be effectively repurposed to target the CNS and bring about significant inhibitory effects in GBM both in vitro and in vivo (17), similar to our previous studies in melanoma (2). Moreover, our crystal structure of EMA401 bound to AT2R revealed that EMA401 is recognized through a different binding profile compared with other selective and nonselective AT2R antagonists. The receptor adopts an active-like conformation of the 7-transmembrane (7TM) helical bundle with helix VIII positioned in a noncanonical orientation that occludes G protein and β-arrestin binding pocket. To facilitate the entry of EMA401 into the CNS and to realize its full therapeutic potential, we have developed A3E, an EMA401 prodrug, through tethering 3 EMA401 units to an Angiopep-2 vector.
Results
AGTR1 Is Silenced by CpG Island Methylation Predominantly in Established GBM Cell Lines.
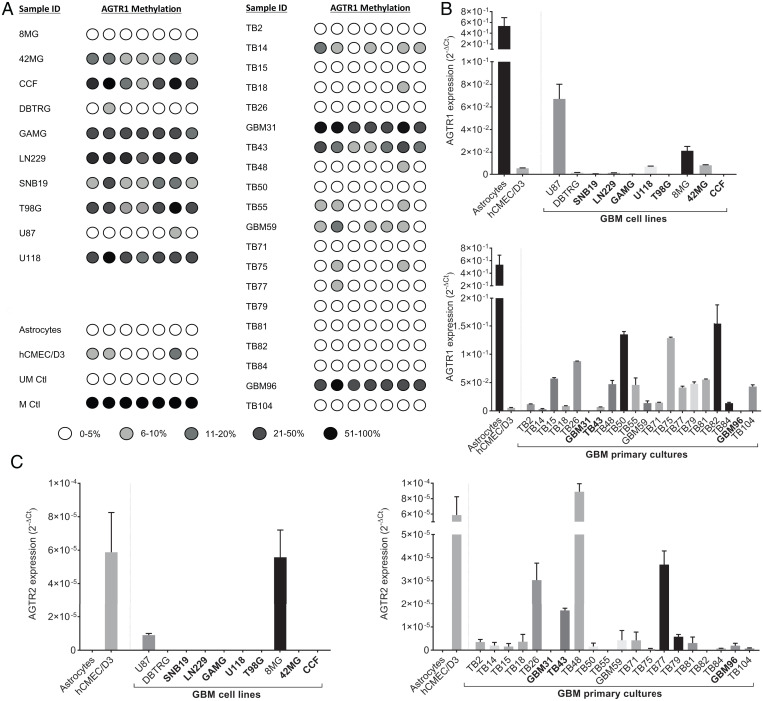
We profiled expression of AGTR1 and AGTR2 in both established (8MG, 42MG, CCF, DBTRG, GAMG, LN229, SNB19, T98G, U87, and U118) and patient-derived primary cultures (TB2, TB14, TB14, TB18, TB26, GBM31, TB43, TB48, TB50, TB55, GBM59, TB71, TB75, TB77, TB79, TB81, TB82, TB84, GBM96, and TB104) by qPCR. Expression of AGTR1 was greatly reduced in 8 of 10 established lines but was comparable to normal astrocytes in two cell lines (U87 and 8MG) (Fig. 1B). Pyrosequencing analysis revealed high-density methylation of the AGTR1 CpG island in all cell lines showing transcriptional down-regulation, with the exception of DBTRG, but U87 and 8MG were completely unmethylated (Fig. 1A). In contrast, AGTR1 was expressed in 16 of 20 primary GBM cultures and down-regulated by methylation-dependent silencing in four cell lines: TB14, GBM31, TB43, and GBM96 (Fig. 1B). Pyrosequencing analysis of 28 primary clinical samples revealed methylation at a frequency similar to the primary GBM cultures (SI Appendix, Fig. S1). Expression of AGTR2 messenger RNA was detectable in 17 of 20 primary cultures but was typically lower than AGTR1. However, expression was absent in normal astrocytes and all established GBM cell lines except 8MG and U87 (Fig. 1C).
Fig. 1.
Expression profiling of AGTR1 and AGTR2 in GBM. (A) AGTR1 CpG island methylation was determined by pyrosequencing in established GBM cell lines (8MG, 42MG, CCF, DBTRG, GAMG, LN229, SNB19, T98G, U87, U118) and patient-derived primary GBM cell cultures (TB2, TB14, TB14, TB18, TB26, GBM31, TB43, TB48, TB50, TB55, GBM59, TB71, TB75, TB77, TB79, TB81, TB82, TB84, GBM96, TB104). DNA extracted from cultured primary fetal astrocytes and human brain microvascular cells (hCMEC/D3) were also included in the analysis, as well as unmethylated placental (UM) and methylated (M) control DNA. (B) qPCR analysis of AGTR1 in established GBM cell lines and GBM primary cultures. (C) qPCR analysis of AGTR2. Expression data were normalized to the reference genes (TBP and HPRT1) and presented as 2-ΔCt. Ctl, control.
AngII Promotes GBM Cell Growth in Low-Nutrient Conditions via AT2R.
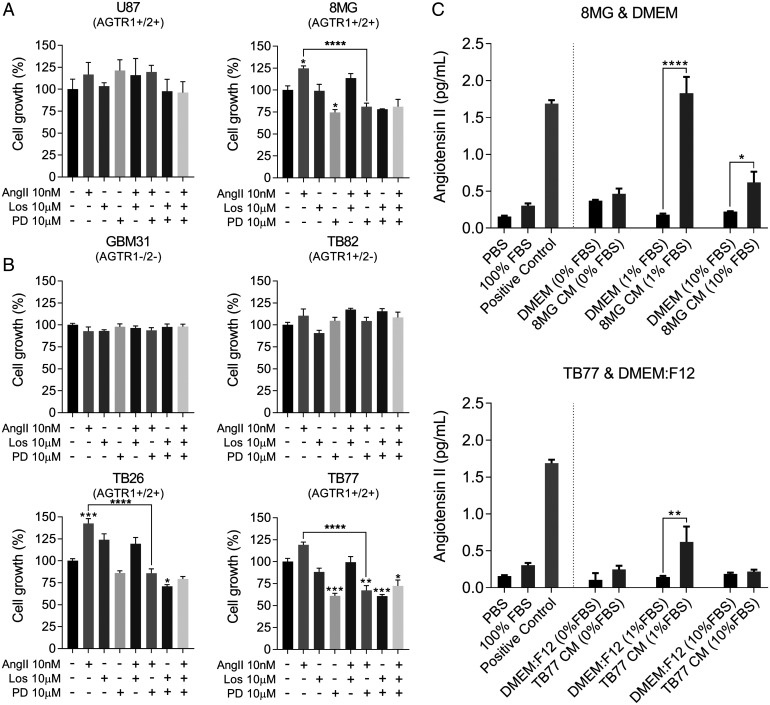
We next determined the effect of exogenous AngII on the growth of GBM. In low-serum conditions, AngII minimally increased the growth of GBM lines and primary cultures which expressed AT1R but not AT2R (e.g., TB82) (Fig. 2 A and B). However, growth was significantly enhanced in all tested cases which expressed AT2R (8MG: AGTR1+ AGTR2+, P ≤ 0.05; TB26: AGTR1+ AGTR2++, P ≤ 0.001; TB77: AGTR1+ AGTR2+, P ≤ 0.001) (Fig. 2 A and B). Selective antagonism of AT2R by PD123319 blocked the enhanced growth conferred by exogenous AngII (8MG: P < 0.0001; TB26: P < 0.0001; TB77: P < 0.0001), but no effects were observed with selective antagonism of AT1R by losartan (Fig. 2 A and B). Our results imply that under growth factor–limiting conditions, AngII confers a growth advantage to GBM, which is transduced via AT2R.
Fig. 2.
AngII signaling has a direct role in GBM cell growth. (A) Established GBM cell lines U87 and 8MG were treated with AngII and AT1R and AT2R antagonists. (B) Primary GBM cultures GBM31, TB26, TB82, and TB77 were treated in the same way as established cell lines. Cells were treated with 10 nM AngII and with the AT1R antagonist losartan (Los) and the AT2R antagonist PD123319 (PD) at 10 μM, as well as the combination of each antagonist with AngII and the combination of both antagonists. All treatments were done under low-serum conditions (1% fetal bovine serum [FBS]). Cells were analyzed by SRB staining (cell lines) or CCK8 (primaries) 6 d posttreatment. Data shown are mean absorbance values normalized to the untreated control ± SEM. (C) Immunoassay of AngII production by GBM cells 8MG and TB77. Phosphate-buffered saline (PBS), 100% FBS, 8MG and TB77 cells, and their respective control media (CM) were incubated for 24 h. Supernatants were collected and analyzed by immunoassay. The mean absorbance A450 values were compared with a standard curve of known AngII concentration to determine the concentration of AngII (pg/mL). ANOVA with Tukey’s multiple comparisons test was performed to determine significant differences between groups. *P ≤ 0.05, **P ≤ 0.01, ***P ≤ 0.001, ****P ≤ 0.0001. DMEM, Dulbecco’s modified Eagle’s medium.
Autocrine Production of AngII Is Induced Under Growth Factor–Limiting Conditions.
We noticed that PD123319 inhibited the proliferation of AT2R-expressing cells in the absence of exogenous AngII, and effects were significant in two of these cell lines (8MG: P < 0.05; and TB77: P < 0.0001) (Fig. 2 A and B). A possible explanation for these observations is autocrine AngII production. To validate this, we measured the concentration of AngII in spent culture media from 8MG and TB77 cells. We detected 10- and 4-fold higher concentrations of AngII in media from 8MG and TB77, respectively, when cells were cultured in 1% serum compared with control media containing no cells (Fig. 2C). These results demonstrate that under low-serum conditions, autocrine production of AngII promotes cell growth of GBM cells via AT2R signaling.
EMA401, a Selective AT2R Antagonist, Inhibits Proliferation of AGTR2-Expressing GBM Cells.
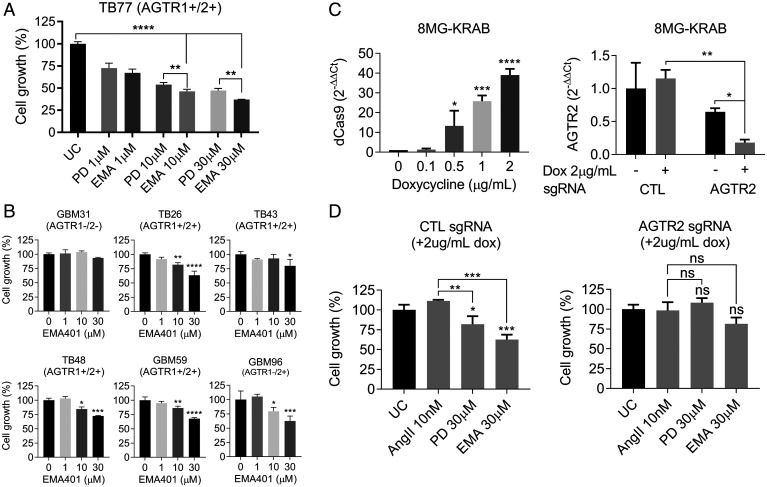
To further validate the growth inhibitory effects observed with PD123319, we evaluated the selective AT2R antagonist EMA401. EMA401 was originally developed to treat neuropathic pain and has a two-fold higher affinity for AT2R than PD123319 and greater potency (17). To compare the antiproliferative effect of the two antagonists, we treated TB77 cells (AGTR1+ AGTR2+) with either PD123319 or EMA401 at 1-, 10-, and 30-μM (Fig. 3A). AngII has a 10-fold higher selectivity for AT2R over AT1R with a KD (Dissociation constant) for AT2R of 1.6 nM, whereas PD123319 and EMA401 present 71.7 and 39.5 nM KD for AT2R, respectively (18). Accordingly, EMA401 demonstrated significantly more potent growth inhibition than PD123319 (P = 0.0011). Similar effects were observed in five additional primary GBM cultures expressing AGTR2 and treated with 30 μM EMA401: TB26, TB43, TB48, GBM59, and GBM96. Of note, GBM31, which lacks detectable expression of AGTR2, was insensitive to EMA401 (Fig. 3B). The effects of EMA401 were independent of TMZ sensitivity. Notably, the primary culture GBM59 is insensitive to TMZ (SI Appendix, Fig. S2) yet is efficiently inhibited by EMA401 (Fig. 3B). To further validate AT2R as the target for EMA401, we generated doxycycline-stable, inducible knock-down of AGTR2 in 8MG cells using the CRISPR/Cas9-KRAB system. Dose-dependent inducible expression of Cas9-KRAB was observed and 70% knockdown of AGTR2 was achieved in the presence of 2 μg/mL doxycycline (Fig. 3C). The 8MG-KRAB-AGTR2 cells had a small but significant increase in proliferation compared with the 8MG-KRAB-CTL line (SI Appendix, Fig. S3). The proliferation-promoting effects of AngII and inhibitory effects of PD123319 and EMA401 were minimal in the AGTR2 knockdown cells compared with the nontargeting, AGTR2-expressing control cells (Fig. 3D). These results imply that the growth-promoting effects of AngII in GBM are mediated via AT2R.
Fig. 3.
EMA401 significantly inhibits the growth of GBM cells via AT2R. (A) TB77 cells were treated with 1, 10, and 30 μM PD123319 (PD) or EMA401 (EMA) in 1% serum and analyzed using the CCK8 kit 9 d posttreatment. (B) Primary GBM explants GBM31, TB26, TB43, TB48, GBM59, and GBM96 were treated with 1, 10, and 30 μM EMA401 in 1% serum and analyzed 9 d posttreatment with CCK8. Data shown are mean absorbance A450 values normalized to the untreated control (UC) ± SEM (C) dCas9-KRAB inducibility in 8MG-KRAB cells treated with 0.1, 0.5, 1, and 2 μg/mL doxycycline (Dox) for 48 h. Induction of dCas9-KRAB in 8MG-KRAB cells with stable integration of AGTR2 single-guide RNA (sgRNA) results in significant AGTR2 transcriptional silencing in the presence of 2 μg/mL doxycycline. Expression data were normalized to the mean cycle threshold value of the reference genes and presented as 2-ΔΔCt. (D) 8MG-KRAB cells with stable integration of scramble control (CTL) sgRNA or AGTR2 sgRNA were treated with 10 nM AngII, 30 μM PD123319, and 30 μM EMA401 in the presence of 2 μg/mL doxycycline in 1% serum. Cells were analyzed 9 d posttreatment by SRB staining. Data shown are mean absorbance A490 values normalized to the untreated control ± SEM. For all data presented in this figure, ANOVA with Tukey’s multiple comparisons test was performed to determine significant differences between groups. *P ≤ 0.05, **P ≤ 0.01, ***P ≤ 0.001, ****P ≤ 0.0001. ns, nonsignificant.
EMA401 Inhibits GBM Spheroid Growth and Invasion.
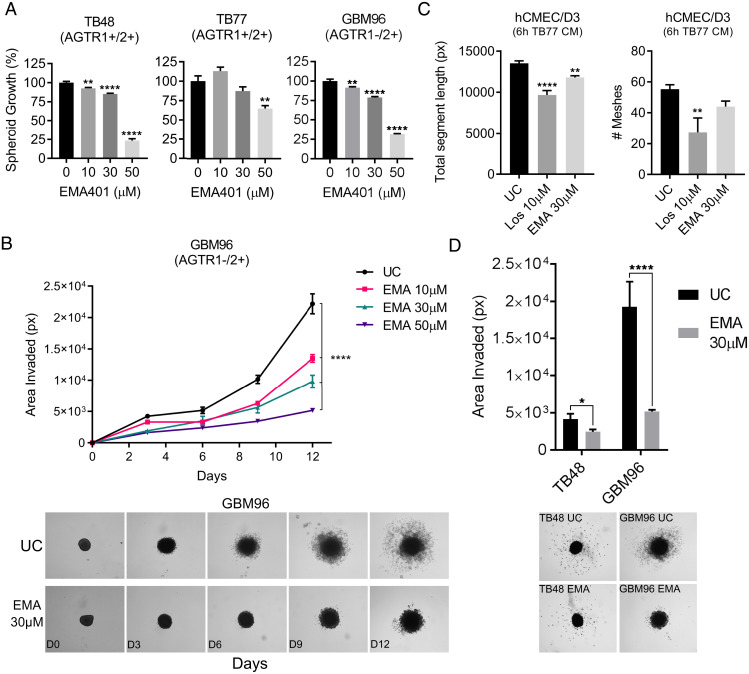
Next, we investigated the effects of EMA401 on GBM growth in three dimensions (3D), a platform more closely resembling tumors in vivo. TB48, TB77, and GBM96 spheroids were treated with EMA401 at 10, 30, and 50 μM and assessed for growth using the CCK8 assay 9 d posttreatment. Spheroids from all three primary cultures were sensitive to EMA401 (Fig. 4A). To study the impact of AT2R inhibition on GBM biology, spheroid invasion was investigated. Spheroids were suspended in a 50% Matrigel solution, and the area populated by invasive cells was measured over time. EMA401 significantly reduced the invasiveness of GBM96 cells in a dose-dependent manner (Fig. 4B). TB48 spheroids exhibited less-invasive properties than GBM96, but invasiveness was nonetheless significantly reduced by 30 μM EMA401 (Fig. 4D). Finally, the total segment length was significantly reduced in endothelial cells exposed to media from EMA401-treated GBM cells, indicating a reduction in the ability of GBM cells to induce angiogenesis (Fig. 4C).
Fig. 4.
Evaluating spheroid growth, spheroid invasion, and the ability of GBM cells to induce angiogenesis when treated with angiotensin receptor antagonists. (A) GBM primaries TB48, TB77, and GBM96 were grown as 3D spheroid cultures and treated with 10, 30, and 50 μM EMA401 (EMA). Spheroid growth was analyzed 9 d posttreatment using the CCK8 kit. Data shown are mean absorbance A450 values normalized to the untreated control (UC) ± SEM (B and D) TB48 and GBM96 spheres were suspended in a 50% Matrigel solution, treated with EMA401, and invasion was measured by quantifying the area covered by invading cells. Data shown are mean areas in pixels (px) ± SEM as determined by thresholding in ImageJ. Representative images of GBM96 and TB48 spheroid invasion are shown. (C) Induction of tube formation of human microvascular endothelial cells (hCMEC/D3) that results from 6-h incubation with media conditioned by untreated TB77 GBM cells or TB77 treated with 10 μM of the AT1R antagonist losartan (Los) and 30 μM EMA401. Data shown are either the mean total segment length in pixels or the mean number of meshes formed ± SEM. For all data presented in this figure, ANOVA with Tukey’s multiple comparisons test was performed to determine significant differences between groups. *P ≤ 0.05, **P ≤ 0.01, ***P ≤ 0.001, ****P ≤ 0.0001. ns, nonsignificant.
AT2R Blockade Down-regulates Tumor-Promoting Genes and Up-regulates Growth Suppressors.
To seek insights into the mechanistic basis by which AT2R antagonism inhibits GBM cell growth, we performed a whole-transcriptome analysis of GBM cells (TB77) treated with 30 µM EMA401 or 30 µM PD123319 for 24 h. At this time point, a significant increase in endogenous AngII production was observed in TB77 cell cultures in low-serum conditions (Fig. 2C). Treatment with PD123319 resulted in the differential expression of 2,195 genes compared with untreated control (P < 0.01). Treatment with EMA401 resulted in the differential expression of 5,498 genes compared with the untreated control (P < 0.01). The number of differentially expressed genes identified in the two groups and shared between them is illustrated in SI Appendix, Fig. S8. 1,287 common genes were differentially expressed in both groups, consistent with their shared receptor. PD123319 treatment resulted in 908 unique differentially expressed genes, whereas treatment with EMA401 led to the differential expression of 4,211 unique genes (SI Appendix, Fig. S8). All the differentially expressed genes for each agent were subjected to pathway analysis (Kyoto Encyclopedia of Genes and Genomes year 2021) using Enrichr, and cancer-related pathways were curated (SI Appendix, Tables S5 and S6) and matched to each other. All 19 of the cancer-related pathways differentially expressed with PD123319 treatment were also observed with EMA401 treatment, but EMA401 had an additional 26 altered cancer-related pathways. The shared pathways included apoptosis (P < 0.001), PI3K-Akt (P < 0.05), and MAPK (P < 0.01). Importantly, there were significant changes in genes that form the TGF-β signaling pathway, supporting a role of AT2R signaling in angiogenesis. Changes in cancer pathways specific to EMA401 included the cell cycle (P < 0.0001), p53 (P < 0.001), and HIF-1α (P < 0.001) signaling. Moreover, EMA401 led to down-regulation of several genes involved in glycolysis and the pentose phosphate pathway, including G6PD (1.26-fold), TKT (1.33-fold), PDK2 (1.29-fold), and PDK4 (1.29-fold). Interestingly, these genes are up-regulated in response to AngII, and their down-regulation by EMA401 suggests that EMA401 is exerting its effects via AT2R.
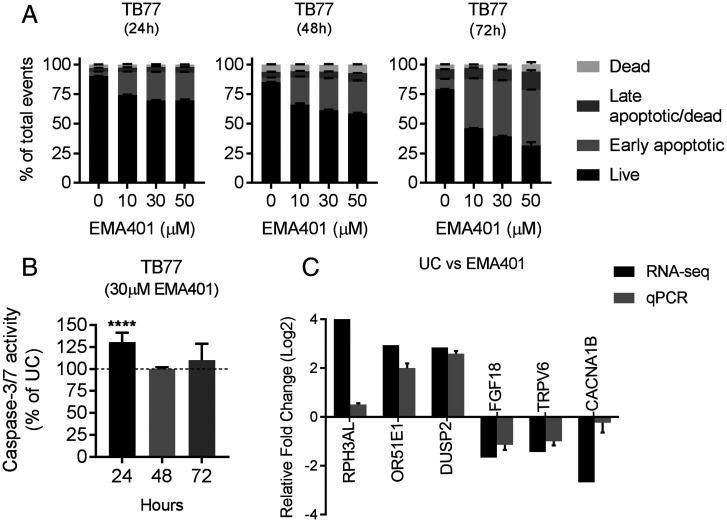
We proceeded to experimentally validate some of the changes observed in our transcriptomic data to gain some mechanistic insights into the action of EMA401 in vitro using TB77 GBM cells. We specifically looked for changes in apoptosis and cell death using the Muse Annexin V & Dead Cell Assay at 24, 48, and 72 h and cell-cycle parameters by flow cytometry using propidium iodide staining. We also measured caspase-3/7 activation using luminescence, since the expression of CASP3, a major regulator of apoptosis, was up-regulated 1.43-fold in EMA401-treated cells. We observed a significant increase in early apoptotic cells with EMA401, which was both time and dose dependent, with a slightly higher proportion of late apoptotic/dead cells at 72 h. (Fig. 5A) No changes in cell-cycle parameters were observed in any of the conditions used (SI Appendix, Fig. S9), but caspase-3/7 activation was enhanced by 30% (P < 0.0001) 24 h after EMA401 treatment, and this returned to baseline levels of the untreated control after 48 h (Fig. 5B).
Fig. 5.
Apoptosis, caspase activation, and changes in the expression of cancer genes in GBM cells treated with EMA401. (A) TB77 cells were treated with 10 μM, 30 μM, and 50 μM EMA401 and analyzed for changes in apoptosis at 24, 48, and 72 h posttreatment using the Muse Annexin V Dead Cell Assay. Data shown is the mean % ± SEM of the total events for each stage of apoptosis (i.e., live, early apoptosis, late apoptosis/dead, and dead). (B) Induction of caspase-3/7 activation after treatment of TB77 cells with 30 μM EMA401. (C) qPCR validation of RNA-sequencing (RNA-seq) changes resulting from EMA401. qPCR expression data were normalized to the mean Ct value of the reference genes TBP and HPRT1 and are represented relative to the untreated control as 2. ANOVA with Tukey’s multiple comparisons test was performed to determine significant differences between groups. ****P ≤ 0.0001.
Using qPCR, we validated a panel of six genes in which EMA401 had induced large expression changes and which have previously been reported as having important roles in cancer. Although the magnitude of the expression changes was variable, the trends were consistent between the transcriptomic and qPCR data (Fig. 5C).
Crystal Structure of EMA401 Bound to AT2R.
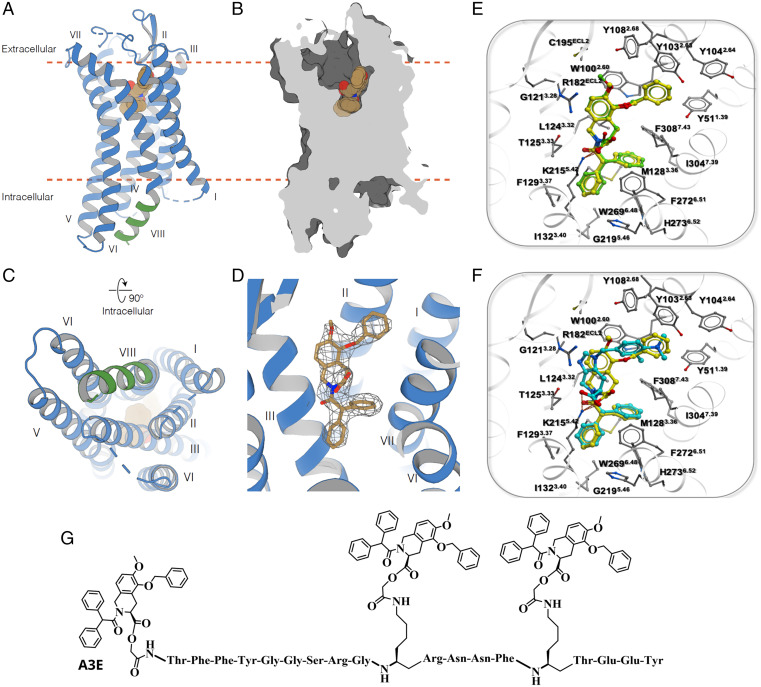
The results reported thus far demonstrate that the AT2R selective inhibitors EMA401 and PD123319 have different efficacy at inhibiting the proliferation of GBM cells, consistent with the two-fold higher binding affinity of EMA401 (18). The more potent suppression of GBM proliferation by EMA401 implies that EMA401 binding may involve a different recognition mode at AT2R or different binding kinetics in comparison to PD123319. To address this, we determined the crystal structure of EMA401 bound to AT2R. The AT2R structure comprises a 7TM bundle (helices I to VII), three extracellular loops (ECLs; 1 to 3), three intracellular loops (1 to 3), and an intracellular amphipathic helix VIII (Fig. 6A). ECL2 forms a β-hairpin stabilized by a disulfide bond between Cys195ECL2 and Cys1173.25 [the residue numbering scheme follows Ballesteros–Weinstein nomenclature (19)]. In addition, a second disulfide bond links Cys35N-term to Cys290ECL3. The AT2R–EMA401 structure was captured in a similar conformation to previously determined structures of AT2R in complex with small-molecule antagonists [e.g., Cα root mean square deviation (RMSD) = 0.46 Å with Protein Data Bank identifier (PDB ID) 5UNF] (20). This conformation is characterized by several active-like changes, such as an outward displacement of helix VI and an inward displacement of helix VII on the intracellular side of AT2R structures, as compared with the inactive state AT1R (PDB ID 4YAY) and other inactive-state G protein–coupled receptors (GPCRs). Such displacements of helices VI and VII that open an intracellular cleft for the recruitment of G proteins and β-arrestins is a common signature in the activation mechanism of GPCRs (21). However, unlike other GPCRs, in which helix VIII lies parallel to the membrane, facing outward of the 7TM, helix VIII in AT2R flips inward, interacting with intracellular ends of helices III, V, and VI (Fig. 6A and C). This conformation of helix VIII is stabilized by substantial hydrophobic and hydrophilic interactions, comprising a complementary interface with intracellular cleft of AT2R showing an authentic characteristic of this receptor, consistent with previously determined antagonist-bound structures (20). Interestingly, a recent AT2R structure in complex with its endogenous agonist AngII revealed helix VIII in a more canonical conformation, supporting the hypothesis that helix VIII may play a role in the signaling mechanism of AT2R (22). The AT2R–EMA401 structure provides additional insights into ligand recognition by AT2R. While the overall ligand-binding pocket conformation in AT2R–EMA401 (Fig. 6 B and D) is similar to the conformation observed for complexes with small-molecule compounds 1 and 2 (20), the orientation and contacts of EMA401 drastically differ from those compounds. The isoquinoline scaffold of EMA401 occupies a relatively hydrophobic pocket consisting of W1002.60, L1243.23, R182ECL2, and I3047.39. Surprisingly, instead of a salt bridge, as in the previously published AT2R structures with small molecules (20), the guanidine group of R182ECL2 makes a stacking interaction with the isoquinoline aromatic ring of EMA401, while its carboxyl group forms a salt bridge with K2155.42, which was previously shown to anchor both small-molecule and peptide ligands (23). The only additional polar interaction of EMA401 is a hydrogen bond of its amide moiety with the T1253.33 side chain. Among the nonpolar interactions, the two phenyl rings of EMA401 occupy two hydrophobic subpockets and engage in stacking interactions with W2696.48, F1293.37, F2726.51, H2736.52, and F3087.43. Interestingly, the side chain of M1283.36 adopts a different conformation than in structures with compounds 1 and 2, to avoid a steric clash with one of the phenyl rings of EMA401. The third hydrophobic subpocket harboring the phenylmethoxy group of EMA401 is surrounded by aromatic residues Y511.39, Y1032.63, Y1042.64, and Y1082.68, as well as by W1002.60, which forms stacking interactions with both the phenylmethoxy group and the isoquinoline core of EMA401. An overall view of AT2R–EMA401 contacts and the electron-density map are shown in SI Appendix, Fig. S10. Next, we applied molecular docking to elucidate the basis of a higher affinity of EMA401 compared to PD123319, which could deliver important insights on the development of more potent compounds against GBM. We validated our docking procedure by reproducing the binding pose of EMA401 in the crystal structure (Fig. 6E) with an RMSD better than 0.5 Å and a high score (SI Appendix, Table S7). Furthermore, docking predicted that PD123319 binds in an overall similar mode to EMA401 (Fig. 6F). However, the substitution of the benzene ring of EMA401 by an imidazole in the PD123319 core weakens the stacking interaction with the guanidine group of R182ECL2, and slightly shifts the scaffold in the pocket. Although this allows for accommodation of an additional exocyclic amine group on the phenyl ring of PD123319, it results in weaker interactions with Y511.39, W1002.60, Y1032.63, Y1042.64, and Y1082.68 (Fig. 6F). Thus, the predicted interactions of PD123319 are in accordance with its reduced binding affinity. To provide a rationale for the selectivity presented by EMA401 and PD123319 for AT2R, we attempted to dock EMA401 and PD123319 into AT1R (PDB ID 4YAY); however, we did not find an acceptable docking score (<−25), which corroborates low binding affinities at AT1R ((EMA401 IC50 = 408 uM and PD123319 IC50 = 210.5 uM at rat AT1R) (24).
Fig. 6.
AT2R–EMA401 structure, details of AT2R-ligand interactions, and A3E structure. (A) Overall view of AT2R (cartoon) with the ligand EMA401 (spheres) in the binding pocket. (B) Section through the receptor showing solvent-accessible surface (dark gray) of the ligand-binding pocket. The membrane boundaries provided by the orientation of membrane proteins database (39) are shown as orange dashed lines in A and B. (C) Intracellular view showing how helix VIII (green) blocks the G protein and β-arrestin binding site. (D) 2mFo-DFc electron density (gray mesh) of EMA401 contoured at 1 σ. EMA401 is shown as sticks with carbon atoms colored in sand, oxygen in red, and nitrogen in blue. (E) Predicted docking pose and contacts of EMA401 (green) in the AT2R binding pocket (side chains with gray carbon atoms), superimposed with EMA401 (yellow) bound crystal structure of AT2R. (F) Predicted docking pose and contacts of PD123319 (cyan) superimposed with cocrystalized EMA401 (yellow). (G) Structure of A3E.
Design and Synthesis of A3E as a Vehicle to Optimize Delivery of EMA401 to the CNS.
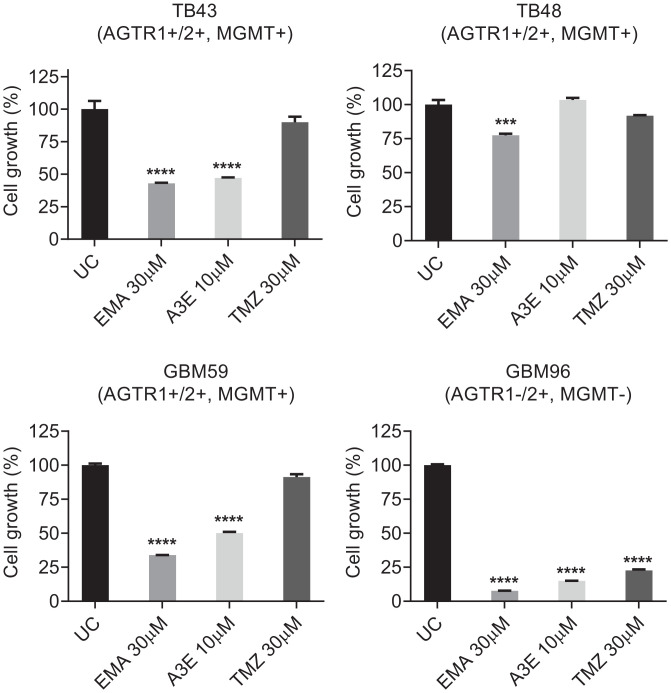
Taken together, our studies demonstrate that EMA401 efficiently inhibits GBM growth and invasiveness and reveal the structural basis for this. However, a significant impediment to the translation of our work to the clinic is the reported inability of EMA401 to penetrate the blood–brain barrier (BBB) (25). To increase the potential of EMA401 as a GBM therapeutic, either structural derivatization or optimized formulation is required. Based on our X-ray structure of EMA401 bound to AT2R, it is evident that its carboxylic acid group is essential for forming interactions with key AT2R residues, and we utilized this as a reactive handle to conjugate EMA401 to Angiopep-2 through enzymatically labile bonds to enhance its delivery to the CNS (26–28). This derivative was synthesized by tethering the carboxylic acid groups of three EMA401 units to Angiopep-2 via cleavable glycolic ester bonds, and we termed this agent A3E (SI Appendix, Figs. S4–S7). The chemical structure of A3E is shown in Fig. 6G, and the synthesis is described in SI Appendix, Fig. S11. Besides delivering EMA401 into the CNS, A3E may also effectively target functional intracellular nuclear and mitochondrial AT2Rs (29). We next evaluated the effect of A3E on the proliferation of primary GBM cultures and compared it with the current standard of care, TMZ. Primary GBM cultures TB43, TB48, GBM59, and GBM96 were treated with EMA401 (30 μM), A3E (10 μM), and TMZ (30 μM) in 1% serum and analyzed with CCK8 9 d posttreatment. A3E showed a clear antiproliferative effect, producing equivalent inhibition to native EMA401 at a three-fold lower dose (Fig. 7). Of note, EMA401 demonstrated greater potency than TMZ in all tested cultures. GBM96, which also lacks expression of AGTR1, was especially sensitive to EMA401 and A3E (Fig. 7).
Fig. 7.
The effects of EMA401 and A3E on proliferation in primary GBM cultures. Primary GBM cultures TB43, TB48, GBM59, and GBM96 were treated with EMA401 (30 μM), A3E (10 μM), and TMZ (30 μM) in 1% serum and analyzed 9 d posttreatment with CCK8. Data shown are mean absorbance A450 values normalized to the untreated control (UC) ± SEM. Statistical significance was analyzed using one-way ANOVA with Dunnett’s multiple comparisons test between treated groups and untreated control. ***P ≤ 0.001, ****P ≤ 0.0001.
[Y]6-AII, a Specific Agonist of AT2R, Abrogates the Antiproliferative Effects of A3E.
Our data clearly demonstrate an inhibition of proliferation of GBM cells by EMA401 and A3E, an effect observed only in cells expressing AT2R. To further investigate the specificity of A3E for AT2R, we performed additional experiments in U87 and GBM96 cells, in which we activated AT2R using the highly selective AT2R agonist [Y]6-AII, an agent we recently developed (14). Specifically, we used [Y]6-AII, that bears 3.4-nM affinity and 18,000-fold higher selectivity for AT2R over AT1R. Although [Y]6-AII alone did not further enhance the proliferation of U87 and GBM96 (both of which express AT2R) when used in combination with either EMA401 or A3E, [Y]6-AII abrogated the antiproliferative effects of EMA401 and A3E in both cell lines (SI Appendix, Fig. S16). These results provide further evidence that EMA401 and A3E mediate their antiproliferative effect via AT2R.
Stability of A3E in Human and Mice Plasma.
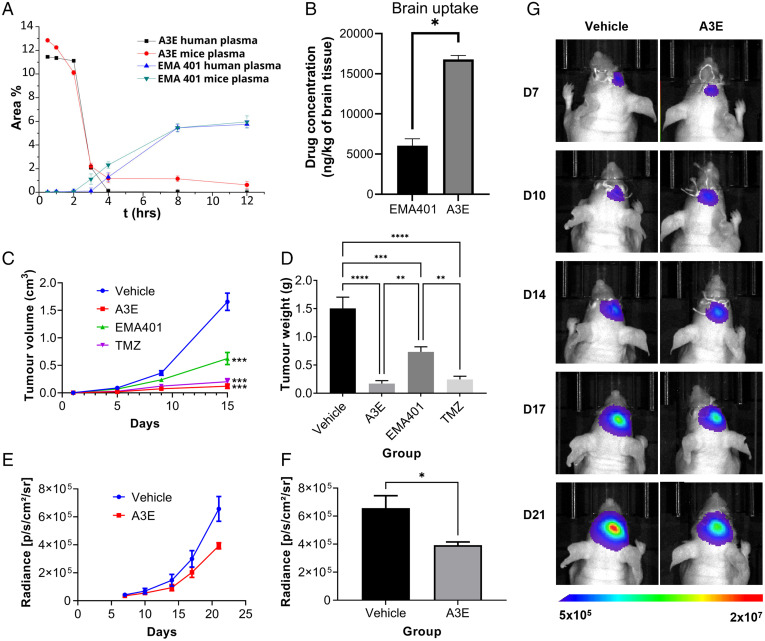
Having demonstrated the antiproliferative properties of A3E in GBM, we determined its stability in human and mouse plasma. We established high-performance liquid chromatography protocols to quantify A3E and to monitor EMA401 generated from the peptide-drug conjugate (PDC) in human and mouse plasma in a time-dependent manner. The degradation rate of A3E, after incubation in human and mice plasma for 0.5, 1, 2, 3, 4, 8, and 12 h, is presented in Fig. 8A, together with the release rate of EMA401. A3E exhibited a slow degradation rate, since at 2 h, almost 100% of the conjugate was still present, relative to the initial concentration.
Fig. 8.
Stability and efficacy of EMA401 and A3E in vivo. (A) Plasma-stability profile of A3E after incubation in human and mouse plasma. (B) Brain biodistribution of EMA401 after intravenous injection of EMA401 (10 mg/kg; n = 3) and A3E (containing 10 mg/kg of EMA401; n = 3) measured in brains of C57BL/6 mice. Average (C) volume and (D) weight of subcutaneous U87-GFP/luc tumors in NSG mice after 21 d of treatment with EMA401 (10 mg/kg; n = 9), A3E (25.88 mg/kg; n = 8), TMZ (30 mg/kg; n = 9), or vehicle (PBS with 5% dimethyl sulfoxide [DMSO] and 5% solutol; n = 7). (E and F) Bioluminescent imaging data of intracranial U87-GFP/luc tumors in BALB/c nude mice treated with A3E (25.88 mg/kg; n = 6) or vehicle (PBS with 5% DMSO and 5% solutol; n = 6). (G) Representative bioluminescent images of one mouse in each treatment group at each time point. Data represent the mean ± SEM. Statistical analysis was conducted using one-way or two-way ANOVA with the Tukey’s test or Student’s t test. *P ≤ 0.05, **P ≤ 0.01, ***P ≤ 0.001, ****P ≤ 0.0001.
In Vivo Biodistribution of EMA401 and A3E.
Accumulation of EMA401 and A3E in normal mouse brains was estimated in vivo after intravenous administration of one dose of 10 mg/kg EMA401 into 6-wk-old female C57BL/6 mice. Groups of three mice were treated with EMA401 or A3E containing an equimolar dose of the drug. The left hemisphere of each brain was collected 30 min after drug administration, processed, and subjected to liquid chromatography–tandem mass spectrometry (LC-MS/MS) analysis. The uptake of EMA401 (expressed as nanograms per kilogram of tissue) is depicted in Fig. 8B. Although EMA401 was detected in the brains of both experimental groups, its uptake in the A3E group was 2.7-fold higher than EMA401 alone. Our results demonstrate that conjugation of EMA401 with Angiopep-2 significantly enhances its delivery through the BBB and into the CNS. Of note, in the brain samples of mice treated with EMA401, a metabolite was identified as described in the literature (30). This exhibited a peak at 3.7 min for the same fragment ion (m/z 314), distinct from the peak corresponding to EMA401 at 4.1 min (SI Appendix, Figs. S12 and S13). In contrast, this specific metabolite (peak at 3.7 min) was not detected in the A3E-treated group (SI Appendix, Fig. S12). These data indicate that conjugation of Angiopep-2 to EMA401 enhances delivery of EMA401 into the CNS and may also reduce the generation of toxic metabolites and improve efficacy through its altered metabolism (30).
A3E Inhibits the Growth of GBM Tumors In Vivo.
Finally, to evaluate the in vivo efficacy of AT2R antagonism in GBM, we determined the effect of EMA401 and A3E in U87 cells labeled with a green fluorescent protein (GFP)-luciferase reporter in both subcutaneous and orthotopic xenograft models. For the subcutaneous model, 2 × 10⁶ U87–GFP/luc cells were injected into the flanks of NSG mice. Once tumors were established, mice were randomized to receive EMA401, A3E, TMZ or vehicle control and treated for 21 d. Treatment with A3E resulted in tumors with significantly smaller size (SI Appendix, Fig. S14), volume (Fig. 8C), and weight (Fig. 8D) when compared with the vehicle- or EMA401-treated groups. A3E also appeared to be slightly more effective than TMZ, though this was not significant (Fig. 8 C and D). Next, we wanted to confirm that A3E could cross the BBB and inhibit tumor growth in an intracranial model. For this, 2 × 10⁵ U87–GFP/luc cells were injected into the right cerebral cortex of BALB/c nude mice and allowed to form tumors. After 7 d, mice were randomized to A3E or vehicle control groups and treated daily by intraperitoneal injection for 14 d. Imaging was carried out using the IVIS system twice weekly to monitor tumor size. A3E significantly reduced tumor size by 40% compared with the vehicle control in a time-dependent manner (Fig. 8 E–G). None of the animals used in the subcutaneous or intracranial models lost a significant amount of weight over the course of the study, implying that A3E caused no detectable toxicity in these experiments (SI Appendix, Fig. S15).
Mechanism of Action of A3E In Vivo.
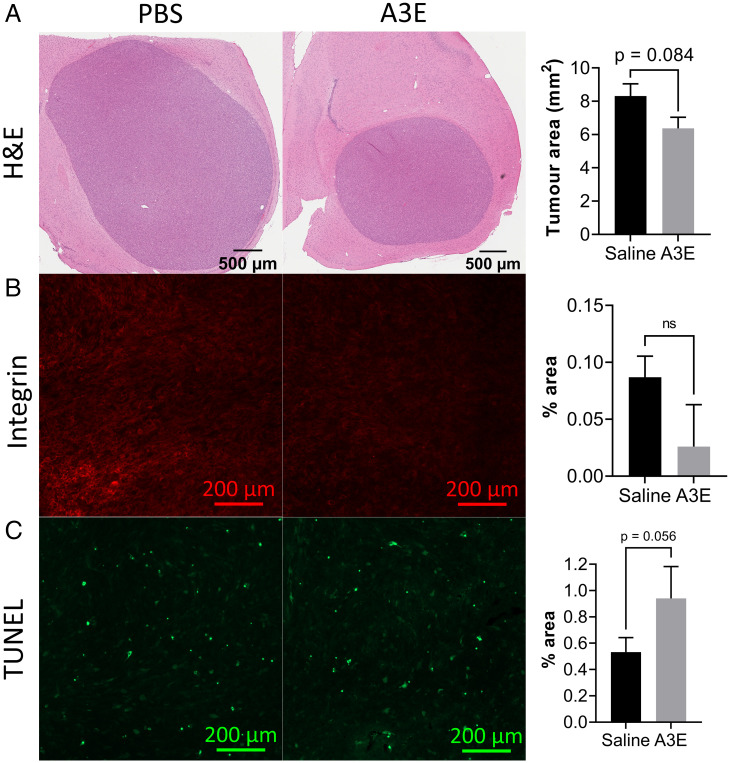
Having recorded an inhibition of tumor growth by Bioluminescent Imaging (BLI) in A3E-treated mice, we performed additional analysis on the tumor sections to gain an insight into the mechanism of action of A3E in vivo. We first performed hematoxylin and eosin (H&E) staining of the tumor sections for analysis of tumor size. For analysis of angiogenesis, we stained sections for integrin β3, and for detection of apoptosis we performed the terminal deoxynucleotidyl transferase dUTP nick end labeling (TUNEL) assay. Tumors were consistently smaller in the A3E-treatment group compared with the saline group (P = 0.084) (Fig. 9A) as indicated by H&E staining. Furthermore, there was a reduction in integrin-β3 staining, indicating angiogenesis in the A3E-treated tumors (Fig. 9B). In contrast, apoptosis was enhanced with A3E treatment, as demonstrated by the TUNEL assay (P = 0.056) (Fig. 9C).
Fig. 9.
Immunohistochemical staining of sections from mice treated with A3E. (A) Images of whole tumor sections from representative saline- and A3E-treated animals, stained with H&E, with a bar graph showing average tumor area (n = 5; P = 0.084). (B) Fluorescent integrin-stained sections, with a bar graph showing average staining intensity (n = 2; P = 0.17). (C) Fluorescent TUNEL-stained sections, with a bar graph showing average staining intensity (n = 3; P = 0.056). Data represent the mean ± SD. Statistical analysis was conducted using Student’s t test (*P ≤ 0.05). ns, not significant.
Discussion
Here, we show that AT2R signaling, which is abundant in brain mitochondria (31), has an important role in GBM, promoting tumor growth and invasiveness, and that its antagonism has potential therapeutic utility. This study follows our previous work in which we demonstrated that AT2R inhibition with EMA401 inhibits proliferation, invasiveness, and angiogenesis in metastatic melanoma (2). Our results in GBM and melanoma contrast with findings in previously published literature wherein AT1R is considered to be the dominant AngII receptor in neoplasia. In the limited analysis of AT2R in cancer, it is described as a receptor of minor importance, functioning as a counter-regulator to AT1R. However, few studies have used selective agonism and/or antagonism to explore the role of AT2R at biologically relevant levels as we have done, relying instead on ectopic, supraphysiological overexpression of AT2R, with inevitable disturbance of the equilibrium between the multiple components of the RAS. It is also likely that AngII receptors differ functionally between cancer types. Furthermore, the effects of each receptor also depend on the microenvironmental stressors present in the vicinity of cancer cells. In melanoma and as we show here in GBM, under conditions of starvation stress (the norm in most tumor microenvironments), AT2R adopts a dominant protumor function, and its selective antagonism has antitumor effects.
AT2R is typically only weakly expressed and, in the absence of specific antibodies, validation of expression using Western blot or immunostaining is not possible (32). Profiling of expression, therefore, requires messenger RNA analysis of AGTR2. We show that the great majority (85%) of primary GBM explants express AGTR2, and all tested AGTR2-expressing GBM primary cultures were growth inhibited by EMA401, while those lacking detectable AGTR2 were unaffected. The target specificity of EMA401 was further validated using inducible CRISPR/Cas9-KRAB–mediated knockdown of AGTR2. Compared with the nontargeting control cells, AGTR2 knockdown cells were insensitive to AngII, PD123319, and EMA401, consistent with AT2R specificity. Of note, we show that EMA401 is effective beyond two-dimensional culture and efficiently inhibits growth and invasiveness of primary GBM explants cultured as 3D spheroids. We demonstrate autocrine AngII expression in GBM under stress, consistent with the observation that treatment with PD123319 or EMA401 alone is sufficient to inhibit growth in the absence of exogenous AngII. This implies that GBM cells under nutrient starvation induce AngII production to enhance autocrine/paracrine prosurvival signaling via AT2R. SOX2-positive glioma stem cells express all components of a functional RAS, including AGTR2 (33). Taken together with inhibitory effects on proliferation and invasiveness, this affords further support for AT2R inhibition as a viable therapeutic target in GBM.
RNA sequencing revealed that blocking AT2R leads to the differential expression of numerous genes in pathways important in cancer, particularly up-regulation of putative tumor-suppressor genes such as RPH3AL and DUSP2, and down-regulation of genes known to enhance tumor cell survival, such as TRPV6 or ALDH3A1. In addition, pathway analysis showed that many of the differentially expressed genes induced by AT2R inhibition are involved in apoptosis. Functional analysis showed that EMA401 induces caspase-3/7–mediated apoptosis. Caspase-3 is known to increase in response to serum starvation, when it then promotes cell death (30). This is consistent with AT2R inhibition in GBM cells reducing their ability to proliferate in serum-starved conditions. Other proapoptotic genes are also up-regulated, including DFFA (DNA fragmentation factor subunit; 1.2-fold), TNFRSF21 (death receptor 6; 1.5-fold), NFKB2 (NF-κ-B p100 subunit; 1.5-fold), MAP2K3 (dual-specificity mitogen-activated protein kinase 3; 1.7-fold), and RelB (transcription factor; 2.4-fold). Genes known to support the growth of tumor cells are down-regulated by EMA401 treatment, including FGF18 (fibroblast growth factor; 2.7-fold) and PIDD1 (p53-induced death domain protein 1; 1.3-fold). Furthermore, EMA401 leads to down-regulation of glycolytic genes that were specifically up-regulated by AngII, including G6PD, TKT, PDK2, and PDK4. AngII treatment has previously been associated with an increase in glycolysis and EMT transformation, and our results indicate that the antagonism of the AT2R could inhibit these processes (34). Our results contradict previous reports (in other cancer types) in which AT2R itself was proapoptotic even when expressed ectopically (35–37). Moreover, AT2R-independent effects of EMA401 cannot be ruled out, since a small decrease in proliferation was observed in cells with CRISPR-Cas9–mediated knockdown of the AT2R receptor, although this was not significant.
The crystal structure of EMA401 bound to AT2R revealed close similarity with previously determined structures of AT2R bound to small-molecule antagonists. However, EMA401 adopts a substantially different binding pose compared with other ligands. The major differences are the formation of a stacking interaction of the guanidine group of R182ECL2 with the aromatic ring of EMA401, a salt bridge with K2155.42, and a different conformation of the M1283.36 side chain to avoid a steric clash with one of the phenyl rings of EMA401. Using molecular docking, we identified the basis of the superior affinity of EMA401 relative to PD123319; alteration of the benzene ring of EMA401 by an imidazole in the PD123319 core reduces the stacking interaction with the guanidine group of R182ECL2. Understanding these structural parameters will be invaluable in the design of derivatives with even greater selectivity and potency than EMA401.
A potential caveat to the clinical use of EMA401 in GBM is the reported failure of the molecule to efficiently cross the intact BBB (25). Importantly, normal brain vasculature is disrupted in patients with GBM. Tight junctions are progressively disrupted as the tumor grows, leaving the BBB compromised, facilitating the passage of drugs that are usually excluded from the brain (38), and this disruption may allow some CNS uptake of EMA401. However, we modified EMA401 to maximize passage of EMA401 into the brain. Based on the AT2R-EMA401 structure we had deduced, the importance of the carboxylic acid group of the ligand for interaction with AT2R became evident. We therefore sought to mask this group by conjugation of three EMA401 units, via cleavable ester bonds, to Angiopep-2 to generate A3E. Angiopep-2 is a molecule that potentiates the CNS delivery of drugs typically unable to pass the BBB (26–28). Native EMA401 is subject to extensive liver metabolism with the generation of a potentially hepatotoxic metabolites (28), and the recorded A3E efficacy could be mediated not only on the enhanced CNS penetration but also on potential reduction of the metabolic profile of EMA401. The in vitro antiproliferative effect of A3E was at least as potent as EMA401 in all primary GBM explants tested, and biodistribution studies showed markedly increased CNS penetration relative to native EMA401. Together, these observations prompted us to test A3E in an orthotopic model of GBM. Here, we demonstrated a clear inhibitory effect of A3E on growth, whereas native EMA401 did not affect tumor size, presumably as a result of inadequate CNS penetration. Moreover, weight (a marker of systemic impact of tumor growth) was preserved in mice treated with A3E but not in controls or EMA401-treated mice. Overall, these in vivo studies validate AT2R as a viable therapeutic target in GBM and affirm A3E as a leading candidate for further clinical development. Given the high frequency of AT2R expression, our results support further investigation of the RAS and its therapeutic modulation in GBM.
Materials and Methods
Agonists, antagonists, and the drugs AngII, losartan, PD123319, and TMZ were purchased from Sigma, UK. The highly selective AT2R antagonist EMA401 was kindly supplied by Novartis, Switzerland, and purchased from Biorbyt, UK.
In Vitro Biological Evaluation.
Methodology for cell culture and assay protocols for the nucleic acid isolation and analysis; Sulforhodamine B (SRB) and Cell Counting Kit 8 (CCK8) assays; AngII enzyme immunoassay; CRISPR/Cas9-KRAB–mediated AGTR2 knockdown; spheroid growth; invasion and endothelial cell–tube formation assays; RNA sequencing and qPCR; and statistics are provided in the SI Appendix (SI Appendix, Supplementary Methods).
Structural Studies.
Experimental details for AT2R protein expression and purification; lipidic cubic phase crystallization; diffraction data collection; structure determination; and docking analysis are provided in the SI Appendix (SI Appendix, Supplementary Methods).
Synthesis, In Vitro and In Vivo Evaluation of A3E as a Vehicle for EMA401.
Information on the synthesis of A3E; in vivo plasma and brain biodistribution of EMA401 and A3E; LC-MS/MS analysis of brain extracts stability of Α3Ε in human and mice plasma; and the in vivo evaluation of EMA401 and A3E in both subcutaneous and orthotopic xenograft models are provided in the SI Appendix (SI Appendix, Supplementary Methods).
Supplementary Material
Acknowledgments
We thank K. Villers, C. Hanson, and A. Ishchenko for their technical support of structural studies, and Maria Marti-Solano for her fruitful recommendations about the paper. Funding for this work was provided by the following: Brain Tumour Research Campaign (awarded to N.S. and to K.O. and N.S.); Barrow Neurological Foundation (awarded to N.S.); NIH (Grants R35GM127086 to V.C. and UG3NS116929 to V.K.); Dutch Research Council (NOW) Rubicon grant (project no. 019.161LW.035 to B.Z.); and the French Agence Nationale de la Recherche (ANR; Grant ANR-17-CE18-0001-04 “AT2R-Traak-Bioanalgesics” to G.L.). This research is cofinanced by the European Regional Development Fund under the Operational Program Epirus 2014-2020, NSRF 2014-2020 (project code 5033092, BIOPREDICTOR; to A.G.T.). The research work was supported by the Hellenic Foundation for Research and Innovation (HFRI) under the “First Call for H.F.R.I. Research Projects to support Faculty members and Researchers and the procurement of high-cost research equipment grant” (PROTECT, project no.: 991; to A.G.T.). ADT and ADK have been supported by HFRI PhD Fellowship grants ((Fellowship Numbers: 14 and 1075, respectively). The National Institute of General Medical Sciences and National Cancer Institute beamlines at the Advanced Photon Source (GM/CA@APS) have been funded in whole or in part with federal funds from the National Cancer Institute (Grant ACB-12002) and the National Institute of General Medical Sciences (Grant AGM-12006). This research used resources of the Advanced Photon Source, a US Department of Energy (DOE) Office of Science User Facility operated for the DOE Office of Science by Argonne National Laboratory under Contract No. DE-AC02-06CH11357. The Eiger 16M detector at GM/CA X-ray Science Division was funded by NIH Grant S10 OD012289.
Footnotes
The authors declare no competing interest.
This article is a PNAS Direct Submission. W.A.W. is a guest editor invited by the Editorial Board.
This article contains supporting information online at https://www.pnas.org/lookup/suppl/doi:10.1073/pnas.2116289119/-/DCSupplemental.
Data availability
Atomic coordinates and structure factors for AT2R-EMA401 have been deposited in the Research Collaboratory for Structural Bioinformatics Protein Data Bank under the accession code 7JNI (40). All other data supporting the findings of this study are available within the article and its SI Appendix, or from the corresponding authors upon request.
References
- 1.Paul M., Poyan Mehr A., Kreutz R., Physiology of local renin-angiotensin systems. Physiol. Rev. 86, 747–803 (2006). [DOI] [PubMed] [Google Scholar]
- 2.Renziehausen A., et al. , The renin angiotensin system (RAS) mediates bifunctional growth regulation in melanoma and is a novel target for therapeutic intervention. Oncogene 38, 2320–2336 (2019). [DOI] [PubMed] [Google Scholar]
- 3.George A. J., Thomas W. G., Hannan R. D., The renin-angiotensin system and cancer: Old dog, new tricks. Nat. Rev. Cancer 10, 745–759 (2010). [DOI] [PubMed] [Google Scholar]
- 4.Wegman-Ostrosky T., Soto-Reyes E., Vidal-Millán S., Sánchez-Corona J., The renin-angiotensin system meets the hallmarks of cancer. J. Renin Angiotensin Aldosterone Syst. 16, 227–233 (2015). [DOI] [PubMed] [Google Scholar]
- 5.Perdomo-Pantoja A., et al. , Renin angiotensin system and its role in biomarkers and treatment in gliomas. J. Neurooncol. 138, 1–15 (2018). [DOI] [PubMed] [Google Scholar]
- 6.Arrieta O., et al. , Blockage of angiotensin II type I receptor decreases the synthesis of growth factors and induces apoptosis in C6 cultured cells and C6 rat glioma. Br. J. Cancer 92, 1247–1252 (2005). [DOI] [PMC free article] [PubMed] [Google Scholar]
- 7.Stupp R., et al. ; European Organisation for Research and Treatment of Cancer Brain Tumour and Radiation Oncology Groups; National Cancer Institute of Canada Clinical Trials Group, Effects of radiotherapy with concomitant and adjuvant temozolomide versus radiotherapy alone on survival in glioblastoma in a randomised phase III study: 5-year analysis of the EORTC-NCIC trial. Lancet Oncol. 10, 459–466 (2009). [DOI] [PubMed] [Google Scholar]
- 8.Januel E., et al. , Impact of renin-angiotensin system blockade on clinical outcome in glioblastoma. Eur. J. Neurol. 22, 1304–1309 (2015). [DOI] [PubMed] [Google Scholar]
- 9.Kast R. E., Karpel-Massler G., Halatsch M. E., CUSP9* treatment protocol for recurrent glioblastoma: Aprepitant, artesunate, auranofin, captopril, celecoxib, disulfiram, itraconazole, ritonavir, sertraline augmenting continuous low dose temozolomide. Oncotarget 5, 8052–8082 (2014). [DOI] [PMC free article] [PubMed] [Google Scholar]
- 10.Miura S., Karnik S. S., Saku K., Review: Angiotensin II type 1 receptor blockers: Class effects versus molecular effects. J. Renin Angiotensin Aldosterone Syst. 12, 1–7 (2011). [DOI] [PMC free article] [PubMed] [Google Scholar]
- 11.Zizzo M. G., et al. , PD123319, angiotensin II type II receptor antagonist, inhibits oxidative stress and inflammation in 2, 4-dinitrobenzene sulfonic acid-induced colitis in rat and ameliorates colonic contractility. Inflammopharmacology 28, 187–199 (2020). [DOI] [PubMed] [Google Scholar]
- 12.Park Y. A., et al. , Dual targeting of angiotensin receptors (AGTR1 and AGTR2) in epithelial ovarian carcinoma. Gynecol. Oncol. 135, 108–117 (2014). [DOI] [PubMed] [Google Scholar]
- 13.Steckelings U. M., Paulis L., Namsolleck P., Unger T., AT2 receptor agonists: Hypertension and beyond. Curr. Opin. Nephrol. Hypertens. 21, 142–146 (2012). [DOI] [PubMed] [Google Scholar]
- 14.Magnani F., et al. , Electronic sculpting of ligand-GPCR subtype selectivity: The case of angiotensin II. ACS Chem. Biol. 9, 1420–1425 (2014). [DOI] [PMC free article] [PubMed] [Google Scholar]
- 15.Vrettos E. I., et al. , Single peptide backbone surrogate mutations to regulate angiotensin GPCR subtype selectivity. Chemistry 26, 10690–10694 (2020). [DOI] [PubMed] [Google Scholar]
- 16.Tourwé D., et al. , Using conformational constraints at position 6 of angiotensin II to generate compounds with enhanced AT2R selectivity and proteolytic stability. Bioorg. Med. Chem. Lett. 43, 128086 (2021). [DOI] [PubMed] [Google Scholar]
- 17.Rice A. S. C., et al. ; EMA401-003 study group, EMA401, an orally administered highly selective angiotensin II type 2 receptor antagonist, as a novel treatment for postherpetic neuralgia: A randomised, double-blind, placebo-controlled phase 2 clinical trial. Lancet 383, 1637–1647 (2014). [DOI] [PubMed] [Google Scholar]
- 18.Smith M. T., Wyse B. D., Edwards S. R., Small molecule angiotensin II type 2 receptor (AT2R) antagonists as novel analgesics for neuropathic pain: Comparative pharmacokinetics, radioligand binding, and efficacy in rats. Pain Med. 14, 692–705 (2013). [DOI] [PubMed] [Google Scholar]
- 19.Ballesteros J. A., Weinstein H., “Integrated methods for the construction of three-dimensional models and computational probing of structure-function relations in G protein-coupled receptors” in Methods in Neurosciences, Sealfon S. C., Ed. (Academic Press, 1995), pp. 366–428. [Google Scholar]
- 20.Zhang H., et al. , Structural basis for selectivity and diversity in angiotensin II receptors. Nature 544, 327–332 (2017). [DOI] [PMC free article] [PubMed] [Google Scholar]
- 21.Hilger D., Masureel M., Kobilka B. K., Structure and dynamics of GPCR signaling complexes. Nat. Struct. Mol. Biol. 25, 4–12 (2018). [DOI] [PMC free article] [PubMed] [Google Scholar]
- 22.Asada H., et al. , The crystal structure of angiotensin II type 2 receptor with endogenous peptide hormone. Structure 28, 418–425.e4 (2020). [DOI] [PubMed] [Google Scholar]
- 23.Asada H., et al. , Crystal structure of the human angiotensin II type 2 receptor bound to an angiotensin II analog. Nat. Struct. Mol. Biol. 25, 570–576 (2018). [DOI] [PubMed] [Google Scholar]
- 24.Smith M. T., Muralidharan A., Targeting angiotensin II type 2 receptor pathways to treat neuropathic pain and inflammatory pain. Expert Opin. Ther. Targets 19, 25–35 (2015). [DOI] [PubMed] [Google Scholar]
- 25.Anand U., et al. , Angiotensin II type 2 receptor (AT2 R) localization and antagonist-mediated inhibition of capsaicin responses and neurite outgrowth in human and rat sensory neurons. Eur. J. Pain 17, 1012–1026 (2013). [DOI] [PMC free article] [PubMed] [Google Scholar]
- 26.Wang L., et al. , Co-delivery of doxorubicin and siRNA for glioma therapy by a brain targeting system: Angiopep-2-modified poly(lactic-co-glycolic acid) nanoparticles. J. Drug Target. 23, 832–846 (2015). [DOI] [PubMed] [Google Scholar]
- 27.Figueiredo P., et al. , Angiopep2-functionalized polymersomes for targeted doxorubicin delivery to glioblastoma cells. Int. J. Pharm. 511, 794–803 (2016). [DOI] [PubMed] [Google Scholar]
- 28.Gao H., et al. , Angiopep-2 and activatable cell-penetrating peptide dual-functionalized nanoparticles for systemic glioma-targeting delivery. Mol. Pharm. 11, 2755–2763 (2014). [DOI] [PubMed] [Google Scholar]
- 29.Abadir P. M., et al. , Identification and characterization of a functional mitochondrial angiotensin system. Proc. Natl. Acad. Sci. U.S.A. 108, 14849–14854 (2011). [DOI] [PMC free article] [PubMed] [Google Scholar]
- 30.Murgasova R., et al. , Non-clinical characterization of the disposition of EMA401, a novel small molecule angiotensin II type 2 receptor (AT2R) antagonist. Biopharm. Drug Dispos. 41, 166–183 (2020). [DOI] [PubMed] [Google Scholar]
- 31.Valenzuela R., et al. , Mitochondrial angiotensin receptors in dopaminergic neurons. Role in cell protection and aging-related vulnerability to neurodegeneration. Cell Death Dis. 7, e2427 (2016). [DOI] [PMC free article] [PubMed] [Google Scholar]
- 32.Benicky J., Hafko R., Sanchez-Lemus E., Aguilera G., Saavedra J. M., Six commercially available angiotensin II AT1 receptor antibodies are non-specific. Cell. Mol. Neurobiol. 32, 1353–1365 (2012). [DOI] [PMC free article] [PubMed] [Google Scholar]
- 33.Bradshaw A. R., et al. , Glioblastoma multiforme cancer stem cells express components of the renin-angiotensin system. Front. Surg. 3, 51 (2016). [DOI] [PMC free article] [PubMed] [Google Scholar]
- 34.Gao J., Wei T., Huang C., Sun M., Shen W., Sirtuin 3 governs autophagy-dependent glycolysis during angiotensin II-induced endothelial-to-mesenchymal transition. FASEB J. 34, 16645–16661 (2020). [DOI] [PubMed] [Google Scholar]
- 35.Miura S., Karnik S. S., Saku K., Constitutively active homo-oligomeric angiotensin II type 2 receptor induces cell signaling independent of receptor conformation and ligand stimulation. J. Biol. Chem. 280, 18237–18244 (2005). [DOI] [PubMed] [Google Scholar]
- 36.Pickel L., et al. , Over-expression of angiotensin II type 2 receptor gene induces cell death in lung adenocarcinoma cells. Cancer Biol. Ther. 9, 277–285 (2010). [DOI] [PMC free article] [PubMed] [Google Scholar]
- 37.Ishiguro S., et al. , Involvement of angiotensin II type 2 receptor (AT2R) signaling in human pancreatic ductal adenocarcinoma (PDAC): A novel AT2R agonist effectively attenuates growth of PDAC grafts in mice. Cancer Biol. Ther. 16, 307–316 (2015). [DOI] [PMC free article] [PubMed] [Google Scholar]
- 38.Watkins S., et al. , Disruption of astrocyte-vascular coupling and the blood-brain barrier by invading glioma cells. Nat. Commun. 5, 4196 (2014). [DOI] [PMC free article] [PubMed] [Google Scholar]
- 39.Lomize M. A., Pogozheva I. D., Joo H., Mosberg H. I., Lomize A. L., OPM database and PPM web server: Resources for positioning of proteins in membranes. Nucleic Acids Res. 40 (Database issue, D1), D370–D376 (2012). [DOI] [PMC free article] [PubMed] [Google Scholar]
- 40.Cherezov V., Shaye H., Han G. W., Crystal structure of the angiotensin II type 2 receptoror (AT2R) in complex with EMA401. Protein Data Bank. https://www.rcsb.org/structure/7JNI. Deposited 4 August 2020.
Associated Data
This section collects any data citations, data availability statements, or supplementary materials included in this article.
Supplementary Materials
Data Availability Statement
Atomic coordinates and structure factors for AT2R-EMA401 have been deposited in the Research Collaboratory for Structural Bioinformatics Protein Data Bank under the accession code 7JNI (40). All other data supporting the findings of this study are available within the article and its SI Appendix, or from the corresponding authors upon request.


