

Abstract
As one of the most prevalent post-transcriptional epigenetic modifications, N5-methylcytosine (m5C) plays an essential role in various cellular processes and disease pathogenesis. Therefore, it is important accurately identify m5C modifications in order to gain a deeper understanding of cellular processes and other possible functional mechanisms. Although a few computational methods have been proposed, their respective models have been developed using small training datasets. Hence, their practical application is quite limited in genome-wide detection. To overcome the existing limitations, we propose Deepm5C, a bioinformatics method for identifying RNA m5C sites throughout the human genome. To develop Deepm5C, we constructed a novel benchmarking dataset and investigated a mixture of three conventional feature-encoding algorithms and a feature derived from word-embedding approaches. Afterward, four variants of deep-learning classifiers and four commonly used conventional classifiers were employed and trained with the four encodings, ultimately obtaining 32 baseline models. A stacking strategy is effectively utilized by integrating the predicted output of the optimal baseline models and trained with a one-dimensional (1D) convolutional neural network. As a result, the Deepm5C predictor achieved excellent performance during cross-validation with a Matthews correlation coefficient and an accuracy of 0.697 and 0.855, respectively. The corresponding metrics during the independent test were 0.691 and 0.852, respectively. Overall, Deepm5C achieved a more accurate and stable performance than the baseline models and significantly outperformed the existing predictors, demonstrating the effectiveness of our proposed hybrid framework. Furthermore, Deepm5C is expected to assist community-wide efforts in identifying putative m5Cs and to formulate the novel testable biological hypothesis.
Keywords: RNA N5-methylcytosine, epigenetic regulation, deep learning, machine learning, prediction model, sequence analysis, systematic evaluation, bioinformatics, stacking framework, baseline models
Graphical abstract
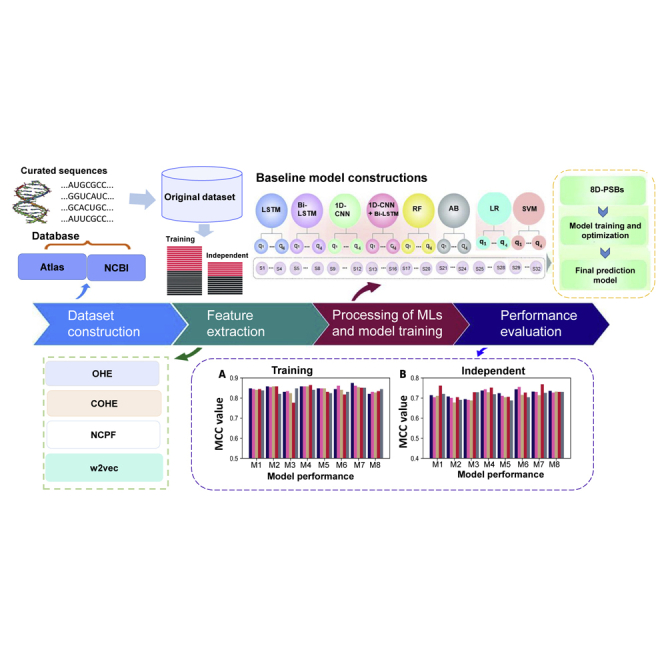
To develop Deepm5C, we constructed a novel benchmarking dataset and investigated a mixture of three conventional feature-encoding algorithms and a feature derived from word embedding approaches. A stacking strategy is effectively utilized by integrating the predicted output of these baseline models and trained with a 1D convolutional neural network. Deepm5C achieved a more accurate and stable performance than the baseline models and significantly outperformed the existing predictors.
Introduction
In all three domains (i.e., bacteria, archaea, and eukarya) of life, RNA modification plays an essential role. Approximately 150 RNA-modification sites have been identified to date, and 5-methylcytosine (m5C) is one of the most common modification types that contributes to various cellular processes.1, 2, 3 m5C influences RNA translation efficiency and structure stability, and further studies have confirmed that it regulates tissue differentiation and mRNA export.3,4 Furthermore, several studies have shown that m5C was not only found in tRNA and rRNA but was also found in mRNA and non-coding RNA.5, 6, 7 It has been reported that human m5C is associated with many diseases, including Parkinson’s disease, autosomal recessive intellectual disability, breast cancer, and amyotrophic lateral sclerosis.8,9 Therefore, the identification of m5C is essential for understanding RNA-modification processes and revealing the epigenetic regulation of related diseases.
As our knowledge of the RNA m5C modification and its distribution in multicellular eukaryotes remains incomplete, it is essential to identify its precise location within the genome. In recent years, several wet-lab experiments have been performed to identify RNA m5Cs, such as m5C-seq,10,11 which is an antibody-based method for epitranscriptome analysis offering even better resolution. Considering the rapid rise of novel RNA sequences and experimental complexities, it is now important and timely to develop an efficient bioinformatics method to identify methylated cytosine sites in RNA levels. Despite the growing number of experimentally determined m5Cs, the underlying mechanisms of RNA m5C specificity remain largely unknown. Moreover, large-scale experimental identification of RNA m5C is laborious, time-consuming, and some suffer from poor sequencing quality and signal-to-noise ratios.12 Alternatively, accurate and cost-effective computational approaches can be used to complement the experimental efforts for identifying RNA m5C based upon existing experimental data.13, 14, 15, 16
Several computational methods have been developed over the past decade to identify human RNA m5C sites.17, 18, 19, 20, 21 In particular, iRNA-m5C,20 RNAm5Cfinder,22 RNAm5CPred,18 m5CPred-SVM,17 m5Cpred-XS,23 and iRNAm5C-PseDNC19 have the capability of predicting human m5C sites. Apart from human m5C site prediction methods, few methods have been proposed to identify m5C sites from other species, including Staem5,24 unnamed predictor,25 and PEA-m5C.26 Despite the excellent performance of all these human m5C prediction methods, their major disadvantages were the smaller size of their training dataset, the single machine learning (ML)-based models investigated, and the limited feature encodings used. Furthermore, most of the methods did not evaluate their models through external validation. As a result, their training performance may be the result of overoptimization or overfitting and may not apply to large arrays of practical situations. Among the existing methods, two (RNAm5CPred18 and iRNAm5C-PseDNC19) utilized a large dataset of 475 m5C sites and 1,425 non-m5C sites for training. Notably, the number of experimental samples is growing exponentially. Compared with the current experimental number, the number of the existing method-employed training samples is very small. Therefore, it appears that the existing training datasets may not represent all available m5Cs and non-m5Cs. Thus, the transferability of the above-mentioned methods remains questionable when applied to genome-wide applications.
In this work, we present a novel deep learning (DL)-based hybrid approach called Deepm5C for the prediction of RNA m5C sites in the human genome. Firstly, we constructed a novel, up-to-date benchmarking dataset by collecting positive samples from recent databases,27 a dataset approximately nine times larger than that used in previous studies. Secondly, we employed four different encodings, including one-hot encoding (OHE), a novel contextual OHE (COHE), nucleotide chemical property and frequency (NCPF), and word2vec, and eight classifiers and constructed their respective models . Of the eight classifiers, four are DL-based variants, including long short-term memory (LSTM), bidirectional-LSTM (Bi-LSTM), one-dimensional convolutional neural network (1D-CNN), and 1D-CNN with Bi-LSTM. The remaining four are traditional ML classifiers, including AdaBoost (AB), random forest (RF), logistic regression (LR), and support-vector machine (SVM). Finally, we selected important models from 32 baseline models, and we efficiently combined them using a stacking method inspired by recent research.28, 29, 30, 31, 32 Consequently, Deepm5C performed exceptionally well compared with baseline models during cross-validation and independent tests. Furthermore, Deepm5C significantly outperformed the existing predictors for identifying m5C sites, demonstrating the efficiency of the proposed hybrid framework.
Results
Performance evaluation of different feature-encoding schemes using 10 randomized 5-fold cross-validation and independent tests
This section comprehensively evaluated eight different classifiers (four DL classifiers: LSTM, Bi-LSTM, 1D-CNN, and 1D-CNN with Bi-LSTM, and four conventional ML classifiers: RF, AB, SVM, and LR) and four different feature encodings (OHE, COHE, NCPF, and word2vec) using 5-fold cross-validation. Generally, one may tend to overoptimize the prediction model during cross-validation in order to achieve the highest Matthews correlation coefficient (MCC) or area under the receiver operating characteristic (ROC) curve (AUC).33,34 In this study, we performed 5-fold cross-validation repeatedly ten times by randomly partitioning the training dataset to reduce any bias introduced during cross-validation.
Firstly, we examined the performance of four encodings in distinguishing m5Cs from non-m5Cs (Figure 1; Table S2). All four encodings displayed an excellent performance regardless of the classifier employed, with AUCs greater than 0.85, indicating that all four employed features possess excellent discriminative ability between m5Cs and non-m5Cs. Furthermore, we observed that DL-based classifiers consistently perform better than conventional classifiers in all four encodings, indicating that DL-based classifiers have the upper hand due to the larger training dataset. Interestingly, 1D-CNN using word2vec achieved the best performance among 32 prediction models with a sensitivity (Sn), specificity (Sp), accuracy (ACC), MCC, and AUC of 0.830, 0.862, 0.846, 0.688, and 0.924, respectively. Specifically, ACC, MCC, and AUC metrics achieved by 1D-CNN-word2vec are 0.2%–4.2%, 0.2%–8.6%, and 0.6%–5.8%, respectively, higher than the other 31 models. Notably, the models were trained using a rigorous cross-validation process; therefore, we examined whether these models could replicate similar performance on the independent validation set.
Figure 1.

Performances of four different encodings with respect to eight different classifiers on the training dataset
(A–D) OHE (A), COHE (B), NCPF (C), and word2vec (D).
The result of the independent test showed that DL-based models performed better than traditional ML classifiers regardless of the features (Figure 2; Table S3). Interestingly, the performance pattern of the classifiers based on the independent test (DL versus conventional classifiers) was similar to that obtained from cross-validation. Notably, the best-performing model (1D-CNN-word2vec) during the cross-validation and another model (1D-CNN-OHE) achieved the best and the same level of performances in independent evaluation with an Sn, Sp, ACC, and MCC of 0.824, 0.861, 0.842, and 0.685, respectively. In AUC, 1D-CNN-word2vec (0.917) is slightly higher than the 1D-CNN-OHE model (0.912). Specifically, the ACC, MCC, and AUC metrics achieved by these two models are 0.2%–4.2%, 1.5%–8.4%, and 0.5%–5.7%, respectively, higher than the other 30 models. Overall, ten randomized cross-validations did not overfit the model and provided a more remarkable level of generalization on unseen data. Inspired by the series of studies,28, 29, 30, 31 we attempted a stacking strategy to improve the model performance on both training and independent datasets.
Figure 2.

Performances of four different encodings with respect to eight different classifiers on the independent dataset
(A–D) OHE (A), COHE (B), NCPF (C), and word2vec (D).
Deepm5C construction and evaluation
Stacking is a powerful ensemble-learning approach that combines the information from several different classifiers to develop a robust prediction model. This approach has been successfully applied in several recent computational biology and bioinformatics studies.28, 29, 30, 31 Firstly, we ranked the baseline classifiers according to their classification performance in terms of the AUC. Secondly, we obtained the predicted probability values from 32 baseline models and categorized them into four groups based to their ranking, G1 = {p1, p2, …, p8}, G2 = {p1, p2, …, p8, …, p16}, G3 = {p1, p2, p3, …, p24}, and G4 = {p1, p2, p3, …, p32}. Previous studies demonstrated the importance of exploring different classifiers during meta-learning rather than specifically selecting LR. Therefore, in the third step, we inputted each group to eight classifiers (i.e., LSTM, Bi-LSTM, 1D-CNN, 1D-CNN with Bi-LSTM, RF, AB, SVM, and LR) and assessed their performances. Figure 3 shows that 1D-CNN’s performance is slightly superior to other classifiers regardless of the groups. Unlike cross-validation, the conventional classifier is competitive with the 1D-CNN, possibly because of the intrinsic discriminative nature of the probabilistic features. Specifically, 1D-CNN achieved ACCs of 0.855, 0.853, 0.852, and 0.854 for G1, G2, G3, and G4, respectively.
Figure 3.

Performances of eight different classifiers on different group of probabilistic features on the training dataset
(A–D) G1 (top 8 features) (A), G2 (top 16 features) (B), G3 (top 24 features) (C), and G4 (all 32 features) (D).
Next, we evaluated all four models on an independent validation dataset. Figure 4 shows that 1D-CNN’s performance is slightly superior to other classifiers and consistently better than the other seven classifiers. Specifically, 1-DCNN achieved ACCs of 0.852, 0.848, 0.848, and 0.850, respectively, for G1, G2, G3, and G4. As the G1 contains a lesser feature dimension and achieves marginally superior performance over other groups on the training and independent datasets, we selected the 1D-CNN-based model from G1 and named it Deepm5C. The predicted probability of m5C is optimized to define the class (m5C or non-m5C), and we obtained the following value . Then, we examined the G1 probabilistic features and found that none of the conventional-classifier-employing baseline models contributed to prediction performance and that only the DL-based baseline models contributed in Deepm5C, including 1D-CNN-word2vec, 1D-CNN-OHE, LSTM-OHE, 1D-CNN-biLSTM-word2vec, LSTM-NCPF, Bi-LSTM-COHE, 1D-CNN-NCPF, and Bi-LSTM-word2vec.
Figure 4.

Performances of eight different classifiers on different group of probabilistic features on the independent dataset
(A–D) G1 (top 8 features) (A), G2 (top 16 features) (B), G3 (top 24 features) (C), and G4 (all 32 features) (D).
Comparison of Deepm5C with the best single-feature model
To check whether the stacking strategy improved the performance, we compared Deepm5C with the 1D-CNN-word2vec model. As shown in Table 1, Deepm5C consistently achieved better performance both on training and independent datasets. Specifically, Deepm5C’s performance improved by 0.9% in ACC, 0.9% in MCC, and 1.7% in AUC during cross-validation. The corresponding improvement for independent validation is 0.95%, 0.6%, and 2.1%. Overall, Deepm5C significantly outperformed the best baseline model on both datasets (p < 0.05). Deepm5C’s superior performance demonstrated that stacking strategy has the potential to improve the performance without overfitting.
Table 1.
Performance comparison between Deepm5C and the best single-feature model
| Dataset | Method | Sn | Sp | ACC | MCC | AUC | PRAUC | p value |
|---|---|---|---|---|---|---|---|---|
| Training | 1D-CNN-word2vec | 0.830 (0.04) | 0.862(0.02) | 0.846 (0.08) | 0.688 (0.12) | 0.924 (0.03) | 0.909 (0.04) | 0.018 |
| Deepm5C | 0.835(0.06) | 0.875(0.01) | 0.855 (0.07) | 0.697(0.10) | 0.941(0.05) | 0.922(0.07) | – | |
| Independent validation | 1D-CNN-word2vec | 0.824 | 0.861 | 0.842 | 0.685 | 0.917 | 0.889 | 0.026 |
| Deepm5C | 0.846 | 0.857 | 0.852 | 0.691 | 0.938 | 0.901 | – |
Note: The values within the parenthesis indicate the standard error (SE) of training performance using a 5-fold CV. p value was calculated by comparing Deepm5C and 1D-CNN-word2vec AUC values.
Comparison of Deepm5C with the existing predictors
In this comparison, we used four existing methods that are publicly available, including iRNA-m5C, RNAm5Cfinder, iRNAm5C-PseDNC, and RNAm5CPred. In Table 2, the performance of Deepm5C is compared with that of state-of-the-art methods. RNAm5CPred achieved the best performance among the existing predictions with an Sn, Sp, ACC, and MCC of 0.639, 0.716, 0.678, and 0.237, respectively. However, Deepm5C significantly outperformed the current best predictor in all four metrics. Deepm5C improved 20.7% in Sn, 14.1% in Sp, 17.4% in ACC, and 45.4% in MCC, which indicates that our method may be applicable to whole-genome sequences and may identify putative m5C sites. Furthermore, the Deepm5C improvement is attributed to the use of a larger training dataset in this study and the stacking approach used with the optimal baseline models.
Table 2.
Comparison of Deepm5C with the existing predictor on independent dataset
| Method | Sn | Sp | ACC | MCC |
|---|---|---|---|---|
| iRNA-m5C | 0.604 | 0.727 | 0.666 | 0.189 |
| RNAm5Cfinder | 0.724 | 0.513 | 0.619 | 0.143 |
| iRNAm5C-PseDNC | 0.589 | 0.680 | 0.635 | 0.157 |
| RNAm5CPred | 0.639 | 0.722 | 0.681 | 0.247 |
| Deepm5C | 0.846 | 0.857 | 0.852 | 0.691 |
Model interpretation
We applied the SHAP method on top eight features to understand the robustness behind the Deepm5C method. The mathematical formulation and detailed description of SHAP is provided in previous studies35,36 and has been widely applied in computational biology.29,30 The same procedure was followed here to calculate SHAP. Figure 5 shows the eight probabilistic features ranking based on the SHAP values and their directionality. The SHAP values are negative or positive depending on whether a feature has “low” or “high” values. Thus, the positive and negative values influence the prediction toward m5Cs and non-m5Cs, respectively. The result shows that Bi-LSTM and 1D-CNN generated probability values using four different feature encodings, ranked from the top 1 to 4, play a significant role, while the remaining four features perform a complementary role in Deepm5C prediction. Thus, all encodings used in this study contributed to the final prediction; however, the probability features of each classifier varied. Finally, the SHAP results suggest that adding more feature encodings to the Deepm5C framework may improve the prediction performance.
Figure 5.

SHAP values for eight probabilistic features for Deepm5C predictions
Colors indicate feature values (blue: low and red: high), and SHAP (positive and negative) values indicate the directionality of the probabilistic features.
Probabilistic-feature analysis
The performance of Deepm5C is substantially better than that of the baseline models in both training and independent datasets. To understand the reason, we computed the t-distributed stochastic neighbor embedding (t-SNE) using scikit-learn v.0.22.1 with three parameters (perplexity = 50, n_component = 2, and learning rate = 300) on 8D optimal probability score of baseline models (PSBs). We observed two distinct clusters of positive and negative samples in the feature space of the PSBs, with some overlaps on both training and independent datasets (Figures 6A and 6B), indicating that PSBs can be used to identify underlying patterns between m5C and non-m5C samples. Therefore, 8D probabilistic features have the capability to predict m5Cs with a high level of accuracy. Furthermore, we computed the pairwise Pearson’s correlation coefficient between the 8D features for the training (Figure 7A) and independent datasets (Figure 7B) to examine the relationship between them. The result shows that bi-LSTM-word2vec, 1D-CNN-NCPF, BiLSTM-COHE, and 1D-CNN-OHE are highly correlated among themselves, while the remaining 4 probabilistic features are moderately correlated with other features. In summary, these findings suggest that correlation patterns are similar between training and independent datasets, where all 8D features contribute to the consistent performance on both datasets.
Figure 6.

t-distributed stochastic neighbor embedding (t-SNE) distribution of 8D probabilistic features
(A and B) Distribution of features on (A) training and (B) independent datasets.
Figure 7.

Cluster heatmap of the correlation between the 8D probabilistic features
(A and B) Training (A) and (B) independent datasets.
Discussion
An accurate prediction of m5C sites is one of the most challenging tasks in bioinformatics. In the past, several computational approaches have been developed to identify m5C sites from different species17, 18, 19, 20, 21 with a limited training dataset and feature encodings. Nevertheless, these methods are not suitable for the detection of human m5C on a genome-wide scale. To overcome the shortcomings of the existing methods, we constructed a novel benchmarking dataset that is approximately 9-fold larger than the existing methods. Additionally, we integrated four different encodings and eight different classifiers to develop a robust predictor named Deepm5C. Deepm5C, achieved consistent cross-validation and independent evaluation performances, indicating that it did not suffer from over-fitting and did well on unseen data. Furthermore, Deepm5C consistently outperformed the baseline models on both cross-validation and independent assessment, as well as the existing predictors in an independent assessment. The superior performance of Deepm5C is mainly due to the following attributes: (1) a large high-quality training dataset was used for the model development, (2) integration of DL variants by stacking approach, and (3) 8D probabilistic features have effectively learned the discriminative patterns between m5Cs and non-m5Cs.
The proposed stacking approach can be applied to other species-specific post-transcriptional or -replication modification site predictions. In the future, we intend to extend this framework to develop improved prediction models of different species, including Mus musculus and Saccharomyces cerevisiae. While constructing a model, we will explore additional features and classifiers within the Deepm5C framework and determine whether they can improve prediction accuracy. There have recently been several classical ML frameworks proposed for dealing with various sequence-based function-prediction problems.37, 38, 39, 40, 41, 42, 43 Therefore, it should be worthwhile to compare these frameworks with our proposed Deepm5C. Additionally, in order to uncover biological features, several platforms have recently been developed for the analysis of DNA, RNA, and protein sequences based on different biological language models, including BioSeq-BLM44 and BioSeq-Analysis2.0.45,46 These platforms may be applied to explore more biological features and determine whether they improve the prediction accuracy. It is anticipated that Deepm5C will serve as a valuable tool for facilitating community-wide efforts in identifying m5C sites, as well as providing high-quality predicted putative sites to facilitate hypothesis generation and biological validation.
Materials and methods
Overall framework of Deepm5C
Figure 8 summarizes the design of the Deepm5C predictor and the evaluation process. The process consists of four steps: data collection and curation, feature extraction, model training, and performance evaluation. Initially, based on literature searches and existing databases, we created a high-quality benchmark dataset and subsequently constructed redundancy-reduced training and independent datasets. Second, we comprehensively extracted four different features that cover position-specific properties, compositional information, and physicochemical properties. Third, we evaluated a series of baseline models and developed a stacking-based meta-model. The fourth step was to compare the performance of Deepm5C with the baseline models on cross-validation and independent assessment. The Deepm5C’s source code is available at https://github.com/hasan022/Deepm5C.
Figure 8.

The overall framework of Deepm5C
Five significant steps include data collection and curation, feature extraction, model training, performance evaluation, and model implementation.
Data collection and curation
A few databases exist that contain information on RNA-modification sites and their implication for pathogenesis,27,47,48 which form the basis for the development of numerous prediction models.49,50 However, we utilized the updated and recent m6A-Atlas database27 and extracted human m5C sites (positive samples) (www.xjtlu.edu.cn/biologicalsciences/atlas), resulting in 95,390 sequences. Notably, the extracted sequences consist of 41 base pairs (bp), with a cytosine nucleotide at the center and nucleotide variations observed in the upstream (20 bp) and downstream (20 bp) sequences. The CD-HIT of 0.9 was applied to exclude sequences that share >90% sequence identity with other sequences, which resulted in 58,159 positive samples. Furthermore, we employed the approach suggested by previous studies33,51,52 to construct the negative samples due to lack of experimentally characterized non-m5C sites. Notably, all chromosomes were considered and generated for 41 bp fragments with the cytosine at the center. Then, we excluded the fragments that overlapped with the m5C sites and the fragments that shared high similarity among non-m5C sites using the CD-HIT of 0.9. Ultimately, this resulted in a massive number of negative samples. However, 58,159 non-m5Cs were randomly selected to balance the m5Cs sample size. To evaluate the robustness of the model, 20% (11,630 m5Cs and 11,630 non-m5Cs) were randomly selected from the original dataset, and we treated them as the independent dataset. However, the remaining 80% (46,559 m5Cs and 46,559 non-m5Cs) were considered as training data for prediction-model development. Table S1 provides a statistical overview of the dataset generated in this study.
Feature-encoding algorithms
The ability to extract meaningful features from sequence or structural information is directly related to the performance of ML-based models.53,54 Therefore, to extract crucial information around m5Cs and non-m5Cs from the training dataset, we explored four different feature descriptors: OHE, COHE, NCPF, and word2vec. A brief description of each encoding is as follows.
OHE
OHE encoding extracts the nucleotide position in a given sequence as a binary vector, which is defined as follows:
| (Equation 1) |
OHE generates a 164 (4 × 41)-D feature vector for the given RNA sequence with 41 bp.
COHE
To include multiple nucleotides’ information at each position of 41 bp, we developed a novel COHE-feature matrix. As shown in Figure S1, the COHE matrix was generated by concatenating different window sizes of k-space nucleotide features. We arranged the vectors of consecutive k nucleotides of the OHE-based feature matrices in line and concatenated them to create the COHE-based feature matrices. Thus, each vector in the matrix includes information of consecutive multiple nucleotides. In this study, we set k as 25, and the sequence window was represented by a 17 × 100 matrix. This is the first time COHE has been used for sequence-based prediction.
NCPF
There are four nucleotides in an RNA sequence (A, U, G, C), and each nucleotide has a different structure, function, and arrangement.55 However, all these nucleotides can be classified into three major groups based on chemical properties as follows:
| (Equation 2) |
where ai, bi, and ci, respectively, represent ring structure, functional group, and hydrogen bonds. Therefore, “A” can be encoded to (1, 1, 1), “C” to (0, 1, 0), “G” to (1, 0, 0), and “U” to (0, 0, 1).
The density of the ith nucleotide is calculated by the following formula:
| (Equation 3) |
where L, Nj, and q are the length of the RNA sequence, the length of the ith prefix string in the sequence, and the concerned nucleotide, respectively.
word2vec
word2Vec is one of the most powerful embedding methods in the field of natural-language processing. It encodes various linguistic regularities and patterns to distribute representations of words by learning the context of words. Two approaches exist for learning the context of words: the Continuous Bag-of-Words (CBOW) and Continuous Skip-Gram (Skip-Gram) models. While CBOW predicts the current word based on the context during the learning process, Skip-Gram predicts the context based on the current word. Studies have shown that Skip-Gram performed better than CBOW in a semantic task.56 The word2vec model was trained based on the Skip-Gram model on the training data to produce 100-dimensional vectors per each 4-mer.
Model training and optimization
In this work, we considered four DL algorithms, and four classical ML methods were employed.
DL classifiers
In recent years, the advantages and potential of DL techniques have been demonstrated in several biological applications due to the explosive growth of available biological data.57, 58, 59, 60 The descriptions of four variants are as follows.
LSTM
LSTM is an architecture of artificial recurrent neural network (RNN) used in DL.61 Despite this, RNNs are not capable of learning long-term dependencies by gradient disappearance and explosion. LSTM solves the problem of the RNN by introducing gate structures and a memory cell in the unit so that LSTM can learn both long- and short-term dependencies. With this advantage, we set the hidden size of the LSTM unit as 1.
Bi-LSTM
Bi-LSTM is a sequence-converting model consisting of two LSTMs: one taking the input in a forward direction and the other in a backward direction.62 The features are input into the LSTM units at each step. In LSTM, the result is obtained by applying a fully connected layer to the forward and reverse LSTM units’ outputs. However, in Bi-LSTM, the result is obtained by concatenating the outputs from the final stage of forward and reverse LSTMs and applying a fully connected layer. Finally, we used a sigmoid function as the activation functions of the fully connected layer to obtain the final output between 0 and 1.
1D-CNN
In this study, we have considered the 1D convolution layer for the model construction. In 1D-CNN, where input and output data are both 2D, the CNN kernel moves in one direction to extract the features. However, in a 2D CNN, the kernel moves in two directions to extract the features, while input and output data are 3D. A sigmoid function is used as the activation function in 1D CNNs. The number of filters, filter size, and stride of the filters in the convolution layer are 32, 5, and 1, respectively, while the pool size and stride of the max-pooling layer are 2 and 2, respectively. Each convolutional layer with the rectified linear unit (ReLU) function generates an output that is sent to the max-pooling layer. The output of each max-pooling layer is sent to each dropout layer with a probability of 0.4. The output of the second max-pooling layer is flattened and sent to the fully connected layer to generate the final output.
1D-CNN with Bi-LSTM
We used a model combining 1D-CNN and Bi-LSTM for prediction. Here, the intermediate matrixes from the second max-pooling layer in 1D-CNN are inputted into Bi-LSTM. Then, as in the case of Bi-LSTM alone, the outputs from forward and reverse LSTM units at the final step were concatenated, and a fully connected layer was used to generate an outcome. We set the hidden size in Bi-LSTM as 128. For comparison, we adjusted these parameters both in 1D-CNN and Bi-LSTM models.
Classical ML models
We considered four widely applied classifiers, including RF,63 SVM,17 LR, and AB. All these classifiers have been extensively applied in the field of bioinformatics and computational biology.35,64,65 The implementation strategy of these classifiers for m5C prediction is the same as previous studies,37,55,63,66, 67, 68 including ML hyperparameter grid-search ranges. Notably, RF threshold values of 0.45, 0.30, 0.55, and 0.6 were used to determine the class (m5C or non-m5C) for OHE, COHE, NCPF, and word2vec features, respectively. Similarly, the threshold values of the LR, SVM, and AB were (0.40, 0.48, 0.38, and 0.505), (0.00, 0.05, 0.10, and 0.035), and (0.60, 0.18, 0.5, and 0.32), respectively.
Stacking models
The stacking strategy consists of integrating the strengths of a number of predictive models to generate a stable meta-based prediction model.28, 29, 30, 31 With four different encodings and eight different classifiers, we generated 32 baseline models using 10 randomized 5-fold cross-validation. These baseline models predicted probability values that resulted in 32D feature vector. Furthermore, the novel feature vector was divided into four groups (G1–G4), in which the G1, G2, G3, and G4 groups contained top 8, top 16, top 24, and all 32D feature vectors, respectively. Notably, the AUC was used as a measure of ranking the probabilistic features based on the baseline model performance. Finally, we trained eight different classifiers on each group and selected the best model by comparing the 32 models.
Performance comparison
We considered the commonly used four metrics for evaluating the prediction model performance,69,70 including ACC, Sp, Sn, and MCC. A brief description of these metrics is as follows:
| (Equation 4) |
where TP, FP, TN, and FN denote true positive, false positive, true negative, and false negative, respectively. We also used the ROC curve and the AUC to assess the overall performance; the closer the AUC value to 1.0, the better. Notably, we used the AUC measure to evaluate the global model performance.
Acknowledgments
This work benefited from the support of U19AG05537301 and R01AR069055. B.M. and J.Y.C. were supported by the Research Foundation of Korea (NRF), which was funded by the Korean government (MSIT) (2021R1A2C1014338 and 2017R1A6A1A03015642).
Author contributions
Conceived and designed the experiments, M.M.H., B.M., and H.-W.D.; performed the experiments, M.M.H.; analyzed the data, M.M.H., B.M., J.Y.C., and S.T.; wrote the paper, M.M.H., B.M., J.Y.C., M.A.A., H.K., X.L., and H.-W.D. All authors discussed the results and commented on the manuscript.
Declaration of interests
The authors declare that they have no known competing financial interests.
Footnotes
Supplemental information can be found online at https://doi.org/10.1016/j.ymthe.2022.05.001.
Contributor Information
Md Mehedi Hasan, Email: mhasan1@tulane.edu.
Balachandran Manavalan, Email: bala2022@skku.edu.
Hong-Wen Deng, Email: hdeng2@tulane.edu.
Supplemental information
References
- 1.Breuer R., Gomes-Filho J.V., Randau L. Conservation of archaeal C/D box sRNA-guided RNA modifications. Front. Microbiol. 2021;12:654029. doi: 10.3389/fmicb.2021.654029. [DOI] [PMC free article] [PubMed] [Google Scholar]
- 2.Forterre P. Three RNA cells for ribosomal lineages and three DNA viruses to replicate their genomes: a hypothesis for the origin of cellular domain. Proc. Natl. Acad. Sci. U S A. 2006;103:3669–3674. doi: 10.1073/pnas.0510333103. [DOI] [PMC free article] [PubMed] [Google Scholar]
- 3.Boo S.H., Kim Y.K. The emerging role of RNA modifications in the regulation of mRNA stability. Exp. Mol. Med. 2020;52:400–408. doi: 10.1038/s12276-020-0407-z. [DOI] [PMC free article] [PubMed] [Google Scholar]
- 4.Roovers M., Droogmans L., Grosjean H. Post-transcriptional modifications of conserved nucleotides in the T-loop of tRNA: a tale of functional convergent evolution. Genes (Basel) 2021;12:140. doi: 10.3390/genes12020140. [DOI] [PMC free article] [PubMed] [Google Scholar]
- 5.Bohnsack K.E., Hobartner C., Bohnsack M.T. Eukaryotic 5-methylcytosine (m(5)C) RNA methyltransferases: mechanisms, cellular functions, and links to disease. Genes (Basel) 2019;10:102. doi: 10.3390/genes10020102. [DOI] [PMC free article] [PubMed] [Google Scholar]
- 6.Bourgeois G., Ney M., Gaspar I., Aigueperse C., Schaefer M., Kellner S., Helm M., Motorin Y. Eukaryotic rRNA modification by yeast 5-methylcytosine-methyltransferases and human proliferation-associated antigen p120. PLoS One. 2015;10 doi: 10.1371/journal.pone.0133321. [DOI] [PMC free article] [PubMed] [Google Scholar]
- 7.Ehrlich M., Wang R.Y.H. 5-Methylcytosine in eukaryotic DNA. Science. 1981;212:1350–1357. doi: 10.1126/science.6262918. [DOI] [PubMed] [Google Scholar]
- 8.Jian H., Zhang C., Qi Z., Li X., Lou Y., Kang Y., Deng W., Lv Y., Wang C., Wang W., et al. Alteration of mRNA 5-methylcytosine modification in neurons after OGD/R and potential roles in cell stress response and apoptosis. Front. Genet. 2021;12:633681. doi: 10.3389/fgene.2021.633681. [DOI] [PMC free article] [PubMed] [Google Scholar]
- 9.Marshall L.L., Killinger B.A., Ensink E., Li P., Li K.X., Cui W., Lubben N., Weiland M., Wang X., Gordevicius J., et al. Epigenomic analysis of Parkinson's disease neurons identifies Tet2 loss as neuroprotective. Nat. Neurosci. 2020;23:1203–1214. doi: 10.1038/s41593-020-0690-y. [DOI] [PubMed] [Google Scholar]
- 10.Xue C., Zhao Y., Li L. Advances in RNA cytosine-5 methylation: detection, regulatory mechanisms, biological functions and links to cancer. Biomark. Res. 2020;8:43. doi: 10.1186/s40364-020-00225-0. [DOI] [PMC free article] [PubMed] [Google Scholar]
- 11.Yang X., Yang Y., Sun B.F., Chen Y.S., Xu J.W., Lai W.Y., Li A., Wang X., Bhattarai D.P., Xiao W., et al. 5-methylcytosine promotes mRNA export - NSUN2 as the methyltransferase and ALYREF as an m(5)C reader. Cell Res. 2017;27:606–625. doi: 10.1038/cr.2017.55. [DOI] [PMC free article] [PubMed] [Google Scholar]
- 12.Lozoya O.A., Santos J.H., Woychik R.P. A leveraged signal-to-noise ratio (LSTNR) method to extract differentially expressed genes and multivariate patterns of expression from noisy and low-replication RNAseq data. Front. Genet. 2018;9:176. doi: 10.3389/fgene.2018.00176. [DOI] [PMC free article] [PubMed] [Google Scholar]
- 13.Chou K.C. Advances in predicting subcellular localization of multi-label proteins and its implication for developing multi-target drugs. Curr. Med. Chem. 2019;26:4918–4943. doi: 10.2174/0929867326666190507082559. [DOI] [PubMed] [Google Scholar]
- 14.Liu B., Fang L., Long R., Lan X., Chou K.C. iEnhancer-2L: a two-layer predictor for identifying enhancers and their strength by pseudo k-tuple nucleotide composition. Bioinformatics. 2016;32:362–369. doi: 10.1093/bioinformatics/btv604. [DOI] [PubMed] [Google Scholar]
- 15.Chen W., Lin H., Chou K.C. Pseudo nucleotide composition or PseKNC: an effective formulation for analyzing genomic sequences. Mol. Biosyst. 2015;11:2620–2634. doi: 10.1039/c5mb00155b. [DOI] [PubMed] [Google Scholar]
- 16.Sun S., Wang C., Ding H., Zou Q. Machine learning and its applications in plant molecular studies. Brief. Funct. Genomics. 2020;19:40–48. doi: 10.1093/bfgp/elz036. [DOI] [PubMed] [Google Scholar]
- 17.Chen X., Xiong Y., Liu Y., Chen Y., Bi S., Zhu X. m5CPred-SVM: a novel method for predicting m5C sites of RNA. BMC Bioinformatics. 2020;21:489. doi: 10.1186/s12859-020-03828-4. [DOI] [PMC free article] [PubMed] [Google Scholar]
- 18.Fang T., Zhang Z., Sun R., Zhu L., He J., Huang B., Xiong Y., Zhu X. RNAm5CPred: prediction of RNA 5-methylcytosine sites based on three different kinds of nucleotide composition. Mol. Ther. Nucleic Acids. 2019;18:739–747. doi: 10.1016/j.omtn.2019.10.008. [DOI] [PMC free article] [PubMed] [Google Scholar]
- 19.Qiu W.R., Jiang S.Y., Xu Z.C., Xiao X., Chou K.C. iRNAm5C-PseDNC: identifying RNA 5-methylcytosine sites by incorporating physical-chemical properties into pseudo dinucleotide composition. Oncotarget. 2017;8:41178–41188. doi: 10.18632/oncotarget.17104. [DOI] [PMC free article] [PubMed] [Google Scholar]
- 20.Lv H., Zhang Z.M., Li S.H., Tan J.X., Chen W., Lin H. Evaluation of different computational methods on 5-methylcytosine sites identification. Brief. Bioinformatics. 2020;21:982–995. doi: 10.1093/bib/bbz048. [DOI] [PubMed] [Google Scholar]
- 21.Zhang M., Xu Y., Li L., Liu Z., Yang X., Yu D.J. Accurate RNA 5-methylcytosine site prediction based on heuristic physical-chemical properties reduction and classifier ensemble. Anal. Biochem. 2018;550:41–48. doi: 10.1016/j.ab.2018.03.027. [DOI] [PubMed] [Google Scholar]
- 22.Li J., Huang Y., Yang X., Zhou Y., Zhou Y. RNAm5Cfinder: a web-server for predicting RNA 5-methylcytosine (m5C) sites based on random forest. Sci. Rep. 2018;8:17299. doi: 10.1038/s41598-018-35502-4. [DOI] [PMC free article] [PubMed] [Google Scholar]
- 23.Liu Y., Shen Y., Wang H., Zhang Y., Zhu X. m5Cpred-XS: a new method for predicting RNA m5C sites based on XGBoost and SHAP. Front. Genet. 2022;13:853258. doi: 10.3389/fgene.2022.853258. [DOI] [PMC free article] [PubMed] [Google Scholar]
- 24.Chai D., Jia C., Zheng J., Zou Q., Li F. Staem5: a novel computational approachfor accurate prediction of m5C site. Mol. Ther. Nucleic Acids. 2021;26:1027–1034. doi: 10.1016/j.omtn.2021.10.012. [DOI] [PMC free article] [PubMed] [Google Scholar]
- 25.Dou L., Li X., Ding H., Xu L., Xiang H. Prediction of m5C modifications in RNA sequences by combining multiple sequence features. Mol. Ther. Nucleic Acids. 2020;21:332–342. doi: 10.1016/j.omtn.2020.06.004. [DOI] [PMC free article] [PubMed] [Google Scholar]
- 26.Song J., Zhai J., Bian E., Song Y., Yu J., Ma C. Transcriptome-wide annotation of m(5)C RNA modifications using machine learning. Front. Plant Sci. 2018;9:519. doi: 10.3389/fpls.2018.00519. [DOI] [PMC free article] [PubMed] [Google Scholar]
- 27.Tang Y., Chen K., Song B., Ma J., Wu X., Xu Q., Wei Z., Su J., Liu G., Rong R., et al. m6A-Atlas: a comprehensive knowledgebase for unraveling the N6-methyladenosine (m6A) epitranscriptome. Nucleic Acids Res. 2020;49:D134–D143. doi: 10.1093/nar/gkaa692. [DOI] [PMC free article] [PubMed] [Google Scholar]
- 28.Charoenkwan P., Chiangjong W., Nantasenamat C., Hasan M.M., Manavalan B., Shoombuatong W. StackIL6: a stacking ensemble model for improving the prediction of IL-6 inducing peptides. Brief. Bioinformatics. 2021;22 doi: 10.1093/bib/bbab172. [DOI] [PubMed] [Google Scholar]
- 29.Li F., Guo X., Jin P., Chen J., Xiang D., Song J., Coin L.J.M. Porpoise: a new approach for accurate prediction of RNA pseudouridine sites. Brief. Bioinformatics. 2021;22 doi: 10.1093/bib/bbab245. [DOI] [PMC free article] [PubMed] [Google Scholar]
- 30.Wei L., He W., Malik A., Su R., Cui L., Manavalan B. Computational prediction and interpretation of cell-specific replication origin sites from multiple eukaryotes by exploiting stacking framework. Brief. Bioinformatics. 2021;22 doi: 10.1093/bib/bbaa275. [DOI] [PubMed] [Google Scholar]
- 31.Xie R., Li J., Wang J., Dai W., Leier A., Marquez-Lago T.T., Akutsu T., Lithgow T., Song J., Zhang Y. DeepVF: a deep learning-based hybrid framework for identifying virulence factors using the stacking strategy. Brief. Bioinformatics. 2021;22 doi: 10.1093/bib/bbaa125. [DOI] [PMC free article] [PubMed] [Google Scholar]
- 32.Shoombuatong W., Basith S., Pitti T., Lee G., Manavalan B. THRONE: a new approach for accurate prediction of human RNA N7-methylguanosine sites. J. Mol. Biol. 2022:167549. doi: 10.1016/j.jmb.2022.167549. [DOI] [PubMed] [Google Scholar]
- 33.Manavalan B.H., Hasan M.M., Basith S., Gosu V., Shin T.-H., Lee G. Empirical comparison and analysis of web-based DNA N4-methylcytosine site prediction tools. Mol. Ther. Nucleic Acids. 2020 doi: 10.1016/j.omtn.2020.09.010. [DOI] [PMC free article] [PubMed] [Google Scholar]
- 34.Basith S., Manavalan B., Hwan Shin T., Lee G. Machine intelligence in peptide therapeutics: a next-generation tool for rapid disease screening. Med. Res. Rev. 2020;40:1276–1314. doi: 10.1002/med.21658. [DOI] [PubMed] [Google Scholar]
- 35.Li F., Chen J., Ge Z., Wen Y., Yue Y., Hayashida M., Baggag A., Bensmail H., Song J. Computational prediction and interpretation of both general and specific types of promoters in Escherichia coli by exploiting a stacked ensemble-learning framework. Brief. Bioinformatics. 2020;22:2126–2140. doi: 10.1093/bib/bbaa049. [DOI] [PMC free article] [PubMed] [Google Scholar]
- 36.Bi Y., Xiang D., Ge Z., Li F., Jia C., Song J. An interpretable prediction model for identifying N7-methylguanosine sites based on XGBoost and SHAP. Mol. Ther. Nucleic Acids. 2020;22:362–372. doi: 10.1016/j.omtn.2020.08.022. [DOI] [PMC free article] [PubMed] [Google Scholar]
- 37.Basith S., Manavalan B., Shin T.H., Lee G. SDM6A: a web-based integrative machine-learning framework for predicting 6mA sites in the rice genome. Mol. Ther. Nucleic Acids. 2019;18:131–141. doi: 10.1016/j.omtn.2019.08.011. [DOI] [PMC free article] [PubMed] [Google Scholar]
- 38.Chen W., Lv H., Nie F., Lin H. i6mA-Pred: identifying DNA N6-methyladenine sites in the rice genome. Bioinformatics. 2019;35:2796–2800. doi: 10.1093/bioinformatics/btz015. [DOI] [PubMed] [Google Scholar]
- 39.Feng P., Yang H., Ding H., Lin H., Chen W., Chou K.C. iDNA6mA-PseKNC: identifying DNA N(6)-methyladenosine sites by incorporating nucleotide physicochemical properties into PseKNC. Genomics. 2019;111:96–102. doi: 10.1016/j.ygeno.2018.01.005. [DOI] [PubMed] [Google Scholar]
- 40.Lv H., Dao F.Y., Guan Z.X., Zhang D., Tan J.X., Zhang Y., Chen W., Lin H. iDNA6mA-Rice: a computational tool for detecting N6-methyladenine sites in rice. Front. Genet. 2019;10:793. doi: 10.3389/fgene.2019.00793. [DOI] [PMC free article] [PubMed] [Google Scholar]
- 41.Chen Z., Zhao P., Li F., Wang Y., Smith A.I., Webb G.I., Akutsu T., Baggag A., Bensmail H., Song J. Comprehensive review and assessment of computational methods for predicting RNA post-transcriptional modification sites from RNA sequences. Brief. Bioinformatics. 2019;21:1676–1696. doi: 10.1093/bib/bbz112. [DOI] [PubMed] [Google Scholar]
- 42.Li F., Chen J., Leier A., Marquez-Lago T., Liu Q., Wang Y., Revote J., Smith A.I., Akutsu T., Webb G.I., et al. DeepCleave: a deep learning predictor for caspase and matrix metalloprotease substrates and cleavage sites. Bioinformatics. 2019;36:1057–1065. doi: 10.1093/bioinformatics/btz721. [DOI] [PMC free article] [PubMed] [Google Scholar]
- 43.Qiang X., Zhou C., Ye X., Du P.F., Su R., Wei L. CPPred-FL: a sequence-based predictor for large-scale identification of cell-penetrating peptides by feature representation learning. Brief. Bioinformatics. 2018 doi: 10.1093/bib/bby091. [DOI] [PubMed] [Google Scholar]
- 44.Li H.L., Pang Y.H., Liu B. BioSeq-BLM: a platform for analyzing DNA, RNA and protein sequences based on biological language models. Nucleic Acids Res. 2021;49:e129. doi: 10.1093/nar/gkab829. [DOI] [PMC free article] [PubMed] [Google Scholar]
- 45.Liu B. BioSeq-Analysis: a platform for DNA, RNA and protein sequence analysis based on machine learning approaches. Brief. Bioinformatics. 2019;20:1280–1294. doi: 10.1093/bib/bbx165. [DOI] [PubMed] [Google Scholar]
- 46.Liu B., Gao X., Zhang H. BioSeq-Analysis2.0: an updated platform for analyzing DNA, RNA and protein sequences at sequence level and residue level based on machine learning approaches. Nucleic Acids Res. 2019;47:e127. doi: 10.1093/nar/gkz740. [DOI] [PMC free article] [PubMed] [Google Scholar]
- 47.Chen K., Song B., Tang Y., Wei Z., Xu Q., Su J., de Magalhaes J.P., Rigden D.J., Meng J. RMDisease: a database of genetic variants that affect RNA modifications, with implications for epitranscriptome pathogenesis. Nucleic Acids Res. 2021;49:D1396–D1404. doi: 10.1093/nar/gkaa790. [DOI] [PMC free article] [PubMed] [Google Scholar]
- 48.Ma J., Song B., Wei Z., Huang D., Zhang Y., Su J., de Magalhaes J.P., Rigden D.J., Meng J., Chen K. m5C-Atlas: a comprehensive database for decoding and annotating the 5-methylcytosine (m5C) epitranscriptome. Nucleic Acids Res. 2022;50:D196–D203. doi: 10.1093/nar/gkab1075. [DOI] [PMC free article] [PubMed] [Google Scholar]
- 49.Tang Y., Chen K., Wu X., Wei Z., Zhang S.Y., Song B., Zhang S.W., Huang Y., Meng J. DRUM: inference of disease-associated m(6)A RNA methylation sites from a multi-layer heterogeneous network. Front. Genet. 2019;10:266. doi: 10.3389/fgene.2019.00266. [DOI] [PMC free article] [PubMed] [Google Scholar]
- 50.Xu Q., Chen K., Meng J. WHISTLE: a functionally annotated high-accuracy map of human m(6)a epitranscriptome. Methods Mol. Biol. 2021;2284:519–529. doi: 10.1007/978-1-0716-1307-8_28. [DOI] [PubMed] [Google Scholar]
- 51.Hasan M.M., Basith S., Khatun M.S., Lee G., Manavalan B., Kurata H. Meta-i6mA: an interspecies predictor for identifying DNA N6-methyladenine sites of plant genomes by exploiting informative features in an integrative machine-learning framework. Brief. Bioinformatics. 2020;22 doi: 10.1093/bib/bbaa202. [DOI] [PubMed] [Google Scholar]
- 52.Huang Q., Zhang J., Wei L., Guo F., Zou Q. 6mA-RicePred: a method for identifying DNA N (6)-methyladenine sites in the rice genome based on feature fusion. Front. Plant Sci. 2020;11:4. doi: 10.3389/fpls.2020.00004. [DOI] [PMC free article] [PubMed] [Google Scholar]
- 53.Xu Z.C., Feng P.M., Yang H., Qiu W.R., Chen W., Lin H. iRNAD: a computational tool for identifying D modification sites in RNA sequence. Bioinformatics. 2019;35:4922–4929. doi: 10.1093/bioinformatics/btz358. [DOI] [PubMed] [Google Scholar]
- 54.Yang H., Lv H., Ding H., Chen W., Lin H. iRNA-2OM: a sequence-based predictor for identifying 2′-O-methylation sites in Homo sapiens. J. Comput. Biol. 2018;25:1266–1277. doi: 10.1089/cmb.2018.0004. [DOI] [PubMed] [Google Scholar]
- 55.Manavalan B., Basith S., Shin T.H., Wei L., Lee G. Meta-4mCpred: a sequence-based meta-predictor for accurate DNA 4mC site prediction using effective feature representation. Mol. Ther. Nucleic Acids. 2019;16:733–744. doi: 10.1016/j.omtn.2019.04.019. [DOI] [PMC free article] [PubMed] [Google Scholar]
- 56.Mikolov T., Chen K., Corrado G., Dean J. Efficient estimation of word representations in vector space. arXiv. 2013 doi: 10.48550/arXiv.1301.3781. Preprint at. [DOI] [Google Scholar]
- 57.Webb S. Deep learning for biology. Nature. 2018;554:555–557. doi: 10.1038/d41586-018-02174-z. [DOI] [PubMed] [Google Scholar]
- 58.Dao F.Y., Lv H., Su W., Sun Z.J., Huang Q.L., Lin H. iDHS-Deep: an integrated tool for predicting DNase I hypersensitive sites by deep neural network. Brief. Bioinformatics. 2021;22 doi: 10.1093/bib/bbab047. [DOI] [PubMed] [Google Scholar]
- 59.Li H., Gong Y., Liu Y., Lin H., Wang G. Detection of transcription factors binding to methylated DNA by deep recurrent neural network. Brief. Bioinformatics. 2022;23 doi: 10.1093/bib/bbab533. [DOI] [PubMed] [Google Scholar]
- 60.Lv H., Dao F.Y., Zulfiqar H., Lin H. DeepIPs: comprehensive assessment and computational identification of phosphorylation sites of SARS-CoV-2 infection using a deep learning-based approach. Brief. Bioinformatics. 2021;22 doi: 10.1093/bib/bbab244. [DOI] [PMC free article] [PubMed] [Google Scholar]
- 61.Hochreiter S., Schmidhuber J. Long short-term memory. Neural Comput. 1997;9:1735–1780. doi: 10.1162/neco.1997.9.8.1735. [DOI] [PubMed] [Google Scholar]
- 62.Graves A., Schmidhuber J. Framewise phoneme classification with bidirectional LSTM and other neural network architectures. Neural Networks. 2005;18:602–610. doi: 10.1016/j.neunet.2005.06.042. [DOI] [PubMed] [Google Scholar]
- 63.Hasan M.M., Schaduangrat N., Basith S., Lee G., Shoombuatong W., Manavalan B. HLPpred-Fuse: improved and robust prediction of hemolytic peptide and its activity by fusing multiple feature representation. Bioinformatics. 2020;36:3350–3356. doi: 10.1093/bioinformatics/btaa160. [DOI] [PubMed] [Google Scholar]
- 64.Chen Z., Liu X., Li F., Li C., Marquez-Lago T., Leier A., Akutsu T., Webb G.I., Xu D., Smith A.I., et al. Large-scale comparative assessment of computational predictors for lysine post-translational modification sites. Brief. Bioinformatics. 2019;20:2267–2290. doi: 10.1093/bib/bby089. [DOI] [PMC free article] [PubMed] [Google Scholar]
- 65.Zhu Y.-H., Hu J., Ge F., Li F., Song J., Zhang Y., Yu D.-J. Accurate multistage prediction of protein crystallization propensity using deep-cascade forest with sequence-based features. Brief. Bioinformatics. 2020;22 doi: 10.1093/bib/bbaa076. [DOI] [PubMed] [Google Scholar]
- 66.Hasan M.M., Manavalan B., Khatun M.S., Kurata H. i4mC-ROSE, a bioinformatics tool for the identification of DNA N4-methylcytosine sites in the Rosaceae genome. Int. J. Biol. Macromol. 2020;157:752–758. doi: 10.1016/j.ijbiomac.2019.12.009. [DOI] [PubMed] [Google Scholar]
- 67.Hasan M.M., Manavalan B., Shoombuatong W., Khatun M.S., Kurata H. i6mA-Fuse: improved and robust prediction of DNA 6 mA sites in the Rosaceae genome by fusing multiple feature representation. Plant Mol. Biol. 2020;103:225–234. doi: 10.1007/s11103-020-00988-y. [DOI] [PubMed] [Google Scholar]
- 68.Manavalan B., Basith S., Shin T.H., Wei L., Lee G. mAHTPred: a sequence-based meta-predictor for improving the prediction of anti-hypertensive peptides using effective feature representation. Bioinformatics. 2019;35:2757–2765. doi: 10.1093/bioinformatics/bty1047. [DOI] [PubMed] [Google Scholar]
- 69.Yang W., Zhu X.J., Huang J., Ding H., Lin H. A brief survey of machine learning methods in protein sub-Golgi localization. Curr. Bioinform. 2019;14:234–240. doi: 10.2174/1574893613666181113131415. [DOI] [Google Scholar]
- 70.Ding H., Yang W., Tang H., Feng P.M., Huang J., Chen W., Lin H. PHYPred: a tool for identifying bacteriophage enzymes and hydrolases. Virol. Sin. 2016;31:350–352. doi: 10.1007/s12250-016-3740-6. [DOI] [PMC free article] [PubMed] [Google Scholar]
Associated Data
This section collects any data citations, data availability statements, or supplementary materials included in this article.