

Abstract
Despite the decades of scientific studies for developing promising new therapies, cancer remains a major cause of illness and mortality, worldwide. Several cancer types are the major topic of research in drug discovery programs due to their global incidence cases and growing frequency. In the present study, using two different statistical approaches PCA (principal component analysis) and PLS (partial least squares), six 2D-QSAR (quantitative structure activity relationship) models have been developed for the set of compounds retrieved against seven cancer cell lines vizPC-3, B16F10, K562, MDA-MB-231, A2780, and ACHN. For the creation and validation of 2D-QSAR models, OECD (Organization for Economic Co-operation and Development) requirements have been strictly followed. All of the generated 2D-QSAR models produce a significant and high correlation coefficient value with several other statistical parameters. Moreover, developed 2D-QSAR models have been used for activity predictions of in-house synthesized 63 pyrazole derivatives compounds. Precisely, most statistically significant and accepted2D-QSAR model generated for each cancer cell line has been used to predict the pIC50 value (anti-cancer activity) of all 63 synthesized pyrazole derivatives. Furthermore, designing of novel pyrazole derivatives has been carried out by substituting the essential functional groups based on the best derived 2D-QSAR models for each cancer cell line, more precisely, based on the most significant molecular descriptors with enhanced anti-cancer activity. Finally, the prediction of the new designed molecules reveals higher pIC50 than the standard compounds.
Keywords: 2D-2D-QSAR, PCA, PLS, Pyrazole derivatives, Cancer cell line
2D-2D-QSAR; PCA; PLS; Pyrazole derivatives; Cancer cell line.
1. Introduction
According to World Health Organization (WHO) estimates, cancer is the primary or second major cause of death before the age of 70 in 112 of 183 nations, and it ranks third or fourth in other 23 countries. In this study we focus our search on 7 types of cancer which are prostate cancer, melanoma, leukemia, breast cancer, ovarian cancer, kidney cancer and stomach cancer represented by 7 cancer cell line that are that arePC-3 (prostate cancer), B16F10 (skin cancer), K562 (chronic myelogenous leukemia), MDA-MB-231 (breast cancer), A2780 (ovarian cancer), ACHN (kidney cancer), and NUGC (stomach cancer) respectively. Hereafter we detailed all cancer type on what we focused in this research.
Prostate cancer is the 2nd most commonly diagnosed cancer type in men and the 5th highest cause of death globally. It’s expected to cause approximately 248,530 new cases and 34,130 deaths in the United States alone in 2021, according to the American Cancer Society (www.cancer.org/). Around the world, prostate cancer incidence and mortality cases, in particular, are linked to increasing age, with the average age at diagnosis being ∼66 years elderly men [1]. Beside other cancer type. Melanoma is a type of skin cancer that accounts for approximately 1% of all skin cancers, but it is responsible for the vast majority of skin cancer deaths as well [2]. According the estimated fact and statistics of Skin Cancer Foundation (www.skincancer.org), by the age of 70, one out of every five Americans will probably have developed skin cancer and every hour, more than two people in the United States die of skin cancer. Another important cancer type i.e., chronic myelogenous leukemia (CML) is a rare kind of bone marrow cancer that affects the spongy tissue inside bones that produces white blood cells. The number of white blood cells in the blood increases as a result of CML. The word "chronic" refers to the fact that chronic myelogenous leukemia progresses more slowly than acute types of leukemia. CML has a global yearly incidence rate of 0.87 per 100,000 populations, which rises with age to 1.52 in individuals over the age of 70 [3]. Like other cancer types, breast cancer is the most susceptible cancer form in women worldwide, and it is the second largest cause of mortality after lung cancer. Among the various kinds of breast cancer observed in women, triple-negative breast cancer (TNBC) is the most dangerous [4,5]. Women who are exposed to this type of TNBC have a poor prognosis, and therapy options for this disease are also limited and thus, new therapeutic medicines for this aggressive tumor type are urgently needed [4, 5, 6]. In addition to breast cancer majorly found in women, other most fatal gynecologic malignancy is ovarian cancer [7]. Women of various ages are developed or affected by the ovarian cancer, but it is most typically diagnosed after menopause [7]. It’s the 7th most prevalent malignancy cancer as it was responsible for 4.4 % of all cancer-related deaths among women in 2018 and is now maintaining an upward trend in cancer incidence cases over the world [8]. Among the other important cancer types, kidney cancer is a type of cancer that increased steadily with age, with a peak of incidence cases identified at approximately age of 75 years [9]. With more than 330,000 new cancer cases identified each year, kidney cancer is the world's 13th most prevalent disease, accounting for 2.4 percent of all malignancies. Renal cell carcinoma (RCC) is the most common kind of kidney cancer in adults, followed by renal transitional cell carcinoma (RTCC), which occurs predominantly in the renal parenchyma and renal pelvis, respectively [10]. Although, there are some drugs commonly used in clinical practices and commercially available as treatment measures for different cancer types, however most of them shows some level of adverse effect or drug resistance during course of time, which may be due to tumor cell heterogeneity or epigenetic modifications [11,12]. Therefore, identification or development of novel drug candidates for cancer management will always remain an unwinding process and thirst areas of research to the scientific communities.
The present study aims to computationally investigate 63 in-house synthesized pyrazole derivatives against the seven cancer cell line PC-3 (prostate cancer), B16F10 (skin cancer), K562 (chronic myelogenous leukemia), MDA-MB-231 (breast cancer), A2780 (ovarian cancer), and ACHN (kidney cancer) for that, six different quantitative structure activity relationship (2D-QSAR) models were derived from the collected compounds dataset (datasets of chemical entities collected from literature where it was experimentally tested and shown wide range of anti-cancer or inhibitory activities (IC50 value) against the six cancer cell lines mentioned above). QSAR is one of the most widely utilized computational methodologies still being adopted in many research areas. Since long back, many research studies have employed the QSAR model development for exploration of relevance of anti-cancer compounds modeling based on different cancer cell lines data [13, 14, 15, 16, 17, 18, 19, 20, 21, 22, 23, 24]. herein the main objective of the current study is to predict the anti-cancer activity (the potential pIC50 value) of 63 in-house synthesized pyrazole derivatives using the six developed 2D-QSAR models against the seven cancer cell lines mentioned above (all compounds and their structure are detailed in Supplementary information). In addition, the study also aimed to design novel molecules by substituting particular or definite chemical groups having functional activity and then evaluating their anti-cancer potential effect based on best selected identified molecular descriptors and their anticipated pIC50 value against each cell line. Interestingly, few compounds were identified to have higher pIC50 value than the experimentally tested reference compounds for several cancer cell lines. Overall, the results of the present study suggest that the developed 2D-QSAR models might be useful as a theoretical reference for future wet-laboratory studies, as well as speeding up the anti-cancer therapeutic development processes specifically employing the pyrazole derivatives.
2. Materials and methods
2.1. Collection of compounds from experimental data sources
In this study, few sets of chemical entities experimentally tested against seven different cell-lines such as prostate cancer (PC-3), skin cancer (B16F10), chronic myelogenous leukemia (K562), breast cancer (MDA-MB-231), ovarian cancer (A2780), kidney cancer (ACHN), and stomach cancer (NUGC) were retrieved from several literatures (summarized in supplementary information from Table S1 to Table S7). All collected compounds have a definite endpoint data in terms of their IC50 values (measured in)used for 2D-QSAR model development. Majorly, all compounds used for the creation of 2D-QSAR models, have shown some level of ability to suppress cancer cell proliferation or a significant anti-cancer activity, and reported in different studies. For each cancer cell line, all experimentally tested activity values (IC50) were standardized in μM then converted into pIC50 values (i.e., Negative logarithm of IC50 (pIC50 = -log10(IC50)).
2.2. Molecular descriptors calculation
All compound structures were drawn using Marvin Sketch version 4.0 after gathering information on compounds from several scientific works. The MOE (Molecular Operating Environment) version 2008.10 software was then used to create a total of 184 two-dimensional (2D) descriptors for all compounds. The strongly associated descriptors with correlation values more than 0.75 (R > 0.75) were then removed from the descriptors list for all cancer cell lines. Such elimination of descriptors from the descriptors list usually aids in selecting the most relevant one, as well as in avoiding difficulties with over-fitting data following the model construction, which in turn improves model predictability. Once statistically confirmed 2D-QSAR model will be generated from the set of descriptors, a small number of selective descriptors may be used to predict the biological activity of untested novel chemical compounds or drug candidates. In this study, after successful development of the statistically significant 2D-QSAR models, the best 2D-QSAR model and their representative descriptors were used to predict the activity of 63 pyrazole derivatives synthesized in our laboratory [25, 26, 27, 28, 29, 30, 31].
2.3. Data set division/splitting
For the purpose of developing the statistically validated 2D-QSAR model, compounds from each cancer line were divided into two sets i.e., training set for developing 2D-QSAR models, and the test set for testing and validating the prediction quality of the developed model. Data set division specifically followed by keeping of around 75% of molecules into the training set while remaining 25% compounds in the test set. The test set compounds were selected manually considering the structural diversity in the data set with 5:1 ratio, interestingly for small dataset two models can be generated viz. Randomly split dataset (80:20, 90:10 or 95:05 etc.) or Full dataset (100% molecules in training set only, in this case external validation is not possible). For each cancer line employed in this investigation, and the number of molecules that correspond to their training and test set chemicals summarizes below in Table 1.
Table 1.
Dataset division of the collected compounds into training and test set for all six cancer cell lines.
| Experimental data Cancer cell line | Total Numbers of compounds | Training set Compounds | Test set Compounds |
|---|---|---|---|
| Prostate cancer (PC-3) | 30 | 25 | 5 |
| Skin cancer (B16F10) | 35 | 28 | 7 |
| Chronic myelogenous leukemia (K562) | 37 | 30 | 7 |
| Breast cancer (MDA-MB-231) | 35 | 28 | 7 |
| Ovarien cancer (A2780) | 27 | 22 | 5 |
| Kidney cancer (ACHN) | 31 | 25 | 5 |
2.4. 2D-QSAR model development and validation
All 2D-QSAR models developed from the respective compounds data set corresponding to each cancer cell line were generated following the OECD (Organization for Economic Co-operation and Development) guidelines for approving developed QSAR models, also ensured that ambiguity and transparency were checked properly. Specifically, for the creation of QSAR models, two separate statistical methodologies were applied, namely principal component analysis (PCA) and partial least squares (PLS), which are extensively used and acknowledged methods in the scientific community. The set of variables/descriptors were used as input parameters in the XLSTAT 2014 software programmed to perform both PCA and PLS analyses. Following that, numerous statistical parameters were determined to validate the constructed 2D-QSAR models, parameters such as the correlation coefficient (R2) and the root mean square error (RMSE). Internal cross-validation (Q2), external validation (R2 external), cross validated R2, and cross validated RMSE measurements were also used to validate all the developed models.
3. Results and discussion
3.1. 1PCA based correlation matrix analyses of all compound dataset for each cancer cell line
The PCA analyses were carried out for all compounds tested against six different cancer cell lines to find out correlations between the various variables/important descriptors under investigation. Particularly, the descriptors that were highly correlated (R ≥ 0.75), eliminated from the data matrix to reduce the redundancy. The remaining descriptors in the training set compounds were submitted for PCA execution. The two main primary axes named as F1 and F2 were evaluated to explore the information provided by the correlation matrix for all cell lines. The correlation matrix was created to obtain information on the descriptors' negative and positive correlations. Precisely, to better comprehend the effect or influences of each descriptor on anticancer activity, we used the correlation circle and the biplot graph to explore the projections of the variables on the mentioned first two axes, i.e., F1 and F2, which has been discussed in subsequent section. Additionally, the descriptors selected in this study including their types and meaning is summarized in table S7 in supplementary information.
3.2. Prostate cancer cell line (PC-3)
The correlation between the 3 selected descriptors and pIC50 against prostate cancer cell line is illustrated in the correlation matrix given in Supplementary information Table S8.
The PCA generated correlation circle for compounds belonged to the prostate cancer cell line has demonstrated good co-linearity between the different descriptors (variables), and significant association with partition coefficient for showing anti-cancer activity (Figure 1A). The density descriptor has been found to be strongly correlated along the F2 axis (r = 0.886). Another descriptor SlogP_VSA4 has also well correlated along the F1 axis (r = 0.651), and the balabanJ descriptor has negatively correlated along the F1 axis (r = -0.576), as shown in Figure 1A. In contrast, the Biplot diagram depicted in Figure 1B demonstrated the clustering of the training set molecules into three groups. In particular, the first group formed by the molecules 254, 256–258, and 268–270 found in the bottom right of Biplot diagram, characterized by the surface of hydrophilic molecules indicated by the descriptor 'SlogP_VSA4' has shown a positive influence on the anticancer activity with a correlation coefficient value of r = 0.573. The second group formed by the molecules 240, 245, 246, 248, 249, 250, 266, 267, 272, and 275 observed on the top left in the plot, demonstrated slightly moderate anticancer activity explained by the negative contribution of descriptor 'BalabanJ' with a correlation coefficient value of -0.510. It has been revealed that compounds with a high topological index of remote connectivity 'BalabanJ> 1.40' let down the anticancer activity against PC-3 prostate cancer cell line. Compounds present in the 3rd group includes 251, 252, 254, 256, 258, 261, 268, 269, and 270 displayed in the upper right of biplot, showed a better anticancer activity, as the descriptor 'density' correlated positively with a correlation coefficient value of 0.391.
Figure 1.

PCA plots of PC-3 cancer cell line showing the correlation circle of the relevant descriptors allied with anticancer activity (pIC50) (A), Biplot of molecules explained in two axes F1 and F2, the percentages of the variance are estimated as 46.40% and 25.81% for the two axes F1 and F2, respectively (B). The total estimated variance is 72.22%.
3.3. Skin cancer cell line (B16F10)
The correlation scores between the six descriptors (SlogP_VSA5, PEOE_VSA+0, Zagreb, Vsa_other, SMR_VSA1, and SMR_VSA7) and the pIC50 values for compounds evaluated against the skin cancer cell line is displayed Supplementary information Table S9.
The analyses of correlation circle depicted in Figure 2A has shown mostly a positive correlation between the descriptors SplgP_VSA5 and PEOE_VSA+0 with a correlation coefficient value r = 0.783; for descriptors SlogP_VSA5 and PEOE_VSA+0 revealed correlation coefficient r = 0.783; another descriptors SlogP_VSA5 and zagreb also shown positive correlation coefficient r = 0.616; and descriptors SlogP_VSA5 and SMR_VSA7 revealed correlation coefficient r = 0.676. While a negative correlation has been also observed between the descriptors zagreb and Zagreb (r = -0.768) and another set of descriptors PEOE_VSA+0 and Zagreb (r = -0.715).
Figure 2.

PCA plot of B16F10 cancer cell line showing the correlation circle of the relevant descriptors allied with anticancer activity (pIC50) (A), biplot of molecules explained in two axes F1 and F2, the percentages of the variance are estimated as 55.37% and 20.52% for the two axes F1 and F2, respectively (B). The total estimated variance is 75.90%.
In addition to correlation circle, the biplot graph (Figure 2B) help indistinguishing the studied compounds in two distinct groups for skin cancer cell line. The 1st group consist of molecules 276, 278, 279, 280, 282, 283, 286, 294, 295, 296, and 302 shown moderate anticancer activity (pIC50 > 5), and this group is characterized by the topological descriptor zagreb (the chirality index of a molecule) which has been found to be contributed positively to the anticancer activity with a correlation coefficient ‘r’ value of 0.397. The 2nd group consisting of rest of the compounds in the dataset, have shown much better anti-cancer/cytotoxicity profile (pIC50 < 5), and they are characterized by the descriptor 'SMR_VSA7' (which defines as approximate accessible van der Waals surface for atoms with atomic contribution to the molar refraction) also found to be contributed positively to the anticancer activity with a correlation coefficient ‘r’ value of 0.359. Another descriptor 'PEOE_VSA+0’ (van der Waals surface of molecule) also found to be contributed positively (r = 0.555). In contrast, another descriptor 'Zagreb' has shown negative influences on the activity as correlation coefficient r has been found to be-0.627.
3.4. Chronic myelogenous leukemia (K562)
The correlation scores between the four descriptors (namely BCUT_SLOGP_2, a_nO, a_nS, and SMR_VSA4) and the pIC50 values for compounds evaluated against the chronic myelogenous leukemia cell line is summarized Supplementary information Table S10.
Figure 3A displayed the correlation circle between descriptors, a positive correlation is observed between the descriptors BCUT_SLOGP_2 and SMR_VSA4 with a correlation coefficient r = 0.600, while the negative correlation found for the descriptors between a_nO and a_nS with correlation coefficient r = -0.543. In addition to this, also relatively lower correlation has been obtained for the descriptors between a_nO and SMR_VSA4 (r = 0.459).
Figure 3.

PCA plots of K562 cancer cell line showing the correlation circle of the relevant descriptors allied with anticancer activity (pIC50) (A), Biplot of molecules explained in two axes F1 and F2, the percentages of the variance are estimated as 52.13% and 32.51% for the two axes F1 and F2, respectively (B). The total estimated variance is 84.64%.
The biplot diagram (presented in Figure 3B) identifies two distinct groups of compounds and their correlations. The first group includes compounds 348–358, has been characterized by demonstrating slightly moderate anticancer activity (pIC50 ≥ 8) against the K562 cell line. Moreover, the descriptor 'a_nO' (number of oxygen atom in the molecule a_nO > 2') has been found to contributed positively towards anti-cancer activity (correlation coefficient r = 0.468), indicates that presence of a greater number of oxygen atoms may increase the anticancer activity. The 2nd group consist of compounds 322–347, has been characterized by demonstrating better anticancer activity (pIC50 ≤ 4) and indicated by the descriptor 'SMR_VSA4' (sum of the approximate van der Waals accessible surface for atoms with an atomic contribution to the molar refraction) which found to be contributed strongly for exhibiting better anticancer activity (correlation coefficient r = 0.919).
3.5. Breast cancer cell line (MDA-MB231)
The correlation scores between the four descriptors (namely PEOE_VSA+1, Q_PC-, and Q_VSA_HYD) and the pIC50 values for compounds evaluated against the breast cancer cell line is displayed in Supplementary information Table S11.
Figure 4A shows the correlation circle among set of the descriptors identified through PCA. A good correlation has been observed between the descriptors 'PEOE_VSA+1' and 'Q_VSA_HYD' with a correlation coefficient r = -0.644, while a negative correlation has also observed between the descriptors 'Q_PC-' and 'Q_VSA_HYD' (correlation coefficient r = -0.594).
Figure 4.

PCA plotsMDA-MB231 cancer cell line showing the correlation circle of the relevant descriptors allied with anticancer activity (pIC50) (A), Biplot of molecules explained in two axes F1 and F2, the percentages of the variance are estimated as 75.46% and 13.79% for the two axes F1 and F2, respectively (B). The total estimated variance is 89.25%.
The biplot diagram (depicted in Figure 4B) provides visualization of individual compound on a 2D-map and allowed us to classify the molecules according to their cytotoxicity. It has been observed that all compounds considered for breast cancer cell line clustered into three groups. The 1st group consist of compounds 369, 374–377, 387, 388, 393 and 395 has shown relatively better anticancer activity (pIC50 ≤ 4) against the MDA-MB-231 cell line. This 1st group of compounds has been characterized by the descriptor 'Q_PC-' (the total negative partial charge in the molecule 'Q_PC') which found to be contributed negatively toward exhibiting the anticancer activity (correlation coefficient r = -0.795). The 2nd group consisting of only three compounds 360, 361 and 362 has shown slightly moderate anticancer activity (pIC50 ≥ 6), and characterized by the descriptor 'Q_VSA_HYD' (total hydrophobic van der Waals surface area) which found to be contributed positively towards the anticancer activity (correlation coefficient r = 0.487). The 3rd group contains the rest of the molecules such as 359, 363, 364, 368, 370, 371–373, 378–383, 389–392, and 396–398, and this group has also shown relatively moderate to better anticancer activity (4 ≤ pIC50 ≤ 6). These compounds present in 3rd group characterized by the descriptor 'PEOE_VSA+1' has been found to be contributed strongly towards anticancer activity with a correlation coefficient r = 0.800.
3.6. Ovarian cancer cell line (A2780)
The correlation scores between the three descriptors (namely PEOE_VSA-1, SlogP_VSA5, TPSA) and the pIC50 values for compounds evaluated against the ovarian cancer cell lines given in supplementary information Table S12.
Figure 5A represents the correlation circle for the set of descriptors and their association with pIC50 values. It has been found that a moderate collinearity with r > 0.5 observed between most of the variables. A negative correlation has been observed between the descriptor 'TPSA' and 'pIC50' (correlation coefficient r = -0.649), and also for other descriptor 'SlogP_VSA5 ' and the 'pIC50' (correlation coefficient r = 0.411). In order to better understand the relationship between the descriptors and the anticancer activity of the studied compounds, we presented the individual compound in biplot visualization mode (Figure 5B), that allows us to identify two distinct groups of molecules according to their cytotoxicity data profile. The 1st group represented by molecules 401, 403, 406, 419, and 427–429 observed in the top left of biplot diagram has shown moderate anticancer activity (5.50 ≤ pIC50 ≤ 6.35) against ovarian cancer cell line (A2780). These set of compounds are characterized by the descriptor 'TPSA' (the topological polar surface) which found to be contributed negatively towards exhibiting the anticancer activity (correlation coefficient r = -0.650). The 2nd group consist of compounds 399, 400, 404, 407–418, and 420–426 can be observed in the lower left of Biplot (Figure 5B), and this group has shown moderate anticancer activity (6.50 ≤ pIC50 ≤ 7.00) against the A2780 cell line. This group of compounds are characterized by the descriptor 'PEOE_VSA-1' (indicates van der Waals surface area) with a correlation coefficient r = -0.402. Other descriptor 'SLOGP_VSA5' (the sum of the approximate accessible van der Waals surface) also have good correlation with a correlation coefficient value of r = 0.411.
Figure 5.

PCA plot of A2780 cancer cell line showing the Correlation circle of the relevant descriptors allied with anticancer activity (pIC50) (A), Biplot of molecules explained in two axes F1 and F2, the percentages of the variance are estimated as 48.24% and 31.25% for the two axes F1 and F2, respectively (B). The total estimated variance is 79.49%.
3.7. Kidney cancer cell line (ACHN)
The correlation scores between the four descriptors (namely Diameter, PEOE_VSA_PNEG, Q_VSA_PNEG, and opr_nrot) and the pIC50 values for compounds evaluated against the kidney cancer cell line are displayed in supplementary information Table S13.
The correlation circle (depicted in Figure 6A) illustrated the relative correlations among the identified variables and their association with pIC50. Precisely, a good correlation has been observed between the descriptor 'oprt_nrot' and 'diameter' with a correlation coefficient value of r = 0.540. On the other hand, a negative correlation between the descriptors 'PEOE_VSA_PNEG' and 'Q_VAS_PNEG' has been found with a correlation coefficient r = -0.484.
Figure 6.

PCA plots of ACHN cancer cell line showing the Correlation circle of the relevant descriptors allied with anticancer activity (pIC50) (A), Biplot of molecules explained in two axes F1 and F2, the percentages of the variance are estimated as 39.18% and 27.12% for the two axes F1 and F2, respectively (B). The total estimated variance is 66.30%.
The biplot analysis (displayed in Figure 6B) distinguishes clustering of compounds in three distinct groups, according to their descriptor values. The 1st group has been formed by molecules 452, 454, and 465–470 observed in the upper left of biplot diagram revealed moderate anticancer activity against the kidney cell line (ACHN), and this group is characterized by the descriptor 'Q_VSA_PNEG' which found to be contributed positively towards anticancer activity (correlation coefficient r = 0.338). The 2nd group consist of molecules 434, 435, 446, 459–461, 451, 464, and 472–474 observed in the bottom right of biplot diagram (Figure 6B), shown relatively moderate anti-cancer activity (pIC50 ≥ 5), and this group has been characterized by the descriptor 'PEOE_VSA_PNEG' (the total negative van der Waals surface area) with a correlation coefficient r = -0.250. The 3rd group consist of rest of the molecules 436, 438–441, 444, 445, 447, 448, 458 and 475 found on the top right of biplot diagram, shown moderate anticancer activity (4.40 ≤ PIC50 ≤ 5.50). This group combines two descriptors one based on the physicochemical descriptor 'diameter' which revealed a negative contribution for anticancer activity on ACHN cell line with a correlation coefficient value of r = -0.419. The other descriptor 'opr-nrot' (the number of single bonds in rotation) contributed positively towards anti-cancer activity with a correlation coefficient r = 0.106.
4. PLS based 2D-QSAR models analyses for cancer cell lines
In addition to PCA analyses, six 2D-QSAR models were constructed using the PLS methodology utilizing the same dataset as used in PCA method for compounds of all cancer cell lines. Then, all PLS-based created models were meticulously assessed following some statistical validation and their acceptable parameters. Many efforts are given to build a significant connection between the cytotoxicity indicators associated variables/descriptors and pIC50 values, and also checked that satisfy the OECD standard guidelines. The PLS generated results and their corresponding equations for each cancer cell line studied in the present study are given in Table 2.
Table 2.
2D-QSAR equations for each cancer cell line derived from the PLS method.
| Cancer cell lines | 2D-QSAR models developed using the PLS method |
|---|---|
| PC-3 | pIC50 = 3.04136–0.81740 ∗ balabanJ +0.01517 ∗ SlogP_VSA4+3.32414 ∗ density #Equation (1)# |
| B16F10 | pIC50 = 7.16690–0.01083 ∗ SlogP_VSA5 +0.00750 ∗ PEOE_VSA+0–0.02026 ∗ zagreb-0.04075 ∗ vsa_other +0.02723 ∗ SMR_VSA1+0.00853 ∗ SMR_VSA7 #Equation (2)# |
| K562 | pIC50 = 5.25700–1.47700 ∗ BCUT_SLOGP_2-0.17497 ∗ a_nO -1.69613 ∗ a_nS +0.08339 ∗ SMR_VSA4 #Equation (3)# |
| MDA-MB-231 | pIC50 = 3.52539 + 0.01852 ∗ PEOE_VSA+1-0.60365 ∗Q_PC--0.00942 ∗Q_VSA_HYD #Equation (4)# |
| A2780 | pIC50 = 11.48171–0.00701 ∗ PEOE_VSA-1 +0.01031 ∗ SlogP_VSA5-0.05911 ∗ TPSA #Equation (5)# |
| ACHN | pIC50 = 6.64342–0.27307 ∗ diameter+0.01999 ∗ PEOE_VSA_PNEG +0.01918 ∗Q_VSA_PNEG +0.20834 ∗ opr_nrot #Equation (6)# |
The PLS based 2D-QSAR models generated for all cancer cell line was discussed deeply in supplementary information in results section page 15–16.
To demonstrate the resilience of derived PLS based 2D-QSAR models, all models have been thoroughly examined and verified. Table 3 contains statistically significant PLS based 2D-QSAR model equations with their appropriate internal and external validations. During the model building and validation phase, the obtained values of different statistical parameters are listed in Table 3, for each cancer cell line. Particularly, the correlation coefficient (R2), internal validation (Q2), cross verified R2, external validation R2, and low RMSE, cross validated RMSE values indicate that all of these models are statistically significant and have good external predicting capacity as well. All of the presented R2 and Q2 values are found to be more than 0.5.
Table 3.
Value of statistical parameters for the thirteen cancer cell lines.
| Cancer cell lines | Correlation coefficient (R2) | RMSE | Cross validated (R2) | Cross validated RMSE | Internal validation (Q2) | External validation (R2) |
|---|---|---|---|---|---|---|
| PC-3 | 0.83200 | 0.10710 | 0.76061 | 0.12826 | 0.76061 | 0.669 |
| B16F10 | 0.82751 | 0.19496 | 0.71697 | 0.25319 | 0.71697 | 0.776 |
| K562 | 0.98478 | 0.24926 | 0.97920 | 0.29148 | 0.97920 | 0.878 |
| MDA-MB-231 | 0.81342 | 0.18571 | 0.76541 | 0.20896 | 0.76541 | 0.798 |
| A2780 | 0.84065 | 0.14372 | 0.73024 | 0.18770 | 0.73024 | 0.647 |
| ACHN | 0.87813 | 0.10311 | 0.81326 | 0.12809 | 0.81326 | 0.751 |
5. Prediction of anticancer activity of the in-house synthesized series of pyrazole derivatives
Objective of the present study also include the prediction of a series of in-house synthesized pyrazole derivatives for their anticancer activity. After successfully developing the statistically significant and calibrated 2D-QSAR models, pIC50 values of 63 in-house synthesized pyrazole derivatives has been predicted using the developed 2D-QSAR model, and the findings of the best pIC50 values of four pyrazole derived compounds are presented in Table 4. In addition, the predicted pIC50 values of all 63 in-house synthesized compounds, is summarized in supplementary information Table S14.
Table 4.
Anti-cancer potentiality (pIC50) of best in-house synthesized pyrazole derivatives predicted based on derived 2D-QSAR model of each cancer cell line.
| Cancer Cell line/Cancer types | pIC50 value of the best potential inhibitors for each cell line | |||
|---|---|---|---|---|
| PC-3/Prostate cancer | M48 = 5.26 | M55 = 5.32 | M60 = 5.26 | M54 = 5.14 |
| B16F10/Skin cancer | M36 = 6.75 | M41 = 6.51 | M42 = 6.30 | M43 = 6.73 |
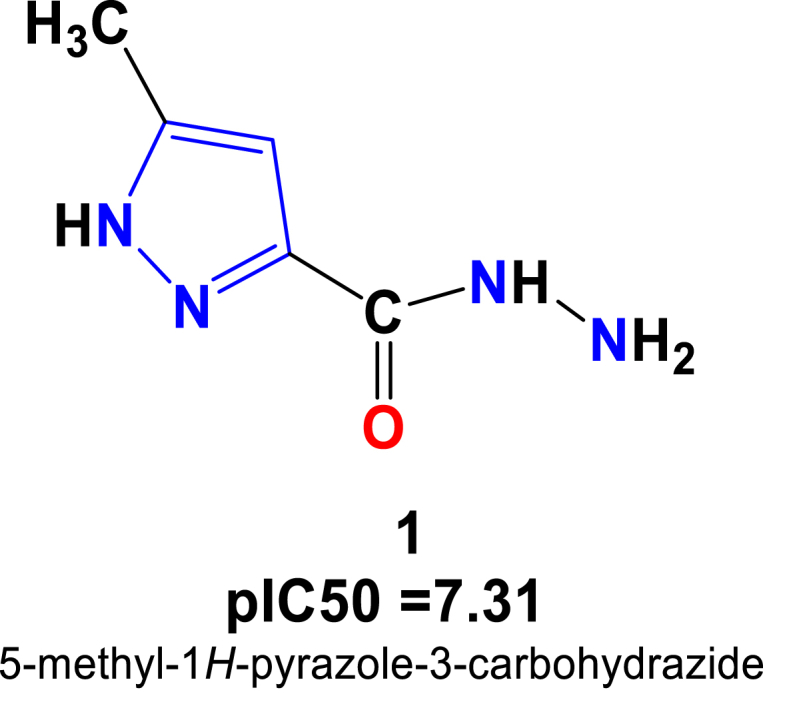
| K562/Leukemia | M1 = 7.31 | |||
| MDA-MB-231/Breast cancer | M4 = 6.36 | M5 = 5.89 | M32 = 7.03 | M33 = 6.55 |
| A2780/Ovarian cancer | M4 = 8.57 | M19 = 8.57 | M30 = 8.15 | M32 = 8.63 |
| ACHN/Kidney cancer | M1 = 6.10 | M5 = 6.48 | M20 = 5.87 | M33 = 6.36 |
5.1. Anti-proliferative effects of in-house synthesized pyrazole derivatives against the prostate cancer cell line – PC-3
According to the best 2D-QSAR model obtained for the prostate cancer cell line – PC-3, the predicted best cytotoxic activity has been found for the in-house synthesized compounds 48, 54, 55 and 60, displayed in Figure 7 along with their predicted IC50 values.
Figure 7.

Structure of novel series of pyrazole triazole thiol found to exhibit as best pIC50 values against the prostate cancer cell line - PC-3.
Particularly, compounds 48, 55 and 60 containing the methyl and phenyl groups on the pyrazole ring and the bromo (-Br) group on the benzene ring exhibited a promising cytotoxic effect against the PC-3 cell line with cytotoxicity values of pIC50 = 5.26, pIC50 = 5.32 and pIC50 = 5.26, respectively. Such observations are corroborated with other study findings reported earlier by authors Ola S. Aff et al 2019 and Ebtehal M. Husseiny et al 2020 [32, 33]. On the other hand, the compound 54 carrying the phenyl group on the pyrazole ring, as well as the electron-withdrawing group di-chloro (2,4Cl) on the benzene ring has been also exhibited slightly moderate cytotoxic effect with a cytotoxicity value pIC50 = 5.14. Such prediction and observation suggest that for being a potential compound for increasing activity, order of functional group substitutions on the benzene ring can be Br>(-N-CH3)2>O-CH3>Phenyl>2,4-Cl > CH3 (Figure 8).
Figure 8.

Structure-activity relationship study (SAR) of pyrazole triazole thiol derivative as potent anticancer agents.
5.2. Anti-proliferative effects of in-house synthesized pyrazole derivatives against the skin cancer cell line – B16F10
The pIC50 values predicted for all 63 in-house synthesized compounds using the best 2D-QSAR model obtained for skin cancer cell line revealed that compounds viz. pyrazole derivatives 36, 41, 42, and 43 have the strongest anti-proliferative potentiality as observed from the model equation. 2D - chemical structures of those compounds (pyrazole derivatives 36, 41, 42, and 43) and their pIC50 values has been depicted in Figure 9.
Figure 9.

Structure of novel series of pyrazol acetohydrazideshowing the best pIC50 values against the skin cancer cell line - B16F10.
Particularly, the best pyrazole carbohydrazide compounds 36, 41, 42 and 43 exhibited moderate to strong anti-proliferative activity against the B16F10 skin cancer cell line with cytotoxicity values of pIC50 = 6.75, 6.51, 6.30, and 6.73, respectively. Activities are mostly explained by the presence of dimethyl on the pyrazole ‘A’ ring as well as other important Br, OH and OCH3groups on the benzene ‘B’ ring. Similarly, compounds substituted by dimethyl on the same pyrazole ‘A’ ring and substituted by N(CH3)2, NO2, -Cl on the benzene ‘B’ ring and furan exhibited slightly reduced cytotoxic effect against the B16F10 skin cancer cell line. Therefore, it can be stated that optimal anti-cancer activity can be achieved for this cancer call line by making substitutions on ring ‘B’ asBr > OH > OCH3>Furan > NO2>(-N-CH3)2 > 2,4-Cl > CH3for increasing order of activity (Figure 10).
Figure 10.

Structure-activity relationship study (SAR) of pyrazole triazole thiol derivative as potent anti-cancer agents.
5.3. Anti-proliferative effects of in-house synthesized pyrazole derivative against the chronic myelogenous leukemia - K562
For chronic myelogenous leukemia cell line, it has been found that only one pyrazole derivative compound 1 (Figure 11) exhibited as the most potential compound with the pIC50 = 7.31 among all in-house synthesized compounds.
Figure 11.

Structure of pyrazole carbohydrazide showing the best pIC50 values against chronic myelogenous leukemia cell line- K562.
The observed high cytotoxicity profile for the compound 1 might be due to presence of methyl group on the pyrazole ring and a hydrazide group linked to the carbonyl function. The other compounds show relatively moderate to less anti-cancer effect against this cancer cell line.
5.4. Anti-proliferative effects of in-house synthesized pyrazole derivative against the breast cancer cell line- MDA-MB-231
Predicted pIC50 values of in-house synthesized pyrazole derivatives against the breast cancer cell line discovered that compounds 4, 5, 32 and 33 (Figure 12) have the profound anti-proliferative potentiality than other predicted values of all in-house synthesized compounds as observed from the best 2D-QSAR model equation.
Figure 12.

Structure of novel series of pyrazole acetohydrazide exhibited the best pIC50 values against the breast cancer cell line - MDA-MB-231.
Compound 4 and 5 belong to the pyrazole carbohydrazide and acetohydrazide derivatives family shows relatively moderate anticancer potentiality against the MDA-MB-231cancercell line with cytotoxicity values of: pIC50 = 6.36 and 5.90 μM, respectively. Such activity profile can be explained by the presence of methyl group (-CH3) on the pyrazole ring ‘A’, as well as the benzene ring ‘B’ substituted by the dimethylamino (N(CH3)2) electron-donating group, which contributed to the enhancement of the anti-cancer activity of these compounds. On the other hand, compound 5 substituted by an electron withdrawing groupe Nitro (-NO2) group on the benzene ring contributed to decrease the bioactivity. Similarly, compound 32 substituted with dimethyl (-CH3)2 group on the same pyrazole ring ‘A ‘and also holding the same dimethylamino (N(CH3)2) group on the benzene ring ‘B’ exhibited much increased cytotoxic effect with pIC50 = 7. 03 μM.Thisobservation might be due to the presence of two methyl groups on the pyrazole ring. Another potential compound 33 belong to a pyrazole acetohydrazide family also exhibited significant anticancer activity with pIC50 = 6.55 μM against the studied breast cancer cell line. It can be stated that optimal anti-cancer activity might be achieved by making substitutions on the B ring as following the ascending order of N-CH3)2>OCH3>2-Cl 2,4-Cl > Furan>4-Cl > F NO2.
5.5. Anti-proliferative effects of in-house synthesized pyrazole derivative against the ovarian cancer cell line -A2780
Based on the model 2D-QSAR equation obtained for ovarian cancer cell line – A2780, prediction of in-house synthesized pyrazole derivatives revealed most prominent pIC50 values for four compounds that are compounds 4, 19, 30 and 32 (Figure 13).
Figure 13.

Structure of novel series of pyrazole acetohydrazide exhibited the best pIC50 values against the ovarian cancer cell line- A2780.
The predicted pIC50 value have been found to be 8.57 μM for the compound 4 which exhibited the best anticancer potentiality against this ovarian cancer cell line. Such anti-proliferative activity is probably explained by the presence of methyl (-CH3) group on the pyrazole ring ‘A’ and as well as the benzene ring ‘B’ substituted by the dimethylaminoelectron-donating group (N(CH3)2). Presence of these groups might improve the activity of this conjugate. On the other hand, substitution by the nitro group on the benzene ring, shows relatively low anticancer activity compared to compound 4. Similarly, compound 19 substituted by phenyl group on the same pyrazole ring ‘A’ and keeping the same dimethylamino (N(CH3)2) group on the benzene ring exhibited cytotoxic effect with pIC50 value as 8.57 μM against the ovarian cancer cell line. Such observation might be explained by the presence of phenyl group on the pyrazole ring which increases the anticancer activity for this compound. Other two compounds 30 and 32 belonged to the pyrazole acetohydrazide family also exhibited substantial anti-cancer activity with pIC50 values 8.14 and 8.63 μM respectively against the studied ovarian cancer cell line. Such anticancer activity might be due to the presence of two methyl groups which contributed to increase the activity. Observing the nature of anti-activity possess by the selected compounds, it can be stated that optimal activity might achieved through substituting the ‘B’ ring as N-CH3)2 > NO2>phenyl > OCH3>2-Cl,4-Cl, following the mentioned order.
5.6. Anti-proliferative effects of in-house synthesized pyrazole derivative against the kidney cancer cell line - ACHN
In case of kidney cancer cell line - ACHN, 2D-QSAR model's prediction allowed us to identify best four pyrazole derivatives 1, 5, 20, and 33 with their pIC50 values of 6.10, 6.48, 5.87, 6.36, respectively (Figure 14).
Figure 14.

Structure of novel series of pyrazole carbohydrazide and acetohydrazide derivatives exhibited the best pIC50 values against the kidney cancer cell line - ACHN.
Particularly, predicted 2D-QSAR model observed that compound 1 belonging to the pyrazole carbohydrazide family exhibited strong anticancer activity against the kidney cancer cell line. The anti-proliferative activity of this compound can probably explain by the presence of methyl (-CH3) group on the pyrazole ‘A’ ring, and as well as the hydrazine group linked to the ketone. This observation might indicate that presence of this group probably improves the anti-cancer activity of this compound against the studied cell line. The compound 5 substituted by the same methyl group linked to the pyrazole ring, and the benzene ring substituted by the Nitro (-NO2) electron-withdrawing group shows slightly increase in the anticancer activity (pIC50 = 6.48 μM) as compared to compound 1. On the other hand, the conjugates substituted by the various other groups such as Cl, Br, OCH3, CH3 and F holding on the benzene ring, shows decreases in their activities. Similarly, compound 20 substituted by phenyl on the pyrazole ring ‘A’ and benzene ring ‘Substituted by the Nitro (-NO2) group shows relatively moderate cytotoxic effect against the studied cancer cell line. Such observation might be due to the presence of phenyl group on the pyrazole ring which decreases the anticancer activity of this compound. Another compound 33 which possess substitution by dimethyl on the same pyrazole ring ‘A ‘and benzene ring substituted with the same Nitro group (-NO2) shows comparatively similar or moderate cytotoxic effects against the kidney cancer cell line. This observation also can be explained by the presence of two methyl groups on the pyrazole ring which increases the anticancer activity of this compound 33. Therefore, the optimal increasing order of anti-cancer activity can be accomplished by making substitutions on ring ‘A’ following as NO2> Furan > OH > OCH3>2-Cl > Phenyl > N-CH3)2 > 2,4-Cl.
6. Design and prediction of pIC50 of novel pyrazoles derivatives
Apart from predicting the activities of pyrazoles derivatives that have been synthesized in-house laboratory, we have also designed a novel chemical entity by analyzing the contributions of descriptors that may have more potentiality than those already synthesized. Firstly, we have calculated the standardized coefficient or t-test values based on the pIC50 obtained from the best 2D-QSAR model equation for each cell line, and the highest t-test value of the specific descriptors has the most effective role on measuring the pIC50 for novel designed compounds. The results of each cancer cell line's t-test are provided below. Moreover, the compounds served as a template for the creation of all new structures of pyrazole derivatives for each cancer cell line are displayed bellow (for every single cancer cell line), and accompanied by their anticipated pIC50 values for each cancer cell line, also explained subsequently. We displayed the top five ranked designed compounds for each cancer cell line based on their predicted pIC50, moreover we exhibited the 15 new designed compounds from Table S15 to Table S20 in supplementary information.
6.1. Design and prediction of pIC50 of novel potential compounds for prostate cancer cell line
For the prostate cancer cell line, based on the t-test values evaluated for the measuring contributions of each descriptor on the anti-cancer activity of pyrazole carbohydrazide derivatives revealed that-test values for descriptors density, balabanJ and SlogP_VSA4 are 145.5845168; 35.79896876 and 0.664387517, respectively. Compound 55 (Figure 15), displayed below with its PLS based QSAR model #Equation (1)# has been used as a template for the new designed structures.
| (1) |
Figure 15.

Chemical structure of the candidate triazole pyrazole derivative used as a template for the design of novel compounds against the PC-3 prostate cancer cell line.
Particularly, decreasing the value of descriptor balabanJ (denotes the topological connectivity index) of new compounds (as balabanJ<1.2993) may be possible for desired biological activity. To do so, introducing of benzene rings substituted by various important functional groups such as Br, CH(Br)2, COBr, CO2CH3, morpholine can lead towards better anti-cancer activity. This means that a substitution by the groups containing the substituted benzene ring with electron-withdrawing entities can increase the anti-cancer activity for novel chemical entities. Moreover, increasing the value of descriptor density (denotes the molecular density: weight divided by vdw_vol (amu/Å3)), may also offer a better anti-cancer activity and that can be done on the R ring, substituting by an electron withdrawing group. The descriptor SlogP_VSA4>35.746861 contribute to increase the cytotoxicity values of the new compounds (pIC50 = 6.3512–6.937). Electro-attracting groups lead to increased anticancer activity such as CH (Br) 2, COB groups. In Table 5, newly designed chemical structures with their substituted chemical groups and also their predicted activities have been given for prostate cancer.

Table 5.
Descriptors values for newly designed pyrazole carbohydrazide derivatives and their predicted anticancer activity against prostate cancer cell line PC-3 calculated according to the developed 2D-QSAR mathematical model.
| New Designed Molecules | BalabanJ | SlogP_VSA4 | Density | pIC50 |
|---|---|---|---|---|
 |
1.3483316 | 38.932438 | 1.32578 | 6.93 |
 |
1.3310907 | 35.746861 | 1.2883024 | 6.77 |
 |
1.1845576 | 38.932438 | 1.1931505 | 6.63 |
 |
1.3310907 | 35.746861 | 1.2318705 | 6.60 |
 |
1.3143536 | 35.746861 | 1.1557729 | 6.35 |
6.2. Design and prediction pIC50 of novel potential compounds for skin cancer cell line
For the skin cancer, several descriptors such as SlogP_VSA5, vsa_Other and Zagreb shows their contribution in decreasing the anticancer activity, while other few descriptors PEOE_VSA+0, SMR_VSA1 and SMR_VSA7 contributed in increasing the anti-cancer activity. In this2D-QSAR model, the calculated t-test values have been observed as 0.338999522, 0.234764212, 0.634176392, 1.275552219, 0.8523506 and 0.267005164 for descriptors SlogP_VSA5, PEOE_VSA+0, Zagreb, vsa_other, SMR_VSA1 and SMR_VSA7, respectively. Compound 36 (Figure 16), displayed below with its PLS based QSAR model #Equation (2)# has been used as a template for the new designed structures.
| (2) |
Figure 16.

Chemical structure of the candidate pyrazole acetohydrazide derivative used as a template for the design of novel compounds against the skin cancer cell line - B16F10.
Therefore, in order to increase the value of descriptor SlogP_VSA5 (denotes the Sum of the van der Waals area (SlogP_VSA5>19.781), incorporation of various functional groups such as Br, CH(CH3)2, OH, Dimethyl, 3-hydroxy-3-methyl, 3-hydroxypropyl substituted by benzene rings might be helpful. This indicates that substitution with the above-mentioned groups containing the benzene ring having electron-withdrawing/donor moieties can lead to higher anti-cancer activity. Beside this, also to increase the value of descriptor zagreb (The sum of di2 on all heavy atoms i) adding the any R group as benzene ring substituted by branched alkyl containing OH, Br. On the other hand, decreasing the value of the descriptor vsa_other (means other van der Waals surface) for new compounds should be less than 33.2490, and to do adding the substituents containing either a branched alkyl or a branched bromoalkene or a secondary or primary alcohol on the benzene ring might be helpful, that can lead to increase anti-cancer activity. For the other descriptors such as PEOE_VSA+0; SMR_VSA1 and SMR_VSA7 which contributed positively towards anticancer activity indicated in the generated model and to make these descriptors more significant, values should best follow PEOE_VSA+0 > 67.6947, SMR_VSA1>60.4878, and SMR_VSA7>129.8205. In Table 6, newly designed chemical structures with their substituted chemical groups and also their predicted activities have been given for skin cancer.

Table 6.
Descriptors values for newly designed pyrazole carbohydrazide derivatives and their predicted anticancer activity against skin cancer cell line - B16F10 calculated according to the developed 2D-QSAR mathematical model.
| New Designed Molecules | SlogP_VSA5 | PEOE_VSA+0 | Zagreb | VSA_Other | SMR_VSA1 | SMR_VSA7 | PIC50 |
|---|---|---|---|---|---|---|---|
 |
41.6416 | 284.6402 | 208 | 19.6490 | 111.2582 | 291.8642 | 9.35 |
 |
41.6416 | 286.8487 | 210 | 19.6490 | 111.2582 | 291.8642 | 9.33 |
 |
41.6416 | 329.8571 | 208 | 19.6490 | 85.8730 | 325.1902 | 9.28 |
 |
60.5100 | 327.6486 | 208 | 19.6490 | 85.8730 | 325.1902 | 9.06 |
 |
60.5100 | 296.0316 | 204 | 19.6490 | 85.8730 | 325.1902 | 8.91 |
6.3. Design and prediction of pIC50 of novel potential compounds for chronic myelogenous leukemia cell line
In the model equation, the descriptors BCUT_SlogP_2, a_nO and a_ns has been found to decrease the anticancer activity against leukemia, while the descriptor SMR_VSA4 contributed to increase the activity. The t-test values for those descriptors calculated and observed as 37.8029547, 4.478255236, 43.41145941 and 2.134318478 for descriptors BCUT_SlogP_2, a_nO, a_nS and SMR_VSA4, respectively. Compound 1 (Figure 17), displayed below with its PLS based QSAR model #Equation (3)# has been used as a template for the new designed structures.
| (3) |
Figure 17.
Chemical structure of the candidate carbohydrazide pyrazole derivative used as a template for the design of novel compounds against the leukemia cancer cell line K562.
Therefore, in order to increase the value of descriptor BCUT_Slogp-2 (BCUT descriptors using atomic contribution to logP instead of partial charge, BCUT_SlogP-2> 0.3397), incorporation of nitrogenous groups containing primary amines, aromatic amines, amides or alkyl imidamides might be helpful for exhibiting higher anti-cancer activity or achieving greater values for descriptor BCUT_Slogp-2. However, to decrease the value of descriptor a_nO for new compounds, adding any functional group of chemical entities containing the amide or ketone function, provided that the total number of oxygen atom introduced does not exceed 2 (a_nO ≤ 2), so that it could be contributed positively. In addition, also for decreasing the value of descriptor a_nS for new compounds value must be lower than 1 (a_nS < 1). Indeed, the presence of a sulfur atom in the group to be substituted can be a negative contribution to the anticancer activity pIC50. Another descriptor SMR_VSA4 (stands for Sum of van der Waals surface area to molar refractivity) has been contributed positively on anticancer activity, and this descriptor’s contribution can be enhanced significantly by maintaining the value as SMR_VSA4>32. 7747. In Table 7, newly designed chemical structures with their substituted chemical groups and also their predicted activities have been given for leukemia, chronic cancer.

Table 7.
Descriptors values for newly designed pyrazole carbohydrazide derivatives and their predicted anticancer activity against leukemia cancer cell line K562 calculated according to the developed 2D-QSAR mathematical model.
| New Designed Molecules | BCUT_SlogP_2 | a_nO | a_nS | SMR_VSA4 | pIC50 |
|---|---|---|---|---|---|
 |
0.55531985 | 1 | 0 | 65.794373 | 9.74 |
 |
0.55682582 | 1 | 0 | 65.794373 | 9.74 |
 |
0.55521256 | 1 | 0 | 65.794373 | 9.74 |
 |
0.55585831 | 1 | 0 | 65.794373 | 9.74 |
 |
0.55486697 | 1 | 0 | 65.794373 | 9.74 |
 |
0.55486625 | 1 | 0 | 65.794373 | 9.74 |
6.4. Design and prediction of pIC50 of novel potential compounds for breast cancer cell line
For the compounds of breast cancer cell line, based on the calculated t-test scores for the descriptors Q_PC-; PEOE_VSA+1 and Q_VSA_HYD has been found to be 20.55850184, 0.630735449 and 0.320816843, respectively. The influence of each descriptor on the pIC50 or anti-cancer activity of pyrazole carbohydrazide derivatives has great importance. Particularly, to design new compounds with appropriate substitutions that improve the values of descriptors Q_PC- and Q_VSA_HYD can improve the biological activity as compared to the already investigated compound. Compound 32 (Figure 18), displayed below with its PLS based QSAR model #Equation (4)# has been used as a template for the new designed structures.
| (4) |
Figure 18.

Chemical structure of the candidate pyrazole acetohydrazide derivative used as a template for the design of novel compounds against the MDA-MB-231 breast cancer cell line.
To increase the value of descriptor PEOE_VSA+1 (denotes the sum of the van der Waals area when the partial charge in the range (0.05–0.10), PEOE_VSA+1 > 161.0262), incorporation of nitrogenous species containing partial charges such as tertiary amines, nitro/Cyano or alkyl imidamides might be helpful. On the other hand, to decrease the value of descriptor Q_PC- (denotes the total negative partial charge) for new compounds, connecting the benzene ring with nitro and methoxy group, as well as replacing the two-methyl bound to the pyrazole ring by nitrogenous groups such as imidamide, N(CH3)2, NO2, OH, CN, NH2 and CONH(CH3)2 can provide desired anti-cancer activity and the expected value for this descriptor as Q_PC- ≤ -2.9590), so for that this descriptor contribute positively. Moreover, to decrease the value of another descriptors Q_VSA_HYD (stands for total hydrophobic van der Waals surface area) for new compounds value should be less than 161.1534. Indeed, the value of this descriptor might decrease with the increasing of the partial charge of the molecule. In Table 8, newly designed chemical structures with their substituted chemical groups and also predicted activities have been given for breast cancer.

Table 8.
Descriptors values for newly designed pyrazole carbohydrazide derivatives and their predicted anticancer activity against breast cancer cell line MDA-MB-231 calculated according to the developed 2D-QSAR mathematical model.
| New Designed Molecules | PEOE_VSA+1 | Q_PC- | Q_VSA_HYD | pIC50 |
|---|---|---|---|---|
 |
262.26163 | -5.3779998 | 103.71861 | 10.65 |
 |
248.67508 | -4.7010002 | 105.47758 | 9.97 |
 |
259.86563 | -4.6900001 | 143.79411 | 9.81 |
 |
214.76222 | -4.8200002 | 121.93649 | 9.26 |
 |
194.46271 | -5.0570002 | 121.4611 | 9.03 |
 |
185.35376 | -5.0570002 | 128.16064 | 8.80 |
6.5. Design and prediction of pIC50 of novel potential compounds for ovarian cancer cell line
In the model 2D-QSAR equation for the ovarian cancer cell line, the descriptor SlogP_VSA5 contributed positively on anticancer activity against cancer cell line -A2780, while the descriptors PEOE_VSA-1- and TPSA contributed negatively on the anti-cancer activity. The t-test values have been calculated as 2.232199341,0.389341486 and 0.264721999 for descriptors TPSA; SlogP_VSA5 and PEOE_VSA-1, respectively. Compound 32 (Figure 19), displayed below with its PLS based QSAR model #Equation (5)# has been used as a template for the new designed structures.
| (5) |
Figure 19.

Chemical structure of the candidate pyrazole acetohydrazide derivative used as a template for the design of novel compounds against ovarian cancer cell line A2780.
In order to keep the unchanged value for descriptor PEOE_VSA-1 (denotes the sum of the van der Waals area) i.e., zero (PEOE_VSA-1 = 0.000), replacing the first methyl group (-CH3) bound to the pyrazole ring will be helpful and that may be achieved by incorporating the tertiary amine-containing nitrogen species methoxy (OCH3), Br, F, aromatic tertiary amines and branched alkyls as well as the other methyl group bound to the pyrazole ring. For increasing the value of descriptor SlogP_VSA5 (denotes the sum of the van der Waals area) for new compounds, for which we add in the pyrazole ring a benzene ring substituted by nitrogenous electron-donor and electron-attractant species provided that the descriptor values SlogP_VSA5>82.4574, to improve the meaning of this descriptor. To achieve more effective potentiality of the compounds, another important descriptor like TPSA (designates the topological polar surface of a molecule) value should be higher than 62.5200 (TPSA> 62.5200). Indeed, the value of this descriptor may increase by incorporating the electron-donating groups linked to the benzene ring, in the molecule. In Table 9, newly designed chemical structures with their substituted chemical groups and also their predicted activities have been given for ovarian cancer.

Table 9.
Descriptors values for newly designed pyrazole carbohydrazide derivatives and their predicted anticancer activity against ovarian cancer cell line A2780 calculated according to the developed 2D-QSAR mathematical model.
| New Designed Molecules | PEOE_VSA-1 | SlogP_VSA5 | TPSA | pIC50 |
|---|---|---|---|---|
 |
0 | 254.67343 | 60.41 | 10.53 |
 |
0 | 298.70892 | 72.239998 | 10.30 |
 |
0 | 265.81174 | 72.239998 | 9.95 |
 |
0 | 232.91454 | 69 | 9.80 |
 |
0 | 217.10124 | 69 | 9.64 |
6.6. Design and prediction of pIC50 of novel potential compounds for kidney cancer cell line
For compounds studied for kidney cancer, involvement of few important descriptors such as diameter, PEOE_VSA_PNEG, Q_VSA_PNEG and opr_nrot has been found in the developed 2D-QSAR model equation. The calculated t-test value for those descriptors diameter, PEOE_VSA_PNEG, Q_VSA_PNEG and opr_nrot has been observed as 9.930449469, 0.726955304, 0.697498886 and 7.576481643, respectively. Compound 5 (Figure 20), displayed below with its PLS based QSAR model #Equation (6)# has been used as a template for the new designed structures.
| (6) |
Figure 20.

Chemical structure of the candidate pyrazole carbohydrazide derivative used as a template for the design of novel compounds against kidney cancer cell line – ACHN.
In order to increase the value of the ‘diameter’ descriptor (denotes the largest value of the distance matrix) as much as greater than (diameter > 13,000), and that can be done following the replacement of the methyl group (-CH3) bound to the pyrazole ring and by incorporating nitrogenous species containing primary amines, methoxy (-OCH3), –NO2, nitroethyl, nitrobenzene, imidamide groups. To achieve the greater anti-cancer activity value, it is indeed necessary to increase the value of descriptor PEOE_VSA_PNEG (denotes the Total Area of Negative Polar van der Waals) for new compounds. Such increment can be made through substituting the pyrazole ring and benzene ring by nitrogenous electron-donor species like methoxy (-OCH3) and electron-withdrawing species like –NO2 and –CONH2. For increasing the value of descriptor Q_VSA_PNEG (denotes the Total Negative Polar van der Waals Area of a molecule) of new compounds, electro attractant groups carrying negative charges such as NO2, CONH2 can be added to get the higher descriptor value as Q_VSA_PNEG> 75.7611. Moreover, in order to increase the value of the descriptor Opr_nrot (denotes the number of rotational bonds) of new compounds, substitution of benzene ring by various biologically relevant functional groups such methoxy, NO2, and nitroethyl can be made for achieving the value greater than (Opr_nrot > 4,000). In Table 10, newly designed chemical structures with their substituted chemical groups and also their predicted activities have been given for kidney cancer.

Table 10.
Descriptors values for newly designed pyrazole carbohydrazide derivatives and their predicted anticancer activity against kidney cancer cell line - ACHN calculated according to the developed 2D-QSAR mathematical model.
| New Designed Molecules | Diameter | PEOE_VSA_PNEG | Q_VSA_PNEG | opr_nrot | pIC50 |
|---|---|---|---|---|---|
 |
14 | 115.36006 | 143.62318 | 8 | 9.54 |
 |
14 | 115.36006 | 143.62318 | 7 | 9.33 |
 |
15 | 115.36006 | 143.62318 | 7 | 9.06 |
 |
14 | 94.995941 | 123.25906 | 7 | 8.54 |
 |
18 | 115.36006 | 157.19011 | 7 | 8.50 |
7. Conclusion
In the current work, a collection of set of chemical entities has been utilized for robust 2D-QSAR models development employing two statistical methods, PCA and PLS. All collected compounds studied were previously tested against seven different cancer cell lines (such as prostate cancer (PC-3), skin cancer (B16F10), chronic myelogenous leukemia (K562), breast cancer (MDA-MB-231), ovarian cancer (A2780), kidney cancer (ACHN), and stomach cancer (NUGC)in an experimental setting. All of the generated and developed 2D-QSAR models have been verified for statistically acceptable parameters and tested for their robustness following rigorous validation techniques. Numbers of 2D-QSAR models derived from the collected compounds have been found to explained the contributions of some prominent descriptors those have impacted the anti-cancer activity in various cell lines. According to the results of the constructed 2D-QSAR models, descriptors such as (balabanJ, Density, TPSA, opr_nrot, SlogP) are found to be the most important or prominent descriptors for explaining inhibitory potentiality of chosen compounds in the dataset. In addition, the best developed 2D-QSAR model from each cancer cell line was used to predict the anti-cancer efficacy of in-house synthesized pyrazole derivative compounds. The present study also intended to design few novel pyrazole compounds by changing important chemical groups on the synthesized compounds, which served as a template for elucidating improved inhibitory potentiality against each cell type. It has been found that few synthesized and newly compounds from each cell line possess best anti-cancer potentiality than the collected or experimentally test compounds. Taken together, all the verified 2D-QSAR models, and predicated activities of in-house synthesized compounds, and finally newly designed novel pyrazole derivative compounds reported in the present study might be useful for evaluating and identifying much better hit compounds, as well as will be helpful for accelerating the type specific cancer therapeutics developments. Another aspect of this research's conclusion is that to synthesize the proposed designed novel pyrazole compounds, which may then be tested in vitro and in vivo for much better elucidation of anti-cancer activities against all the studied cell lines.
Declarations
Author contribution statement
Fatima Ezzahra Bennani: Conceived and designed the experiments; Performed the experiments; Analyzed and interpreted the data; Contributed reagents, materials, analysis tools or data; Wrote the paper.
Latifa Doudach, Christopher E. Rudd, M’hammed Ansar, My El Abbes Faouzi: Contributed reagents, materials, analysis tools or data.
Khalid Karrouchi: Analyzed and interpreted the data; Contributed reagents, materials, analysis tools or data; Wrote the paper.
Youssef El rhayam: Performed the experiments; Analyzed and interpreted the data; Wrote the paper.
Funding statement
This research did not receive any specific grant from funding agencies in the public, commercial, or not-for-profit sectors.
Data availability statement
Data included in article/supplementary material/referenced in article.
Declaration of interests statement
The authors declare no conflict of interest.
Additional information
No additional information is available for this paper.
Appendix A. Supplementary data
The following is the supplementary data related to this article:
References
- 1.Rawla P. Epidemiology of prostate cancer. World J. Oncol. 2019;10:63–89. doi: 10.14740/wjon1191. [DOI] [PMC free article] [PubMed] [Google Scholar]
- 2.Apalla Z., Lallas A., Sotiriou E., Lazaridou E., Ioannides D. Epidemiological trends in skin cancer. Dermatol. Pract. Concept. 2017;7:1–6. doi: 10.5826/dpc.0702a01. [DOI] [PMC free article] [PubMed] [Google Scholar]
- 3.Hoffmann V.S., Baccarani M., Hasford J., Lindoerfer D., Burgstaller S., Sertic D., Costeas P., Mayer J., Indrak K., Everaus H., Koskenvesa P., Guilhot J., Schubert-Fritschle G., Castagnetti F., Di Raimondo F., Lejniece S., Griskevicius L., Thielen N., Sacha T., Hellmann A., Turkina A.G., Zaritskey A., Bogdanovic A., Sninska Z., Zupan I., Steegmann J.-L., Simonsson B., Clark R.E., Covelli A., Guidi G., Hehlmann R. The EUTOS population-based registry: incidence and clinical characteristics of 2904 CML patients in 20 European Countries. Leukemia. 2015;29:1336–1343. doi: 10.1038/leu.2015.73. [DOI] [PubMed] [Google Scholar]
- 4.Ahmad I., Shagufta Recent developments in steroidal and nonsteroidal aromatase inhibitors for the chemoprevention of estrogen-dependent breast cancer. Eur. J. Med. Chem. 2015;102:375–386. doi: 10.1016/j.ejmech.2015.08.010. [DOI] [PubMed] [Google Scholar]
- 5.Bamodu O.A., Huang W.-C., Tzeng D.T.W., Wu A., Wang L.S., Yeh C.-T., Chao T.-Y. Ovatodiolide sensitizes aggressive breast cancer cells to doxorubicin, eliminates their cancer stem cell-like phenotype, and reduces doxorubicin-associated toxicity. Cancer Lett. 2015;364:125–134. doi: 10.1016/j.canlet.2015.05.006. [DOI] [PubMed] [Google Scholar]
- 6.LaPorta E., Welsh J. Modeling vitamin D actions in triple negative/basal-like breast cancer. J. Steroid Biochem. Mol. Biol. 2014;144:65–73. doi: 10.1016/j.jsbmb.2013.10.022. [DOI] [PMC free article] [PubMed] [Google Scholar]
- 7.Doubeni C.A., Doubeni A.R., Myers A.E. Diagnosis and management of ovarian cancer. Am. Fam. Physician. 2016;93:937–944. [PubMed] [Google Scholar]
- 8.Momenimovahed Z., Tiznobaik A., Taheri S., Salehiniya H. Ovarian cancer in the world: epidemiology and risk factors. Int. J. Womens. Health. 2019;11:287–299. doi: 10.2147/IJWH.S197604. [DOI] [PMC free article] [PubMed] [Google Scholar]
- 9.Scelo G., Larose T.L. Epidemiology and risk factors for kidney cancer. J. Clin. Oncol. 2018;36 doi: 10.1200/JCO.2018.79.1905. [DOI] [PMC free article] [PubMed] [Google Scholar]
- 10.Chow W.-H., Dong L.M., Devesa S.S. Epidemiology and risk factors for kidney cancer. Nat. Rev. Urol. 2010;7:245–257. doi: 10.1038/nrurol.2010.46. [DOI] [PMC free article] [PubMed] [Google Scholar]
- 11.Housman G., Byler S., Heerboth S., Lapinska K., Longacre M., Snyder N., Sarkar S. Drug resistance in cancer: an overview. Cancers. 2014;6:1769–1792. doi: 10.3390/cancers6031769. [DOI] [PMC free article] [PubMed] [Google Scholar]
- 12.Junttila M.R., de Sauvage F.J. Influence of tumour micro-environment heterogeneity on therapeutic response. Nature. 2013;501:346–354. doi: 10.1038/nature12626. [DOI] [PubMed] [Google Scholar]
- 13.Umar A.B., Uzairu A., Shallangwa G.A., Uba S. 2D-QSAR modelling and molecular docking studies for anti-cancer compounds against melanoma cell line SK-MEL-2. Heliyon. 2020;6 doi: 10.1016/j.heliyon.2020.e03640. [DOI] [PMC free article] [PubMed] [Google Scholar]
- 14.Deokar H., Deokar M., Wang W., Zhang R., Buolamwini J.K. 2D-QSAR studies of new pyrido[3,4-b]indole derivatives as inhibitors of colon and pancreatic cancer cell proliferation. Med. Chem. Res. 2018;27:2466–2481. doi: 10.1007/s00044-018-2250-5. [DOI] [PMC free article] [PubMed] [Google Scholar]
- 15.Shukla A., Tyagi R., Meena S., Datta D., Srivastava S., Khan F. 2D and 3D 2D-QSAR modelling, molecular docking and in-vitro evaluation studies on 18β-glycyrrhetinic acid derivatives against triple negative breast cancer cell line. J. Biomol. Struct. Dyn. 2019;38:1–24. doi: 10.1080/07391102.2019.1570868. [DOI] [PubMed] [Google Scholar]
- 16.Gade D.R., Makkapati A., Yarlagadda R.B., Peters G.J., Sastry B.S., Rajendra Prasad V.V.S. Elucidation of chemosensitization effect of acridones in cancer cell lines: combined pharmacophore modeling, 3D 2D-QSAR, and molecular dynamics studies. Comput. Biol. Chem. 2018;74:63–75. doi: 10.1016/j.compbiolchem.2018.02.014. [DOI] [PubMed] [Google Scholar]
- 17.Chen G., Zhou D., Li X.-Z., Jiang Z., Tan C., Wei X.-Y., Ling J., Jing J., Liu F., Li N. A natural chalcone induces apoptosis in lung cancer cells: 3D-2D-QSAR, docking and an in vivo/vitro assay. Sci. Rep. 2017;7 doi: 10.1038/s41598-017-11369-9. [DOI] [PMC free article] [PubMed] [Google Scholar]
- 18.Alam S., Khan F. 3D-2D-QSAR studies on Maslinic acid analogs for Anticancer activity against Breast Cancer cell line MCF-7. Sci. Rep. 2017;7:6019. doi: 10.1038/s41598-017-06131-0. [DOI] [PMC free article] [PubMed] [Google Scholar]
- 19.Adhikari N., Halder A.K., Saha A., Das Saha K., Jha T. Structural findings of phenylindoles as cytotoxic antimitotic agents in human breast cancer cell lines through multiple validated 2D-QSAR studies. Toxicol. Vitro. 2015;29:1392–1404. doi: 10.1016/j.tiv.2015.05.017. [DOI] [PubMed] [Google Scholar]
- 20.Prachayasittikul Veda, Pingaew R., Worachartcheewan A., Nantasenamat C., Prachayasittikul S., Ruchirawat S., Prachayasittikul Virapong. Synthesis, anticancer activity and 2D-QSAR study of 1,4-naphthoquinone derivatives. Eur. J. Med. Chem. 2014;84:247–263. doi: 10.1016/j.ejmech.2014.07.024. [DOI] [PubMed] [Google Scholar]
- 21.Yadav D.K., Kalani K., Srivastava F.K. 2D-QSAR and Docking Based Semi-synthesis and in vitro Evaluation of 18 β-glycyrrhetinic Acid Derivatives Against Human Lung Cancer Cell Line A-549. Med. Chem. (Los. Angeles) 2013 doi: 10.2174/1573406411309080009. S.K. [DOI] [PubMed] [Google Scholar]
- 22.Ivković B.M., Nikolic K., Ilić B.B., Žižak Ž.S., Novaković R.B., Čudina O.A., Vladimirov S.M. Phenylpropiophenone derivatives as potential anticancer agents: synthesis, biological evaluation and quantitative structure–activity relationship study. Eur. J. Med. Chem. 2013;63:239–255. doi: 10.1016/j.ejmech.2013.02.013. [DOI] [PubMed] [Google Scholar]
- 23.Pontiki E., Hadjipavlou-Litina D., Geromichalos G., Papageorgiou A. Anticancer activity and quantitative–structure activity relationship (2D-QSAR) studies of a series of antioxidant/anti-inflammatory aryl-acetic and hydroxamic acids. Chem. Biol. Drug Des. 2009;74:266–275. doi: 10.1111/j.1747-0285.2009.00864.x. [DOI] [PubMed] [Google Scholar]
- 24.Li H., Lai C.S., Wu J., Ho P.C., de Vos D., Tiekink E.R.T. Cytotoxicity, qualitative structure–activity relationship (2D-QSAR), and anti-tumor activity of bismuth dithiocarbamate complexes. J. Inorg. Biochem. 2007;101:809–816. doi: 10.1016/j.jinorgbio.2007.01.010. [DOI] [PubMed] [Google Scholar]
- 25.Karrouchi∗ K., Fettach S., Radi∗ S., Yousfi E., Bekkaye T.J., Mabkhot Y.N., Alterary S., Ansar M.E.A.F. Synthesis, characterization, free-radical scavenging capacity and antioxidant activity of novel series of hydrazone, 1,3,4-oxadiazole and 1,2,4- triazole derived from 3,5-dimethyl-1H-pyrazole. Lett. Drug Des. Discov. 2019 M. [Google Scholar]
- 26.Karrouchi K., Chemlal L., Taoufik J., Cherrah Y., Radi S., El Abbes Faouzi M., Ansar M. Synthesis, antioxidant and analgesic activities of Schiff bases of 4-amino-1,2,4-triazole derivatives containing a pyrazole moiety. Ann. Pharm. Fr. 2016;74:431–438. doi: 10.1016/j.pharma.2016.03.005. [DOI] [PubMed] [Google Scholar]
- 27.Pillai R.R., Karrouchi K., Fettach S., Armaković S., Armaković S.J., Brik Y., Taoufik J., Radi S., El Abbes Faouzi M., Ansar M. Synthesis, spectroscopic characterization, reactive properties by DFT calculations, molecular dynamics simulations and biological evaluation of Schiff bases tethered 1,2,4-triazole and pyrazole rings. J. Mol. Struct. 2019;1177:47–54. [Google Scholar]
- 28.Karrouchi K., Yousfi E.B., Sebbar N.K., Ramli Y., Taoufik J., Ouzidan Y., Ansar M., Mabkhot Y.N., Ghabbour H.A., Radi S. New pyrazole-hydrazone derivatives: X-ray analysis, molecular structure investigation via density functional theory (DFT) and their high in-situ catecholase activity. Int. J. Mol. Sci. 2017 doi: 10.3390/ijms18112215. [DOI] [PMC free article] [PubMed] [Google Scholar]
- 29.Karrouchi K., Brandán S.A., Sert Y., El-marzouqi H., Radi S., Ferbinteanu M., Faouzi M.E.A., Garcia Y., Ansar M. Synthesis, X-ray structure, vibrational spectroscopy, DFT, biological evaluation and molecular docking studies of (E)-N’-(4-(dimethylamino)benzylidene)-5-methyl-1H-pyrazole-3-carbohydrazide. J. Mol. Struct. 2020;1219 [Google Scholar]
- 30.Karrouchi K., Brandán S.A., Sert Y., Karbane M. El, Radi S., Ferbinteanu M., Garcia Y., Ansar M. Synthesis, structural, molecular docking and spectroscopic studies of (E)-N’-(4-methoxybenzylidene)-5-methyl-1H-pyrazole-3-carbohydrazide. J. Mol. Struct. 2021;1225 [Google Scholar]
- 31.Karrouchi K., Brandán S.A., Hassan M., Bougrin K., Radi S., Ferbinteanu M., Garcia Y., Ansar M. Synthesis, X-ray, spectroscopy, molecular docking and DFT calculations of (E)-N’-(2,4-dichlorobenzylidene)-5-phenyl-1H-pyrazole-3-carbohydrazide. J. Mol. Struct. 2021;1228 [Google Scholar]
- 32.Afifi O.S., Shaaban O.G., Abd El Razik H.A., Shams El-Dine S.E.-D.A., Ashour F.A., El-Tombary A.A., Abu-Serie M.M. Synthesis and biological evaluation of purine-pyrazole hybrids incorporating thiazole, thiazolidinone or rhodanine moiety as 15-LOX inhibitors endowed with anticancer and antioxidant potential. Bioorg. Chem. 2019;87:821–837. doi: 10.1016/j.bioorg.2019.03.076. [DOI] [PubMed] [Google Scholar]
- 33.Husseiny E.M. Synthesis, cytotoxicity of some pyrazoles and pyrazolo[1,5-a]pyrimidines bearing benzothiazole moiety and investigation of their mechanism of action. Bioorg. Chem. 2020;102 doi: 10.1016/j.bioorg.2020.104053. [DOI] [PubMed] [Google Scholar]
Associated Data
This section collects any data citations, data availability statements, or supplementary materials included in this article.
Supplementary Materials
Data Availability Statement
Data included in article/supplementary material/referenced in article.