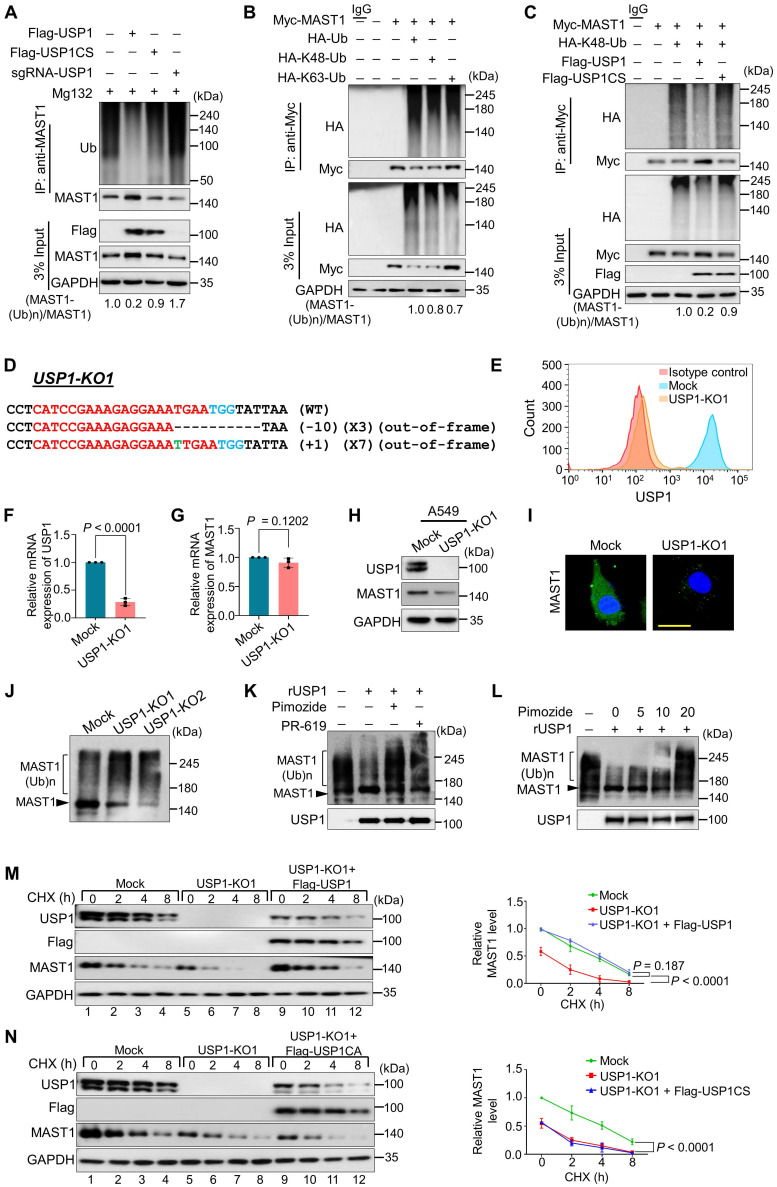
Figure 5.
USP1 extends MAST1 protein half-life by its deubiquitinating activity. (A) The ubiquitination and deubiquitination of endogenous MAST1 were analyzed by transfecting HeLa cells with Flag-USP1, Flag-USP1CS, or sgRNA targeting USP1 followed by immunoprecipitation with an anti-MAST1 antibody and immunoblotting with an anti-ubiquitin antibody. The cells were treated with MG132 for 6 h prior to harvest. (B) The K48- and K63-linked polyubiquitination of MAST1 was analyzed by transfecting HEK293 cells with Myc-MAST1, HA-ubiquitin, HA-K48-ubiquitin, and HA-K63-ubiquitin, followed by immunoprecipitation with an anti-Myc antibody and immunoblotting with anti-HA and anti-Myc antibodies. (C) The deubiquitination of K48-linked ubiquitination of MAST1 by USP1 was analyzed by transfecting HEK293 cells with Myc-MAST1 and HA-K48-ubiquitin along with Flag-USP1 or Flag-USP1CS, followed by immunoprecipitation with an anti-Myc antibody and immunoblotting with anti-HA and anti-Myc antibodies. The relative protein expression of MAST1-(Ub)n with respect to input MAST1 for (A-C) was quantified using ImageJ software and represented as (MAST1-(Ub)n/MAST1) below the blot. (D) Sanger sequencing data showing the disrupted USP1 gene sequences in A549 cells (USP1-KO1). The sgRNA recognition site is denoted in red. The deleted bases are indicated with dashes, and the inserted bases are denoted with green, with the number of deleted or inserted bases indicated in parentheses. The number of occurrences of the indicated sequence is shown in parentheses (for example, X3 and X7 indicate the number of each clone sequenced). (E) Flow cytometry assay showing the expression of USP1 in mock control vs. USP1-KO1. (F) The effect of USP1-KO1 on the mRNA expression of USP1 and (G) MAST1 was analyzed by qRT-PCR with specific primers. The relative mRNA expression levels are shown after normalization to GAPDH mRNA expression. Data are presented as the mean and standard deviation of three independent experiments (n = 3). A two-tailed t-test was used, and the P values are indicated. (H) Western blot analysis of the endogenous expression of USP1 and MAST1 protein in USP1-KO1. GAPDH was used as the internal loading control. (I) The effect of USP1 gene disruption on the endogenous expression of MAST1 was analyzed by immunofluorescence staining. Scale bar: 10 µm. (J) The TUBEs assay was performed to assess the ubiquitination status of the MAST1 protein in mock control and USP1-KO1 and USP1-KO2 clones. Cell lysates were immunoprecipitated with TUBEs antibodies, followed by immunoblotting with the indicated antibodies. (K) The total polyubiquitinated MAST1 protein was pulled down using TUBE2 resin from USP1-KO1 A549 cells treated with or without rUSP1 protein in the presence or absence of PR-619 (100 µM) and pimozide (20 µM) at 37 °C for 1 h. The eluted samples were analyzed by Western blotting with indicated antibodies. (L) The polyubiquitinated MAST1 protein was pulled down using TUBE2 resin treated with or without rUSP1 protein in the presence or absence of increasing concentrations of pimozide (0, 5, 10, and 20 µM) at 37 °C for 1 h. The eluted samples were analyzed by Western blotting with indicated antibodies. (M) Mock control, USP1-KO1, and USP1-KO1 reconstituted with either Flag-USP1 or (N) Flag-USP1CS were used to analyze the half-life of MAST1. CHX (150 µg/mL) was administered for the indicated time, and the cells were then harvested for Western blotting with the indicated antibodies, GAPDH was used as a loading control. Data are presented as the mean and standard deviation of three independent experiments (n=3). Two-way ANOVA followed by Tukey's post hoc test was used with the indicated P values.

