

Abstract

The direct chemical reactivity between phosphorus and nitrogen was induced under high-pressure and high-temperature conditions (9.1 GPa and 2000–2500 K), generated by a laser-heated diamond anvil cell and studied by synchrotron X-ray diffraction, Raman spectroscopy, and DFT calculations. α-P3N5 and γ-P3N5 were identified as reaction products. The structural parameters and vibrational frequencies of γ-P3N5 were characterized as a function of pressure during room-temperature compression and decompression to ambient conditions, determining the equation of state of the material up to 32.6 GPa and providing insight about the lattice dynamics of the unit cell during compression, which essentially proceeds through the rotation of the PN5 square pyramids and the distortion of the PN4 tetrahedra. Although the identification of α-P3N5 demonstrates for the first time the direct synthesis of this compound from the elements, its detection in the outer regions of the laser-heated area suggests α-P3N5 as an intermediate step in the progressive nitridation of phosphorus toward the formation of γ-P3N5 with increasing coordination number of P by N from 4 to 5. No evidence of a higher-pressure phase transition was observed, excluding the existence of predicted structures containing octahedrally hexacoordinated P atoms in the investigated pressure range.
Short abstract
The α- and γ-P3N5 phosphorus nitride polymorphs have been obtained by direct chemical reactivity between phosphorus and molecular nitrogen under high pressure (9.1 GPa) and high-temperature (2000−2500 K) conditions, generated using a laser heated diamond anvil cell. Insights on the reaction mechanism, involving the preliminary formation of α-P3N5, and on the structural properties of γ-P3N5 have been evinced by synchrotron X-ray diffraction, Raman spectroscopy and DFT calculations.
Introduction
Nitrogen and phosphorus respectively occupy the second and third periods of group 15 in the periodic table of the elements. While exhibiting the characteristic ns2np3 outer-shell electronic configuration, compared to heavier elements of the following periods, the two lowest-Z pnictogens do not have electrons in the d orbitals. P and N elements are widely present respectively in the earth’s crust and atmosphere, playing a key role in the existence of life on our planet, and are well known to chemists for their ability to combine with other atoms, forming a large variety of binary compounds (i.e., nitrides and phosphides). Nevertheless, whereas the chemistry literature and textbooks report a large variety of systems containing P–N bonds in the presence of other elements, studies on compounds containing only P and N are, in comparison, quite limited. In the Corbridge reference textbook on phosphorus, which is more than 1300 pages long, the binary compounds of phosphorus and nitrogen barely occupy 2 pages, in which just a few studies, essentially focused on phosphorus nitrides (PN and P3N5) and phosphorus triazide P(N3)3, are mentioned.1,2 Furthermore, whereas chemists have become quite expert at synthesizing compounds containing P–N bonds starting from suitable precursors,3 the elusive direct chemical reactivity between the two elements has been essentially reported only in the gas phase at high temperature and under electric discharge, leading to poorly characterized amorphous PN and P3N5 materials.4,5 The two elements do not react spontaneously under ambient conditions, and even if structural consistency has been recently found for group 15 elements at high pressure,6−9 there is a large interval of pressure and temperature conditions in which N and P behave quite differently. The thermodynamically stable allotrope of phosphorus at ambient conditions is the black form of the element (Pblack), which was synthesized for the first time at high pressure by Bridgman back in 191410 and is currently attracting strong and growing attention from the scientific community because of its characteristic crystalline structure made by the stacking of phosphorene layers.11,12
The phase diagram of phosphorus at room temperature is known up to 340 GPa.13 Pblack, with the A17 layered orthorhombic structure (Cmce, Z = 8), is observed up to about 5 GPa, where it transforms to rhombohedral A7 (R3̅m, Z = 2), another phase with layered structure, which is stable up to 10.5 GPa. Above this pressure, a pseudosimple cubic structure (p-sc), extending from 10.5 up to about 30 GPa, has been recently demonstrated to exist using synchrotron X-ray diffraction (XRD) and He as the pressure-transmitting medium (PTM).6 The observation of this structure has significantly raised the pressure limit at which the layered structures of P can be observed, with remarkable implications.7 Upon further compression, a simple cubic (sc) structure, rarely observed in nature, is reported to be stable up to 107 GPa, where it transforms to an incommensurately modulated structure Cmmm(00γ)s00. At 137 GPa, this structure converts to a simple hexagonal one (P-V, sh, P6/mmm, Z = 1), observed up to 282 GPa, whereas a body-centered cubic structure (bcc), later identified as a superlattice structure (P-VI, cI16(I4̅3d)), has been observed from 262 GPa up to 340 GPa.13 Experimental high-pressure and high-temperature data are limited to ∼11 GPa and ∼1250 K.14
Nitrogen, on the other side, remains stable as a diatomic N2 molecule over a wide range of pressure along room-temperature compression from the fluid under ambient conditions through different molecular crystalline structures β, δ, δloc, ϵ, and ζ up to ∼100 GPa.15 Above 100 GPa, the higher-density conditions further reduce the intermolecular distances, determining the instability of the N2 molecular units and leading to N amorphization.16 Laser heating (LH) at these pressures leads to the synthesis of different polymeric single-bonded structures of N: cubic-gauche N (cg-N; 110 GPa and 2000 K),17 layered polymeric N (LP-N; Pba2, above 125 GPa, and 2000 K),18 and hexagonal layered polymeric N (HLP-N; P42bc, 240 GPa and 3300 K).19 Recently, two research groups independently and almost simultaneously reported N to adopt a layered crystalline structure analogous to the orthorhombic layered structure of black phosphorus (bp-N) upon laser heating above 140 GPa (140 GPa, 4000 K8 and 146 GPa, 2200 K9), thus extending to N the structural consistency within group 15, as recently occurred in the case of P with respect to heavier pnictogens.7 However, whereas the high-pressure behaviors of P and N have been constantly investigated by high-pressure scientists for years, the chemical reactivity between the two elements in the condensed phase has remained mostly unexplored until recently.
Investigating the chemical reactivity between P and N under extreme pressure and temperature conditions is not only important for providing insights about the fundamental chemistry of these two elements and shedding light on specific issues in bond theory in pnictogens under high-density conditions but is also relevant to current hot topics regarding the possibility of using pressure to synthesize new advanced materials that are potentially recoverable under ambient conditions, such as N-doped phosphorene-based materials,20 N-based high-energy-density materials, and new crystalline phosphorus nitrides featuring high P coordination by N atoms, which have been predicted by calculations21−23 and recently synthesized at high pressure in ternary systems.24
In this study, we successfully induced chemical reactivity between P and N using pressure, statically generated by means of a membrane diamond anvil cell (DAC), to increase the density and reduce the intermolecular distances and temperature, generated by laser heating, to overcome kinetic barriers. Within this picture, P was used as a reactant and laser absorber, whereas N2 was used as a reactant and PTM, thus avoiding any unnecessary contamination source. The same approach was successfully adopted to induce chemical reactivity in P and H2, leading to the synthesis of PH3 and to the discovery of the crystalline van der Waals compound (PH3)2H225 and, more recently, to the synthesis of crystalline arsenic nitride (AsN) from As and N2.26
While this manuscript was in preparation, a paper on the same topic was published by a Japanese group led by Hasegawa.27 Whereas some findings of the recent paper are consistent with our previous results,28,29 relevant differences apply, leading to contrasting conclusions, particularly concerning the comprehension of the reactive process and the characterization of the products.
Our XRD and Raman data indicate that, under the applied high-pressure and high-temperature conditions, the formation of chemical bonds between the two lowest-Z pnictogens leads to the synthesis of P3N5. Although the process ultimately leads to the formation of γ-P3N5, α-P3N5 also seems to be involved, likely as a preliminary step. This observation, in agreement with the pressure-coordination rule, is consistent with the original high-pressure and high-temperature synthesis of γ-P3N5 reported by Landkskron et al.30 The formation of α-P3N5 from the elements, without any precursor, has not been reported so far.
γ-P3N5 is here further characterized by synchrotron X-ray diffraction (XRD), Raman spectroscopy, and density functional theory (DFT) calculations at both high and ambient pressure to gain insight into its mechanical properties and to identify potential reactive paths toward the predicted formation of higher-pressure polymorphs with octahedral P coordination by N atoms.21,22,31
Experimental Section
Pure crystalline Pblack used for the experiments was synthesized from red phosphorus according to ref (32). The reagents for the synthesis of Pblack were purchased from Sigma-Aldrich with the following purities: red phosphorus (>99.99%), tin (>99.999%), gold (>99.99%), and SnI4 (99.999%). The purity of the synthesized Pblack crystals used in this study was checked by X-ray powder diffraction, Raman spectroscopy, EDX analysis, and ICP-MS measurements, with the latter giving a purity of 99.999+%. The Pblack crystals were then fragmented and cut by a metallic tip to obtain smaller 20–40 μm chips to be loaded into the DAC.
Pressure was generated by means of membrane diamond anvil cells (DAC) equipped with Ia/IIa type standard cut 16-sided beveled anvils having 350/400 μm culet tips. Re gaskets (200 μm) indented to about 50 μm and laser-drilled to obtain a 150-μm-diameter hole were used for the sideways containment of the samples. A small crystal of Pblack (∼30 μm) was placed in the sample chamber by means of a metallic tip, and the remaining volume was filled with liquid N2 using a standard gas-loading technique. Au and a ruby chip were used to measure the pressure, whereas the temperature was estimated by the fit of thermal radiation during laser heating. High temperature was generated by means of a Nd:YAG laser source (λ = 1054 nm) focused on the Pblack crystal (∼30 μm beam spot size diameter).
The samples were studied using synchrotron XRD at ESRF-ID27 with monochromatic λ = 0.3738 Å and a beam spot size diameter of 5 μm during and after LH to select different areas of the sample, spot differently oriented Pblack crystallites, and find the reflections necessary for the calculation of the lattice parameters and the unit cell volume. The diffracted radiation was revealed by a MAR CCD165 detector except for the pattern of the reaction product under ambient conditions, where a Dectris PILATUS 300 K-W detector was used. A typical acquisition time was 20–30 s with ±15° maximum oscillation. The detector tilt and sample-to-detector distance were calibrated with a CeO2 standard. The raw images were processed using DIOPTAS software.33
Except for one pressure point at 9.1 GPa, where the structure of the reaction product could be determined by Rietveld refinement, for the other high-pressure points the lattice parameters and unit cell volume were determined using the UnitCell software.34 The peak positions were obtained by fitting the integrated XRD patterns with Voigt line shapes after baseline subtraction. Fityk software was used for this purpose.35 A multiphase full profile Le Bail fit was performed to obtain the structure of the reaction product recovered under ambient conditions (Figure SI-1).
The Raman spectra were acquired at LENS with 1.5 cm–1 spectral resolution using the 647.1 nm emission wavelength of a Kr ion laser. The details of the Raman setup are described elsewhere.36 No photochemical effect was observed at the employed laser power.
Computational Methods
Electronic structure calculations were carried out at the GGA level using the exchange-correlation PBE functional37 with the periodic boundary conditions simulation suite Quantum Espresso, version 6.3.38 Projector-augmented wave39 pseudopotentials from the standard library40 were used for 1s2 and 1s22s22p6 core electrons of N and P, respectively. The kinetic energy cutoff for the plane waves was fixed to 80 Ry, and a 12 × 12 × 12 mesh was selected for integration in the reciprocal space. The self-consistent field convergence threshold was fixed to 10–8 Rydberg. Full cell geometrical optimizations were stopped using a force threshold of 10–3 Rydberg/Bohr. The equation-of-state parameters were obtained with the code GIBBS241 by fitting a series of computed volume–energy pairs spanning a pressure range of up to more than 100 GPa. The vibrational frequencies of all P3N5 polymorphs were also obtained with Quantum Espresso. We performed calculations under the density functional perturbation theory approximation42 on a 2 × 2 × 2 supercell to describe the forces. We employed a 70 Ry energy cutoff for the plane waves and a k-point mesh of 6 × 6 × 6. Frequencies were associated with pressures thanks to the equations of states derived following the procedure described above.
Results and Discussion
High-Pressure and High-Temperature Reactivity between P and N2
The phase diagrams of P and N from ambient conditions up to 30 GPa and ∼2500 K are reported in Figure 1. Pressure and temperature regions can be identified in which P is stable in one of its layered structures (A17, A7, and p-sc) and, simultaneously, molecular nitrogen is fluid. Laser heating in these regions was initially selected to preserve the layered structure of P while taking advantage of the higher mobility of fluid N2 toward N functionalization.
Figure 1.
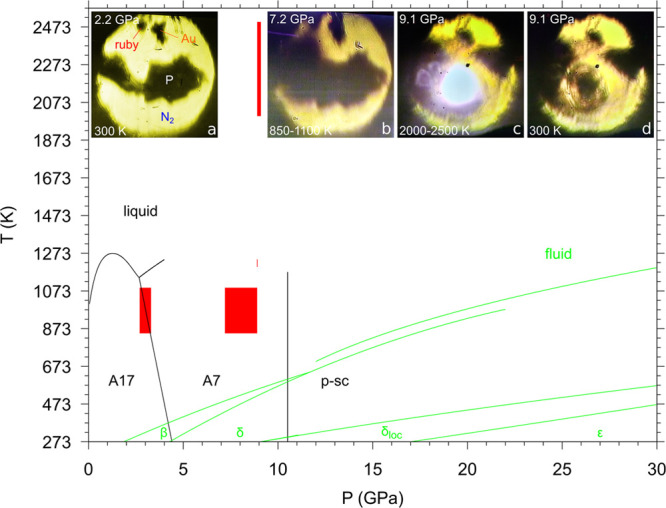
Phase diagram of phosphorus (black lines),6,43 and nitrogen (green lines)16,44−46 under laser heating conditions (red). The two melting lines of N2 at low and high pressure have been drawn according to Zinn et al.44 and Weck et al.,45 respectively. The images represent (a) a loaded sample before LH, (b) a sample at 7.2 GPa and ambient temperature after LH2 at 7.2–8.9 GPa and 850–1100 K, (c) a sample at 9.1 GPa and 2000–2500 K during LH4, and (d) a sample at 9.1 GPa and ambient T after LH4.
Pblack was loaded with liquid N2 in a membrane DAC and compressed to the desired laser heating pressure (Experimental Section). Figure 1a shows a microscope image of a sample at 2.2 GPa and 300 K before laser heating, where Pblack can be observed in the dark central area and N2 is in the surrounding transparent regions. The Au and ruby pressure gauges are also visible at the top of the picture.
Several laser heating irradiations (Nd:YAG 1064 nm) were performed under different pressure conditions, corresponding to the A17 and A7 layered structures of P. No reactivity was observed at 3 GPa and T < 1100 K (LH1, 10–15 W) during the first laser heating in the A17 structure of P. Pressure was then increased up to 7.2 GPa in the A7 structure of P, where another laser irradiation was performed between 7.2 and 8.9 GPa and 850–1100 K (LH2, 10–19.5 W). After LH2, the areas corresponding to P appeared larger and more diffuse (Figure 1b). Nevertheless, no changes could be appreciated in the diffraction patterns. Another irradiation (LH3, 10–24.8 W), at about the same pressure (8.9 GPa) and slightly higher temperature (1200–1240 K), was responsible for the appearance of extremely weak new peaks in a few spots of the laser-heated area. Finally, irradiation (LH4, 10–35 W, ∼1 h) under comparable pressure conditions (8.9–9.1 GPa) but considerably higher temperature (2000–2500 K) produced a sudden lightning in the laser-heated area of the sample (Figure 1c). Correspondingly, the XRD diffraction patterns acquired at high temperature during laser heating clearly showed the appearance of new peaks, thus suggesting the occurrence of a chemical transformation. The effects of the irradiation were also evident at room temperature, after switching off the laser, both in the sample image (Figure 1d) and in the diffraction patterns (Figure 2).
Figure 2.

Integrated XRD diffraction patterns and corresponding detector images (right) acquired before LH2 in the dark (A7-P and δ-N2, black trace, bottom detector image) and in the transparent (δ-N2, red trace, middle detector image) areas of the sample (Figure 1b) and after LH4 at 9.1 GPa in the center of the laser-heated area (blue trace, top right image). The pattern of the reaction product (blue trace) was acquired in one of the blue points on the red XRD mapping grid superimposed on the image of the sample after LH4 at 8.9–9.1 GPa and 2000–2500 K. Each * indicates a peak from the Au pressure sensor. The integrated patterns have been normalized to their most intense peak, and the background has been subtracted. A diffraction pattern of a sample containing P in He at comparable pressure is also displayed (gray trace) to help identify the peaks from P (A7).
To gain insight about the occurrence of chemical reactivity, we performed a 9 × 9 XRD mapping of the laser-heated area (5 μm spatial resolution), indicated by the red grid in the sample image shown in Figure 2. We found that whereas the outer part of the grid mainly contains unreacted P and N2 (red points on the grid), the inner part of the LH area essentially contains a reaction product (blue points on the grid) and unreacted excess N2 but not P, which was completely consumed here during LH. The spotty intensity distribution observed in the diffraction images acquired in the LH area indicates the formation of a powder-like polycrystalline reaction product (top right image in Figure 2), as typically occurring upon LH at high pressure, and the corresponding integrated pattern clearly shows the appearance of new peaks, none of which can be associated with any known structure of P (integrated patterns in Figure 2).
The diffraction images acquired on the outer portions of the laser-heated area reveal instead the presence of a diffuse scattering pattern, which is characterized by the appearance of parallel stripes with periodic intensity oscillations, superimposed on the diffraction of P, N2, and the reaction product also observed in the center of the laser-heated area. This is clearly shown in Figure 3, displaying a comparison between one of the diffraction images acquired in the center of the laser-heated area (Figure 3A, the same as in the upper right panel of Figure 2) and one of those acquired on its borders, where a portion of P was partially heated by the laser spot (Figure 3B). Both signals remain present in the corresponding sample areas (sample positions a and b in Figure 3C) during compression up to the highest investigated pressure (32.6 GPa for XRD and 45.5 GPa for Raman) and decompression down to ambient pressure.
Figure 3.

(A and B) Detector diffraction images acquired in the sample positions respectively corresponding to (C) labels a and b in the sample image.
Identification of the Reaction Products
Two forms of phosphorus(V) nitride, α-P3N547 and γ-P3N5,30 have been experimentally synthesized and structurally characterized for the first time by Schnick et al. A third form, β-P3N5,48 was identified as a polymorph of α-P3N5 featuring a stacking disorder, whereas the existence of other P3N5 polymorphs, predicted by calculations, has never been experimentally observed so far.21,22,31
α-P3N5 belongs to the Cc (Cs4, no. 9) monoclinic space group (Z = 4) and has a density of 2.77 g cm–3 and a 3D structure made by corner- and edge-sharing PN4 tetrahedra (Figure 4). It was obtained as a mixture of α-P3N5 and β-P3N5 from the high-temperature reaction of suitable precursors48
and as pure α-P3N5 from the thermal decomposition of tetradiaminophosphonium iodide according to the following reaction:47
Figure 4.

Room-temperature integrated XRD patterns of the reaction product at 9.1 GPa after LH4 (blue) and once recovered at ambient pressure (orange) and of α-P3N5 (black)47 and γ-P3N5 (red)30 under ambient conditions drawn according to the literature.49,50 The crystalline structures of α-P3N5 and γ-P3N5 are also displayed. To make the comparison more clear, the peaks of unreacted excess δ-N2 and Au (pressure sensor) were mathematically fitted and filtered out from the integrated pattern of the product acquired at 9.1 GPa after LH4 (blue trace in Figure 2).
γ-P3N5 belongs to the Imm2 (C2v20, no. 44) orthorhombic space group (Z = 2) and has a density of 3.65 g cm–3, which is 32% higher than that of α-P3N5, and a 3D structure made by corner-sharing PN4 tetrahedra and by corner- and edge-sharing PN5 square pyramids (Figure 4). It was synthesized for the first time by Landskron and coauthors from partially crystalline α-P3N5 at 11 GPa and 1500 °C.30
Both the α and the γ phases of P3N5 can display ferroelectric behavior because Cc and Imm2 are polar space groups.
Denser P3N5 polymorphs, indicated as kyanite-type δ-P3N5 (triclinic P1̅) by Kroll et al.21 and as V3O5-like P3N5 by Dong et al.,22 have been predicted by calculations21,22 but have never been experimentally observed. These polymorphs feature PN6 units, where P is octahedrally coordinated by six N atoms. According to theoretical calculations, kyanite-type δ-P3N5 is expected to become stable with respect to γ-P3N5 above 28 and 43 GPa, respectively, depending on the adopted local density (LDA) or general gradient (GGA) approximation,21 whereas V3O5-like P3N5 is expected to be stabilized versus γ-P3N5 above 35.5 GPa.22 Whereas the δ-P3N5 structure features edge-sharing PN6 octahedra and isolated PN4 tetrahedra sharing their vertices with the octahedra, the V3O5-like one is entirely made by PN6 octahedra. In both cases, a higher coordination of P by the N atoms is induced by pressure with respect to the α-P3N5 and γ-P3N5 polymorphs. A 35% higher density has been estimated for the V3O5-like structure with respect to α-P3N5.22 Octahedral PN6 units have also been predicted to exist by Raza et al.23 in two high-pressure phosphorus nitride polymorphs having different stoichiometry: skutterudite-type PN3 (orthorhombic Immm), metastable between 10 and 100 GPa, and PN2 (P2/m), stable above 200 GPa. Also, these two polymorphs have never been experimentally reported. Experimentally, PN6 units have been recently synthesized in ternary systems including B besides P and N.51
The reaction products observed in the center of the laser-heated area and in its outer portion (Figure 3) were identified as γ-P3N5 and α-P3N5, respectively.
In Figure 4, the room-temperature XRD patterns of α-P3N5 (black) and γ-P3N5 (red) under ambient conditions, generated from literature cif files,49,50 are compared with those of our reaction product acquired in the center of the laser-heated area at 9.1 GPa (blue) and at ambient pressure (orange), once recovered. Despite a slightly larger peak width in our recovered sample, due to the use of a different detector with respect to the high-pressure data (Experimental Section), and despite intensity differences in some peaks, due to the polycrystalline nature of the product synthesized by HP-HT, perfect matching in terms of lattice parameters and the unit cell volume can be appreciated between the pattern of our recovered reaction product synthesized from P and N2 at high pressure and high temperature (a = 12.8757(5) Å, b = 2.61745(15) Å, c = 4.39920(15) Å, and V0 = 148.259(8) Å3, Figure SI-1) and the pattern of γ-P3N5 reported in the literature synthesized from α-P3N5 at ambient pressure and high temperature (a = 12.8721(4) Å, b = 2.61312(6) Å, c = 4.4003(2) Å, and V0 = 148.00(2) Å3).50
In most areas of the experimental chamber, the crystal growth during laser heating led to a spotty diffraction pattern unsuitable for structural refinement. However, by focusing the beam on one selected portion of the sample, data of sufficiently high quality could be identified to perform a full Rietveld refinement using JANA2006 software.52
The Rietveld refinement of the XRD pattern acquired in the center of the laser-heated area at 9.1 GPa and room temperature after LH4 is reported in Figure 5. All of the parameters relative to data collection and crystallographic data are reported in Table 1, and the refined atomic positions are provided in the cif file deposited at the Cambridge Crystallographic Data Centre with deposition number CSD 2164795.
Figure 5.

(a) Rietveld refinement of one of the XRD patterns assigned to γ-P3N5 acquired in the center of the laser-heated area at 9.1 GPa and room temperature after LH4. Views of the γ-P3N5 unit cell in the ac at plane at room temperature derived from XRD (b) at 9.1 GPa and (c) at ambient pressure.50 The PN5 square pyramids are highlighted in blue, and the PN4 tetrahedra, in magenta. The distortion due to pressure is highlighted in the ac plane by the position of the P2 atoms, slightly moving from the basis of the PN5 pyramids toward their internal volume, and of the P1 atoms, slightly moving away from the center of the PN4 tetrahedra.
Table 1. Crystallographic Data, Details of Data Collection, and Agreement Indices for the Final Least-Square Cycles of the Rietveld Refinement of γ-P3N5 at 9.1 GPa and Room Temperature.
| crystal system | orthorhombic |
| space group | Imm2 |
| a (Å) | 12.6041(7) |
| b (Å) | 2.60103(15) |
| c (Å) | 4.2740(2) |
| V (Å3) | 140.12(1) |
| Z | 2 |
| wavelength (Å) | 0.3738 |
| 2θ range (deg) | 3.1–13.8 |
| no. of observations | 1300 |
| parameters | 46 |
| R(I) | 0.083 |
| Rp | 0.004 |
| Rwp | 0.007 |
| Rexp | 0.056 |
| goodness of fit | 0.11 |
Our lattice parameters are in agreement with those recently published by Niwa et al.27 for γ-P3N5 recovered under ambient conditions after laser heating P and N2 at a slightly higher pressure of 12 GPa (a = 12.8905(7) Å, b = 2.6153(3) Å, and c = 4.4056(3)), even though the laser-heating temperature is not reported in their paper, thus making unclear whether, according to their laser-heating pressure, reactivity in their case occurred in liquid or in crystalline p-sc P.6,7
The different diffraction signal detected in the outer portions of the laser-heated area revealed instead, among diffuse scattering, reflections compatible with a 0kl layer of the α-P3N5 phase (Figure 6). On the basis of the five most prominent reflections (010, 01̅0, 020, 012, and 012̅), two lattice parameters of α-P3N5 (b and c) out of four (a, b, c, and β) were determined as a function of pressure by fitting the individual reflections. Considering the pressure effect, the two interlayer distances of 5.65 and 8.85 Å at 9.5 GPa and room temperature are indeed compatible with the b and c lattice parameters reported by Horstmann et al.47 for the monoclinic (Cc) unit cell of α-P3N5 synthesized at ambient pressure by the high-temperature decomposition of [P(NH2)4]I at 825 °C (a = 8.12077(4) Å, b = 5.83433(4) Å, c = 9.16005(5) Å, β = 115.809(1)°, and V0 = 390.705 Å3). The characteristic aspect of this diffraction signal as linear stripes suggests the presence of a layer stacking disorder, as reported for β-P3N5.48 It is worth mentioning that the systematic absences in the indexed diffraction pattern do not match the Cc space group of bulk α-P3N5 likely because of the random stacking faults or different sheets stacking order.48 Although the spatial periodicities calculated for the two-dimensional layer actually correspond to the b and c lattice parameters of α-P3N5, this assumption has been adopted to explain the complex pattern observed in Figure 6.
Figure 6.

(Upper panel) Detector image showing a diffraction pattern acquired in the outer part of the laser-heated area (sample position b in Figure 3C) at 9.5 GPa and room temperature. Periodic intensity oscillations due to the corresponding lattice planes are labeled in red. The linear stripe aspect of the signal indicates a layer stacking disorder. (Lower panel) Azimuthally integrated diffraction pattern of the detector image shown in the upper panel (blue trace). The orange ticks represent the 2θ positions of the diffraction peaks of γ-P3N5 obtained by Rietveld refinement of a pattern acquired in the center of the laser-heated area (sample position a in Figure 3C) at 9.1 GPa. Besides the reflections assigned to α-P3N5 (hkl labels in the image) and γ-P3N5 (orange ticks in the integrated pattern), the other diffraction signals are due to unreacted P and N2, Au and ruby pressure markers, and Re from the gasket, in agreement with the sample position where the pattern was acquired and consistently with the Raman mapping shown in Figure 10.
Characterization of the Reaction Products
Until very recently, only ambient-pressure structural XRD data and IR spectra were experimentally reported in the literature for α-P3N5 and γ-P3N5,21,30,47 with no characterization at high pressure. Together, the data presented here and those recently published by Niwa et al.27 provide a complementary XRD and Raman characterization of the structural and spectroscopic behavior of γ-P3N5, covering the entire pressure range of up to 50 GPa at room temperature.
X-ray Diffraction
After γ-P3N5 was synthesized, XRD patterns were acquired during room-temperature compression from 9.1 up to 32.6 GPa and further decompression down to ambient pressure (Figures SI-2 and SI-3), with the purpose of determining the equation of state of the material and exploring the existence of a phase transition to the predicted higher-pressure polymorphs.21,22 The peaks were fitted through the explored pressure range, and the lattice parameters and unit cell volume were derived from the orthorhombic geometrical relations. The values of the unit cell volumes as a function of pressure are plotted in Figure 7, where the full circles refer to data acquired during compression and empty circles refer to data acquired during decompression. The data were fitted using third-order Birch–Murnaghan- and Vinet-type equations of state (EOS). In all cases, the fits are very good and the obtained values of the bulk modulus (B0), its first derivative (B0′), and the unit cell volume at ambient pressure (V0) are consistent within the uncertainty (Figure SI-4). In particular, the V0 values obtained from the fit and measured at ambient pressure are in excellent agreement with the experimental value reported by Landkskron et al.30 Furthermore, our experimental B0 value (116 ± 3 GPa, see also Figure SI-4) perfectly matches the bulk modulus value obtained by DFT calculations using the LDA approximation (B0 = 116 GPa).21 The B0′ value (6.6 ± 0.3, see also Figure SI-4), while still being in good agreement, is instead slightly higher than the values predicted by computational studies.21,22 The discrepancy with the experimental B0 and B0′ values reported by Niwa et al.27 (B0 = 130.27 GPa, B0′ = 4 fixed value) is due to the fact that, whereas the XRD data by Niwa et al. contain only seven experimental data points in the 0–18 GPa pressure interval and a single additional calculated point at 50 GPa, our experimental data continuously cover the pressure range between 0 and 32.6 GPa, providing a significantly higher data sampling in terms of pressure resolution and consequently allowing the determination of the first derivative of the bulk modulus from the fitting procedure using a third-order Birch–Murnaghan equation. No hints of an additional phase transition is observed by XRD in this pressure range, in contrast to the predictions of DFT calculations based on the LDA approximation, which suggest the occurrence of the γ-P3N5 to δ-P3N5 phase transition above 25 GPa.21
Figure 7.

Pressure evolution of the unit cell volume of γ-P3N5 (Imm2) at room temperature. The solid circles refer to data acquired during the compression, and the empty circles refer to data acquired during the decompression. The data have been fitted according to the third-order Birch–Murnaghan equation of state (BM3).
Another interesting piece of information emerging from our data concerns the anisotropic compressibility of γ-P3N5. As a matter of fact, the pressure evolution of the lattice parameters indicates that the compressibility of γ-P3N5 is significantly larger along the a and c directions than along the b direction, along which γ-P3N5 appears to be almost incompressible (Figure 8). This occurrence is consistent with the chemical bonding network of the material, which features channel-like cavities along the b direction, having a transverse bean-shaped section in the ac plane of relatively large diameter (Figure 8, right top panel).
Figure 8.

(Left panel) Pressure evolution of a, b, and c lattice parameters of the unit cell of γ-P3N5. (Right panels) Views of the γ-P3N5 structure along the b (top) and c (bottom) crystalline directions. (Lower panel) Room-temperature pressure evolution of the relative values of the a, b, and c lattice parameters and volume V of the γ-P3N5 unit cell with respect to their ambient pressure values (a0, b0, c0, and V0). The x/x0 label of the y axis indicates a/a0, b/b0, c/c0, and V/V0.
Indeed, along the a and c directions the PN4 tetrahedra and the PN5 square pyramids are connected through one corner by one bridging N atom. The increase in density is thus accordingly expected to compress and distort the bean-shaped cavity in the ac plane.
Along the b direction, instead, the PN5 square pyramids are connected by one edge through two shared N atoms. The compression is thus prevented by strong directional chemical bonds, which make the material stiffer along this direction. The observed anisotropic compressibility of γ-P3N5 is in agreement with previous calculations21 and clearly emerges from the pressure evolution of the relative values of a, b, and c with respect to their ambient pressure values (Figure 8 lower panel). Also in this case the comparison with recent experimental data27 highlights the higher experimentally investigated pressure range and the higher number of pressure points in our data.
Concerning α-P3N5, the pressure variation of the c parameter, despite some data scattering, exhibits a clear monotonous decrease with pressure on compression at up to ∼20 GPa. No determination of the c parameter was possible above this pressure. On the other hand, the pressure dependence of the b parameter is monotonous up to the highest investigated pressure of 32.6 GPa (Figure 9). Whereas for γ-P3N5 the a, b, and c lattice parameters could be determined as a function of pressure and the equation of state could be derived, for α-P3N5 only the pressure evolution of the b parameters could be determined up to the highest investigated pressure (Section SI-1, Figure SI-5).
Figure 9.

Room-temperature pressure evolution of the experimental c (red up triangles) and b (blue open circles) lattice parameters of α-P3N5. The filled symbols at ambient pressure are from ref (47).
The identification of the b lattice parameter at up to 32.6 GPa indicates that α-P3N5, once formed at 9.1 GPa and high temperature, remains metastable at room temperature up to this pressure, well beyond the predicted phase transition to γ-P3N5, located by different static calculations (0 K, zero-point contributions neglected) at ∼2.2 GPa (LDA) and 6.5 GPa (GGA).21,22 To the best of our knowledge, the pressure of 32.6 GPa observed here actually represents the highest experimental pressure at which α-P3N5 was reported to exist.47 Our own calculated pressure and temperature conditions for the α-P3N5/γ-P3N5 phase equilibria can be expressed in terms of the Clapeyron equation as follows: Pt = 5.1 + 0.00162T, where Pt is the transition pressure in GPa and T is the temperature in K. We obtain a positive slope for the α-P3N5 to γ-P3N5 transformation, as expected for a transition toward a denser and more ordered structure with lower entropy upon compression (Figure SI-6). In fact, the transition evolves from a monoclinic (Z = 4) to a higher-symmetric orthorhombic (Z = 2) unit cell with fewer degrees of freedom. The existence of a kinetic barrier, which is inherent to reconstructive transitions that retain the high-pressure phase under room conditions after decompression, hinders this transformation from being observed below 9.1 GPa if the temperature is not high enough.53 At this pressure, because of the positive Clapeyron slope, the calculated equation predicts the transformation at a temperature of as high as 2500 K, which is in agreement with our observations. Both factors explain the metastability of α-P3N5 emerging from our experiments and support the conclusion that α-P3N5, forming in the outer region of the laser-heated areas at 9.1 GPa likely experiences insufficiently high temperature for the transition to the stable γ-P3N5 structure to occur at this pressure.
Raman
The synthesized sample was also studied with Raman spectroscopy at LENS. As in the case of XRD, after laser heating we performed a Raman mapping (15 × 15 grid, 10 μm spacing) of the reaction product in the 200–1200 cm–1 frequency region at 3.6 GPa and ambient pressure. The Raman mapping of the sample at 3.6 GPa is shown in Figure 10, where the colors of the spectra correspond to the colors of the points in the map. No contributions from the low-frequency phonon modes of N2 are expected in this frequency range at this pressure (Figure SI-9).54
Figure 10.

Raman spectra (left) acquired in the 200–1200 cm–1 frequency region during the mapping indicated by the red grid superimposed on the sample image (right). The colors of the spectra correspond to the colors of the points in the grid map: blue , γ-P3N5; green, P(A7); red, mixture of γ-P3N5 and P(A7); orange, P(A7) and α-P3N5. The purple spectrum refers to partially crystalline α-P3N5 at ambient pressure taken from ref (55). The XRD pattern related to the detector image in Figure 3B, acquired at the sample position b of Figure 3C, corresponds to one of the orange spectra in the Raman grid, where α-P3N5 was detected by XRD.
The outcome of the Raman mapping is consistent with the X-ray data and indicates that, besides the ubiquitous presence of unreacted excess N2, revealed by the characteristic stretching band at 2341.5 cm–1 (N≡N), the spectra acquired outside the laser-heated area (green trace and green points in the grid of Figure 10) contain only rhombohedral P (A7), which is metastable at this pressure because of the hysteresis of the phase transition to the orthorhombic A17 structure.14,56 The spectra acquired inside the LH area (blue trace and blue points in the grid of Figure 10) instead contain new different sharp vibrational bands corresponding to γ-P3N5. These bands can also be observed on the recovered product under ambient conditions (black trace in Figure 10), and their frequencies correspond to those calculated by Kroll et al. for γ-P3N5.21
In the outer regions of the laser-heated area, an intermediate scenario occurs where both rhombohedral A7 P and γ-P3N5 are present. No clear spectroscopic evidence of α-P3N5 is instead observed in the sample regions where XRD suggests its presence, as indicated by the comparison between the Raman spectrum of the reaction product acquired in the sample position corresponding to the XRD pattern in Figure 3B (sample position b in Figure 3C) and the Raman spectrum of partially crystalline and amorphous α-P3N5 (Figure 10). This apparent inconsistency is, however, not surprising because the efficiency of Raman spectroscopy is drastically reduced when probing the inner parts of opaque samples, such as P or P3N5, compared to their surfaces, whereas XRD provides information on their bulk structure. In the outer regions of the laser-heated area, the laser intensity is lower because of the energy distribution of the beam profile. Accordingly, the temperature generated in these regions is expected to be lower than in the center of the laser-heated area. Furthermore, because the laser was focused on the sample based on the optical image of the sample surface, the surface of the sample may have experienced a higher temperature with respect to its interior. As a consequence, considering that α-P3N5 is known to convert to γ-P3N5 under sufficiently high pressure and temperature conditions,30 it is not unlikely that α-P3N5 may have formed only in the inner part of the sample in the peripheral regions of the laser-heated area, hence not being detectable in the Raman spectrum acquired in the sample positions where XRD revealed its presence. Nevertheless, comparing the Raman spectrum of partially crystalline α-P3N5 at ambient pressure with the Raman spectrum acquired in the grid positions corresponding to Figure 3B, it emerges that, whereas in the first one an intense band is present at 353 cm–1 and a structure consisting of four resolved peaks extends between 421 and 506 cm–1, in the second one a weak shoulder at 375 cm–1 (on the low-frequency side of the broad band belonging to rhombohedral A7 P at 403 cm–1) and a broad feature centered at 490 cm–1 can be appreciated. The band at 375 cm–1 and the broad feature centered at 490 cm–1 appear to be high-frequency shifted by 22 and 26.5 cm–1, respectively, compared to the Raman band at 353 cm–1 and to the center of the four-peak structure (463.5 cm–1) observed in the spectrum of partially crystalline α-P3N5 at ambient pressure. Considering the structural disorder observed in the XRD pattern shown in Figure 3B (acquired at sample position b in Figure 3C) and the pressure-broadening effect, a merging of the four bands observed between 421 and 506 cm–1 in the Raman spectrum of α-P3N5 (orange trace in Figure 10) could result in the observed Raman spectrum.
Raman spectra were acquired as a function of pressure to gain insight into the vibrational properties of γ-P3N5 during room-temperature compression from 3.6 up to 45.5 GPa and further decompression under ambient conditions (Figures 11 and SI-7). The observed Raman frequencies were determined by fitting the spectrum with Voigt peak profiles and assigned to the corresponding vibrational modes by performing DFT calculations on γ-P3N5 at up to 102.6 GPa and by comparing the experimental frequency values with the calculated ones (Figures SI-8 and SI-9), considering the similar frequency evolution with pressure. A systematically slightly lower value is observed for the calculated frequencies with respect to the experimentally observed ones (Figure SI-9). Details of the frequency evolution with pressure are provided in Figures 12, where three different spectral windows (250–430, 400–800, and 680–1380 cm–1) spanning the entire investigated frequency range are shown (Figure SI-9). Any contribution of the N2 lattice modes to the fit of the experimental frequencies in the 220–430 frequency range has been checked and confidently excluded because the slope of the phonon frequencies across the crystalline structures of molecular N2 is markedly higher than the slope of the γ-P3N5 vibrational frequencies (Figure SI-9).54
Figure 11.

Raman spectra of γ-P3N5 acquired in the 200–1200 cm–1 frequency region during room-temperature compression from 3.6 up to 45.5 GPa.
Figure 12.

Experimental and calculated vibrational Raman frequencies of γ-P3N5. The experimental data are plotted as points, whereas the calculated frequencies of the 21 optical normal modes are plotted as lines and identified by the corresponding number of the mode-symmetry label. Among the experimental points, the solid symbols were acquired on compression and the empty symbols were acquired on decompression. The experimental and calculated data corresponding to the same normal mode are plotted with the same color when the assignment is clear. To facilitate the presentation, the data are divided into three frequency regions: (a) 250–430, (b) 400–800, and (c) 680–1380 cm–1.
According to the factor group analysis, because of the presence of one P3N5 formula unit in the primitive cell, no Davydov crystal field splitting is expected in the Imm2 unit cell and the irreducible representations of the 21 optical normal vibrational modes associated with the P3N5 unit are 7A1, 3A2, 4B1, and 7B2. Within the numbering adopted in this article, modes 1–3 correspond to acoustic modes and modes 4–24 correspond to optical modes. Optical modes 4–7 are associated with polyhedral rotations, modes 8–19 correspond to bending modes, and modes 20–23 correspond to P–N stretching modes, whereas mode 24 is a bending mode involving free tetrahedral N atoms (Figure 13).
Figure 13.

Calculated optical vibrational modes of γ-P3N5 (i = 4–24) identified by the corresponding vibrational frequency (νi) at 0 GPa and static conditions (0 K and zero-point contributions neglected). The PN5 square pyramids are highlighted in blue, and the PN4 tetrahedra are highlighted in magenta. The direction and intensity of the atomic displacements are indicated by the red arrows. Each column lists the modes belonging to the same symmetry (left to right: A1, A2, B1, and B2).
Except for a slight underestimation, the calculated Raman frequencies are in substantial agreement with the experimental ones.
Within the set of 21 expected frequencies associated with the optically active Raman modes, ν12(A2), ν15(B2), ν17(B1), ν18(A2), ν20(B2), ν23(B2), and ν24(B1) could not be appreciated in the experimental spectra, likely because of their low intensity, pressure broadening, and frequency overlap with other bands. The experimental frequencies assigned to the calculated ν4(A1) and ν6(B2) vibrational modes exhibit a second component appearing as weak shoulders during compression at 18 and 30 GPa and disappearing on decompression at 23 and 32 GPa, respectively. A weaker component also accompanies the experimental frequency assigned to the calculated ν9(B2) mode across the whole pressure range during compression and decompression. The experimental frequencies corresponding to the calculated ν5(B1) and ν21(A1) modes become observable during compression at 23 and 27 GPa and are detected on decompression until 21 GPa and ambient pressure, respectively. Considering the small frequency difference with respect to the main component and the absence of Davydov crystal field splitting, the weak shoulders observed for the ν4(A1), ν6(B2), and ν9(B2) experimental frequencies are likely related to the occurrence of LO–TO splitting.
Whereas most of the Raman bands exhibit similar behavior with increasing frequency on compression and decreasing frequency on decompression, three of them show a characteristic evolution. In particular, the frequency of the ν9(B2) mode (Figure 12b and Figure SI-9), initially increasing with pressure, reaches a maximum at 16.7 GPa and then starts to decrease up to the highest investigated pressure of 45.5 GPa. Like the other B2 modes, ν9 involves the rotation of the polyhedra in the ac plane, but this particular mode has the largest amplitude of motion for the N atoms belonging to the PN4 units. The nonmonotonic evolution with pressure of the ν9(B2) frequency indicates a softening of the mode above 16.7 GPa, likely related to the deformation of the cavity in the ac plane. This occurrence is consistent with the evolution with pressure of the calculated value of the P1–N2–P2 angle, showing a maximum (131.4°) at 25 GPa, indicating that this vibrational mode becomes stiffer for larger angle values (Figure 14).
Figure 14.

Calculated evolution with pressure of distances and angles in γ-P3N5. As shown in the upper image, P1 corresponds to the PN4 tetrahedra, whereas P2 corresponds to square-pyramidal PN5. Subscripts ap and eq in the atom labels of the legend indicate apical and equatorial postions, respectively, of the N3 atoms in the square-pyramid polyhedra.
The calculated frequency of the ν24(B1) mode (Figure 12c and Figure SI-9), not observed experimentally, increases much less than all of the other frequencies, with only a 25 cm–1 high-frequency shift (from 1150 to 1175 cm–1) in the 0–45 GPa pressure range. ν24 mostly involves the displacement of the P and N atoms along the b direction, with the largest amplitude of motion for the N atoms forming the PN4 tetrahedra in the center of the cavity, which are likely less affected by the compression.
Finally, the ν4(A1) frequency exhibits the highest increase with pressure among all of the other modes, crossing the pressure evolution of the vibrational frequency corresponding to ν6(B2) at ∼10.5 GPa (Figure 12a and Figure SI-9). ν4 involves out-of-phase motion of the PN4 tetrahedra and PN5 square pyramids, leading to the displacement of the PN4 units toward the center of the cavity, which is likely expected to become harder with pressure as a result of the shrinkage of the cavity in the ac plane. The frequency of ν4 is indeed observed to cross those of ν6(B2) and ν7(A2) at 10.5 GPa. The behavior of the ν4 frequency with pressure is mirrored by the evolution of the N2–P1–N2 angle, which exhibits the largest variation with pressure among the other angles, decreasing by 11.8° from ambient pressure to 100 GPa (Figure 14). The compression of γ-P3N5 appears to occur mainly through the rotation of the PN5 square pyramids (P2–N3–P2 angle) and the deformation of the PN4 tetrahedra (N2–P1–N2 angle) (Figure 14).
These observations are in agreement with the anisotropic compressibility of the γ-P3N5 unit cell emerging from the pressure evolution of the lattice parameters (Figures 8), consistently with the observation that along the b direction the PN5 square pyramids interact through two shared edges with two strong directional covalent bonds on opposite sides, whereas in the ac plane the PN4 tetrahedra and the PN5 square pyramids are connected only through vertices. The atomic displacements occurring during compression can also be appreciated by comparing the experimental structures derived from XRD at ambient pressure47 and at 9.1 GPa (Figure 5).
Denser, Higher P Coordination Polymorphs
Phosphorus nitride polymorphs containing PN6 octahedral units, hence featuring higher octahedral P coordination by the N atoms with respect to α-P3N5 and γ-P3N5, have been predicted by calculations to exist on further compression. Among them, the kyanite type δ-P3N521 and the V3O5-like P3N522 structures maintain the P3N5 stoichiometry of the two experimentally synthesized lower-pressure polymorphs. PN6 octahedra have been predicted by calculations to exist at high pressure also for other compositional spaces of the P/N system,23 but they have been experimentally observed recently only in ternary β-BP3N624 and BeP2N4,57 where B and Be, respectively, are also present.
No phase transition from γ-P3N5 to another structure was observed up to the highest investigated pressure in our experiments (XRD 32.6 GPa, Raman 45.5 GPa), with no discontinuities in the pressure evolution of the unit cell and lattice parameters obtained from XRD or in the pressure evolution of the Raman frequencies. Consistently, no band splitting was observed in the Raman spectra, and the appearance of a new Raman band during compression is interpreted with an intensity gain of expected bands rather than with the activation of new components. A possible structural path toward the formation of PN6 octahedra in the γ-P3N5 structure, involving the reciprocal approach of one of the N atoms (N1) at the vertex of a PN4 tetrahedron to the P atom (P2) at the base of a PN5 square pyramid and likely proceeding through the interaction of the N1 electron lone pair with the P2 atom, can be excluded in the investigated pressure range. Our calculations indicate that the distance between the P1 and N2 atoms remains significantly higher than the typical bonding distances between P and N atoms even at 100 GPa (Figure 14). This is particularly true in the pressure range where the γ-P3N5 to δ-P3N5 and the γ-P3N5 to V3O5-like P3N5 phase transitions have been predicted to occur by Kroll et al. (43 GPa using GGA and 28 GPa using LDA approximations)21 and by Dong et al. (35.5 GPa), respectively.22 Our findings are in agreement with the observation by Niwa et al.27 in the corresponding pressure range.
Conclusions
Using LH in DAC, we successfully induced direct chemical reactivity between P and N under high-pressure and high-temperature conditions. The results presented in this study provide relevant insights about the synthesis of α-P3N5 and γ-P3N5 from the elements and their characterization at high pressure.
First, the identification of defined threshold values of pressure (9.1 GPa) and temperature (2000–2500 K), for the reaction to occur, indicates that chemical reactivity between the two lowest-Z pnictogens likely takes place in the liquid phase. This occurrence highlights the stability of the A7 layered structure of P at high temperature and suggests the P reactivity to benefit from the lower kinetic barrier as a result of the higher mobility of the atoms in the liquid phase of P.
Second, the reaction proceeds with the complete consumption of P, essentially leading to the formation of polycrystalline γ-P3N5 in the center of the laser-heated area and of metastable α-P3N5 in the outer portion of the laser-heated area. To the best of our knowledge, the formation of α-P3N5 from the elements has never been reported before because α-P3N5 is reported in the literature to be obtained only when starting from suitable precursors.47,48
Third, the detection of α-P3N5, in the outer regions of the laser-heated area, where the temperature during laser heating is expected to be lower, suggests the formation of α-P3N5 to be a preliminary step toward the synthesis of γ-P3N5, supporting the finding of Landskron et al. in agreement with the pressure-coordination rule.30 The b and c lattice parameters of α-P3N5 could be observed on compression by XRD diffraction up to 32.6 GPa and ∼20 GPa, respectively.
Fourth, γ-P3N5 was further characterized by synchrotron XRD diffraction, Raman spectroscopy, and DFT calculations, precisely determining the EOS and correlating the pressure effect on the structural parameters to that on the vibrational lattice dynamics. The experimental XRD and Raman data, supported by the calculated atomic distances and bond angles, indicate that the compression of γ-P3N5 essentially proceeds through the rotation of the PN5 square pyramids and the distortion of the PN4 tetrahedra.
Finally, no phase transition of γ-P3N5 to a structure with higher P coordination by the N atoms was observed in our experiments (up to 45.5 GPa), excluding the pressure-induced approach of N1 to P2 as a potential driving structural path toward the obtainment of PN6 octahedra.
Acknowledgments
Thanks are expressed to EC through the European Research Council (ERC) for funding the project PHOSFUN “Phosphorene functionalization: a new platform for advanced multifunctional materials” (grant agreement no. 670173) through an ERC Advanced Grant. This study was supported by the Deep Carbon Observatory (DCO) initiative under the project Physics and Chemistry of Carbon at Extreme Conditions, by the project “GreenPhos - alta pressione”, by the Italian Ministero dell’Università e della Ricerca (MUR) under the project PRIN 2017 KFY7XF FERMAT “FastElectRon dynamics in novel hybrid-2D MATerials”, and by Fondazione Cassa di Risparmio di Firenze under the project HP-PHOTOCHEM. The authors acknowledge the European Synchrotron Radiation Facility (ESRF) for the provision of synchrotron radiation facilities and thank V. Svitlyk, G. Garbarino, and M. Mezouar for assistance in using beamline ID27. J.M.R. acknowledges financial support from the Spanish National Research Agency (AEI) under projects PGC18-094814-B-C22 and RED2018-102612-T and from Principado de Asturias (FICYT) and FEDER under project AYUD/2021/51036. F.I.-R. thanks the Government of Principado de Asturias for its FICYT grant (no. AYUD/2021/58773).
Supporting Information Available
The Supporting Information is available free of charge at https://pubs.acs.org/doi/10.1021/acs.inorgchem.2c01190.
The authors declare no competing financial interest.
Supplementary Material
References
- Corbridge D.Phosphorus: Chemistry, Biochemistry and Technology, 6th ed.; Taylor & Francis, 2013. [Google Scholar]
- Scherer O. J. Phosphorus Nitrides—the Cinderella of Phosphorus Chemistry?. Angew. Chem., Int. Ed. 1992, 31, 170–171. 10.1002/anie.199201701. [DOI] [Google Scholar]
- Wendl S.; Mardazad S.; Strobel P.; Schmidt P. J.; Schnick W. HIP to be Square: Simplifying Nitridophosphate Synthesis in a Hot Isostatic Press. Angew. Chem., Int. Ed. 2020, 59, 18240–18243. 10.1002/anie.202008570. [DOI] [PMC free article] [PubMed] [Google Scholar]
- Borisov E. V.; Nifant’ev E. E. Nifant’ev, E. E. Phosphorus Nitrides. Russ. Chem. Rev. 1977, 46, 842. 10.1070/RC1977v046n09ABEH002176. [DOI] [Google Scholar]
- Vepřek S.; Iqbal Z.; Brunner J.; Schärli M. Preparation and properties of amorphous phosphorus nitride prepared in a low-pressure plasma. Philosophical Magazine B 1981, 43, 527–547. 10.1080/01418638108222114. [DOI] [Google Scholar]
- Scelta D.; Baldassarre A.; Serrano-Ruiz M.; Dziubek K.; Cairns A. B.; Peruzzini M.; Bini R.; Ceppatelli M. Interlayer Bond Formation in Black Phosphorus at High Pressure. Angew. Chem., Int. Ed. 2017, 56, 14135–14140. 10.1002/anie.201708368. [DOI] [PMC free article] [PubMed] [Google Scholar]
- Scelta D.; Baldassarre A.; Serrano-Ruiz M.; Dziubek K.; Cairns A. B.; Peruzzini M.; Bini R.; Ceppatelli M. The p-sc structure in phosphorus: bringing order to the high pressure phases of group 15 elements. Chem. Commun. 2018, 54, 10554–10557. 10.1039/C8CC03013H. [DOI] [PMC free article] [PubMed] [Google Scholar]
- Laniel D.; Winkler B.; Fedotenko T.; Pakhomova A.; Chariton S.; Milman V.; Prakapenka V.; Dubrovinsky L.; Dubrovinskaia N. High-Pressure Polymeric Nitrogen Allotrope with the Black Phosphorus Structure. Phys. Rev. Lett. 2020, 124, 216001. 10.1103/PhysRevLett.124.216001. [DOI] [PubMed] [Google Scholar]
- Ji C.; Adeleke A. A.; Yang L.; Wan B.; Gou H.; Yao Y.; Li B.; Meng Y.; Smith J. S.; Prakapenka V. B.; Liu W.; Shen G.; Mao W. L.; Mao H.-k. Nitrogen in black phosphorus structure. Sci. Adv. 2020, 6, eaba9206. 10.1126/sciadv.aba9206. [DOI] [PMC free article] [PubMed] [Google Scholar]
- Bridgman P. W. Two new modifications of Phosphorus. J. Am. Chem. Soc. 1914, 36, 1344–1363. 10.1021/ja02184a002. [DOI] [Google Scholar]
- Carvalho A.; Wang M.; Zhu X.; Rodin A. S.; Su H.; Castro Neto A. H. Phosphorene: from theory to applications. Nat. Rev. Mater. 2016, 1, 16061. 10.1038/natrevmats.2016.61. [DOI] [Google Scholar]
- Peruzzini M.; Bini R.; Bolognesi M.; Caporali M.; Ceppatelli M.; Cicogna F.; Coiai S.; Heun S.; Ienco A.; Benito I. I.; Kumar A.; Manca G.; Passaglia E.; Scelta D.; Serrano-Ruiz M.; Telesio F.; Toffanin S.; Vanni M. A Perspective on Recent Advances in Phosphorene Functionalization and Its Applications in Devices. Eur. J. Inorg. Chem. 2019, 2019, 1476–1494. 10.1002/ejic.201801219. [DOI] [PMC free article] [PubMed] [Google Scholar]
- Sugimoto T.; Akahama Y.; Fujihisa H.; Ozawa Y.; Fukui H.; Hirao N.; Ohishi Y. Identification of superlattice structure cI16 in the P-VI phase of phosphorus at 340 GPa and room temperature via x-ray diffraction. Phys. Rev. B 2012, 86, 024109. 10.1103/PhysRevB.86.024109. [DOI] [Google Scholar]
- Kikegawa T.; Iwasaki H.; Fujimura T.; Endo S.; Akahama Y.; Akai T.; Shimomura O.; Yagi T.; Akimoto S.; Shirotani I. Synchrotron-radiation study of phase transitions in phosphorus at high pressures and temperatures. J. Appl. Crystallogr. 1987, 20, 406–410. 10.1107/S0021889887086394. [DOI] [Google Scholar]
- Goncharov A. F.; Gregoryanz E.; Mao H.-k.; Liu Z.; Hemley R. J. Optical Evidence for a Nonmolecular Phase of Nitrogen above 150 GPa. Phys. Rev. Lett. 2000, 85, 1262–1265. 10.1103/PhysRevLett.85.1262. [DOI] [PubMed] [Google Scholar]
- Gregoryanz E.; Goncharov A. F.; Sanloup C.; Somayazulu M.; Mao H.-k.; Hemley R. J. High P-T transformations of nitrogen to 170 GPa. J. Chem. Phys. 2007, 126, 184505. 10.1063/1.2723069. [DOI] [PubMed] [Google Scholar]
- Eremets M. I.; Gavriliuk A. G.; Trojan I. A.; Dzivenko D. A.; Boehler R. Single-bonded cubic form of nitrogen. Nat. Mater. 2004, 3, 558–563. 10.1038/nmat1146. [DOI] [PubMed] [Google Scholar]
- Tomasino D.; Jenei Z.; Evans W.; Yoo C.-S. Melting and phase transitions of nitrogen under high pressures and temperatures. J. Chem. Phys. 2014, 140, 244510. 10.1063/1.4885724. [DOI] [PubMed] [Google Scholar]
- Laniel D.; Geneste G.; Weck G.; Mezouar M.; Loubeyre P. Hexagonal Layered Polymeric Nitrogen Phase Synthesized near 250 GPa. Phys. Rev. Lett. 2019, 122, 066001. 10.1103/PhysRevLett.122.066001. [DOI] [PubMed] [Google Scholar]
- Zhao L.; Yi W.; Botana J.; Gu F.; Miao M. Nitrophosphorene: A 2D Semiconductor with Both Large Direct Gap and Superior Mobility. J. Phys. Chem. C 2017, 121, 28520–28526. 10.1021/acs.jpcc.7b09650. [DOI] [Google Scholar]
- Kroll P.; Schnick W. Density Functional Study of Phosphorus Nitride P3N5: Refined Geometries, Properties, and Relative Stability of α-P3N5 and γ-P3N5 and a Further Possible High-Pressure Phase δ-P3N5 with Kyanite-Type Structure. Chem.—Eur. J. 2002, 8, 3530–3537. 10.1002/1521-3765(20020802)8:15<3530::AID-CHEM3530>3.0.CO;2-6. [DOI] [PubMed] [Google Scholar]
- Dong J.; Kinkhabwala A. A.; McMillan P. F. High-pressure polymorphism in phosphorus nitrides. Phys. Status Solidi B 2004, 241, 2319–2325. 10.1002/pssb.200404937. [DOI] [Google Scholar]
- Raza Z.; Errea I.; Oganov A. R.; Saitta A. M. Novel superconducting skutterudite-type phosphorus nitride at high pressure from first-principles calculations. Sci. Rep. 2014, 4, 5889. 10.1038/srep05889. [DOI] [PMC free article] [PubMed] [Google Scholar]
- Vogel S.; Bykov M.; Bykova E.; Wendl S.; Kloß S. D.; Pakhomova A.; Chariton S.; Koemets E.; Dubrovinskaia N.; Dubrovinsky L.; Schnick W. Boron Phosphorus Nitride at Extremes: PN6 Octahedra in the High-Pressure Polymorph β-BP3N6. Angew. Chem., Int. Ed. 2019, 58, 9060–9063. 10.1002/anie.201902845. [DOI] [PubMed] [Google Scholar]
- Ceppatelli M.; Scelta D.; Serrano-Ruiz M.; Dziubek K.; Garbarino G.; Jacobs J.; Mezouar M.; Bini R.; Peruzzini M. High pressure synthesis of phosphine from the elements and the discovery of the missing (PH3)2H2 tile. Nat. Commun. 2020, 11, 6125. 10.1038/s41467-020-19745-2. [DOI] [PMC free article] [PubMed] [Google Scholar]
- Ceppatelli M.; Scelta D.; Serrano-Ruiz M.; Dziubek K.; Morana M.; Svitlyk V.; Garbarino G.; Poreba T.; Mezouar M.; Peruzzini M.; Bini R. Single-Bonded Cubic AsN from High-Pressure and High-Temperature Chemical Reactivity of Arsenic and Nitrogen. Angew. Chem., Int. Ed. 2022, 61, e202114191. 10.1002/anie.202114191. [DOI] [PMC free article] [PubMed] [Google Scholar]
- Niwa K.; Iijima Y.; Ukita M.; Toda R.; Toyoura K.; Sasaki T.; Matsunaga K.; Gaida N. A.; Hasegawa M. Nitriding synthesis and structural change of phosphorus nitrides at high pressures. J. Raman Spectrosc. 2021, 52, 1064–1072. 10.1002/jrs.6079. [DOI] [Google Scholar]
- Ceppatelli M.; Scelta D.; Serrano-Ruiz M.; Garbarino G.; Peruzzini M.; Bini R.. High pressure and high temperature chemistry of the lowest Z pnictogens: Phosphorus and nitrogen. 56th European High Pressure Research Group Meeting; Sept 2–7, 2018, Aveiro, Portugal.
- Ceppatelli M.; Scelta D.; Serrano-Ruiz M.; Garbarino G.; Peruzzini M.; Bini R.. High pressure and high temperature chemical reactivity of black Phosphorus and Nitrogen. IUCr (International Union of Crystallography) & ECA (European Crystallogrphic Association) High-Pressure Workshop, Aug 13–17, 2019, Wien, Austria.
- Landskron K.; Huppertz H.; Senker J.; Schnick W. High-Pressure Synthesis of γ-P3N5 at 11 GPa and 1500 °C in a Multianvil Assembly: A Binary Phosphorus (V) Nitride with a Three-Dimensional Network Structure from PN4 Tetrahedra and Tetragonal Pyramids. Angew. Chem., Int. Ed. 2001, 40, 2643–2645. 10.1002/1521-3773(20010716)40:14<2643::AID-ANIE2643>3.0.CO;2-T. [DOI] [PubMed] [Google Scholar]
- Tolhurst T. M.; Braun C.; Boyko T. D.; Schnick W.; Moewes A. Experiment-Driven Modeling of Crystalline Phosphorus Nitride P3N5: Wide-Ranging Implications from a Unique Structure. Chem.—Eur. J. 2016, 22, 10475–10483. 10.1002/chem.201601149. [DOI] [PubMed] [Google Scholar]
- Nilges T.; Kersting M.; Pfeifer T. A fast low-pressure transport route to large black phosphorus single crystals. J. Solid State Chem. 2008, 181, 1707–1711. 10.1016/j.jssc.2008.03.008. [DOI] [Google Scholar]
- Prescher C.; Prakapenka V. B. DIOPTAS: a program for reduction of two-dimensional X-ray diffraction data and data exploration. High Press. Res. 2015, 35, 223–230. 10.1080/08957959.2015.1059835. [DOI] [Google Scholar]
- Holland T. J. B.; Redfern S. A. T. Unit cell refinement from powder diffraction data: the use of regression diagnostics. Mineral. Mag. 1997, 61, 65–77. 10.1180/minmag.1997.061.404.07. [DOI] [Google Scholar]
- Wojdyr M. Fityk: a general-purpose peak fitting program. J. Appl. Crystallogr. 2010, 43, 1126–1128. 10.1107/S0021889810030499. [DOI] [Google Scholar]
- Ceppatelli M.; Gorelli F. A.; Haines J.; Santoro M.; Bini R. Probing High-Pressure Reactions in Heterogeneous Materials by Raman Spectroscopy. Z. Krist.-Cryst. Mater. 2014, 229, 83–91. 10.1515/zkri-2013-1627. [DOI] [Google Scholar]
- Perdew J. P.; Burke K.; Ernzerhof M. Generalized Gradient Approximation Made Simple. Phys. Rev. Lett. 1996, 77, 3865–3868. 10.1103/PhysRevLett.77.3865. [DOI] [PubMed] [Google Scholar]
- Giannozzi P.; Baroni S.; Bonini N.; Calandra M.; Car R.; Cavazzoni C.; Ceresoli D.; Chiarotti G. L.; Cococcioni M.; Dabo I.; Corso A. D.; de Gironcoli S.; Fabris S.; Fratesi G.; Gebauer R.; Gerstmann U.; Gougoussis C.; Kokalj A.; Lazzeri M.; Martin-Samos L.; Marzari N.; Mauri F.; Mazzarello R.; Paolini S.; Pasquarello A.; Paulatto L.; Sbraccia C.; Scandolo S.; Sclauzero G.; Seitsonen A. P.; Smogunov A.; Umari P.; Wentzcovitch R. M. QUANTUM ESPRESSO: a modular and open-source software project for quantum simulations of materials. J. Phys.: Condens. Matter 2009, 21, 395502. 10.1088/0953-8984/21/39/395502. [DOI] [PubMed] [Google Scholar]
- Blöchl P. E. Projector augmented-wave method. Phys. Rev. B 1994, 50, 17953–17979. 10.1103/PhysRevB.50.17953. [DOI] [PubMed] [Google Scholar]
- Dal Corso A. Pseudopotentials periodic table: From H to Pu. Comput. Mater. Sci. 2014, 95, 337–350. 10.1016/j.commatsci.2014.07.043. [DOI] [Google Scholar]
- Otero-de-la-Roza A.; Abbasi-Perez D.; Luana V. Gibbs2: A new version of the quasiharmonic model code. II. Models for solid-state thermodynamics, features and implementation. Comput. Phys. Commun. 2011, 182, 2232–2248. 10.1016/j.cpc.2011.05.009. [DOI] [Google Scholar]
- Baroni S.; de Gironcoli S.; Dal Corso A.; Giannozzi P. Phonons and related crystal properties from density-functional perturbation theory. Rev. Mod. Phys. 2001, 73, 515–562. 10.1103/RevModPhys.73.515. [DOI] [Google Scholar]
- Akahama Y.; Utsumi W.; Endo S.; Kikegawa T.; Iwasaki H.; Shimomura O.; Yagi T.; Akimoto S. Melting curve of black phosphorous. Phys. Lett. A 1987, 122, 129–131. 10.1016/0375-9601(87)90790-0. [DOI] [Google Scholar]
- Zinn A. S.; Schiferl D.; Nicol M. F. Raman spectroscopy and melting of nitrogen between 290 and 900 K and 2.3 and 18 GPa. J. Chem. Phys. 1987, 87, 1267–1271. 10.1063/1.453310. [DOI] [Google Scholar]
- Weck G.; Datchi F.; Garbarino G.; Ninet S.; Queyroux J.-A.; Plisson T.; Mezouar M.; Loubeyre P. Melting Curve and Liquid Structure of Nitrogen Probed by X-ray Diffraction to 120 GPa. Phys. Rev. Lett. 2017, 119, 235701. 10.1103/PhysRevLett.119.235701. [DOI] [PubMed] [Google Scholar]
- Tassini L.; Gorelli F.; Ulivi L. High temperature structures and orientational disorder in compressed solid nitrogen. J. Chem. Phys. 2005, 122, 074701. 10.1063/1.1849154. [DOI] [PubMed] [Google Scholar]
- Horstmann S.; Irran E.; Schnick W. Synthesis and Crystal Structure of Phosphorus(V) Nitride α-P3N5. Angew. Chem., Int. Ed. 1997, 36, 1873–1875. 10.1002/anie.199718731. [DOI] [Google Scholar]
- Schnick W.; Lücke J.; Krumeich F. Phosphorus Nitride P3N5: Synthesis, Spectroscopic, and Electron Microscopic Investigations. Chem. Mater. 1996, 8, 281–286. 10.1021/cm950385y. [DOI] [Google Scholar]
- Horstmann S.; Irran E.; Schnick W. Phosphor(V)-nitrid α-P3N5: Synthese ausgehend von Tetraaminophosphoniumiodid und Kristallstrukturaufklärung mittels Synchrotron-Pulver-Röntgenbeugung. Z. Anorg. Allg. Chem. 1998, 624, 620–628. 10.1002/(SICI)1521-3749(199804)624:4<620::AID-ZAAC620>3.0.CO;2-K. [DOI] [Google Scholar]
- Landskron K.; Huppertz H.; Senker J.; Schnick W. Multianvil-Synthese, Pulver-Röntgenstrukturanalyse, 31P-MAS-NMR- und FTIR-Spektroskopie sowie Materialeigenschaften von γ-P3N5, einer Hochdruckphase von binärem Phosphor(V)-nitrid mit verzerrt quadratischen PN5-Pyramiden und PN4-Tetraedern. Z. Anorg. Allg. Chem. 2002, 628, 1465–1471. 10.1002/1521-3749(200207)628:7<1465::AID-ZAAC1465>3.0.CO;2-Y. [DOI] [Google Scholar]
- Vogel S.; Buda A. T.; Schnick W. United in Nitride: The Highly Condensed Boron Phosphorus Nitride BP3N6. Angew. Chem., Int. Ed. 2018, 57, 13202–13205. 10.1002/anie.201808111. [DOI] [PubMed] [Google Scholar]
- Petříček V.; Dušek M.; Palatinus L. Crystallographic Computing System JANA2006: General features. Z. Krist.-Cryst. Mater. 2014, 229, 345–352. 10.1515/zkri-2014-1737. [DOI] [Google Scholar]
- Zurek E.; Grochala W. Predicting crystal structures and properties of matter under extreme conditions via quantum mechanics: the pressure is on. Phys. Chem. Chem. Phys. 2015, 17, 2917–2934. 10.1039/C4CP04445B. [DOI] [PubMed] [Google Scholar]
- Schneider H.; Häfner W.; Wokaun A.; Olijnyk H. Room temperature Raman scattering studies of external and internal modes of solid nitrogen at pressures 8 ≤ P ≤ 54 GPa. J. Chem. Phys. 1992, 96, 8046–8053. 10.1063/1.462356. [DOI] [Google Scholar]
- Scelta D.; Baldassarre A.; Serrano-Ruiz M.; Marchuk A.; Vogel S.; Schnick W.; Peruzzini M.; Bini R.; Ceppatelli M. High-Pressure Synthesis of Cyclic Phosphazenes by Near-UV Photoinduced Reactivity of NH3 and Elemental Phosphorus. J. Phys. Chem. C 2020, 124, 4308–4319. 10.1021/acs.jpcc.9b11462. [DOI] [Google Scholar]
- Akahama Y.; Kobayashi M.; Kawamura H. Raman study of black phosphorus up to 13 GPa. Solid State Commun. 1997, 104, 311–315. 10.1016/S0038-1098(97)00325-6. [DOI] [Google Scholar]
- Vogel S.; Bykov M.; Bykova E.; Wendl S.; Kloß S. D.; Pakhomova A.; Dubrovinskaia N.; Dubrovinsky L.; Schnick W. Nitride Spinel: An Ultraincompressible High-Pressure Form of BeP2N4. Angew. Chem., Int. Ed. 2020, 59, 2730–2734. 10.1002/anie.201910998. [DOI] [PMC free article] [PubMed] [Google Scholar]
Associated Data
This section collects any data citations, data availability statements, or supplementary materials included in this article.