

Abstract
Salbutamol is an active pharmaceutical ingredient commonly used to treat respiratory distress and is listed by the World Health Organization as an essential medicine. Here, we establish the crystal structure of its oxalate form, salbutamol oxalate, and explore the nature of its crystallographic disorder by combined X-ray crystallography and 13C cross-polarization (CP) magic-angle spinning (MAS) solid-state NMR. The *C–OH chiral center of salbutamol (note that the crystal structures are a racemic mixture of the two enantiomers of salbutamol) is disordered over two positions, and the tert-butyl group is rotating rapidly, as revealed by 13C solid-state NMR. The impact of crystallization conditions on the disorder was investigated, finding variations in the occupancy ratio of the *C–OH chiral center between single crystals and a consistency across samples in the bulk powder. Overall, this work highlights the contrast between investigating crystallographic disorder by X-ray diffraction and solid-state NMR experiment, and gauge-including projector-augmented-wave (GIPAW) density functional theory (DFT) calculations, with their combined use, yielding an improved understanding of the nature of the crystallographic disorder between the local (i.e., as viewed by NMR) and longer-range periodic (i.e., as viewed by diffraction) scale.
Short abstract
The crystal structure of salbutamol oxalate, a new salt form of salbutamol examined by NMR crystallography, reveals the crystallographic disorder at the *C−OH chiral center.
Introduction
Crystallization is an essential step in the manufacture of many pharmaceutical solids, with the majority of active pharmaceutical ingredients (APIs) marketed in their solid form.1,2 Controlling the crystallization process allows for the selection of the solid form with the most suitable physicochemical properties and can help ensure uniformity and phase purity.2−4 A lack of characterization of an API’s crystalline form can have devastating consequences, such as unexpected changes to the performance and inconsistent physicochemical properties (e.g., compressibility and dissolution).5−7
Crystallographic disorder occurring in crystalline pharmaceuticals is a poorly understood solid-state behavior, and it can be difficult to characterize or control. Further, disorder can impact the physicochemical properties of a pharmaceutical, such as stability, and can lead to difficulties in the crystallization and manufacturing process.8,9 The challenge arises in part due to a lack of analytical tools available as current characterization methods have difficulty in distinguishing subtle changes in the crystallographic disorder in organic systems.9
The two most common types of crystallographic disorder observed in pharmaceutical materials are orientational (disarrangement of a whole molecule) and conformational disorder (disarrangement of part of a molecule).9 This leads to the formation of materials with freedom of movement around multiple positions, and this movement cannot be resolved by conventional X-ray diffraction (XRD). Rather, the structure is refined from the Bragg intensities which show an average picture of all the positions. The presence of molecular disorder in a solid form can increase the Gibbs free energy of a bulk material and can give rise to weaker molecular packing and increased molecular motions.9 The variation can occur in a single unit cell via molecular mobility (dynamic disorder) or can be distributed among several unit cells (static disorder).10 In addition to the difficulty in resolving the disorder, there is a common misconception that every single crystal in a batch is identical, which is an oversimplified view. The analysis of one single crystal does not provide information about the overall arrangement of molecules in the bulk and thus provides a limited picture of the molecular disorder; it may not be a fully representative characterization method. The development of new methodologies to overcome this limitation is required to gain a detailed picture of the molecular disorder and the identification of subtle differences between crystals.
Various bulk analytical methods are currently used to characterize the disorder. The majority of these methods characterize a solid at the surface or particulate level such as isothermal micro-calorimetry,11 dynamic vapor sorption,12,13 atomic force microscopy,14,15 and transmission electron microscopy.16 The characterization of disorder at the molecular level in the bulk is currently limited to powder XRD17,18 and some spectroscopic methods such as solid-state NMR,19−29 Raman,30 and dielectric spectroscopy.31 Single crystal XRD is a fundamental method in crystallography that provides detailed information about the internal lattice of a crystalline material and the nature of the disorder;32−34 however, it is not a bulk analysis method.35 The ability to distinguish subtle changes in disorder at the molecular level via single crystal XRD (SXRD) remains a challenge and it is limited to a generalized average value from one single crystal with no clear way to quantify the range of the disorder occurring in the many crystals in the bulk powder.
Atomic displacement parameters (ADPs) from X-ray data often provide the first indication that a structure is disordered especially in the case of static disorder, but identifying dynamic disorder is particularly challenging. Variable-temperature X-ray measurements can provide additional insights, but the SXRD data are usually only collected at one specific temperature, with a low temperature, between 100 and 150 K, usually preferred. Solid-state NMR, especially when combined with density functional theory (DFT) calculations, provides the opportunity to derive information about the nature of any disorder using variable-temperature experiments and relaxation time measurements. Solid-state NMR is sensitive to short-range order, and with experimental timescales (for the radiofrequency pulses and acquisition of the time-domain signal) ranging from microseconds to tens of milliseconds, the distinction between static and dynamic disorder is possible. Other techniques such as Terahertz time-domain spectroscopy36 are emerging for probing the sorts of motions that NMR may not be sensitive to. A combination of complementary characterization techniques is always to be encouraged when trying to understand the range of motions present in a crystal lattice.
Solid-state NMR can be used to gain insights into crystallographic disorder occurring in bulk pharmaceuticals21,37−44 and can be combined with gauge-including projector-augmented-wave (GIPAW) calculations to verify and refine the crystal structure, that is, NMR crystallography.19,24,37,45−70 As a technique that observes the bulk sample, solid-state NMR can be used to validate the occurrence of crystallographic disorder and determine its nature.21,25,71 The disorder caused by dynamics can be investigated by solid-state NMR,71−80 offering qualitative information through line-shape analysis, chemical shift measurement,21 and dipolar coupling measurements.61,81 In addition, quantitative information on the thermodynamic parameters of the dynamics can be obtained through relaxation time measurements.61,71,72,75 There are limits to the ability of solid-state NMR to investigate disorder, which may arise due to the nature of the technique. Examples of this may arise from an insufficient resolution required to adequately resolve the crystallographic disorder, the disorder involving unreceptive nuclei or potentially missing the presence of dynamics occurring at a timescale distinct from that of the one-dimensional NMR experiment. Nevertheless, NMR crystallography has successfully been applied, for example, to understand the nature of the structural disorder in eniluracil,82 and quantitative information on the dynamics in pyrrolidine rings were obtained in a development compound using 13C spin–lattice time measurements.20 Recent computational advances involving molecular dynamics calculations have also been shown to be useful in interpreting experimental solid-state NMR lineshapes.83,84
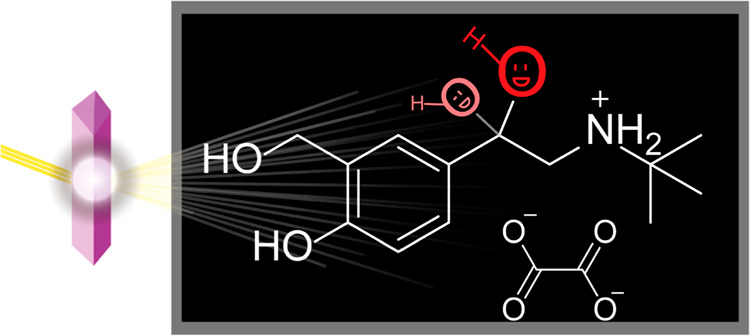
Salbutamol is a pharmaceutical product that is listed as an essential medicine by the World Health Organization and is used in part to treat respiratory distress, such as asthma.85 The main commercial form is salbutamol sulfate, although there are also structures of salbutamol reported in the Cambridge Structural Database86 featuring molecules of succinic acid,87 adipic acid,87 and even the pharmaceutical oxaprozin.88 Here, we report salbutamol oxalate as a model system and investigate this new crystalline form using a combination of X-ray crystallography and NMR crystallography with the aim of utilizing these analytical tools to gain a wider understanding of the nature of the disorder present in single crystals and in the bulk powder. The crystal structure of salbutamol oxalate features disorder at its *C–OH chiral center and here, a major and minor phase is seen, as shown in Figure 1. In this context, the term phase refers to the two distinguishable crystallographic positions observed in salbutamol oxalate. The disorder in salbutamol oxalate strongly resembles the disorder observed in the commercial form of salbutamol as salbutamol sulfate.89 It should be noted that while the disorder impacts the assignment of the stereochemistry on the chiral centers, the symmetry present ensures that all structures display a racemic mixture of the two enantiomers of salbutamol (see Figure 2). The impact of crystallization conditions on the degree of the disorder in the structure is investigated in order to gain insights into the distribution of conformational disorder present in multiple single crystals, which may be highly dependent on the crystallization conditions employed.
Figure 1.

(a) Diagram of the molecular structure of salbutamol oxalate and (b) depictions of the X-ray crystal structure of salbutamol oxalate showing the crystallographic disorder. The magenta circle highlights the disordered site of interest, and the arrows indicate the site of the highest occupancy (“major phase”) and lowest occupancy (“minor phase”).
Figure 2.

Packing of the structure displayed for the (a) highest occupancy “major phase” and (b) lowest occupancy “minor phase”. The crystallographic disorder is displayed. The impact of the disorder on the stereochemistry assignment is labeled on the chiral centers and both phases contain a racemic mixture of the two enantiomers of salbutamol, that is, the disorder is not due to one enantiomer being favored.
In this work, we establish the crystal structure of salbutamol oxalate and explore the variations of the crystallographic disorder between single crystals and the bulk powder using a combination of single crystal XRD and solid-state NMR. The site occupancies of the disorder in the *C–OH group were determined for multiple crystals in several samples, and the variability in the occupancies between single crystals is estimated. In order to assess the impact of crystallization conditions on the disorder, three batches of salbutamol oxalate were prepared under unique conditions, by varying either the crystallization temperature or the crystallization rate. Data were collected for at least three single crystals from each batch, and the disorder occupancies quantified in each single crystal (i.e., the major occupancy to minor occupancy ratio). The samples of salbutamol oxalate were further investigated by 13C solid-state NMR to quantify the disorder in the bulk sample. The identification and characterization of structural variations between single crystals in the bulk are of vital importance in understanding and predicting the properties of bulk powders. Structural variations could influence the chemical and physical properties of a material and its performance in the manufacturing process and the product. While single crystal XRD provides a crystal-to-crystal quantification of the disorder, solid-state NMR provides a view of the bulk material. In this work, we show that combining single crystal XRD with solid-state NMR provides an improved understanding of the crystallographic disorder between the local (i.e., as viewed by NMR) and longer-range periodic (i.e., as viewed by diffraction) scale.
Experimental Section
Sample Preparation
Salbutamol sulfate (>98%) was purchased from Tokyo Chemical Industry, and oxalic acid (>98%) was purchased from Sigma-Aldrich. Salbutamol was obtained from salbutamol sulfate in a solution of aqueous sodium carbonate (see Section S1 in the Supporting Information). It is expected that sodium sulfate remained in solution, while salbutamol precipitated. A very weak signal is observed in the 23Na solid-state NMR spectrum of 1a (Figure S5 in Section S2) with a lineshape that is similar but not perfectly matching to that of sodium sulfate. Samples of salbutamol oxalate were prepared via evaporative crystallization at a 1:1 M ratio in 3 mL of water. A powder XRD pattern for each sample is available in Section S2 of the Supporting Information (Figures S4). The temperature at which samples were set to evaporate was between 20 and 50 °C, and the time for evaporation (a time point at which the solvent had visually evaporated) was varied between <1 and 3 days.
X-ray Crystallography
A Rigaku Oxford Diffraction SuperNova was used for data collection, with measurements taken at 150 K or 298 K. The diffractometer was equipped with the Eos S2 detector and used a sealed tube source (Cu Kα radiation) with a graphite monochromator. Direct methods (SHELXS)90 were used for structure solution, and least squares minimization (SHELXL)91 was used for the structure refinement. Isotropic displacement parameters were initially used for the refinement of non-hydrogen atoms with multiple site occupancies. Subsequently, the ADPs were refined freely and fixed in position after several refinement cycles. The positions of hydrogen atoms were constrained in an idealized position and refined using a riding model. Crystal structure information for salbutamol oxalate: colorless block, C14H22N1O5,M = 284.32 g mol–1, monoclinic, space group P21/n (#14), a = 8.4010 (3) Å, b = 6.2001 (2) Å, c = 27.6519 (9) Å, β = 97.211(3)o, V = 1428.90 (8) Å3, Z = 4, Z′ = 1, ρcalc = 1.323 g cm3, F(000) = 613.0, μ = 0.832 mm–1.
13C Solid-State NMR
All samples were packed into 4 mm zirconium oxide magic-angle spinning (MAS) rotors. Experiments were performed on either a Bruker Avance III spectrometer operating at a 1H Larmor frequency of 500 MHz using the 4 mm Bruker HXY probe, or on a Bruker NEO spectrometer operating at a 1H Larmor frequency of 850 MHz using a 4 mm Bruker HXY probe in double-resonance mode. A MAS rate of 12.5 kHz was used throughout all the experiments. At 11.7 T, 1D 13C cross-polarization MAS (CPMAS) spectra were acquired using a ramped contact pulse from 50 to 100% on the 1H channel,92 a contact time of 2 ms, a 1H π/2 pulse duration of 2.5 μs, a 3 s recycle delay, co-adding 1024 transients, and using SPINAL64 proton decoupling93 with a 1H nutation frequency of 100 kHz and a pulse duration of 3.8 μs. A 1H–13C HETCOR experiment was performed using the same CP parameters but with a 200 μs contact time. The 13C T1 relaxation times were measured using the same cross-polarization (CP) parameters followed by an inversion recovery pulse sequence, with a 13C π/2 pulse of 4.2 μs, sampling 8 datapoints along the T1 curve. For the variable-temperature experiments at 11.7 T, 512 transients were acquired. At 20.0 T, the 1D 13C CPMAS spectra were acquired using a ramped contact pulse from 70 to 100% on the 1H channel,92 a contact time of 4 ms, a 1H π/2 pulse duration of 3 μs, a 3 s recycle delay, co-adding 512 transients, and using SPINAL64 proton decoupling93 with a 1H nutation frequency of 83 kHz and a pulse duration of 5.6 μs. The 13C spectra were calibrated using l-alanine and referenced to 178.8 ppm, relative to TMS at 0 ppm.94,95 The temperatures were calibrated externally using the 79Br resonance of KBr.96 All relative intensities were estimated using the integral of the peak.
1H Solid-State NMR
1H solid-state NMR spectra were acquired on a Bruker Avance II+ spectrometer operating at a 1H Larmor frequency of 600 MHz using a 1.3 mm Bruker HXY probe or on a Bruker NEO spectrometer operating at a 1H Larmor frequency of 850 MHz using a 4 mm Bruker HXY probe in double-resonance mode. A π/2 pulse of 2.5 μs and a recycle delay of 3 s was used. 32 (600 MHz) or 4 (850 MHz) transients were co-added. The 1H spectra were referenced using the CH3 resonance of l-alanine to 1.1 ppm, relative to adamantane at 1.85 ppm.97
NMR Calculations
All DFT98−100 calculations were performed using the GIPAW101 method as implemented in CASTEP102 as part of Materials Studio version 17103 and following recommended procedures.60,104 The crystal structures obtained from the experimental X-ray crystallography results were used as the structural models for the calculations. The GGA PBE functional105 was employed for all calculations, beginning with a geometry optimization prior to calculating the NMR chemical shifts. The geometry optimization was performed with TS DFT-D correction,106 on-the-fly ultrasoft pseudopotentials, Koelling–Harmon relativistic treatment, and a constrained unit cell, and all atomic positions were optimized. The cutoff energy was 600 eV and the k-point separation was 0.05 Å–1. NMR calculations were subsequently performed using the same parameters as the geometry optimization but with a cutoff energy of 700 eV. The calculated σiso values were extracted using the script Magres2Topspin60 and converted into δiso using the equation δiso = σref – σcalc, with a σref(13C) of 170.6 ppm and a σref(1H) of 30.2 ppm. Calculating the σref specific to each system is a common practice in the literature,107 noting that the average σref values are also available.108
Results and Discussion
General X-ray Structural Characterization
As shown in Figure 3a, the asymmetric unit of the crystal structure of salbutamol oxalate features a salbutamol molecule and half an oxalate anion, with the X-ray-determined parameters reported in Table 1 (and Tables S10, S11, and S12 in Section S6 of the Supporting Information). The protons of oxalic acid have been transferred to the NH2+ group of salbutamol, which is supported by their pKa difference, DFT calculations, and the 13C solid-state NMR chemical shifts (vide infra). The crystal structure of salbutamol oxalate features crystallographic disorder of the *C–OH group over two positions, labeled in Figure 1b as C16–O6 (major) and C16A-O6A (minor), and the relative occupancies of the minor phase at 150 K are given in Table 2. Note that all the considered crystal structures contain a racemic mixture of the two enantiomers of salbutamol due to the symmetry constraints of the crystal; the disorder is not due to one enantiomer being favored. Several different ways of refining the crystallographic disorder were tested, and the most sensible model was chosen (see discussion in Section S3 of the Supporting Information).
Figure 3.

(a) Depiction of the crystal structure of salbutamol oxalate (sample 1a, trial #1, at 150 K, see Table S10, CSD deposition number 2106949) showing the hydrogen bond framework and (b) a schematic of the hydrogen-bonding framework. The hydrogen-bonding interactions are labeled as 1 to 6 (see Table S2 for hydrogen bond lengths and angles) (c) Crystallographic packing viewed along the b axis. The salbutamol cation is shown in light blue, and the oxalate anion is shown in dark red.
Table 1. Crystal Data and Structure Refinement for a Variable-Temperature X-ray Diffraction Study with Salbutamol Oxalate, Sample 1b, Trial #2 at 298 and 150 K.
| parameter | 1b at 298 K | 1b at 150 K |
|---|---|---|
| empirical formula | C14H22NO5 | C14H22NO5 |
| temperature (K) | 298.09 (15) | 150.01 (10) |
| crystal system | monoclinic | monoclinic |
| space group | P21/n | P21/n |
| a (Å) | 8.4844 (8) | 8.4010 (3) |
| b (Å) | 6.2472 (6) | 6.2001 (2) |
| c (Å) | 27.619 (2) | 27.6519 (9) |
| α (deg) | 90 | 90 |
| β (deg) | 96.832(9) | 97.211(3) |
| γ (deg) | 90 | 90 |
| volume (Å) | 1453.5 (2) | 1428.90 (8) |
| Z | 4 | 4 |
| ρcalc (g/cm3) | 1.299 | 1.323 |
| μ (mm–1) | 0.816 | 0.832 |
| F(000) | 612.0 | 613.0 |
| radiation | Cu Kα (1.54184 Å) | Cu Kα (1.54184 Å) |
| 2θ range for data collection (deg) | 10.612 to 147.718 | 10.7 to 147.512 |
| reflections collected | 6899 | 7518 |
| goodness-of-fit on F2 | 1.121 | 1.046 |
| Rall data | R1 = 0.0950, WR2 = 0.2585 | R1 = 0.0532, WR2 = 0.1192 |
| R [I ≥ 2θ(I)] | R1 = 0.0677, WR2 = 0.2073 | R1 = 0.0459, WR2 = 0.1131 |
| largest diff. peak/hole (e Å–3) | 0.52/–0.53 | 0.30/–0.23 |
| chemical occupancy (*C–OH)a | 0.134:0.866(8) | 0.140:0.860(5) |
| CSD deposition no. | 2106958 | 2106953 |
The standard uncertainties were noted down before site occupancies were fixed.
Table 2. Disorder Occupancy of the Minor Site C16A Observed in Single Crystals and Powdered Samples of Salbutamol Oxalate Crystallized under Different Conditions, as Determined by X-ray Crystallography and 13C Solid-State NMR.
| X-ray disorder occupancy at 150 K |
||||||||
|---|---|---|---|---|---|---|---|---|
| conditions |
individual
single crystal trialsa |
|||||||
| sample | time (days) | temp (°C) | #1 | #2 | #3 | average (%) | distribution (%)b | NMR occupancy at 300 K (%)c |
| 1a | <1 | 50 | 0.161 (6) | 0.121 (5) | 0.132 (6) | 13.8 | (−) 1.7 | 12 ± 3 |
| (+) 2.3 | ||||||||
| 1b | ≈3 | 20 | 0.150 (4) | 0.140 (5) | 0.129 (5) | 13.9 | (−) 1.0 | 9 ± 3 |
| (+) 1.1 | ||||||||
| 1c | ≈3 | 30 | 0.153 (5) | 0.148 (4) | 0.165 (6) | 15.5 | (−) 0.7 | 11 ± 2 |
| (+) 1.0 | ||||||||
Standard uncertainties were noted down before site occupancies were fixed.
Distribution from the average value.
The hydrogen bonding framework between salbutamol and the oxalate anion consists of six hydrogen bonds (see Figure 3b), three of which are charge-assisted and occur between the charged NH2+ group and the oxalate ion. Interestingly, hydrogen bonds 2 and 3 in Figure 3b are bifurcated hydrogen bonds with a three-centered interaction.109 One of these bifurcated bonds, hydrogen bond 3, resides with the disordered *C–OH region. Variable temperature XRD studies show a variation in the observed characteristics of the bond length and bond angle of hydrogen bond 3 (see Tables S2 and S3 in Section S3 of the Supporting Information). This may provide an explanation for the molecular motions observed in the crystal structure of salbutamol oxalate; the weak intermolecular interactions observed may favor a locally loose crystal packing in the disordered region, leading to an increase in molecular motions.82Figure 3c shows the packing arrangement, with salbutamol (light blue) assembling around channels of oxalate anions (dark red).
The disorder observed in the crystal structure of salbutamol oxalate is similar to that observed in other solid forms of salbutamol, namely, salbutamol sulfate,89 salbutamol sulfate monohydrate,85 and salbutamol benzoate.110 In these cases, the *C–OH group in salbutamol is also disordered and shows multiple phases. The hydrogen bond framework in salbutamol sulfate89 is similar to that shown here in salbutamol oxalate, with two hydrogen bond acceptors (a charge-assisted NH2+ and a hydroxyl group) competing for the same hydrogen-bond donor atom (see Section S4 in the Supporting Information).
Disorder Characterization by X-ray Crystallography
Single crystal XRD studies have been carried out on three individual single crystals (referred to as trial #1, #2, and #3), from each of three different sample batches, henceforth referred to as samples 1a, 1b, and 1c, prepared using the following crystallization conditions: sample 1a, fast evaporation (hours) of an aqueous solution at 50 °C; sample 1b, slow evaporation (3 days) of an aqueous solution at 20 °C; sample 1c, slow evaporation (3 days) of an aqueous solution at 30 °C. Experiments with various crystallization temperatures were carried out to explore how the site occupancy factors of salbutamol oxalate vary in crystals as a function of the temperature and rate of crystallization. Table 2 summarizes the crystallization conditions of each sample and the resultant disorder occupancy of the single crystals analyzed under the refinement model discussed in Section S3 in the Supporting Information. The refined average disorder and disorder distribution from the data collected is calculated.
An average minor phase of approximately 14–15% was found in samples 1a, 1b, and 1c from the analysis of several single crystals. Small occupancy distributions are observed for the samples, with individual refined occupancies showing a maximum variation of 4% for sample 1a, 2% for sample 1b, and 2% for sample 1c. The standard uncertainties on these values also indicate consistently precise determination for these samples. The conditions at which crystallization occurred did not seem to have a significant influence on the disorder occupancies measured for each sample. The effect of crystallization conditions on site occupancies has been investigated for other disordered molecules in the literature. A similar observation was found in the case of eniluracil;82 no significant differences were observed between the site occupancies when crystallized under different procedures. In contrast, in the case of 5-chlorouracil,111 significant differences were observed between site occupancies, which seemed to depend on the crystallization procedure. Different crystallization solvents and methods were investigated in both of these cases. Further investigations are required to determine why changing the crystallization procedure appears to affect the site occupancies of some disordered molecules but not others. Certainly, single crystal XRD is not a bulk analysis technique, and the analysis of three single crystals per sample is not a complete representation of the bulk material. The methodology in this study does, however, provide a valuable insight into the nature of the disordered material. One aim of the present study is to investigate whether the combination of solid-state NMR with X-ray crystallography can help to bridge the gap between characterizing the disorder in single crystals and the bulk material. Solid-state NMR experiments were, therefore, performed to evaluate the nature of the disorder (i.e., static or dynamic) and to quantify the phase occupancies in the bulk material.
13C Solid-State NMR Spectroscopy
13C CPMAS solid-state NMR experiments have been applied to investigate the crystallographic disorder observed in the X-ray crystal structure of salbutamol oxalate and have been performed at magnetic fields of 11.7 and 20.0 T. Three samples of salbutamol oxalate were analyzed as above, 1a, 1b, and 1c, with their 13C NMR spectra shown in Figure 4. Note that, for such an experiment, ∼100 mg of the powdered sample is packed into a MAS rotor of outer diameter, 4 mm. Overall, there are 12 unique 13C resonances observed in the experimental spectra, and their assignments are shown in Figure 4 with their chemical shifts reported in Section S5, Table S4 in the Supporting Information. Of the 12 resonances in the 13C spectrum, the C15 (oxalate), C3 (aromatic C–OH), C16 (*CHOH), and C12/C13/C14 (tert-butyl methyl) resonances feature a shoulder near the base of resonances, while for resonances C2 (aromatic C), C4 (aromatic C–H), C9 (CH2), and C11 (tert-butyl), a second resonance of lower intensity was resolved. These shoulders and lower-intensity resonances have been assigned to the minor position of the crystallographic disorder. Using 13C NMR resonance C9, the disorder has been quantified in each sample at room temperature, assuming a consistent CP transfer between them, as summarized in Table 2. As shown in Table S9 and Figure S19 of the Supporting Information, the 1H T1ρ values were measured for both phases in the cases where the 13C resonances were resolved. The 1H T1ρ values are comparable between the two phases, supporting similar CP transfer kinetics for both phases. The recycle delay was optimized, with no differences observed in the relative intensity for either component in the 13C NMR spectrum when acquired with a recycle delay of 3 s or 5 s. The amount of disorder measured by solid-state NMR appears to be consistent across all three samples and is in close agreement with the X-ray crystallography data, as shown in Table 2. The XRD data for all single crystals analyzed for salbutamol oxalate are presented in Section S6 of the Supporting Information. These results highlight the importance of pairing single crystal XRD with a bulk analysis technique, such as solid-state NMR. While single crystal XRD can provide a general picture of the positions of the atoms and molecules in the solid state, solid-state NMR has provided information on disorder occupancies in the bulk powder.
Figure 4.

Experimental 13C CPMAS (contact time = 2 ms, νMAS = 12.5 kHz) solid-state NMR spectra of sample 1a, 1b, and 1c, obtained at 11.7 T. The GIPAW DFT-calculated spectrum is shown above with the intensity of the minor phase set to 15% that of the major phase. The asterisks denote spinning sidebands, and the assignments are shown above.
The experimental 13C chemical shifts are in excellent agreement (R2 > 0.99, see Figure S17 of the Supporting Information) with the DFT-calculated chemical shifts,22,46,112−114 as shown in black in Figure 4, and supports the current structural model and the Z′ of 1. The experimental 13C NMR spectrum was assigned using the 1H–13C HETCOR experiment (see Figure S12 of the Supporting Information) and GIPAW DFT calculations. The DFT spectrum was simulated by splitting the disorder into two separate structural models, one containing the major site of occupancy and the other containing the minor site of occupancy, and calculating the 13C chemical shifts (see Table S4 in the Supporting Information for the DFT-calculated 13C chemical shifts). The NMR spectrum was simulated from the calculated chemical shifts using the solid lineshape analysis (SOLA),115 and the relative intensity of the 13C spectrum for the minor position was set to 15% of that of the major position. Overall, the DFT calculations are in excellent agreement with the experiments, and the presence of shoulders and splitting arising due to the disorder is reproduced well by the DFT calculations.
Additional DFT calculations were performed to investigate the variability of the 13C chemical shift as a function of the N–H proton distance, moving from the salt form (+N–H···O–) to the cocrystal form (N···H–O). As shown in Figure S13 of the Supporting Information, the GIPAW-calculated 13C chemical shift of the oxalate carbon (resonance C15) is very sensitive to the proton position and varies from 170.3 ppm in the salt form to 160.2 ppm in the cocrystal form. The experimental 13C chemical shift of the oxalate carbon (resonance C15) is consistent with the DFT calculations obtained on the salt form and is also supported by a prior report on oxalic acid cocrystals.116 The DFT calculations were repeated on structures 1b acquired at 298 K and 150 K, and only very small 13C chemical shift changes on an order of 0.1 ppm (corresponding to the accuracy of reporting experimental 13C solid-state NMR chemical shifts) were observed, as shown in Figures S14 and S15 of the Supporting Information.
One difference between the experimental and calculated 13C spectrum is the methyl carbon on the tert-butyl group (resonance C12/C13/C14 in Figure 4), which has three peaks in the calculated data but only a single peak in the experimental spectrum. This difference arises due to the calculations being performed at 0 K and not taking into consideration the dynamics of the tert-butyl group occurring at room temperature. Upon reducing the sample temperature to −28 °C, the methyl 13C resonance splits into two with 1:2 relative intensity, as shown in Figure 5a, and the agreement between the experimental 13C NMR results and the DFT calculations improves significantly. At higher temperatures, the methyl resonances coalesce as a result of the rapid rotation of the tert-butyl group, relative to the NMR timescale;23,117−121 this is also observed in 1H solid-state NMR spectra (see Figure S10 and variable-temperature 1H MAS NMR spectra recorded at 12.5 kHz MAS in Figures 5b and S11 of the Supporting Information). In addition, 13C T1 spin–lattice relaxation times [T1(13C)] were measured as a function of temperature and show a strong dependence of T1(13C) on the temperature for resonances C11 and C12/C13/C14, further supporting the occurrence of a dynamic tert-butyl group (see Figure S18 of the Supporting Information). Notably, the tert-butyl dynamics is not readily distinguishable from the X-ray data (see thermal ellipsoid plots in Figure S20 of the Supporting Information).
Figure 5.

Experimental solid-state MAS (νMAS = 12.5 kHz) NMR spectra of 1a acquired at 20 T at several temperatures observing (a) 13C using 1H–13C CP (contact time = 4 ms) and (b) 1H using a spin-echo (with a spin-echo duration of 2 μs) pulse sequence. The asterisks in (a) denote the spinning sidebands, and the blue arrows highlight the increase in intensity for the minor position of the CH2 carbon (C9), adjacent to the disordered *C–OH chiral center. Simulated spectra corresponding to the GIPAW-calculated chemical shifts are shown above in black in both (a,b).
As shown in Figure 5a, the relative intensity of all the 13C resonances assigned to the minor position slightly increases as the temperature is reduced. This is most noticeable for 13C resonance C9 at δ(13C) = 50.2 ppm (see blue arrows in Figure 5a), with the integrated intensity of the minor phase, relative to the major phase, increasing from 0.14 at 47 °C to 0.20 at −28 °C in 1a. Additional variable-temperature experiments were performed at both 20.0 and 11.7 T, as presented in Figures S8 and S9 of the Supporting Information, respectively. The changes in the relative intensities indicate that the population of the major and minor phases is dependent on the temperature. This dependence on the temperature is not observed in the X-ray crystallography results of a single crystal from sample 1b (see Table 1), rather the refined disorder site occupancies are within the error at the two temperatures and appear to be independent of the acquisition temperature within the precision of the crystallographic determination. This apparent discrepancy in the temperature dependence of the disorder may be due to the constraints that were imposed during the X-ray data refinement, in part masking the nature of the disorder and removing unusual features to meet CIF requirements.
The increase in the relative intensity of the resonances assigned to the minor phase as the temperature decreases may be attributed to the disorder being in part dynamic and could be in the slow-exchange regime at fields of 11.7 and 20.0 T. Unfortunately, the T1(13C) relaxation times related to C16 and C9 13C resonances were lengthy, as shown in Figure S18 of the Supporting Information, and no clear dependence of T1(13C) with the temperature was observed. In order to be in the slow-exchange regime, the exchange rate must be lower than the 13C Larmor frequencies of 125 MHz and 213 MHz, respectively. This is in direct contrast to the coalescence of the 13C resonance of the tert-butyl group, which is in the fast-exchange regime at temperatures above 0 °C at 20.0 T. Between temperatures of 0 and −14 °C at 20.0 T, the chemical exchange is in the intermediate regime, and broadening is observed for the 13C resonance at 26 ppm, as shown in Figure 5a, whereas at temperatures lower than −21 °C at 20.0 T, the tert-butyl group motion slows, and multiple resonances are observed. The results on the tert-butyl dynamics are in agreement with prior reports on different systems.23,117−121 As shown in Figure 5b, corresponding narrowing of the tert-butyl 1H resonance (at ∼0 ppm) is observed above 0 °C.
Conclusions
The crystal structure and nature of the disorder in salbutamol oxalate were investigated by single crystal XRD and 13C solid-state MAS NMR spectroscopy. While the single crystal X-ray data highlight the presence of a crystal-to-crystal variation in the occupancies of 12–16%, 13C solid-state NMR quantifies the average occupancy of the minor position in the bulk powder at 11 ± 3% at room temperature. Both the XRD and solid-state NMR results are in close agreement and suggest that the nature of the disorder in salbutamol oxalate may, in part, be dynamic. Further, 13C and also 1H solid-state MAS NMR revealed the occurrence of rapid rotation of the tert-butyl group. Overall, this work illustrates the utility of combining X-ray crystallography and solid-state NMR to investigate the crystallographic disorder at the molecular scale and larger scale in bulk powders. A criticism of our work could be that the multi-batch single-crystal XRD analysis was carried out at 150 K, while the solid-state NMR analysis was carried out at room temperature. An even more extended study than that presented here would have been to carry out a multi-batch single-crystal XRD analysis at a range of temperatures so that the role of temperature could be better understood. However, we do note that the occupancies for the major and minor phases are within the error for the one single crystal for which single-crystal diffraction analysis was performed at 150 and 298 K. Moreover, GIPAW-calculated chemical shifts for DFT geometry-optimized crystal structures at these two temperatures are within 0.1 ppm.
Acknowledgments
This work was funded by Innovate UK and AstraZeneca (grant number: KTP11570) and the Engineering and Physical Sciences Research Council (EPSRC) through the Centre for Doctoral Training in Sustainable Chemical Technologies (Grant number: EP/L016354/1). Z.R. thanks the EPSRC and Pfizer for PhD funding. The authors thank Dinu Iuga for support with the NMR experiments. The UK High-Field Solid-State NMR Facility used in this research was funded by EPSRC and BBSRC (EP/T015063/1) and the University of Warwick including via part funding through Birmingham Science City Advanced Materials Projects 1 and 2, supported by Advantage West Midlands (AWM) and the European Regional Development Fund (ERDF). We thank Dr Andrew P. Howes and Patrick Ruddy for supporting the operation of the Millburn House Magnetic Resonance Laboratory. Data for this study are provided as a Supporting Information set from the University of the Warwick Research Dataset portal at https://wrap.warwick.ac.uk/167259.
Supporting Information Available
The Supporting Information is available free of charge at https://pubs.acs.org/doi/10.1021/acs.cgd.1c01093.
Experimental synthesis procedure of salbutamol, additional NMR spectra, additional single-crystal XRD data, powder XRD data, and thermal ellipsoid plots (PDF)
Author Contributions
The manuscript was written through contributions of all authors. All authors have given approval to the final version of the manuscript.
The authors declare no competing financial interest.
Supplementary Material
References
- Tung H.-H.; Paul E. L.; Midler M.; McCauley J. A.. Introduction to Crystallization Issues. In Crystallization of organic compounds: an industrial perspective; Tung H.-H., Paul E. L., Midler M., McCauley J. A., Eds.; Wiley, 2009; pp 1–13. [Google Scholar]
- Couillaud B. M.; Espeau P.; Mignet N.; Corvis Y. State of the Art of Pharmaceutical Solid Forms: from Crystal Property Issues to Nanocrystals Formulation. ChemMedChem 2019, 14, 8–23. 10.1002/cmdc.201800612. [DOI] [PubMed] [Google Scholar]
- Chaurasia G. A Review on Pharmaceutical Preformulation Studies in Formulation and Development of New Drug Molecules. Int. J. Pharma Sci. Res. 2016, 7, 2313–2320. 10.13040/Ijpsr.0975-8232.7(6).2313-20. [DOI] [Google Scholar]
- Kalepu S.; Nekkanti V. Insoluble drug delivery strategies: review of recent advances and business prospects. Acta Pharm. Sin. B 2015, 5, 442–453. 10.1016/j.apsb.2015.07.003. [DOI] [PMC free article] [PubMed] [Google Scholar]
- Marsac P. J.; Romary D. P.; Shamblin S. L.; Baird J. A.; Taylor L. S. Spontaneous crystallinity loss of drugs in the disordered regions of poly(ethylene oxide) in the presence of water. J. Pharm. Sci. 2008, 97, 3182–3194. 10.1002/jps.21237. [DOI] [PubMed] [Google Scholar]
- Burt H. M.; Mitchell A. G. Crystal Defects and Dissolution. Int. J. Pharm. 1981, 9, 137–152. 10.1016/0378-5173(81)90007-7. [DOI] [Google Scholar]
- Huttenrauch R. Modification of Starting Materials to Improve Tabletting Properties. Pharm. Ind. 1983, 45, 435–440. [Google Scholar]
- Descamps M.; Willart J. F.. Some Facets of Molecular Disorder in Crystalline and Amorphous Pharmaceuticals. In Disordered Pharmaceutical Materials; Descamps M., Ed.; Wiley, 2016; pp 1–56. [Google Scholar]
- Newman A.; Zografi G. Critical Considerations for the Qualitative and Quantitative Determination of Process-Induced Disorder in Crystalline Solids. J. Pharm. Sci. 2014, 103, 2595–2604. 10.1002/jps.23930. [DOI] [PubMed] [Google Scholar]
- Dunitz J. D. Phase transitions in molecular crystals from a chemical viewpoint. Pure Appl. Chem. 1991, 63, 177–185. 10.1351/pac199163020177. [DOI] [Google Scholar]
- Buckton G.; Darcy P.; Mackellar A. J. The Use of Isothermal Microcalorimetry in the Study of Small Degrees of Amorphous Content of Powders. Int. J. Pharm. 1995, 117, 253–256. 10.1016/0378-5173(94)00421-Z. [DOI] [Google Scholar]
- Mackin L.; Zanon R.; Park J. M.; Foster K.; Opalenik H.; Demonte M. Quantification of low levels (< 10%) of amorphous content in micronised active batches using dynamic vapour sorption and isothermal microcalorimetry. Int. J. Pharm. 2002, 231, 227–236. 10.1016/S0378-5173(01)00881-X. [DOI] [PubMed] [Google Scholar]
- Sheokand S.; Modi S. R.; Bansal A. K. Dynamic Vapor Sorption as a Tool for Characterization and Quantification of Amorphous Content in Predominantly Crystalline Materials. J. Pharm. Sci. 2014, 103, 3364–3376. 10.1002/jps.24160. [DOI] [PubMed] [Google Scholar]
- Begat P.; Young P. M.; Edge S.; Kaerger J. S.; Price R. The effect of mechanical processing on surface stability of pharmaceutical powders: Visualization by atomic force microscopy. J. Pharm. Sci. 2003, 92, 611–620. 10.1002/jps.10320. [DOI] [PubMed] [Google Scholar]
- Price R.; Young P. M. On the physical transformations of processed pharmaceutical solids. Micron 2005, 36, 519–524. 10.1016/j.micron.2005.04.003. [DOI] [PubMed] [Google Scholar]
- Eddleston M. D.; Jones W.. Observation and Characterization of Crystal Defects in Pharmaceutical Solids. In Disordered Pharmaceutical Materials; Descamps M., Ed.; Wiley, 2016; pp 103–134. [Google Scholar]
- Mote V. D.; Purushotham Y.; Dole B. N. Williamson-Hall analysis in estimation of lattice strain in nanometer-sized ZnO particles. J. Theor. Appl. Phys. 2012, 6, 6. 10.1186/2251-7235-6-6. [DOI] [Google Scholar]
- Shafi P. M.; Bose A. C. Impact of crystalline defects and size on X-ray line broadening: A phenomenological approach for tetragonal SnO2 nanocrystals. AIP Adv. 2015, 5, 057137. 10.1063/1.4921452. [DOI] [Google Scholar]
- Cordova M.; Balodis M.; Hofstetter A.; Paruzzo F.; Nilsson Lill S. O.; Eriksson E. S. E.; Berruyer P.; Simões de Almeida B.; Quayle M. J.; Norberg S. T.; et al. Structure determination of an amorphous drug through large-scale NMR predictions. Nat. Commun. 2021, 12, 2964. 10.1038/s41467-021-23208-7. [DOI] [PMC free article] [PubMed] [Google Scholar]
- Szell P. M. J.; Brown S. P.; Hughes L. P.; Blade H.; Nilsson Lill S. O. A curious case of dynamic disorder in pyrrolidine rings elucidated by NMR crystallography. Chem. Commun. 2020, 56, 14039–14042. 10.1039/d0cc05236a. [DOI] [PubMed] [Google Scholar]
- Venâncio T.; Oliveira L. M.; Pawlak T.; Ellena J.; Boechat N.; Brown S. P. The use of variable temperature 13C solid-state MAS NMR and GIPAW DFT calculations to explore the dynamics of diethylcarbamazine citrate. Magn. Reson. Chem. 2019, 57, 200–210. 10.1002/mrc.4790. [DOI] [PubMed] [Google Scholar]
- Hodgkinson P. NMR crystallography of molecular organics. Prog. Nucl. Magn. Reson. Spectrosc. 2020, 118–119, 10–53. 10.1016/j.pnmrs.2020.03.001. [DOI] [PubMed] [Google Scholar]
- Dale B. L.; Halcovitch N. R.; Peach M. J. G.; Griffin J. M. Investigation of structure and dynamics in a photochromic molecular crystal by NMR crystallography. Magn. Reson. Chem. 2019, 57, 230–242. 10.1002/mrc.4805. [DOI] [PubMed] [Google Scholar]
- Widdifield C. M.; Nilsson Lill S. O.; Broo A.; Lindkvist M.; Pettersen A.; Svensk Ankarberg A.; Aldred P.; Schantz S.; Emsley L. Does Z′ equal 1 or 2? Enhanced powder NMR crystallography verification of a disordered room temperature crystal structure of a p38 inhibitor for chronic obstructive pulmonary disease. Phys. Chem. Chem. Phys. 2017, 19, 16650–16661. 10.1039/c7cp02349a. [DOI] [PubMed] [Google Scholar]
- Be̅rziņš A.; Hodgkinson P. Solid-state NMR and computational investigation of solvent molecule arrangement and dynamics in isostructural solvates of droperidol. Solid State Nucl. Magn. Reson. 2015, 65, 12–20. 10.1016/j.ssnmr.2014.09.001. [DOI] [PubMed] [Google Scholar]
- Kerr H. E.; Softley L. K.; Suresh K.; Nangia A.; Hodgkinson P.; Evans I. R. A furosemide–isonicotinamide cocrystal: an investigation of properties and extensive structural disorder. CrystEngComm 2015, 17, 6707–6715. 10.1039/c5ce01183c. [DOI] [Google Scholar]
- Yuan X.; Xiang T. X.; Anderson B. D.; Munson E. J. Hydrogen Bonding Interactions in Amorphous Indomethacin and Its Amorphous Solid Dispersions with Poly(vinylpyrrolidone) and Poly(vinylpyrrolidone-co-vinyl acetate) Studied Using 13C Solid-State NMR. Mol. Pharm. 2015, 12, 4518–4528. 10.1021/acs.molpharmaceut.5b00705. [DOI] [PubMed] [Google Scholar]
- Florian P.; Massiot D. Beyond periodicity: probing disorder in crystalline materials by solid-state nuclear magnetic resonance spectroscopy. CrystEngComm 2013, 15, 8623–8626. 10.1039/c3ce40982a. [DOI] [Google Scholar]
- Apperley D. C.; Harris R. K.; Hodgkinson P.. Solid-State NMR: Basic Principles and Practice; Momentum Press, 2012. [Google Scholar]
- Hedoux A.Raman Spectroscopy in Disordered Molecular Compounds: Application to Pharmaceuticals. In Disordered Pharmaceutical Materials; Descamps M., Ed.; Wiley, 2016; pp 361–392. [Google Scholar]
- Grzybowska K.; Adrjanowicz K.; Paluch M.. Application of Broadband Dielectric Spectroscopy to Study Molecular Mobility in Pharmaceutical Systems. In Disordered Pharmaceutical Materials; Decamps M., Ed.; Wiley, 2016; pp 301–360. [Google Scholar]
- Bond A. D.; Cornett C.; Larsen F. H.; Qu H.; Raijada D.; Rantanen J. Interpreting the Disordered Crystal Structure of Sodium Naproxen Tetrahydrate. Cryst. Growth Des. 2013, 13, 3665–3671. 10.1021/cg400688c. [DOI] [Google Scholar]
- Borodi G.; Pop M. M.; Onija O.; Filip X. Distinct Disordered Forms of Promethazine Hydrochloride: A Case of lntergrowth of Polymorphic Domains?. Cryst. Growth Des. 2012, 12, 5846–5851. 10.1021/cg300943b. [DOI] [Google Scholar]
- Skořepová E.; Čejka J.; Hušák M.; Eigner V.; Rohlíček J.; Šturc A.; Kratochvíl B. Trospium Chloride: Unusual Example of Polymorphism Based on Structure Disorder. Cryst. Growth Des. 2013, 13, 5193–5203. 10.1021/cg4007394. [DOI] [Google Scholar]
- Müller P. Towards a better understanding and improved refinement of disordered crystal structures. IUCrJ 2021, 8, 150–151. 10.1107/S2052252521001573. [DOI] [PMC free article] [PubMed] [Google Scholar]
- Li Q.; Bond A. D.; Korter T. M.; Zeitler J. A. New Insights into the Crystallographic Disorder in the Polymorphic Forms of Aspirin from Low-Frequency Vibrational Analysis. Mol. Pharm. 2022, 19, 227–234. 10.1021/acs.molpharmaceut.1c00727. [DOI] [PubMed] [Google Scholar]
- Kerr H. E.; Mason H. E.; Sparkes H. A.; Hodgkinson P. Testing the limits of NMR crystallography: the case of caffeine–citric acid hydrate. CrystEngComm 2016, 18, 6700–6707. 10.1039/c6ce01453d. [DOI] [Google Scholar]
- Bond A. D.; Cornett C.; Larsen F. H.; Qu H.; Raijada D.; Rantanen J. Interpreting the Disordered Crystal Structure of Sodium Naproxen Tetrahydrate. Cryst. Growth Des. 2013, 13, 3665–3671. 10.1021/cg400688c. [DOI] [Google Scholar]
- Lu X.; Xu W.; Hanada M.; Jermain S. V.; Williams R. O. 3rd; Su Y. Solid-state NMR analysis of crystalline and amorphous Indomethacin: An experimental protocol for full resonance assignments. J. Pharm. Biomed. Anal. 2019, 165, 47–55. 10.1016/j.jpba.2018.11.001. [DOI] [PubMed] [Google Scholar]
- Beran G. J.; Hartman J. D.; Heit Y. N. Predicting Molecular Crystal Properties from First Principles: Finite-Temperature Thermochemistry to NMR Crystallography. Acc. Chem. Res. 2016, 49, 2501–2508. 10.1021/acs.accounts.6b00404. [DOI] [PubMed] [Google Scholar]
- Damron J. T.; Kersten K. M.; Pandey M. K.; Nishiyama Y.; Matzger A.; Ramamoorthy A. Role of Anomalous Water Constraints in the Efficacy of Pharmaceuticals Probed by 1H Solid-State NMR. ChemistrySelect 2017, 2, 6797–6800. 10.1002/slct.201701547. [DOI] [PMC free article] [PubMed] [Google Scholar]
- Paradowska K.; Wawer I. Solid-state NMR in the analysis of drugs and naturally occurring materials. J. Pharm. Biomed. Anal. 2014, 93, 27–42. 10.1016/j.jpba.2013.09.032. [DOI] [PubMed] [Google Scholar]
- Zilka M.; Sturniolo S.; Brown S. P.; Yates J. R. Visualising crystal packing interactions in solid-state NMR: Concepts and applications. J. Chem. Phys. 2017, 147, 144203. 10.1063/1.4996750. [DOI] [PubMed] [Google Scholar]
- Veinberg S. L.; Johnston K. E.; Jaroszewicz M. J.; Kispal B. M.; Mireault C. R.; Kobayashi T.; Pruski M.; Schurko R. W. Natural abundance 14N and 15N solid-state NMR of pharmaceuticals and their polymorphs. Phys. Chem. Chem. Phys. 2016, 18, 17713–17730. 10.1039/c6cp02855a. [DOI] [PubMed] [Google Scholar]
- Abraham A.; Apperley D. C.; Byard S. J.; Ilott A. J.; Robbins A. J.; Zorin V.; Harris R. K.; Hodgkinson P. Characterising the role of water in sildenafil citrate by NMR crystallography. CrystEngComm 2016, 18, 1054–1063. 10.1039/c5ce02234g. [DOI] [Google Scholar]
- Ashbrook S. E.; Hodgkinson P. Perspective: Current advances in solid-state NMR spectroscopy. J. Chem. Phys. 2018, 149, 040901. 10.1063/1.5038547. [DOI] [PubMed] [Google Scholar]
- Bryce D. L. NMR crystallography: structure and properties of materials from solid-state nuclear magnetic resonance observables. IUCrJ 2017, 4, 350–359. 10.1107/S2052252517006042. [DOI] [PMC free article] [PubMed] [Google Scholar]
- Harris R. K.; Hodgkinson P.; Zorin V.; Dumez J. N.; Elena-Herrmann B.; Emsley L.; Salager E.; Stein R. S. Computation and NMR crystallography of terbutaline sulfate. Magn. Reson. Chem. 2010, 48, S103–S112. 10.1002/mrc.2636. [DOI] [PubMed] [Google Scholar]
- Harris R. K. Applications of solid-state NMR to pharmaceutical polymorphism and related matters. J. Pharm. Pharmacol. 2007, 59, 225–239. 10.1211/jpp.59.2.0009. [DOI] [PubMed] [Google Scholar]
- Hofstetter A.; Balodis M.; Paruzzo F. M.; Widdifield C. M.; Stevanato G.; Pinon A. C.; Bygrave P. J.; Day G. M.; Emsley L. Rapid Structure Determination of Molecular Solids Using Chemical Shifts Directed by Unambiguous Prior Constraints. J. Am. Chem. Soc. 2019, 141, 16624–16634. 10.1021/jacs.9b03908. [DOI] [PMC free article] [PubMed] [Google Scholar]
- Baias M.; Widdifield C. M.; Dumez J. N.; Thompson H. P.; Cooper T. G.; Salager E.; Bassil S.; Stein R. S.; Lesage A.; Day G. M.; et al. Powder crystallography of pharmaceutical materials by combined crystal structure prediction and solid-state 1H NMR spectroscopy. Phys. Chem. Chem. Phys. 2013, 15, 8069–8080. 10.1039/c3cp41095a. [DOI] [PubMed] [Google Scholar]
- Gorman E. M.; Samas B.; Munson E. J. Understanding the dehydration of levofloxacin hemihydrate. J. Pharm. Sci. 2012, 101, 3319–3330. 10.1002/jps.23200. [DOI] [PubMed] [Google Scholar]
- Zilka M.; Yates J. R.; Brown S. P. An NMR crystallography investigation of furosemide. Magn. Reson. Chem. 2019, 57, 191–199. 10.1002/mrc.4789. [DOI] [PMC free article] [PubMed] [Google Scholar]
- Widdifield C. M.; Robson H.; Hodgkinson P. Furosemide’s one little hydrogen atom: NMR crystallography structure verification of powdered molecular organics. Chem. Commun. 2016, 52, 6685–6688. 10.1039/c6cc02171a. [DOI] [PubMed] [Google Scholar]
- Zencirci N.; Griesser U. J.; Gelbrich T.; Kahlenberg V.; Jetti R. K. R.; Apperley D. C.; Harris R. K. New solvates of an old drug compound (phenobarbital): structure and stability. J. Phys. Chem. B 2014, 118, 3267–3280. 10.1021/jp409201v. [DOI] [PubMed] [Google Scholar]
- Vogt F. G.; Williams G. R.; Strohmeier M.; Johnson M. N.; Copley R. C. Solid-state NMR analysis of a complex crystalline phase of ronacaleret hydrochloride. J. Phys. Chem. B 2014, 118, 10266–10284. 10.1021/jp505061j. [DOI] [PubMed] [Google Scholar]
- Vigilante N. J.; Mehta M. A. A 13C solid-state NMR investigation of four cocrystals of caffeine and theophylline. Acta Crystallogr. 2017, 73, 234–243. 10.1107/S2053229617000869. [DOI] [PubMed] [Google Scholar]
- Taulelle F. NMR crystallography: crystallochemical formula and space group selection. Solid State Sci. 2004, 6, 1053–1057. 10.1016/j.solidstatesciences.2004.07.033. [DOI] [Google Scholar]
- Ashbrook S. E.; McKay D. Combining solid-state NMR spectroscopy with first-principles calculations - a guide to NMR crystallography. Chem. Commun. 2016, 52, 7186–7204. 10.1039/c6cc02542k. [DOI] [PubMed] [Google Scholar]
- Szell P. M. J.; Nilsson Lill S. O.; Blade H.; Brown S. P.; Hughes L. P. A toolbox for improving the workflow of NMR crystallography. Solid State Nucl. Magn. Reson. 2021, 116, 101761. 10.1016/j.ssnmr.2021.101761. [DOI] [PubMed] [Google Scholar]
- Czernek J.; Urbanova M.; Brus J. NMR Crystallography of the Polymorphs of Metergoline. Crystals 2018, 8, 378. 10.3390/cryst8100378. [DOI] [Google Scholar]
- Salager E.; Stein R. S.; Pickard C. J.; Elena B.; Emsley L. Powder NMR crystallography of thymol. Phys. Chem. Chem. Phys. 2009, 11, 2610–2621. 10.1039/b821018g. [DOI] [PubMed] [Google Scholar]
- Salager E.; Day G. M.; Stein R. S.; Pickard C. J.; Elena B.; Emsley L. Powder crystallography by combined crystal structure prediction and high-resolution 1H solid-state NMR spectroscopy. J. Am. Chem. Soc. 2010, 132, 2564–2566. 10.1021/ja909449k. [DOI] [PubMed] [Google Scholar]
- Dračínský M.; Vícha J.; Bártová K.; Hodgkinson P. Towards Accurate Predictions of Proton NMR Spectroscopic Parameters in Molecular Solids. ChemPhysChem 2020, 21, 2075–2083. 10.1002/cphc.202000629. [DOI] [PubMed] [Google Scholar]
- Braun D. E.; McMahon J. A.; Bhardwaj R. M.; Nyman J.; Neumann M. A.; van de Streek J.; Reutzel-Edens S. M. Inconvenient Truths about Solid Form Landscapes Revealed in the Polymorphs and Hydrates of Gandotinib. Cryst. Growth Des. 2019, 19, 2947–2962. 10.1021/acs.cgd.9b00162. [DOI] [Google Scholar]
- Dudek M. K.; Śniechowska J.; Wróblewska A.; Kaźmierski S.; Potrzebowski M. J. Cocrystals “Divorce and Marriage”: When a Binary System Meets an Active Multifunctional Synthon in a Ball Mill. Chem.—Eur. J. 2020, 26, 13264–13273. 10.1002/chem.202002238. [DOI] [PubMed] [Google Scholar]
- Martini F.; Geppi M.; Barcaro G.; Monti S.; Contiero L.; Ruggeri G.; Lessi M.; Pucci A.; Bellina F.; Borsacchi S. Structure and Dynamics of Perylene Bisimide Pigments for “Cool” Organic Coatings by Solid-State NMR: A Combined Experimental and DFT Study. J. Phys. Chem. C 2020, 124, 17971–17980. 10.1021/acs.jpcc.0c04940. [DOI] [Google Scholar]
- Nartowski K. P.; Karabin J.; Morritt A. L.; Nowak M.; Fábián L.; Karolewicz B.; Khimyak Y. Z. Solvent driven phase transitions of acyclovir - the role of water and solvent polarity. Crystengcomm 2019, 21, 2180–2192. 10.1039/c8ce01814f. [DOI] [Google Scholar]
- Nartowski K. P.; Malhotra D.; Hawarden L. E.; Fábián L.; Khimyak Y. Z. Nanocrystallization of Rare Tolbutamide Form V in Mesoporous MCM-41 Silica. Mol. Pharm. 2018, 15, 4926–4932. 10.1021/acs.molpharmaceut.8b00575. [DOI] [PubMed] [Google Scholar]
- Pohl R.; Socha O.; Slavíček P.; Šála M.; Hodgkinson P.; Dračínský M. Proton transfer in guanine-cytosine base pair analogues studied by NMR spectroscopy and PIMD simulations. Faraday Discuss. 2018, 212, 331–344. 10.1039/c8fd00070k. [DOI] [PubMed] [Google Scholar]
- Facey G. A.; Connolly T. J.; Bensimon C.; Durst T. A solid state NMR and X-ray crystallographic investigation of dynamic disorder in solid tetrahydronaphthalene derivatives. Can. J. Chem. 1996, 74, 1844–1851. 10.1139/v96-206. [DOI] [Google Scholar]
- Szell P. M. J.; Lewandowski J. R.; Blade H.; Hughes L. P.; Nilsson Lill S. O.; Brown S. P. Taming the dynamics in a pharmaceutical by cocrystallization: investigating the impact of the coformer by solid-state NMR. CrystEngComm 2021, 23, 6859–6870. 10.1039/d1ce01084k. [DOI] [Google Scholar]
- Brown S. P.; Spiess H. W. Advanced solid-state NMR methods for the elucidation of structure and dynamics of molecular, macromolecular, and supramolecular systems. Chem. Rev. 2001, 101, 4125–4156. 10.1021/cr990132e. [DOI] [PubMed] [Google Scholar]
- Paudel A.; Geppi M.; Mooter G. V. D. Structural and dynamic properties of amorphous solid dispersions: the role of solid-state nuclear magnetic resonance spectroscopy and relaxometry. J. Pharm. Sci. 2014, 103, 2635–2662. 10.1002/jps.23966. [DOI] [PubMed] [Google Scholar]
- Matlahov I.; van der Wel P. C. A. Hidden motions and motion-induced invisibility: Dynamics-based spectral editing in solid-state NMR. Methods 2018, 148, 123–135. 10.1016/j.ymeth.2018.04.015. [DOI] [PMC free article] [PubMed] [Google Scholar]
- Apperley D. C.; Markwell A. F.; Frantsuzov I.; Ilott A. J.; Harris R. K.; Hodgkinson P. NMR characterisation of dynamics in solvates and desolvates of formoterol fumarate. Phys. Chem. Chem. Phys. 2013, 15, 6422–6430. 10.1039/c3cp50180a. [DOI] [PubMed] [Google Scholar]
- Kong X.; O’Dell L. A.; Terskikh V.; Ye E.; Wang R.; Wu G. Variable-temperature 17O NMR studies allow quantitative evaluation of molecular dynamics in organic solids. J. Am. Chem. Soc. 2012, 134, 14609–14617. 10.1021/ja306227p. [DOI] [PubMed] [Google Scholar]
- Ilott A. J.; Palucha S.; Batsanov A. S.; Wilson M. R.; Hodgkinson P. Elucidation of structure and dynamics in solid octafluoronaphthalene from combined NMR, diffraction, and molecular dynamics studies. J. Am. Chem. Soc. 2010, 132, 5179–5185. 10.1021/ja910526z. [DOI] [PubMed] [Google Scholar]
- Cosgrove S. D.; Steele G.; Austin T. K.; Plumb A. P.; Stensland B.; Ferrari E.; Roberts K. J. Understanding the polymorphic behavior of sibenadet hydrochloride through detailed studies integrating structural and dynamical assessment. J. Pharm. Sci. 2005, 94, 2403–2415. 10.1002/jps.20412. [DOI] [PubMed] [Google Scholar]
- Carignani E.; Borsacchi S.; Blasi P.; Schoubben A.; Geppi M. Dynamics of Clay-Intercalated Ibuprofen Studied by Solid State Nuclear Magnetic Resonance. Mol. Pharm. 2019, 16, 2569–2578. 10.1021/acs.molpharmaceut.9b00160. [DOI] [PubMed] [Google Scholar]
- Pawlak T.; Sudgen I.; Bujacz G.; Iuga D.; Brown S. P.; Potrzebowski M. J. Synergy of Solid-State NMR, Single-Crystal X-ray Diffraction, and Crystal Structure Prediction Methods: A Case Study of Teriflunomide (TFM). Cryst. Growth Des. 2021, 21, 3328–3343. 10.1021/acs.cgd.1c00123. [DOI] [PMC free article] [PubMed] [Google Scholar]
- Copley R. C. B.; Barnett S. A.; Karamertzanis P. G.; Harris K. D. M.; Kariuki B. M.; Xu M. C.; Nickels E. A.; Lancaster R. W.; Price S. L. Predictable disorder versus polymorphism in the rationalization of structural diversity: A multidisciplinary study of eniluracil. Cryst. Growth Des. 2008, 8, 3474–3481. 10.1021/cg800517h. [DOI] [Google Scholar]
- Dračínský M.; Bouř P.; Hodgkinson P. Temperature Dependence of NMR Parameters Calculated from Path Integral Molecular Dynamics Simulations. J. Chem. Theory Comput. 2016, 12, 968–973. 10.1021/acs.jctc.5b01131. [DOI] [PubMed] [Google Scholar]
- Dračínský M.; Hodgkinson P. A molecular dynamics study of the effects of fast molecular motions on solid-state NMR parameters. CrystEngComm 2013, 15, 8705–8712. 10.1039/c3ce40612a. [DOI] [Google Scholar]
- Bis J. A.; Boyle P. D.; Carino S. A. R.; Igo D. H.; Katrincic L. M. Crystallization and Solid-State Characterization of the Hemihydrate of Albuterol Hemisulfate. Cryst. Growth Des. 2014, 14, 775–782. 10.1021/cg4016405. [DOI] [Google Scholar]
- Groom C. R.; Bruno I. J.; Lightfoot M. P.; Ward S. C. The Cambridge Structural Database. Acta Crystallogr., Sect. B: Struct. Sci. 2016, 72, 171–179. 10.1107/S2052520616003954. [DOI] [PMC free article] [PubMed] [Google Scholar]
- Paluch K. J.; Tajber L.; Elcoate C. J.; Corrigan O. I.; Lawrence S. E.; Healy A. M. Solid-state characterization of novel active pharmaceutical ingredients: cocrystal of a salbutamol hemiadipate salt with adipic acid (2:1:1) and salbutamol hemisuccinate salt. J. Pharm. Sci. 2011, 100, 3268–3283. 10.1002/jps.22569. [DOI] [PubMed] [Google Scholar]
- Aitipamula S.; Wong A. B. H.; Chow P. S.; Tan R. B. H. Novel solid forms of oxaprozin: cocrystals and an extended release drug-drug salt of salbutamol. RSC Adv. 2016, 6, 34110–34119. 10.1039/c6ra01802e. [DOI] [Google Scholar]
- Leger J. M.; Goursolle M.; Gadret M.; Carpy A. Structure cristalline du sulfate de salbutamol [tert-butylamino-2 (hydroxy-4 hydroxymethyl-3 phenyl)-1 ethanol.0.5H2SO4]. Acta Crystallogr., Sect. B: Struct. Crystallogr. Cryst. Chem. 1978, 34, 1203–1208. 10.1107/S056774087800521X. [DOI] [Google Scholar]
- Sheldrick G. A short history of SHELX. Acta Crystallogr. 2008, 64, 112–122. 10.1107/S0108767307043930. [DOI] [PubMed] [Google Scholar]
- Sheldrick G. Crystal structure refinement with SHELXL. Acta Crystallogr. 2015, 71, 3–8. 10.1107/S2053229614024218. [DOI] [PMC free article] [PubMed] [Google Scholar]
- Metz G.; Wu X. L.; Smith S. O. Ramped-Amplitude Cross Polarization in Magic-Angle-Spinning NMR. J. Magn. Reson., Ser. A 1994, 110, 219–227. 10.1006/jmra.1994.1208. [DOI] [Google Scholar]
- Fung B. M.; Khitrin A. K.; Ermolaev K. An improved broadband decoupling sequence for liquid crystals and solids. J. Magn. Reson. 2000, 142, 97–101. 10.1006/jmre.1999.1896. [DOI] [PubMed] [Google Scholar]
- Potrzebowski M. J.; Tekely P.; Dusausoy Y. Comment to 13C-NMR studies of alpha and gamma polymorphs of glycine. Solid State Nucl. Magn. Reson. 1998, 11, 253–257. 10.1016/s0926-2040(98)00028-9. [DOI] [PubMed] [Google Scholar]
- Morcombe C. R.; Zilm K. W. Chemical shift referencing in MAS solid state NMR. J. Magn. Reson. 2003, 162, 479–486. 10.1016/s1090-7807(03)00082-x. [DOI] [PubMed] [Google Scholar]
- Thurber K. R.; Tycko R. Measurement of sample temperatures under magic-angle spinning from the chemical shift and spin-lattice relaxation rate of 79Br in KBr powder. J. Magn. Reson. 2009, 196, 84–87. 10.1016/j.jmr.2008.09.019. [DOI] [PMC free article] [PubMed] [Google Scholar]
- Hayashi S.; Hayamizu H. Chemical shift standards in high-resolution solid-state NMR (1) 13C, 29Si, and 1H nuclei. Bull. Chem. Soc. Jpn. 1991, 64, 685–687. 10.1246/bcsj.64.685. [DOI] [Google Scholar]
- Hohenberg P.; Kohn W. Inhomogeneous Electron Gas. Phys. Rev. 1964, 136, B864. 10.1103/PhysRev.136.B864. [DOI] [Google Scholar]
- Kohn W.; Sham L. J. Self-consistent equations including exchange and correlation effects. Phys. Rev. 1965, 140, A1133–A1138. 10.1103/physrev.140.a1133. [DOI] [Google Scholar]
- Payne M. C.; Teter M. P.; Allan D. C.; Arias T. A.; Joannopoulos J. D. Iterative minimization techniques for ab initio total-energy calculations - molecular-dynamics and conjugate gradients. Rev. Mod. Phys. 1992, 64, 1045–1097. 10.1103/revmodphys.64.1045. [DOI] [Google Scholar]
- Pickard C. J.; Mauri F. All-electron magnetic response with pseudopotentials: NMR chemical shifts. Phys. Rev. B: Condens. Matter Mater. Phys. 2001, 63, 245101. 10.1103/physrevb.63.245101. [DOI] [Google Scholar]
- Clark S. J.; Segall M. D.; Pickard C. J.; Hasnip P. J.; Probert M. I. J.; Refson K.; Payne M. C. First principles methods using CASTEP. Z. Kristallogr. Krist. 2005, 220, 567–570. 10.1524/zkri.220.5.567.65075. [DOI] [Google Scholar]
- BIOVIA Materials Studio 2017; Dassault Systèmes, 2017. http://www.3ds.com (accessed June 11, 2021).
- Tatton A. S.CASTEP calculations using Materials Studio, 2020. http://www.ccpnc.ac.uk/docs/materials-studio-bulk (accessed June 11, 2021).
- Perdew J. P.; Burke K.; Ernzerhof M. Generalized Gradient Approximation Made Simple. Phys. Rev. Lett. 1996, 77, 3865–3868. 10.1103/PhysRevLett.77.3865. [DOI] [PubMed] [Google Scholar]
- Tkatchenko A.; Scheffler M. Accurate Molecular Van Der Waals Interactions from Ground-State Electron Density and Free-Atom Reference Data. Phys. Rev. Lett. 2009, 102, 073005. 10.1103/physrevlett.102.073005. [DOI] [PubMed] [Google Scholar]
- Paruzzo F. M.; Hofstetter A.; Musil F.; De S.; Ceriotti M.; Emsley L. Chemical shifts in molecular solids by machine learning. Nat. Commun. 2018, 9, 4501. 10.1038/s41467-018-06972-x. [DOI] [PMC free article] [PubMed] [Google Scholar]
- Hartman J. D.; Kudla R. A.; Day G. M.; Mueller L. J.; Beran G. J. O. Benchmark fragment-based 1H, 13C, 15N and 17O chemical shift predictions in molecular crystals. Phys. Chem. Chem. Phys. 2016, 18, 21686–21709. 10.1039/c6cp01831a. [DOI] [PMC free article] [PubMed] [Google Scholar]
- Rozas I.; Alkorta I.; Elguero J. Bifurcated hydrogen bonds: Three-centered interactions. J. Phys. Chem. A 1998, 102, 9925–9932. 10.1021/jp9824813. [DOI] [Google Scholar]
- Liu W.; Chen Q.; Yu L. Crystal structure of rac-4-[2-(tert-butylazaniumyl)-1-hydroxyethyl]-2-(hydroxymethyl)phenol benzoate. Acta Crystallogr., Sect. E: Crystallogr. Commun. 2017, 73, 1333–1335. 10.1107/S2056989017011513. [DOI] [PMC free article] [PubMed] [Google Scholar]
- Klapwijk A.Disorder levels in 5-chlorouracil. Disorder and additive control of solid form and morphology in continuous crystallisation; University of Bath, 2017; pp 264–265. [Google Scholar]
- Corlett E. K.; Blade H.; Hughes L. P.; Sidebottom P. J.; Walker D.; Walton R. I.; Brown S. P. Investigating discrepancies between experimental solid-state NMR and GIPAW calculation: N=C-N 13C and OH···O 1H chemical shifts in pyridinium fumarates and their cocrystals. Solid State Nucl. Magn. Reson. 2020, 108, 101662. 10.1016/j.ssnmr.2020.101662. [DOI] [PubMed] [Google Scholar]
- Harris R. K.; Hodgkinson P.; Pickard C. J.; Yates J. R.; Zorin V. Chemical shift computations on a crystallographic basis: some reflections and comments. Magn. Reson. Chem. 2007, 45, S174–S186. 10.1002/mrc.2132. [DOI] [PubMed] [Google Scholar]
- Bonhomme C.; Gervais C.; Babonneau F.; Coelho C.; Pourpoint F.; Azaïs T.; Ashbrook S. E.; Griffin J. M.; Yates J. R.; Mauri F.; et al. First-principles calculation of NMR parameters using the gauge including projector augmented wave method: a chemist’s point of view. Chem. Rev. 2012, 112, 5733–5779. 10.1021/cr300108a. [DOI] [PubMed] [Google Scholar]
- SOLA—Solid Lineshape Analysis, 2013. (as implemented in TOPSPIN, accessed June 11, 2021).
- López C.; Claramunt R. M.; Elguero J. Oxalic acid/phenols and oxalic acid/cholesterol co-crystals: a solid state 13C CPMAS NMR study. ARKIVOC 2008, 33–46. 10.3998/ark.5550190.0009.405. [DOI] [Google Scholar]
- Riddell F. G.; Rogerson M. The Doubletert-Butyl Rotation in Solidcis-2-tert-Butyl-5-(tert-butylsulphonyl)-1,3-dioxane. Magn. Reson. Chem. 1997, 35, 333–336. . [DOI] [Google Scholar]
- Riddell F. G.; Bernath G.; Fueloep F. Phase Dependence of Conformational Motions in Solids. The tert-Butyl Rotation in (1R*,2S*,5R*)-5-tert-Butyl-2-hydroxycyclopentanecarboxylic Acid. J. Am. Chem. Soc. 1995, 117, 2327–2335. 10.1021/ja00113a022. [DOI] [Google Scholar]
- Riddell F. G.; Arumugam S.; Harris K. D. M.; Rogerson M.; Strange J. H. A carbon-13 CP/MAS NMR study of a double tert-butyl group rotation in the solid state using T1ρ and line shape measurements. J. Am. Chem. Soc. 1993, 115, 1881–1885. 10.1021/ja00058a037. [DOI] [Google Scholar]
- Yan Y.; Kariuki B. M.; Hughes C. E.; Logsdail A. J.; Harris K. D. M. Polymorphism in a Multicomponent Crystal System of Trimesic Acid and t-Butylamine. Cryst. Growth Des. 2020, 20, 5736–5744. 10.1021/acs.cgd.0c00163. [DOI] [Google Scholar]
- Beckmann P. A.; Al-Hallaq H. A.; Fry A. M.; Plofker A. L.; Roe B. A.; Weiss J. A. Solid state proton spin relaxation and methyl and t-butyl reorientation. J. Chem. Phys. 1994, 100, 752–753. 10.1063/1.466946. [DOI] [Google Scholar]
Associated Data
This section collects any data citations, data availability statements, or supplementary materials included in this article.