Abstract
The zebrafish (Danio rerio) is an ideal model for whole animal studies of lipid metabolism and lipid-related disease. In this work, infrared matrix-assisted laser desorption electrospray ionization (IR-MALDESI) mass spectrometry imaging (MSI) was applied for direct visualization of lipid and metabolite distributions across various organs in whole-body zebrafish tissue sections. Detailed methods for overcoming the challenges of cryosectioning adult male zebrafish for MSI and complimentary histological imaging are described. Representative two-dimensional ion maps demonstrated organ specific localization of lipid analytes allowing for visualization of areas of interest including the brain, liver, intestines and skeletal muscle. A high resolving power mass spectrometer was utilized for accurate mass measurements, which permitted the use of open-source, web-based tools for MS1 annotations including METASPACE and METLIN. Whole-body MSI with IR-MALDESI allowed for broad lipid coverage with high spatial resolution, illustrating the potential of this technique for studying lipid-related diseases using zebrafish as a model organism.
Keywords: Zebrafish, Mass Spectrometry Imaging, Cryosectioning, IR-MALDESI, Lipids
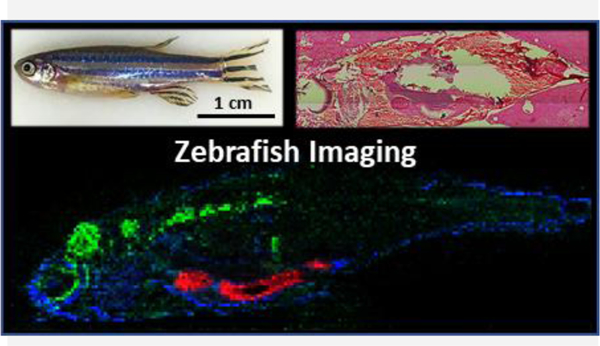
Graphical Abstract

Mass Spectrometry Imaging of Whole-Body Zebrafish
Introduction
Zebrafish (Danio rerio) are an important model vertebrate system for studying lipid metabolism and lipid-related diseases. With a fully sequenced and well annotated genome and sharing similar gene sequences and organ systems present in humans, the zebrafish is becoming increasingly utilized as a translational model for human disease.1, 2 Mass spectrometry imaging (MSI) is a well-established technique for studying the spatial distributions of biomolecules to gain a deeper understanding of the biological mechanisms involved in metabolic dysfunction and disease. Two recent studies have demonstrated the utility of MSI for exploring the zebrafish lipidome during embryonic development.3, 4 In adult zebrafish, MSI has been applied for spatially resolving lipids as well as other endogenous and exogenous compounds.5–7 These studies have employed ambient and in vacuo ionization techniques including, desorption electrospray ionization (DESI), matrix-assisted laser desorption/ionization (MALDI), and time-of-flight secondary ion mass spectrometry (TOF-SIMs). Although not previously applied to zebrafish, infrared matrix-assisted laser desorption electrospray ionization (IR-MALDESI) allows for whole-body imaging in ambient conditions with minimal sample preparation, as described using a neonatal mouse model.8, 9 For whole-body zebrafish imaging, embedding is commonly used to maintain tissue integrity during sectioning. As described previously, adult male zebrafish pose a significant challenge for cryosectioning due to their large air-filled swim bladder and absence of ovaries to provide support to the abdominal wall during sectioning. Thus, gender and life stage impact the quality of whole-body sections from these fish, with gravid females providing ideal sections for imaging.10 However, some studies may require adult male zebrafish, for which limited MSI sample preparation details have been reported. Herein, the optimized sectioning method previously described by Nelson et al. was adapted for adult males, 6-months post-fertilization. The purpose of this work is to describe the methods utilized for successful cryosectioning and imaging of adult male zebrafish for spatial lipidomics and metabolomics studies. Furthermore, the selectivity offered by high-resolution accurate mass measurements are highlighted.
Experimental
Zebrafish Husbandry and Maintenance.
All zebrafish in this study were maintained according to standard protocols approved by the North Carolina State University Institutional Animal Care and Use Committee. Adult zebrafish were maintained at appropriate densities in 9 L tanks as part of a recirculating aquatics system under a 14:10 h light:dark cycle. Water temperature was maintained at 28.5±0.5 °C with a pH between 6.8 and 7.5. Only male zebrafish 6-months post fertilization were used in this study.
Sample Preparation.
Prior to the experiment, selected male zebrafish underwent a 24-h starvation. On the day of the experiment, the zebrafish were euthanized in cold water chilled on ice prior to embedding.11 Average time before quietus was <20 s. Additional information, including the standard operating procedure (S1) and workflow schematic (Figure S1) are provided as supporting information.
Media Preparation.
Media preparation closely followed the protocol published by Nelson et al.10 A 5% carboxymethyl cellulose (CMC) + 10% gelatin solution was prepared by mixing 1 g of powdered CMC with 2 g of powdered gelatin in a 50 mL conical tube prior to adding Milli-Q water. It is important to note that two different gelatins were tested, Sigma gelatin from porcine skin, type A (G1890) and Sigma gelatin from bovine skin, type B (G9391), but only samples embedded in G1890 provided successful sections. Once the dry powders were mixed, 20 mL of Milli-Q water was added to the conical tube and the media was vortexed for 30 s. The conical tube was then placed upright in a 100 mL beaker with the cap removed. The media was heated in a microwave in 4 s intervals until the media became liquefied. It helped to stir the media periodically in-between heating intervals. The entire heating process took 30–40 s. The tube was then removed from the microwave and placed in a 115 °C water bath to maintain liquid state. To prevent solidification, the media was periodically stirred while in the water bath. The media remained in the water bath for approximately 15 min before the first fish was embedded.
Embedding and Cryosectioning.
Before fish were embedded, the cryostat (Leica CM 1950, Buffalo Grove, IL, USA) was cooled to −20 °C and all components were thoroughly cleaned and checked for nicks or scratches; any uneven surface along the blade or glass plate will cause tearing and poor sectioning. Cryostat specimen discs were removed from the cryostat prior to cooling and kept at room temperature. During the cooling phase and throughout the sectioning process, the light inside of the cryostat was kept OFF. Having the light on was found to heat the sample and embedding media creating a tackier texture that was harder to section. Once the media had been in the water bath for approximately 15 min, the first fish was euthanized in cold water chilled on ice to begin the embedding process. Next a small amount of media was poured into a Peel-A-Way mold to form a uniform layer across the entire bottom of the mold. Any large bubbles were popped with clean forceps. The fish was then removed from the euthanization water, dried with a paper towel, and placed on top of the media layer with forceps. Using the forceps, the fish was then positioned so that it was laying completely flat along the bottom of the Peel-A-Way mold. Once the fish was correctly positioned, additional media was poured on top of the fish to complete embedding, and again any large bubbles were removed with forceps. The mold with the fish was then placed in an aluminum cup and placed in a Styrofoam cooler containing a dry ice/ethanol (EtOH) bath (1:1 ratio of crushed dry ice and 95% EtOH).10 It took approximately 15 min for the entire mold to freeze. Once the embedding media was completely frozen, the embedded fish was removed from the Peel-A-Way mold and placed on a room temperature specimen disc using a small amount of optimal cutting temperature (OCT) mounting medium. Together, the fish and disc were placed inside the cooled cryostat so that the OCT could freeze, adhering the embedded fish to the specimen disc. Parasagittal sections were collected by positioning the embedded zebrafish ventral side up. Initially, 30 µm sections were taken to pare down the fish to the region of interest. Once the region of interest was reached, 16 µm serial sections were collected by thaw-mounting onto a pre-cleaned glass microscope slide or HistoBond slide for MALDESI MSI and histology, respectively.
Histology.
Tissue sections were fixed in 10% neutral buffered formalin (NBF) overnight. Slides were then rinsed in DI water followed by 30 s rinses in 95% EtOH, 70% EtOH, and DI water. For 45 s, slides were stained with hematoxylin followed by 30 s rinses in DI water, 70% EtOH, and 95% EtOH respectively. For 1 min, slides were stained with eosin followed by 30 s rinses in 95% EtOH and 100% EtOH respectively. The slides were then soaked in xylenes for 2 min prior to covering the section with Permount medium and a cover slip. Microscope images were acquired with 5× magnification on a LMD7000 (Leica, Buffalo Grove, IL, USA).
Instrumental Analysis.
IR-MALDESI experiments were performed as previously described with few modifications.8 Prior to analysis, a thin layer of ice was deposited on the tissue surface to serve as an energy-absorbing matrix. MSI experiments utilized a 2,940 nm mid-IR laser (IR-Opolette 2371; Opotek, Carlsbad, CA, USA) with a pulse frequency of 20 Hz. All data were acquired using a laser shot spacing of 100 µm, approximately equal to the laser ablation spot diameter, providing a spatial resolution of ~100 µm. Each spectrum was acquired using one laser pulse per voxel and a 25 ms maximum ion injection time. The electrospray solvent composition was 50:50 (v/v) methanol:water with 0.2% formic acid and a flow rate of 1–1.5 µL/min was optimized for spray stability on the day of analysis. Spectra were acquired in both positive and negative ionization modes at a resolving power of 140,000 (full width at half maximum, m/z 200) using a Q Exactive Plus mass spectrometer (Thermo Fisher Scientific, Bremen, Germany). The scan range was set to m/z 300–1,200 and m/z 200–800 for positive and negative ionization modes, respectively, and the S-lens RF level was set at 50%. For positive mode data acquisition the electrospray voltage was set at 3.8 kV and the capillary temperature at 320 °C; for negative mode these parameters were 3.2 kV and 275 °C. High resolution MSI data were processed using MSiReader v1.0112 for visualization and peak list generation, whereas METLIN13 and METASPACE14 were employed for database searching and compound annotation. All images presented were generated using a ± 2.5 ppm tolerance.
Results and Discussion
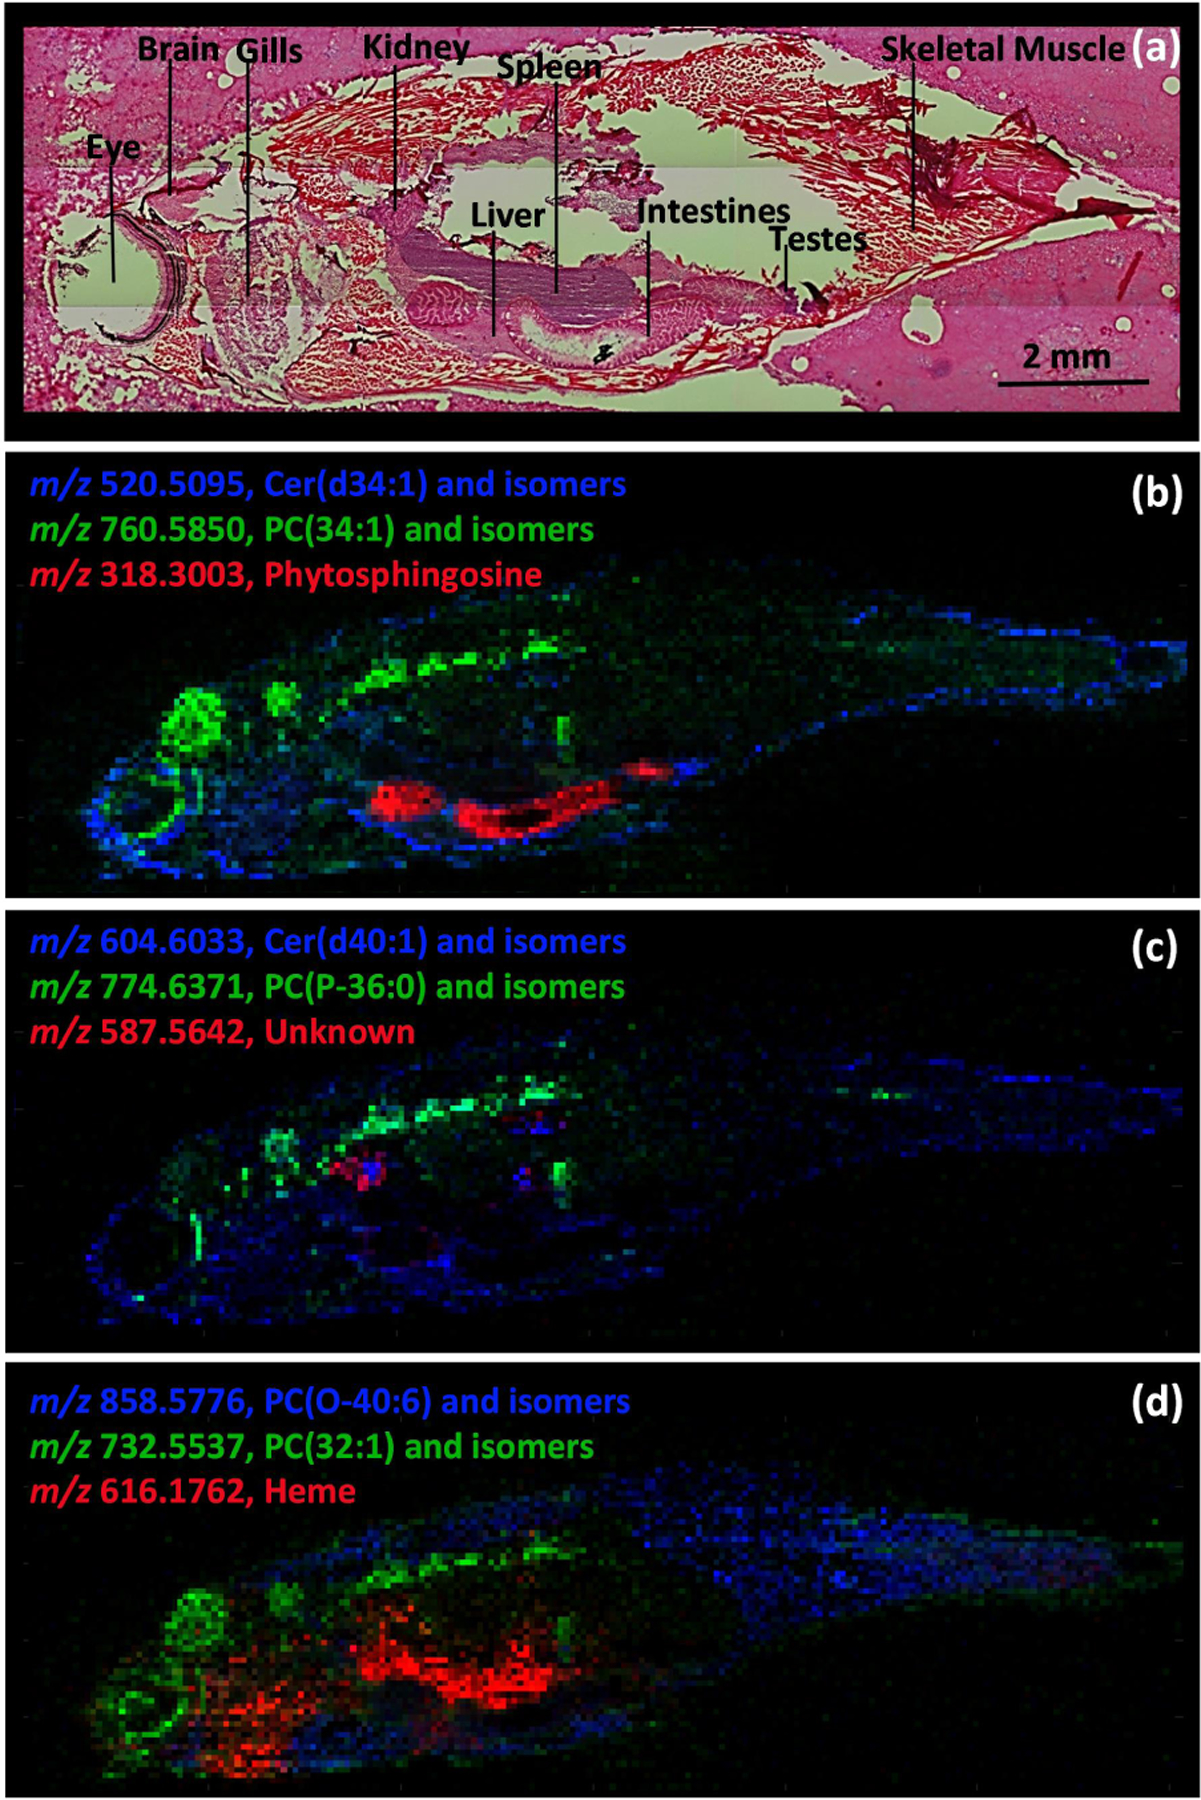
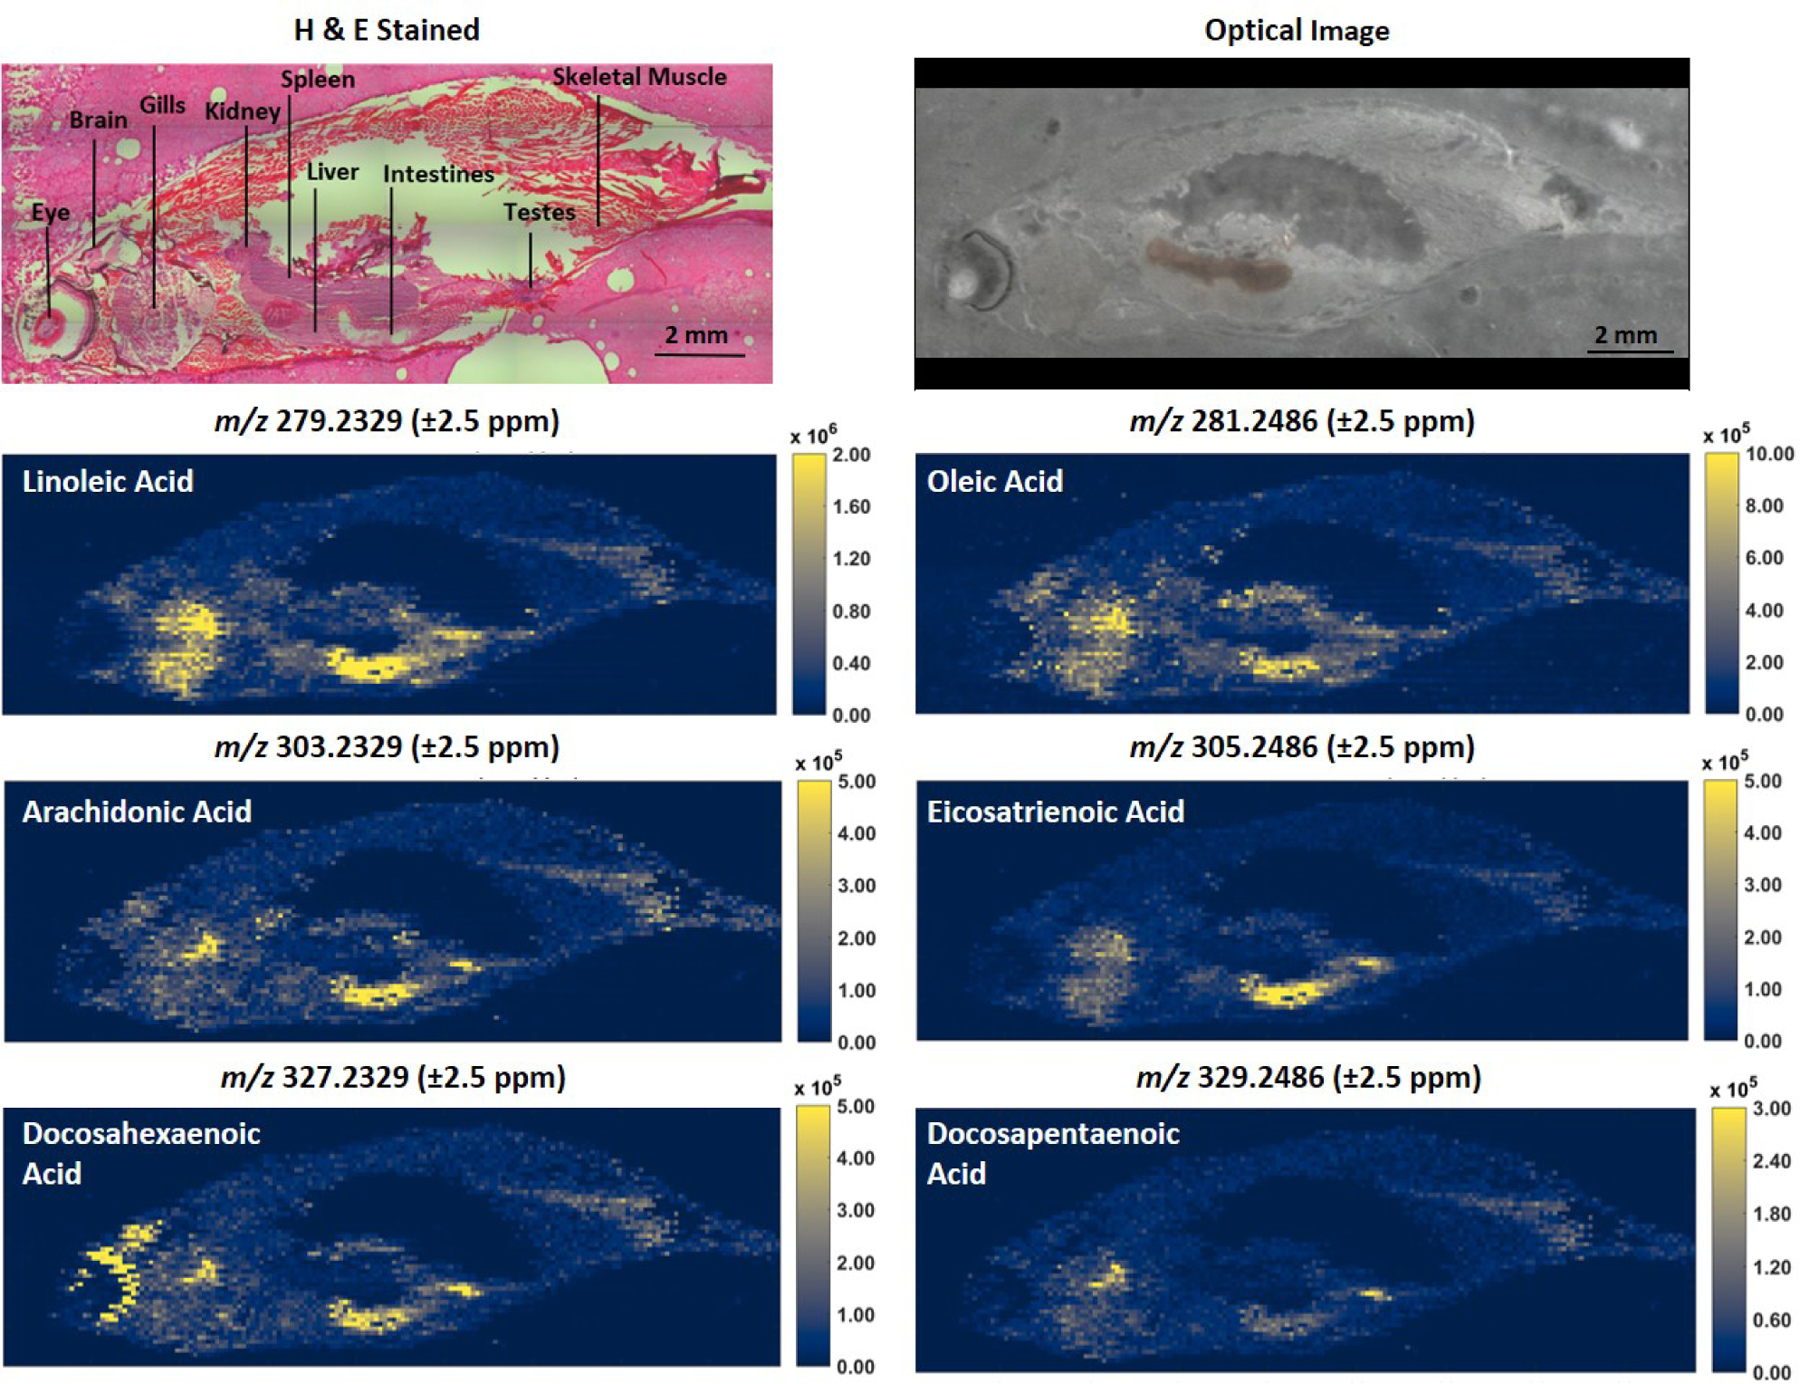
In this work, IR-MALDESI MSI was used to visualize the spatial distributions of lipids and metabolites in whole-body adult zebrafish. Representative ion maps shown in Figure 1 were generated using the Colocalization Tool in MSiReader and illustrate the utility of this approach for spatially resolving analytes across various organs and tissues by MSI. H & E stained serial sections reflect the quality of cryosections obtained following the method detailed above and provide a reference for identifying specific organs and tissues in the MSI ion maps. Specific compound classes can also be queried, as illustrated in Figure 2 for fatty acyls detected in negative ion mode. These heatmaps show similar distributions, with a high relative abundance in the intestines; however, differences in ion abundance in the brain, eye and gills are notable. Although lipids accounted for most of the ions observed, various small molecule metabolites were also readily detected. High resolution accurate mass spectra from nine parasagittal whole-body sections (5 acquired in negative ionization mode and 4 acquired in positive ionization mode) were uploaded to METASPACE and searched using the LipidMaps-2017-12-12 and HMDB_v4 databases. The results are public at https://metaspace2020.eu/project/Stutts-2020-Zebrafish. Molecular formula annotations were performed using the false discovery rate (FDR)-controlled algorithm in METASPACE.14 Only annotations classified as “on-sample” were exported.15 After exporting and combining annotations from both polarities and databases using an FDR of 5%, unique chemical formulas were filtered in Excel and yielded 764 annotations. Increasing the FDR to 10% resulted in 1658 unique annotations. Some ion types such as [M+H−H2O]+, detected for ceramides, were not annotated by METASPACE, but were annotated using METLIN. This untargeted MS1 profiling workflow is ideal for discovery-based spatial metabolomics studies without the requirement for analyte extraction or advanced separations. Various compound classes were detected including fatty acyls, glycerolipids, glycerophospholipids, prenol lipids, sphingolipids, sterol lipids and numerous metabolites. For enhanced selectivity and improved confidence in annotations, targeted MS2 can be performed on ions of interest using serial sections.
Figure 1.

Histology (a) and colocalization maps of representative lipids and metabolites in adult male zebrafish: (b) skin/testes (blue), brain/eye/spinal cord (green), intestines (red), (c) liver/kidney/skin (blue), spinal cord (green), kidney (red), and (d) skeletal muscle (blue), brain/eye/spinal cord (green), gills/spleen (red). Phosphatidylcholines and ceramides are abbreviated PC and Cer, respectively.
Figure 2.

Ion heatmaps of deprotonated fatty acyls in adult male zebrafish. Optical images of the MSI tissue section coated with ice and serial section stained by H & E are shown for histological context.
Conclusions
This work is the first application of IR-MALDESI coupled with high-resolution mass spectrometry for visualizing the spatial distributions of metabolites and lipids in whole-body zebrafish sections. To preserve tissue integrity, a modified embedding and sectioning method was developed for adult male zebrafish and was critical for obtaining high quality tissue sections for MSI. Future work will apply these methods to study alterations in lipid and metabolite distributions in adult male zebrafish placed on engineered diets.
Supplementary Material
Acknowledgments
All mass spectrometry measurements were made in the Molecular Education, Technology, and Research Innovation Center (METRIC) at NC State University. The authors gratefully acknowledge the financial support received from the National Institutes of Health (R01GM087964), the National Institute of Environmental Health Sciences, North Carolina State University, Center for Human Health and the Environment (P30ES025128) and (T32ES007046), and the Environmental Protection Agency (STAR 835541). The authors also thank Ken Garrard for providing MSiReader support.
Footnotes
Supporting Information Available: Standard operating procedure and workflow diagram.
Reference
- 1.Anderson JL; Carten JD; Farber SA, Zebrafish lipid metabolism: from mediating early patterning to the metabolism of dietary fat and cholesterol. Methods Cell Biol 2011, 101, 111–41. [DOI] [PMC free article] [PubMed] [Google Scholar]
- 2.Oka T; Nishimura Y; Zang L; Hirano M; Shimada Y; Wang Z; Umemoto N; Kuroyanagi J; Nishimura N; Tanaka T, Diet-induced obesity in zebrafish shares common pathophysiological pathways with mammalian obesity. BMC Physiol 2010, 10, 21. [DOI] [PMC free article] [PubMed] [Google Scholar]
- 3.Duenas ME; Essner JJ; Lee YJ, 3D MALDI Mass Spectrometry Imaging of a Single Cell: Spatial Mapping of Lipids in the Embryonic Development of Zebrafish. Sci Rep 2017, 7 (1), 14946. [DOI] [PMC free article] [PubMed] [Google Scholar]
- 4.Pirro V; Guffey SC; Sepulveda MS; Mahapatra CT; Ferreira CR; Jarmusch AK; Cooks RG, Lipid dynamics in zebrafish embryonic development observed by DESI-MS imaging and nanoelectrospray-MS. Mol Biosyst 2016, 12 (7), 2069–79. [DOI] [PMC free article] [PubMed] [Google Scholar]
- 5.Bruinen AL; Fisher GL; Balez R; van der Sar AM; Ooi L; Heeren RMA, Identification and High-Resolution Imaging of alpha-Tocopherol from Human Cells to Whole Animals by TOF-SIMS Tandem Mass Spectrometry. J Am Soc Mass Spectrom 2018, 29 (8), 1571–1581. [DOI] [PMC free article] [PubMed] [Google Scholar]
- 6.Chramow A; Hamid TS; Eberlin LS; Girod M; Ifa DR, Imaging of whole zebra fish (Danio rerio) by desorption electrospray ionization mass spectrometry. Rapid Commun Mass Spectrom 2014, 28 (19), 2084–8. [DOI] [PubMed] [Google Scholar]
- 7.Perez CJ; Tata A; de Campos ML; Peng C; Ifa DR, Monitoring Toxic Ionic Liquids in Zebrafish (Danio rerio) with Desorption Electrospray Ionization Mass Spectrometry Imaging (DESI-MSI). J Am Soc Mass Spectrom 2017, 28 (6), 1136–1148. [DOI] [PubMed] [Google Scholar]
- 8.Nazari M; Bokhart MT; Muddiman DC, Whole-body Mass Spectrometry Imaging by Infrared Matrix-assisted Laser Desorption Electrospray Ionization (IR-MALDESI). J Vis Exp 2016, (109), e53942. [DOI] [PMC free article] [PubMed] [Google Scholar]
- 9.Robichaud G; Barry JA; Muddiman DC, IR-MALDESI mass spectrometry imaging of biological tissue sections using ice as a matrix. J Am Soc Mass Spectrom 2014, 25 (3), 319–28. [DOI] [PMC free article] [PubMed] [Google Scholar]
- 10.Nelson KA; Daniels GJ; Fournie JW; Hemmer MJ, Optimization of whole-body zebrafish sectioning methods for mass spectrometry imaging. J Biomol Tech 2013, 24 (3), 119–27. [DOI] [PMC free article] [PubMed] [Google Scholar]
- 11.Wilson JM; Bunte RM; Carty AJ, Evaluation of rapid cooling and tricaine methanesulfonate (MS222) as methods of euthanasia in zebrafish (Danio rerio). J Am Assoc Lab Anim Sci 2009, 48 (6), 785–9. [PMC free article] [PubMed] [Google Scholar]
- 12.Bokhart MT; Nazari M; Garrard KP; Muddiman DC, MSiReader v1.0: Evolving Open-Source Mass Spectrometry Imaging Software for Targeted and Untargeted Analyses. J Am Soc Mass Spectrom 2018, 29 (1), 8–16. [DOI] [PMC free article] [PubMed] [Google Scholar]
- 13.Smith CA; O’Maille G; Want EJ; Qin C; Trauger SA; Brandon TR; Custodio DE; Abagyan R; Siuzdak G, METLIN: a metabolite mass spectral database. Ther Drug Monit 2005, 27 (6), 747–51. [DOI] [PubMed] [Google Scholar]
- 14.Palmer A; Phapale P; Chernyavsky I; Lavigne R; Fay D; Tarasov A; Kovalev V; Fuchser J; Nikolenko S; Pineau C; Becker M; Alexandrov T, FDR-controlled metabolite annotation for high-resolution imaging mass spectrometry. Nat Methods 2017, 14 (1), 57–60. [DOI] [PubMed] [Google Scholar]
- 15.Ovchinnikova K; Kovalev V; Stuart L; Alexandrov T, Recognizing off-sample mass spectrometry images with machine and deep learning. bioRxiv, doi: 10.1101/518977. [DOI] [PMC free article] [PubMed] [Google Scholar]
Associated Data
This section collects any data citations, data availability statements, or supplementary materials included in this article.


