

Abstract
Background
Hyperphosphatemia has been associated with coronary artery calcification (CAC) mostly in chronic kidney disease, but the association between phosphate levels within the normal phosphate range and CAC is unclear. Our objectives were to evaluate associations between phosphate levels and CAC among men and women from the general population and assess causality through Mendelian randomization.
Methods and Results
CAC, measured by electron‐beam computed tomography, and serum phosphate levels were assessed in 1889 individuals from the RS (Rotterdam Study). Phenotypic associations were tested through linear models adjusted for age, body mass index, blood pressure, smoking, prevalent cardiovascular disease and diabetes, 25‐hydroxyvitamin D, total calcium, C‐reactive protein, glucose, and total cholesterol : high‐density lipoprotein cholesterol ratio. Mendelian randomization was implemented through an allele score including 8 phosphate‐related single‐nucleotide polymorphisms. In phenotypic analyses, serum phosphate (per 1 SD) was associated with CAC with evidence for sex interaction (P interaction=0.003) (men β, 0.44 [95% CI, 0.30–0.59]; P=3×10⁻⁹; n=878; women β, 0.24 [95% CI, 0.08–0.40]; P=0.003; n=1011). Exclusion of hyperphosphatemia, chronic kidney disease (estimated glomerular filtration rate <60 mL/min per 1.73 m2) and prevalent cardiovascular disease yielded similar results. In Mendelian randomization analyses, instrumented phosphate was associated with CAC (total population β, 0.93 [95% CI: 0.07–1.79]; P=0.034; n=1693), even after exclusion of hyperphosphatemia, chronic kidney disease and prevalent cardiovascular disease (total population β, 1.23 [95% CI, 0.17–2.28]; P=0.023; n=1224).
Conclusions
Serum phosphate was associated with CAC in the general population with stronger effects in men. Mendelian randomization findings support a causal relation, also for serum phosphate and CAC in subjects without hyperphosphatemia, chronic kidney disease, and cardiovascular disease. Further research into underlying mechanisms of this association and sex differences is needed.
Keywords: chronic kidney disease, coronary artery calcification, hyperphosphatemia, Mendelian randomization, phosphate
Subject Categories: Epidemiology; Coronary Artery Disease; Genetic, Association Studies
Nonstandard Abbreviations and Acronyms
- 1,25(OH)2D3
1,25‐dihydroxyvitamin D
- 25(OH)D
25‐hydroxyvitamin D
- ALP
alkaline phosphatase
- FGF23
fibroblast growth factor 23
- GWAS
genome wide association study
- MR
Mendelian randomization
- PR
prevalence ratio
- PTH
parathyroid hormone
- RS
Rotterdam Study
Clinical Perspective.
What Is New?
Higher serum phosphate levels are associated with coronary artery calcifications in the general population, with stronger effects in men.
Mendelian randomization findings support that this association is causal, also for subjects with normal serum phosphate levels and without chronic kidney disease.
What Are the Clinical Implications?
Serum phosphate and coronary artery calcifications are associated in the absence of chronic kidney disease, hyperphosphatemia, and prevalent cardiovascular disease, challenging the concept that only severe hyperphosphatemia, in the setting of chronic kidney disease, is associated with coronary artery calcifications.
Our findings support a causal role for phosphate in the emerging epidemiological findings that higher serum phosphate levels are associated with increased mortality and cardiovascular events in the general population.
Arterial calcification is defined as the deposition of calcium and phosphate in the wall of arteries. 1 , 2 It was considered a passive consequence of aging until identified as a risk factor for cardiovascular events. 3 Current evidence supports that a complex cellular‐mediated process underlies arterial calcification. 4 At least 2 different layers can calcify: the intima, characteristic of atherosclerosis, and the media, typical of chronic kidney disease (CKD). The arterial mineralization process can result in hydroxyapatite [Ca10(PO4)6(OH)2] formation, as is found in bone. Coronary artery calcification (CAC) is one of the most studied calcification processes because of its specificity for atherosclerosis, its correlation to plaque burden 5 and its ability to predict cardiovascular events. 3 , 6 Currently, it is widely accepted that CAC occurs mainly in the intima. 7 Calcification mechanisms are multifactorial, but ectopic bone formation is considered the basis of CAC. 8
Serum phosphate has been related to arterial calcification in several human and animal disorders, 9 , 10 where genetically induced severe hyperphosphatemia leads to extensive calcification. Hyperphosphatemia‐induced calcification was described as the main mechanism of increased mortality in CKD. 11 Similarly, the role of phosphate in CAC has been restricted mainly to hyperphosphatemia. 12 However, Park et al reported an association of serum phosphate and CAC even within the normal phosphate range in Korean subjects with normal renal function. 13 Interestingly, it has been reported that increasing yet normal serum phosphate is also a risk factor for cardiovascular morbidity and mortality in the general population. 14 , 15 These findings have been consistent, although a clear sex difference, with stronger associations in men, became evident. 15 , 16 The mechanisms underlying the associations between serum phosphate and cardiovascular morbidity and mortality and the reported sex differences remain unexplained.
Two non–mutually exclusive mechanisms have been described for serum phosphate in CAC: (1) passive deposition of calcium phosphate, inhibited by pyrophosphate; and (2) active induction of osteoblastic differentiation of vascular cells. 17 Additionally, serum phosphate is regulated by several factors including parathyroid hormone (PTH), 1,25‐dihydroxyvitamin D3 (1,25(OH)2D3) and α‐klotho and fibroblast growth factor 23 (FGF23). PTH and 1,25(OH)2D3 exert inductive effects on arterial calcification. α‐klotho and FGF23 exert protective effects on arterial calcification. 18 , 19 Nevertheless, reports on the association between serum phosphate and CAC in the general population are not consistent as Gronhoj et al did not find an association between serum phosphate and prevalent CAC, but the same group reported an association of serum phosphate with progression of CAC over time. 20 , 21
As literature on serum phosphate and CAC in the general population is scarce and contradictive, 20 , 22 we aimed to analyze this association in the population‐based RS (Rotterdam Study) and test for potential sex differences. Because results from epidemiologic associations can be affected by reverse causation and unmeasured confounding, we also aimed to test for causality applying Mendelian randomization (MR), a statistical technique whereby genetic variants are used as instrumental variables for the exposure with the purpose of avoiding these sources of bias. If the relevant assumptions are valid, significant MR results can be interpreted as evidence of causality of the exposure on the outcome. 23
METHODS
Study Population
The RS is a prospective cohort study of men and women in the district of Ommoord, Rotterdam, designed to investigate the incidence and determinants of chronic disabling diseases. Rationale and design have been described elsewhere. 24 The RS is now composed of 4 cohorts, named RS‐I, RS‐II, RS‐III, and RS‐IV (initiated in 1989, 2000, 2006, and 2017; total n ≈18 000 subjects). Subjects were assessed at baseline and through follow‐up visits. For the current study, we included participants from RS‐I (n=7983). Fasting serum phosphate and CAC were assessed during the second follow‐up visit of RS‐I. A total of 1889 subjects with both measurements available were included in the analyses. The RS was approved by the Medical Ethics Committee of the Erasmus MC (registration number MEC 02.1015) and by the Dutch Ministry of Health, Welfare and Sport (Population Screening Act WBO, license number 1071272‐159521‐PG). The Rotterdam Study was entered into the Netherlands National Trial Register ( www.trialregister.nl ) and into the World Health Organization International Clinical Trials Registry Platform (ICTRP; https://apps.who.int/trialsearch/ ) under shared catalog number NTR6831. All participants provided written informed consent to participate in the study and to have their information obtained from treating physicians. Data can be obtained upon request. Requests should be directed to the management team of the RS (datamanagement.ergo@erasmusmc.nl), which has a protocol for approving data requests. Because of restrictions based on privacy regulations and informed consent of the participants, data cannot be made freely available in a public repository.
Coronary Calcification Assessment
Coronary artery calcification was visualized using electron‐beam computed tomography (C‐150 Imatron Scanner, GE Healthcase, South San Francisco, CA). From the level of the aortic root through the heart, 38 images were obtained with a 100‐ms scan time and a 3‐mm slice thickness. During 1 breath hold, images were acquired at 80% of the cardiac cycle by using echocardiographic triggering. Quantification of coronary calcification was performed with AccuImage software (AccuImage Diagnostics Corporation, South San Francisco, CA). The presence of calcification was defined as a minimum of 2 adjacent pixels (area=0.65 mm2) with a density >130 HU. Following Agatston’s method, calcium scores were calculated by multiplying the area in square meters of individual calcified lesions with a factor based on the peak density of the lesion. 25 The total score for the entire epicardial coronary vascular system comprised the sum of the scores for all individual lesions. Scores were log transformed (+1) to reduce the sensitivity to observations with extremely high CAC values.
Laboratory Measurements
Fasting blood samples were obtained in the second follow‐up visit, and serum phosphate was measured with a method based on the formation of ammonium phosphomolybdate that corresponds to the inorganic fraction of total phosphorus. Total calcium concentrations were assessed through a colorimetric o‐cresolphthalein complex one method (Merck Diagnostica, Amsterdam, the Netherlands). Levels of 25‐hydroxyvitamin D [25(OH)D] were determined through an electrochemiluminescense immunoassay, adjusting for seasonality through cosinor models. Creatinine concentrations were determined through a sarcosine‐based colorimetric assay and standardized. Subsequently, the Chronic Kidney Disease Epidemiology Collaboration equations were applied to estimate glomerular filtration rate. C‐reactive protein, glucose, cholesterol, and alkaline phosphatase (ALP) levels were measured through standard methods. 26 , 27 Ionized calcium was measured through a colorimetric detection assay using a Hitachi 917 (Roche, Mannheim, Germany). Assessments for ALP and ionized calcium were done at baseline visit and are therefore not simultaneous with serum phosphate.
Genotyping
Participants were genotyped in the Illumina HumanHap550 BeadChip SNP array. Variants were filtered on call rate <98%, minor allele frequency <0.01 and Hardy Weinberg equilibrium P<10−6, and imputed to the Haplotype Reference consortium panel, release 1.1. Genetic instruments for serum phosphate were selected from genome‐wide association analysis (GWAS) significant independent single‐nucleotide polymorphisms (SNPs) identified in the European GWAS by Kestenbaum et al and in a Japanese GWAS by Kanai et al. 28 , 29 Variants selected for analyses were checked for Hardy Weinberg equilibrium P>0.05 for genotyped SNPs, imputation quality for imputed SNPs (>0.8) and allele frequencies for palindromic SNPs to decrease the possibility of strand inconsistencies.
Other Covariates
Prevalent cardiovascular disease was defined as prevalent myocardial infarction, revascularization, stroke, and heart failure. Prevalent cardiovascular disease was assessed using general practitioners’ records and hospital discharge letters. 30 Smoking status was assessed during home interviews. Blood pressure, height, and weight were measured during visits. Body mass index was calculated as weight in kilograms divided by height in square meters. Prevalent diabetes was assessed using general practitioners’ records, information on antidiabetic medication use, and fasting blood glucose levels. 31
Statistical Analysis
Phenotypic Associations
The association between serum phosphate and CAC as a continuous variable was assessed through linear regression models. The analysis was stratified according to estimated glomerular filtration rate (eGFR; <60 mL/min per 1.73 m2: CKD). Serum phosphate was assessed continuously and in quintiles. In addition, we tested the linearity of the association between serum phosphate and CAC using restricted cubic spline functions with 5 default knots (5th, 27.5th, 50th, 72.5th, and 95th percentile). 32 , 33 We tested if the calcium×phosphate product was associated with CAC, as previously reported in CKD. 34 In addition, we assessed the association between serum phosphate and CAC as a categorical variable through prevalence ratios (PRs), for CAC scores >100, 300, 400, and 1000. 35 We included interaction terms of phosphate with sex in age‐adjusted models to explore potential sex differences in the association between phosphate and CAC. When a sex difference in serum phosphate and CAC was confirmed, we performed sex‐stratified analysis. Because calcium is synergistic to phosphate in arterial calcification, 34 we assessed the relation between serum phosphate and ionized calcium.
Model I included adjustments for age, body mass index, and smoking. Model II included also blood pressure, 25(OH)D, total serum calcium, C‐reactive protein, total cholesterol:high‐density lipoprotein cholesterol ratio and glucose levels, prevalent CVD and prevalent diabetes.
Sensitivity analyses
We restricted the analyses to subjects without hyperphosphatemia (hyperphosphatemia: serum phosphate>1.45 mmol/L, >4.5 mg/dL), without CKD and without prevalent CVD. To explore for interaction, we created 25(OH)D categories splitting at 48 nmol/L, which is a threshold related to CVD in the Dutch population. 36 We assessed whether serum tissue nonspecific ALP was associated with CAC. ALP generates phosphate through hydrolysis of inorganic pyrophosphate, a potent arterial calcification inhibitor, and has been independently related to CAC in the general population, in CVD and in CKD. 37
Mendelian Randomization
To test for causality, we assessed whether phosphate was associated with continuous CAC. 23 We selected 8 SNPs, assumed an additive model, and built a phosphate‐increasing allele score aligning the alleles: a higher score predicted a higher serum phosphate. 38 Scores (as a single instrument) are associated with lower risk of weak instrument bias than the simultaneous use of multiple SNPs. 38 The SNPs included in the score were derived from a GWAS meta‐analysis within the Cohorts for Heart and Aging Research in Genomic Epidemiology Consortium composed of individuals of European ancestry, and a recent GWAS within the Biobank Japan Project composed of individuals of East Asian ancestry. 28 , 29
In the former, the population under study was part of the discovery sample of the GWAS, which could result in bias from winner’s curse. However, all SNPs reported in the above‐mentioned GWA studies have been replicated in a UK biobank GWAS. Summary statistics of this GWAS are publicly available. 39
To properly account for uncertainty in imputed SNPs, genotypes were extracted from dosage files and therefore its values span between 0 and 2, reflecting the probability of getting up to 2 risk (phosphate‐increasing) alleles. If the SNP was genotyped, we report Hardy Weinberg equilibrium test; otherwise, the imputation quality is displayed.
Palindromic SNPs were checked for allele frequency concordance between RS and the GWAS catalog. In addition, one SNP mapping to the nonpseudoautosomal region of the X chromosome was coded as 0/2 in men (for 0/1 risk allele) and as 0/1/2 in women, following recent guidelines when assuming a pattern of X‐chromosome inactivation. 40
Inclusion of correlated SNPs, in linkage disequilibrium, is a potential source for bias in standard MR analyses without covariance matrix, leading to increased type I error rates. Therefore, we included only independent SNPs in the score, applying a threshold of r 2<0.01.
We used the score to genetically predict serum phosphate and tested for causality applying a 2‐stage least square regression, where the first stage regresses the exposure on the instruments and the second stage regresses the outcome on the fitted values of the exposure estimated in first stage. 38 We applied robust standard errors. We assessed MR assumptions as follows:
Assumption N°1: the instrument must be associated with the exposure, relevance condition. We regressed serum phosphate levels on phosphate SNPs/score in the population with serum phosphate levels available and with serum phosphate and CAC levels available. We considered β, P, and F‐statistic. In general, an instrument with an F‐statistic <10 is considered a weak instrument and a higher F‐statistic reflects a better instrument. However, no cutoffs should be made, as bias is a continuous phenomenon. 23 , 38
Assumption N°2: The instrument must not be associated with potential confounders, independence condition. We regressed potential confounders on phosphate scores. Evidently, it is not possible to assess the association of instruments with unmeasured confounders.
Assumption N°3: The instrument must be related to the outcome only through the exposure, meaning the absence of horizontal pleiotropy, exclusion‐restriction condition. To test this assumption, both a frequentist and a Bayesian approach were applied, the latter as sensitivity analysis. MR‐Egger regression was not applied because of our 1‐sample setting and its low statistical power when the SNP‐exposure associations are homogenous. 41 We implemented instead an adaptive lasso regression (sivreg, Stata) that provides estimates while allowing less than 50% of instruments to be invalid by horizontal pleiotropy. 42
Analyses were performed with unweighted scores. Although weighted scores may increase power, use of internal weights derived from the data should be avoided because of the severe bias that this approach induces and the RS represented ≈40% of the Cohorts for Heart and Aging Research in Genomic Epidemiology GWAS. 28 , 38
To test if results from the score were driven by only 1 SNP, we applied the leave‐1‐out approach, excluding 1 SNP at a time from the score and testing for each reduced score whether genetically predicted phosphate was still associated with CAC. This penalization technique is considered a robust method 43 : if results are driven by only 1 SNP, a high index of pleiotropy should be suspected and properly assessed. To obtain results for the Sargan test, which is an indirect measure of heterogeneity among instruments, we did not apply robust standard errors to the leave‐1‐out analysis.
Similar to phenotypic associations, we performed subgroup analyses excluding participants with hyperphosphatemia, CKD, and prevalent CVD.
Sensitivity analysis
In addition of applying a single score, we genetically predicted phosphate through the combination of all SNPs simultaneously (joint instruments analyses). This approach might have more power but might suffer from weak instrument bias. 38 We applied in this setting the Sargan test, an overidentification test, to assess whether all instruments included in the regression are valid in linear combination 44 and not correlated with error terms. Additionally, Sargan provides a test of heterogeneity among instruments. 43 We also applied the leave‐1‐out approach to the joint instruments analysis.
Consistent with ancestry of participants, we built a score derived only from SNPs from the Cohorts for Heart and Aging Research in Genomic Epidemiology meta‐analysis (EUR‐score) and tested for reproducibility of results.
Finally, we applied a Bayesian approach designed for a 1‐sample setting that allows several SNPs to exert pleiotropic effects and that does not rely in the assumption of no correlation between SNP strength and pleiotropic effects. The method is described in Data S1. This approach allows the implementation of pleiotropic effects for a subset (49%) of SNPs, incorporated in their prior distribution, and applies variational Bayes through a modified Markov chain Monte Carlo to estimate the posterior mean and its 95% CI. 45 Genotypes were centered to improve convergence. Analyses were performed after imputing missing values through multiple imputation with chained equations. We used SPSS version 21.0 (IBM Corp, Armonk, NY), Stata version 16 (Stata Corp LP, College Station, TX) and R version 3.5.0 (R Foundation for Statistical Computing, Vienna, Austria). A 2‐sided P<0.05 was considered significant.
RESULTS
The general characteristics of the study population are shown in Table 1. Mean serum phosphate levels were higher in women than in men (P women: 1.18 mmol/L [3.65 mg/dL]; P men: 1.02 mmol/L [3.16 mg/dL]; P t‐test<0.001 [data not shown]) (reference range of serum phosphate, 0.8–1.4 mmol/L=2.5–4.5 mg/dL). Median CAC score levels were higher in men than in women (CACmen: 310.2; CACwomen: 54.7; P M Whitney<0.001). Total calcium and calcium×phosphate product was positively associated with serum phosphate in both sexes while ionized calcium was negatively associated with serum phosphate in women only. All results are expressed per 1‐SD increase of serum phosphate (0.16 mmol/L=0.49 mg/dL), unless otherwise stated.
Table 1.
General Characteristics of Study Population, per Quintiles of Fasting Phosphate Levels
| Men | Women | |||||||||
|---|---|---|---|---|---|---|---|---|---|---|
| Phosphate in quintiles | Phosphate in quintiles | |||||||||
| 1 | 2 | 3 | 4 | 5 | 1 | 2 | 3 | 4 | 5 | |
| N (phosphate in mmol/L) | 175 (0.83) | 176 (0.95) | 175 (1.02) | 176 (1.09) | 176 (1.21) | 202 (0.98) | 202 (1.11) | 202 (1.17) | 202 (1.24) | 203 (1.37) |
| Age, y | 70.8 | 71.3 | 70.6 | 70.6 | 70.7 | 70.7 | 70.2 | 71.2 | 70.8 | 70.6 |
| BMI, kg/m2 | 26.8 | 26.7 | 26.3 | 26.8 | 26.1 | 29.1 | 27.6 | 27.3 | 26.9 | 26.3 |
| Ever smoke, % | 93.1 | 89.1 | 93.1 | 94.3 | 94.3 | 48.8 | 52.0 | 55.9 | 58.2 | 53.0 |
| Systolic BP, mm Hg | 145.1 | 143.4 | 148.0 | 146.1 | 144.0 | 145.8 | 143.9 | 147.9 | 139.3 | 142.5 |
| Diastolic BP, mm Hg | 76.9 | 76.5 | 82.5 | 78.1 | 76.5 | 78.4 | 75.8 | 79.3 | 73.9 | 74.4 |
| Ionized Ca++, mmol/L* | 1.29 | 1.29 | 1.29 | 1.29 | 1.28 | 1.31 | 1.30 | 1.29 | 1.30 | 1.28 |
| Calcium, mmol/L | 2.39 | 2.41 | 2.40 | 2.40 | 2.42 | 2.43 | 2.43 | 2.44 | 2.44 | 2.46 |
| Ca×P product, mmol2/L2 | 1.98 | 2.28 | 2.44 | 2.61 | 2.94 | 2.38 | 2.69 | 2.87 | 3.04 | 3.38 |
| ALP, U/L* | 79.6 | 76.5 | 75.6 | 74.4 | 75.0 | 80.5 | 76.7 | 77.7 | 80.3 | 76.5 |
| 25(OH)D, nmol/L | 66.7 | 63.1 | 65.6 | 60.8 | 60.5 | 49.6 | 51.5 | 48.4 | 49.2 | 50.8 |
| CAC score | 446.7 | 668.5 | 696.9 | 840.3 | 1059.8 | 234.2 | 193.4 | 319.0 | 342.6 | 279.0 |
| CRP, mg/L | 3.95 | 3.37 | 3.74 | 3.64 | 5.20 | 4.78 | 3.77 | 3.57 | 3.36 | 3.05 |
| Glucose, mmol/L | 6.08 | 6.00 | 6.14 | 6.09 | 6.02 | 6.12 | 5.77 | 5.80 | 5.77 | 5.64 |
| eGFR, mL/min per 1.73 m2 | 72.7 | 72.5 | 73.9 | 73.1 | 74.7 | 71.8 | 72.6 | 71.0 | 71.8 | 72.8 |
| Chol to HDL ratio | 4.78 | 4.86 | 4.82 | 4.65 | 4.45 | 4.39 | 4.40 | 4.36 | 4.21 | 4.10 |
| Prevalent CVD, % | 12.0 | 17.6 | 16.6 | 17.0 | 19.9 | 6.0 | 7.4 | 4.5 | 8.4 | 6.4 |
| Prevalent diabetes, % | 13.1 | 13.6 | 13.7 | 17.0 | 15.9 | 16.8 | 11.9 | 12.4 | 10.4 | 9.9 |
Continuous values are displayed as means; categorical variables are displayed in percentages. 25(OH)D indicates 25‐hydroxyvitamin D levels; ALP, alkaline phosphatase levels; BMI, body mass index; BP, blood pressure; Ca×P product, total calcium×phosphate levels; calcium, total calcium levels; Chol to HDL ratio, total cholesterol to HDL cholesterol ratio; CRP, C‐reactive protein; eGFR, estimated glomerular filtration rate; ionized Ca++, ionized calcium levels; and prevalent CVD, prevalent cardiovascular disease.
Ionized calcium and alkaline phosphatase (ALP) levels were not assessed simultaneously with serum phosphate levels.
Results From Phenotypic Associations
CAC as Continuous Trait
Table 2 shows that serum phosphate was associated with CAC in the total population after adjustments for model I (β, 0.37 [95% CI, 0.26–0.48]; P=3×10⁻¹¹; n=1889). We found a significant interaction between serum phosphate and CAC across sexes (P interaction=0.003). Sex‐stratified analyses showed that the association between serum phosphate and CAC was stronger in men (β, 0.52 [95 CI, 0.38–0.67]; P=5×10⁻¹²; n=878) than women (β, 0.22 [95 CI, 0.06–0.38]; P=0.006; n=1011). Further adjustments (model II) induced a slight attenuation of the association in men (men β, 0.44 [95 CI, 0.30–0.59]; P=3×10⁻⁹; women β, 0.24 [95 CI, 0.08–0.40]; P=0.003).
Table 2.
Association Between Serum Phosphate Levels and Coronary Artery Calcification Scores
| Model I | Model II | |||||
|---|---|---|---|---|---|---|
| n | β (95% CI)* | P value | n | β (95% CI)* | P value | |
| Men | 878 | 0.52 (0.38–0.67) | <0.001 | 878 | 0.44 (0.30–0.59) | <0.001 |
| Women | 1011 | 0.22 (0.06–0.38) | 0.006 | 1011 | 0.24 (0.08–0.40) | 0.003 |
| Total | 1889 | 0.37 (0.26–0.48) | <0.001 | 1889 | 0.34 (0.23–0.45) | <0.001 |
BMI indicates body mass index; and HDL, high‐density lipoprotein.
βs were obtained from linear regression models and expressed per 1‐SD increase in phosphate (0.16 mmol/L=0.49 mg/dL). Model I: adjusted for age, BMI, smoking. Model II: adjusted for age; BMI; blood pressure; smoking; prevalent cardiovascular disease; prevalent diabetes; and serum levels of 25‐hydroxyvitamin D, total calcium, C‐reactive protein, total cholesterol to HDL cholesterol ratio, and glucose.
The stratified analyses (Table 3) showed that serum phosphate was associated with CAC across the spectrum of kidney function in men (eGFR ≥60 mL/min per 1.73 m2 β, 0.53 [95 CI, 0.35–0.70]; P<0.001; n=736; eGFR <60 mL/min per 1.73 m2 β, 0.53 [95 CI, 0.31–0.75]; P<0.001; n=142), while in women this association was constrained to normal eGFR (eGFR ≥60 mL/min per 1.73 m2 β, 0.22 [95 CI, 0.04–0.39]; P=0.016; n=839; eGFR <60 mL/min per 1.73 m2 β, 0.25 [95 CI, −0.17 to 0.66]; P=0.238; n=172). Adjustments for model II induced a slight attenuation in men (eGFR ≥60 mL/min per 1.73 m2 β, 0.44 [95 CI, 0.27–0.62]; P<0.001; eGFR<60 mL/min per 1.73 m2 β, 0.45 [95 CI, 0.21–0.68]; P=0.001).
Table 3.
Association Between Serum Phosphate Levels and Coronary Artery Calcification Scores, Stratified by eGFR
| eGFR ≥60 mL/min per 1.73 m2 * | eGFR <60 mL/min per 1.73 m2 * | |||||
|---|---|---|---|---|---|---|
| n | β (95% CI)† | P value | n | β (95% CI)† | P value | |
| Model I | ||||||
| Men | 736 | 0.53 (0.35 to 0.70) | <0.001 | 142 | 0.53 (0.31 to 0.75) | <0.001 |
| Women | 839 | 0.22 (0.04 to 0.39) | 0.016 | 172 | 0.25 (−0.17 to 0.66) | 0.238 |
| Total | 1575 | 0.36 (0.24 to 0.49) | <0.001 | 314 | 0.42 (0.20 to 0.64) | <0.001 |
| Model II | ||||||
| Men | 736 | 0.44 (0.27 to 0.62) | <0.001 | 142 | 0.45 (0.21 to 0.68) | <0.001 |
| Women | 839 | 0.22 (0.05 to 0.40) | 0.011 | 172 | 0.30 (−0.12 to 0.72) | 0.154 |
| Total | 1575 | 0.33 (0.21 to 0.46) | <0.001 | 314 | 0.36 (0.14 to 0.58) | 0.002 |
BMI indicates body mass index; eGFR, estimated glomerular filtration rate; and HDL, high‐density lipoprotein.
eGFR estimated from creatinine‐based Chronic Kidney Disease Epidemiology Collaboration equations.
βs were obtained from linear regression models and expressed per 1‐SD increase in phosphate (0.16 mmol/L=0.49 mg/dL). Model I: adjusted for age, BMI, smoking. Model II: adjusted for age; BMI; blood pressure; smoking; prevalent cardiovascular disease; prevalent diabetes; and serum levels of 25‐hydroxyvitamin D, total calcium, C‐reactive protein, total cholesterol to HDL cholesterol ratio, and glucose.
The analyses in quintiles suggested a threshold for the association of serum phosphate and CAC (Table 4): setting the first quintile as reference, men with serum phosphate above 1.09 mmol/L displayed a significant trend for higher CAC (β for fourth quartile, 0.87 [95 CI, 0.46–1.28]; P<0.001; β for fifth quintile, 1.18 [95 CI, 0.77–1.59]; P<0.001; P trend=3×10⁻¹⁰; n=878). For women the threshold was >1.37 mmol/L (β for fifth quintile, 0.67 [95 CI, 0.22–1.11]; P=0.003; P trend=0.002; n=1011). A 5‐knot restricted cubic spline function did not find evidence for a nonlinear association between serum phosphate and CAC in the total population and in men and women separately (Figure S1).
Table 4.
Association Between Serum Phosphate Levels and Coronary Artery Calcification Scores, per Quintiles of Phosphate Levels
| Men | Women | ||||||
|---|---|---|---|---|---|---|---|
| n |
Phosphate levels mean (range)* |
β (95% CI)† | P value | n |
Phosphate levels mean (range)* |
β (95% CI)† | P value |
| 175 | 0.83 (0.63–0.91) | 1 (Ref) | 202 | 0.98 (0.74 to 1.06) | 1 (Ref) | ||
| 176 | 0.95 (0.91 to 0.98) | 0.28 (−0.13 to 0.69) | 0.178 | 202 | 1.11 (1.06 to 1.14) | 0.04 (−0.40 to 0.47) | 0.869 |
| 175 | 1.02 (0.98 to 1.05) | 0.37 (−0.04 to 0.78) | 0.078 | 202 | 1.17 (1.14 to 1.20) | 0.03 (−0.41 to 0.47) | 0.889 |
| 176 | 1.09 (1.05 to 1.13) | 0.87 (0.46 to 1.28) | <0.001 | 202 | 1.24 (1.20 to 1.28) | 0.26 (−0.18 to 0.69) | 0.247 |
| 176 | 1.21 (1.13 to 2.47) | 1.18 (0.77 to 1.59) | <0.001 | 203 | 1.37 (1.28 to 1.70) | 0.67 (0.22 to 1.11) | 0.003 |
| P trend | <0.001 | 0.002 | |||||
BMI indicates body mass index.
Phosphate quintiles are expressed in mmol/L.
Betas were obtained from linear regression models. First quintile of phosphate was set as reference. Analyses were adjusted for age, BMI, and smoking.
Similarly, the results of the calcium×phosphate product with CAC (Table 5) suggested threshold values: setting the first quintile as reference, men with a product above 2.44 mmol2/L2 displayed a significant trend for higher CAC (β for third quintile, 0.49 [95 CI, 0.09–0.90]; P=0.017; β for fourth quintile, 0.77 [95 CI, 0.37–1.18; P<0.001; β for fifth quintile, 1.17 [95 CI, 0.77–1.58]; P<0.001; P trend=5×10⁻¹¹; n=878). In women the threshold was above 3.05 mmol2/L2 (β for fourth quintile, 0.47 [95 CI, 0.04–0.91]; P=0.034; β for fifth quintile, 0.64 [95 CI, 0.19–1.08]; P=0.005; P trend=0.001; n=1011). All coefficients are per unit increase in calcium×phosphate product. ALP was not associated with CAC (men β, −0.001 [95 CI, −0.009 to 0.007]; P=0.873; n=574; women β, −0.005 [95 CI, −0.012 to 0.001]; P=0.094; n=747) (data not shown).
Table 5.
Association Between Serum Calcium×Phosphate Product Levels and Coronary Artery Calcification Scores, per Quintiles Of Calcium×Phosphate Product Levels
| Men | Women | ||||||
|---|---|---|---|---|---|---|---|
| N |
Product mean (range)* |
β (95% CI)† | P value | n |
Product mean (range)* |
β (95% CI)† | P value |
| 175 | 1.97 (1.50 to 2.16) | 1 (Ref) | 202 | 2.35 (1.67 to 2.57) | 1 (Ref) | ||
| 176 | 2.27 (2.16 to 2.36) | 0.03 (−0.37 to 0.44) | 0.868 | 202 | 2.68 (2.58 to 2.77) | 0.001 (−0.43 to 0.44) | 0.995 |
| 175 | 2.44 (2.36 to 2.52) | 0.49 (0.09 to 0.90) | 0.017 | 202 | 2.86 (2.77 to 2.96) | 0.29 (−0.14 to 0.73) | 0.185 |
| 176 | 2.62 (2.52 to 2.71) | 0.77 (0.37 to 1.18) | <0.001 | 202 | 3.05 (2.96 to 3.15) | 0.47 (0.04 to 0.91) | 0.034 |
| 176 | 2.96 (2.71 to 6.57) | 1.17 (0.77 to 1.58) | <0.001 | 203 | 3.40 (3.16 to 4.20) | 0.64 (0.19 to 1.08) | 0.005 |
| P trend | <0.001 | 0.001 | |||||
BMI indicates body mass index; and HDL, high‐density lipoprotein.
Calcium×phosphate product levels are expressed in mmol2/L2.
Betas were obtained from linear regression models. First quintile of calcium×phosphate product level was set as reference. Analyses were adjusted for age, BMI, and smoking.
CAC as a Categorical Trait
After adjustments for model II (Table S1), each 1‐SD increase in serum phosphate (0.16 mmol/L) was associated with an increased PR for CAC >100 of 8% in men only (95 CI, 4%–12%]; P=6×10⁻⁵); a PR for CAC >300 of 10% in men only (95 CI, 5%–15%; P=2×10⁻⁴); a PR for CAC >400 of 10% in men only (95 CI, 5%–16%; P=2×10⁻⁴), and a PR for CAC >1000 of 20% in men (95 CI, 12%–28%; P=4×10⁻⁷) and 36% in women (95 CI, 18%–55%; P<0.001).
Sensitivity Analysis
After exclusion of subjects with hyperphosphatemia, serum phosphate was associated with CAC in both men (β, 0.53 [95 CI, 0.37–0.69]; P=1×10⁻¹⁰; n=873) and women (β, 0.21 [95 CI, 0.03–0.40]; P=0.020; n=974) (Table S2). In men, results from model II showed a slight attenuation (men β, 0.46 [95 CI, 0.31–0.62]; P=1×10⁻⁸). Moreover, exclusion of CKD and hyperphosphatemia did not change the association between phosphate and CAC (men β, 0.53 [95 CI, 0.35–0.71]; P=1×10⁻⁸; n=733; women β, 0.22 [95 CI, 0.03–0.42]; P=0.026; n=808). These results were slightly attenuated in men after adjustments for model II (men β, 0.45 [95 CI, 0.27–0.63]; P=1×10⁻⁶). Finally, after exclusion of CKD, hyperphosphatemia and prevalent CVD, the association between serum phosphate and CAC remained (men β, 0.55 [95 CI, 0.35–0.74]; P=4×10⁻⁸; n=627; women β, 0.20 [95 CI, 0.0003–0.40]; P=0.050; n=765). Adjustments for model II yielded similar results (men β, 0.50 [95 CI, 0.31–0.69]; P=5×10⁻⁷; women β, 0.22 [95 CI, 0.02–0.43]; P=0.029). We found no evidence of effect modification by 25(OH)D (data not shown).
Results From MR Analyses
No evidence of departure from Hardy Weinberg equilibrium was observed in genotyped SNPs; for imputed SNPs, the imputation quality was above 96%. No frequency/strand inconsistency between the original GWAS and RS was detected for the only palindromic SNP (rs2970818; Adenine/Thymine); therefore, it was included in the score (Table S3). 28
Concerning MR first assumption, the strength of the instruments was tested regressing serum phosphate levels (expressed in entire units of mmol/L) on the SNPs in all subjects with serum phosphate levels available and further restricted to those with serum phosphate and CAC (Table S4). The allele score was significantly associated with serum phosphate in both the whole cohort with available phosphate levels and in the subset of the population with available phosphate and CAC levels. The F‐statistic for the allele score was >25, meaning results from MR analyses should not be affected by weak instrument bias. 38 Three SNPs from Biobank Japan showed a significant association with serum phosphate in the whole cohort but further restriction to subjects with serum phosphate and CAC decreased power, and the associations were no longer significant. Therefore, we first built a score including all 8 SNPs and subsequently applied sensitivity analyses.
Concerning MR second assumption, we regressed potential confounders on the phosphate scores: the 8‐SNP score and the 5‐SNP EUR‐score (Table S5). We found no association of the scores with total calcium, 25(OH)D, C‐reactive protein, total cholesterol : high‐density lipoprotein cholesterol ratio and glucose; nor with body mass index, smoking, prevalent CVD, or DM.
Allele Score Analyses
Figure 1 shows the results of the 2‐stage least square regression regression of phosphate, genetically predicted through the unweighted score, and CAC adjusted for age, sex, and 10 principal components in the whole cohort. The allele score has been scaled to be associated to 1 SD of serum phosphate (0.16 mmol/L=0.49 mg/dL). A significant relation was found between the unweighted phosphate score and CAC (β, 0.93 [95 CI, 0.05–1.82]; P=0.039).
Figure 1. Mendelian randomization results for serum phosphate and coronary artery calcification: allelic score method and leave‐1‐SNP‐out approach applied to the whole cohort.
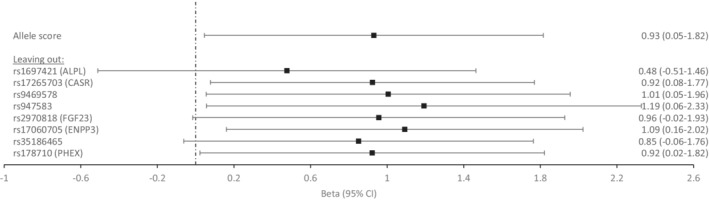
Betas were derived from 2‐stage least square for the score as a single instrument and adjusted for age, sex, and 10 principal components. Results are expressed as change in outcome per 1‐SD increase in phosphate (0.16 mmol/L=0.49 mg/dL). Leave‐1‐SNP‐out approach: allelic score analyses with the subtraction of 1 SNP at‐a‐time. Closest annotated gene is displayed if known to be associated with (or possible related to) phosphate homeostasis.
Sex‐stratified analysis suggested that the association between genetically predicted phosphate and CAC was more consistent in men than in women (men β, 1.31 [95 CI, −0.02 to 2.64]; P=0.053; n=782; women β, 0.56 [95 CI, −0.61 to 1.75]; P=0.347; n=911).
When we applied the leave‐1‐SNP‐out approach (from the score), we found that results lost significance after extracting rs1697421 (β, 0.48 [95 CI, −0.51 to 1.46]; P=0.344); rs2970818 (β, 0.96 [95 CI, −0.02 to 1.93]; P=0.054) and rs35186465 (β, 0.85 [95 CI, −0.06 to 1.77]; P=0.068), one at a time.
Subgroup Analysis According to Serum Phosphate Levels, Kidney Function, and CVD
The unweighted phosphate score remained associated to CAC after exclusion of hyperphosphatemia (β, 1.10 [95 CI, 0.10–2.10]; P=0.031; n=1659); after exclusion of hyperphosphatemia and CKD (β, 1.30 [95 CI, 0.33–2.27]; P=0.009; n=1377); and after exclusion of hyperphosphatemia, CKD, and prevalent CVD (β, 1.23 [95 CI, 0.17–2.28]; P=0.023; n=1244) (Figure 2, Table S6).
Figure 2. Mendelian randomization results for serum phosphate and coronary artery calcification: allelic score method applied in subgroup analyses according to serum phosphate levels, kidney function, and prevalent cardiovascular disease.
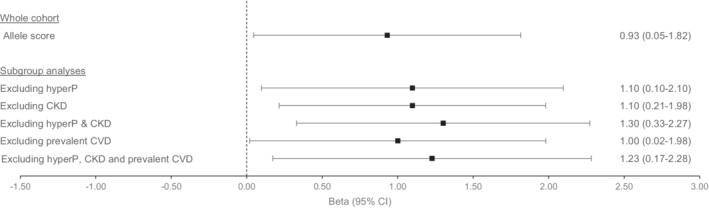
Betas were derived from 2‐stage least square for the score as a single instrument and adjusted for age, sex, and 10 principal components. Results are expressed as change in outcome per 1‐SD increase in phosphate (0.16 mmol/L=0.49 mg/dL). CKD indicates chronic kidney disease, defined as a glomerular filtration rate <60 mL/min per 1.73 m2. Prevalent CVD, prevalent cardiovascular disease, defined as prevalent myocardial infarction, revascularization, stroke, and heart failure; HyperP, hyperphosphatemia, defined as a phosphate level >1.45 mmol/L (=4.5 mg/dL).
Sensitivity Analysis
Joint Instruments Analysis and Sargan Statistics
Phosphate genetically predicted through all 8 SNPs simultaneously (Table S7) was associated with CAC (β, 0.81 [95 CI, 0.04–1.58]; P=0.038). The exclusion of 1 SNP at a time yielded similar results as their exclusion from the score: phosphate is not associated with CAC if the following SNPs are excluded, 1 at a time: rs1697421, rs2970818, and rs35186465.
The Sargan tests could not reject the null hypothesis in any case, providing validity of the instruments and an indirect evidence of low heterogeneity among them.
EUR‐Score
Table S6 shows that restriction to EUR‐score did not attenuate the results of genetically predicted phosphate and CAC (β, 1.04 [95 CI, 0.07–2.01]; P=0.036; n=1693). Results remained significant after excluding hyperphosphatemia (β, 1.06 [95 CI, 0.04–2.08]; P=0.041; n=1659), after excluding hyperphosphatemia and CKD (β, 1.30 [95 CI, 0.29–2.30]; P=0.011; n=1377), and after excluding hyperphosphatemia, CKD, and prevalent CVD (β, 1.05 [95 CI, 0.08–2.03]; P=0.035; n=1244).
Assessment of Potential Horizontal Pleiotropy
Concerning MR’s third assumption (Table S8), from a frequentist approach the adaptive lasso regression found no evidence of invalidity of instruments; therefore, the inference was similar as that obtained from 2‐stage least square regression. There was no rejection of the Hansen test, meaning that all SNPs are valid and uncorrelated with error terms.
From a Bayesian approach, we applied a method that incorporates pleiotropic effects into a fraction of SNPs and tests whether the association between the genetically predicted exposure and outcome remains. Allowing 49% of SNPs to exert pleiotropic effects and assuring model convergence, we found that genetically predicted phosphate was still associated with CAC (posterior mean, 0.94 [95% CI,] 0.13–1.45).
DISCUSSION
Our analyses showed that serum phosphate was strongly associated with CAC, even after excluding subjects with hyperphosphatemia, CKD, and prevalent CVD, in a Dutch population‐based cohort study. The implementation of MR methods, where genetically predicted phosphate is consistently associated with CAC, strengthens the inference of our observational findings and supports causality. It has been previously shown that hyperphosphatemia or a supraphysiological high‐phosphate medium is able to induce an osteoblastic transformation of vascular smooth muscle cells with subsequent medial calcification, 17 , 34 characteristic of CKD. Nevertheless, whether normal serum phosphate is associated with intimal calcification has been much less explored. 20 , 22 Our data demonstrated important sex differences in this association, adding to sex differences previously found concerning serum phosphate and all‐cause mortality, 46 CVD mortality,15 and atherosclerosis, 16 where consistently a stronger (or unique) relation has been described in men.
When analyzed as a categorical trait, serum phosphate increases the PR in men for CAC >100, which is considered of moderate risk. In men, serum phosphate increases PR for CAC >300 and >400, which is considered high risk. 3 Remarkably, serum phosphate increases PR for CAC >1000 in both sexes, a category that confers a high mortality risk. 35 To the best of our knowledge, this is the first study to assess the relation between serum phosphate and CAC through MR, by definition less prone to be affected by confounding and reverse causation. An important source of bias in MR might be horizontal pleiotropy. 47 Nevertheless, we applied elaborated regression models that assess or allow pleiotropy. 42 , 45 The persistence of similar results to standard 2‐stage least square regression, through lasso regression, and the obtainment of significant results despite allowing almost half of the SNPs to exert pleiotropic effects, through Bayesian modeling, confirm the robustness of our findings.
The association between serum phosphate and CAC after restriction of MR to subjects without hyperphosphatemia, CKD and prevalent CVD, supports that increasing (but within normal range) serum phosphate in the general population without clinical CVD is a pathogenic factor for increasing the CAC burden. This finding challenges the concept that only severe hyperphosphatemia, in the uremic context of CKD, is associated with CAC. More importantly, it might provide an explanation for the emerging epidemiologic associations of serum phosphate and increased mortality and cardiovascular events in cohorts 46 with mostly normal serum phosphate; and to CVD mortality and atherosclerosis in men with strict normal serum phosphate. 15 , 16 If these associations are causal, there must be an underlying mechanism. CAC induction by an increasing, yet normal, serum phosphate might be one of these mechanisms.
The approach of leaving 1 SNP out has recently been acknowledged as a robust penalization method to test validity in MR. 41 We found that results were not significant when specific SNPs were omitted from the score, 1 at a time:
rs1697421: Its omission results in the nullification of the association. This SNP is intergenic, but its positional candidate gene is ALPL, which encodes for tissue‐nonspecific ALP. ALP was not associated with CAC in our population study; but it hydrolyzes pyrophosphate into phosphate. Pyrophosphate is one of the most potent calcification inhibitors. 37 The condition where an SNP affects the outcome through a pathway affected by the risk factor of interest is termed vertical pleiotropy and does not invalidate MR findings. If this SNP influences ALP and its downstream activity/levels, pyrophosphate and phosphate, it will correspond to mediation of the effect. 47
rs2970818: This SNP is also intergenic but one of the positional candidate genes is FGF23, which encodes for a key hormone in phosphate homeostasis through increased renal phosphate excretion. 19 In contrast to observational studies linking higher FGF23 levels to arterial calcification, research at the cellular level has shown that FGF23 inhibits osteoblastic differentiation of vascular cells, partially through α‐klotho actions. 18 , 19 Therefore, horizontal pleiotropy is unlikely.
rs35186465: There are not any known phosphate‐related genes annotated to this SNP.
Therefore, the association of genetically predicted phosphate with CAC is explained mostly by the contribution of 3 SNPs from the allele score located in chromosomes 1, 12, and 17. Though a role from several SNPs located throughout the genome improves the validity from MR, 43 it seems that rs1697421 near ALPL plays a key role.
Besides FGF23 and α‐klotho, serum phosphate is regulated by 1,25(OH)2D3 and PTH levels. Both 1,25(OH)2D3 and PTH are positively associated with CAC. The significant results from MR analyses decrease their likelihood as confounders. Nevertheless, as PTH has been related to arterial calcification even at normal levels and PTH increases with increased serum phosphate, our data cannot rule out a role of PTH on CAC.
Two main pathways of phosphate‐induced calcification have been described in the coronary bed: (1) a passive deposition of calcium and phosphate, strongly regulated by ALP‐pyrophosphate‐P, and (2) an active process of osteoblastic differentiation of vascular pericytes and calcifying vascular cells, able to synthesize matrix vesicles, which start the mineralization process. Current evidence has shown that ALP, pyrophosphate and phosphate are present in matrix vesicles surfaces of atherosclerotic plaques, linking closely both mechanisms of calcification in CAC and potentially providing a biological explanation for our results. 5
Although a restricted cubic spline model did not find evidence for a nonlinear association, we found an apparent dose‐effect relation in phosphate and CAC, with normal serum phosphate thresholds of 1.09 mmol/L (3.35 mg/dL) and 1.37 mmol/L (4.24 mg/dL) in men and women. Interestingly, Dhingra et al 14 (Framingham study) described a close cutoff for serum phosphate of 3.5 mg/dL (1.13 mmol/L) above which CVD mortality and morbidity increased. The authors stated that it was not clear whether increasing serum phosphate within normal range was associated with CVD risk. Our data suggests that this question can be answered in a confirmatory way.
We also found that normal levels of the calcium×phosphate product were associated with CAC. Recent literature highlights that circulating calciprotein particles, composed of calcium, phosphate, and calcification inhibitors such as fetuin A, are crucial in calcification and that its composition dictates whether pathologic mineralization is inhibited or not. 48 The calcium×phosphate product within calciprotein particles has been identified as the culprit in this process. Similar to serum phosphate, it might be that a normal product in serum does not reflect a safe product at the cellular level.
The stronger associations observed in men are consistent to previous research on serum phosphate and CVD (atherosclerosis, 16 cardiovascular event rates 46 and CVD mortality 15 , 46 ). These results are unexpected, especially because women have higher serum phosphate and because the protective effect of 17β‐estradiol in arterial calcification 49 is predominant in premenopausal women. We can only speculate whether the association between calcium and phosphate levels plays a role in the sex difference as we (and others) have found an inverse relation between serum phosphate and ionized calcium in women but not in men, and an inverse relation between them seems necessary to keep a constant calcium×phosphate product in serum. 50 , 51 It is important to add that phosphate intake has also been related to arterial calcification, as an abrupt postprandial phosphate increase suffices to initiate mineralization within seconds and to decrease α‐klotho expression. 52
This study has several limitations. We had a small sample size and no measurements of 1,25(OH)2D3, FGF23, and PTH levels, nor information on phosphate intake. CAC and ALP were not determined simultaneously. Several tests were not suitable because of our 1‐sample MR. Moreover, the RS is a Dutch population‐based cohort study, precluding inference to other populations or ethnic groups. Finally, we did not have prospective data on CAC and coronary events, which prevents us from drawing conclusions about the clinical implications of our findings. But there are several strengths, especially concerning the results from MR, that provides a formal test of causality provided the assumptions are fulfilled. Results from F‐statistics strongly suggest that our results are not affected by weak‐instrument bias. We were able to perform important stratified and subgroup analyses and to test instruments’ validity.
To conclude, we hereby provide both frequentist and Bayesian evidence from the MR approach that normal phosphate is a causative factor in CAC in the general population without hyperphosphatemia, without prevalent CVD and with normal kidney function. We add more evidence to support the concept of phosphotoxicity, and our results call for a review of the current normal serum phosphate range. 10 We agree with the European Food and Safety Agency 53 that more research is needed to study the relationships between dietary intake of phosphate and serum phosphate levels and adverse health outcomes. Public health policies might be needed to decrease phosphate intake because of the growing evidence of phosphate as a continuous risk factor for adverse outcomes such as atherosclerosis, CVD mortality, and, now, CAC. Further research should focus on unveiling the underlying mechanisms of the detrimental effects of phosphate in human health and to establish a threshold above which phosphate must be considered harmful for men and women, 54 especially because a large fraction of the population appears to be exposed to nonsafe P levels.
Sources of Funding
The generation and management of GWAS genotype data for the Rotterdam Study (RS‐I, RS‐II, RS‐III) was executed by the Human Genotyping Facility of the Genetic Laboratory of the Department of Internal Medicine, Erasmus Medical Center, Rotterdam, the Netherlands. The GWAS data sets are supported by the Netherlands Organization of Scientific Research Investments (No. 175.010.2005.011, 911‐03‐012); the Genetic Laboratory of the Department of Internal Medicine, Erasmus Medical Center; the Research Institute for Diseases in the Elderly (014‐93‐015); and the Netherlands Genomics Initiative/Netherlands Organization for Scientific Research Netherlands Consortium for Healthy Aging, Project No. 050‐060‐810. The Rotterdam Study is funded by Erasmus Medical Center and Erasmus University, Rotterdam; Netherlands Organization for the Health Research and Development; the Research Institute for Diseases in the Elderly; the Ministry of Education, Culture and Science; the Ministry for Health, Welfare and Sports; the European Commission (DG XII); and the Municipality of Rotterdam. Bosman is supported by a grant from Health~Holland (PhosphoNorm; LSHM18029).
Disclosures
None.
Supporting information
Data S1
Tables S1–S8
Figure S1
Acknowledgments
The authors are grateful to the study participants, the staff from the Rotterdam Study, and the participating general practitioners and pharmacists. We thank Pascal Arp, Mila Jhamai, Marijn Verkerk, Lizbeth Herrera, and Marjolein Peters, MSc, and Carolina Medina‐Gomez, PhD, for their help in creating the GWAS database; and Karol Estrada, PhD, Yurii Aulchenko, PhD, Linda Broer, PhD, and Carolina Medina‐Gomez, PhD, for the creation and analysis of imputed data.
Supplemental Material is available at https://www.ahajournals.org/doi/suppl/10.1161/JAHA.121.023024
For Sources of Funding and Disclosures, see page 12.
References
- 1. Campos‐Obando N. Bone and phosphate in relation to health, survival and genetic factors. Dissertation. Erasmus University Rotterdam; 2020. [Google Scholar]
- 2. London GM. Mechanisms of arterial calcifications and consequences for cardiovascular function. Kidney Int Suppl. 2011;2013(3):442–445. doi: 10.1038/kisup.2013.92 [DOI] [PMC free article] [PubMed] [Google Scholar]
- 3. Budoff MJ, Achenbach S, Blumenthal RS, Carr JJ, Goldin JG, Greenland P, Guerci AD, Lima JA, Rader DJ, Rubin GD, et al. Assessment of coronary artery disease by cardiac computed tomography: a scientific statement from the American Heart Association Committee on Cardiovascular Imaging and Intervention, Council on Cardiovascular Radiology and Intervention, and Committee on Cardiac Imaging, Council on Clinical Cardiology. Circulation. 2006;114:1761–1791. doi: 10.1161/CIRCULATIONAHA.106.178458 [DOI] [PubMed] [Google Scholar]
- 4. Chen NX, Moe SM. Vascular calcification: pathophysiology and risk factors. Curr Hypertens Rep. 2012;14:228–237. doi: 10.1007/s11906-012-0265-8 [DOI] [PMC free article] [PubMed] [Google Scholar]
- 5. Ruiz JL, Weinbaum S, Aikawa E, Hutcheson JD. Zooming in on the genesis of atherosclerotic plaque microcalcifications. J Physiol. 2016;594:2915–2927. doi: 10.1113/JP271339 [DOI] [PMC free article] [PubMed] [Google Scholar]
- 6. Detrano R, Guerci AD, Carr JJ, Bild DE, Burke G, Folsom AR, Liu K, Shea S, Szklo M, Bluemke DA, et al. Coronary calcium as a predictor of coronary events in four racial or ethnic groups. N Engl J Med. 2008;358:1336–1345. doi: 10.1056/NEJMoa072100 [DOI] [PubMed] [Google Scholar]
- 7. Nakamura S, Ishibashi‐Ueda H, Niizuma S, Yoshihara F, Horio T, Kawano Y. Coronary calcification in patients with chronic kidney disease and coronary artery disease. Clin J Am Soc Nephrol. 2009;4:1892–1900. doi: 10.2215/CJN.04320709 [DOI] [PMC free article] [PubMed] [Google Scholar]
- 8. Greenland P, Blaha MJ, Budoff MJ, Erbel R, Watson KE. Coronary calcium score and cardiovascular risk. J Am Coll Cardiol. 2018;72:434–447. doi: 10.1016/j.jacc.2018.05.027 [DOI] [PMC free article] [PubMed] [Google Scholar]
- 9. Ichikawa S, Imel EA, Kreiter ML, Yu X, Mackenzie DS, Sorenson AH, Goetz R, Mohammadi M, White KE, Econs MJ. A homozygous missense mutation in human KLOTHO causes severe tumoral calcinosis. J Clin Invest. 2007;117:2684–2691. doi: 10.1172/JCI31330 [DOI] [PMC free article] [PubMed] [Google Scholar]
- 10. Ohnishi M, Razzaque MS. Dietary and genetic evidence for phosphate toxicity accelerating mammalian aging. FASEB J. 2010;24:3562–3571. doi: 10.1096/fj.09-152488 [DOI] [PMC free article] [PubMed] [Google Scholar]
- 11. Block GA, Hulbert‐Shearon TE, Levin NW, Port FK. Association of serum phosphorus and calcium x phosphate product with mortality risk in chronic hemodialysis patients: a national study. Am J Kidney Dis. 1998;31:607–617. doi: 10.1053/ajkd.1998.v31.pm9531176 [DOI] [PubMed] [Google Scholar]
- 12. Otsuka F, Sakakura K, Yahagi K, Joner M, Virmani R. Has our understanding of calcification in human coronary atherosclerosis progressed? Arterioscler Thromb Vasc Biol. 2014;34:724–736. doi: 10.1161/ATVBAHA.113.302642 [DOI] [PMC free article] [PubMed] [Google Scholar]
- 13. Park KS, Park J, Choi SH, Ann SH, Singh GB, Shin ES, Lee JS, Chung HC. Serum phosphorus concentration and coronary artery calcification in subjects without renal dysfunction. PLoS One. 2016;11:e0151007. doi: 10.1371/journal.pone.0151007 [DOI] [PMC free article] [PubMed] [Google Scholar]
- 14. Dhingra R, Sullivan LM, Fox CS, Wang TJ, D'Agostino RB Sr, Gaziano JM, Vasan RS. Relations of serum phosphorus and calcium levels to the incidence of cardiovascular disease in the community. Arch Intern Med. 2007;167:879–885. doi: 10.1001/archinte.167.9.879 [DOI] [PubMed] [Google Scholar]
- 15. Campos‐Obando N, Lahousse L, Brusselle G, Stricker BH, Hofman A, Franco OH, Uitterlinden AG, Zillikens MC. Serum phosphate levels are related to all‐cause, cardiovascular and copd mortality in men. Eur J Epidemiol. 2018;33:859–871. doi: 10.1007/s10654-018-0407-7 [DOI] [PMC free article] [PubMed] [Google Scholar]
- 16. Onufrak SJ, Bellasi A, Shaw LJ, Herzog CA, Cardarelli F, Wilson PW, Vaccarino V, Raggi P. Phosphorus levels are associated with subclinical atherosclerosis in the general population. Atherosclerosis. 2008;199:424–431. doi: 10.1016/j.atherosclerosis.2007.11.004 [DOI] [PubMed] [Google Scholar]
- 17. Villa‐Bellosta R, Millan A, Sorribas V. Role of calcium‐phosphate deposition in vascular smooth muscle cell calcification. Am J Physiol Cell Physiol. 2011;300:C210–C220. doi: 10.1152/ajpcell.00229.2010 [DOI] [PubMed] [Google Scholar]
- 18. Nakahara T, Kawai‐Kowase K, Matsui H, Sunaga H, Utsugi T, Iso T, Arai M, Tomono S, Kurabayashi M. Fibroblast growth factor 23 inhibits osteoblastic gene expression and induces osteoprotegerin in vascular smooth muscle cells. Atherosclerosis. 2016;253:102–110. doi: 10.1016/j.atherosclerosis.2016.08.010 [DOI] [PubMed] [Google Scholar]
- 19. Scialla JJ, Lau WL, Reilly MP, Isakova T, Yang HY, Crouthamel MH, Chavkin NW, Rahman M, Wahl P, Amaral AP, et al. Fibroblast growth factor 23 is not associated with and does not induce arterial calcification. Kidney Int. 2013;83:1159–1168. doi: 10.1038/ki.2013.3 [DOI] [PMC free article] [PubMed] [Google Scholar]
- 20. Gronhoj MH, Gerke O, Mickley H, Steffensen FH, Lambrechtsen J, Sand NPR, Rasmussen LM, Olsen MH, Diederichsen A. Associations between calcium‐phosphate metabolism and coronary artery calcification; a cross sectional study of a middle‐aged general population. Atherosclerosis. 2016;251:101–108. doi: 10.1016/j.atherosclerosis.2016.06.001 [DOI] [PubMed] [Google Scholar]
- 21. Diederichsen SZ, Grønhøj MH, Mickley H, Gerke O, Steffensen FH, Lambrechtsen J, Rønnow Sand NP, Rasmussen LM, Olsen MH, Diederichsen A. CT‐detected growth of coronary artery calcification in asymptomatic middle‐aged subjects and association with 15 biomarkers. JACC Cardiovasc Imaging. 2017;10:858–866. doi: 10.1016/j.jcmg.2017.05.010 [DOI] [PubMed] [Google Scholar]
- 22. Shin S, Kim KJ, Chang HJ, Cho I, Kim YJ, Choi BW, Rhee Y, Lim SK, Yang WI, Shim CY, et al. Impact of serum calcium and phosphate on coronary atherosclerosis detected by cardiac computed tomography. Eur Heart J. 2012;33:2873–2881. doi: 10.1093/eurheartj/ehs152 [DOI] [PubMed] [Google Scholar]
- 23. Burgess S, Small DS, Thompson SG. A review of instrumental variable estimators for mendelian randomization. Stat Methods Med Res. 2017;26:2333–2355. doi: 10.1177/0962280215597579 [DOI] [PMC free article] [PubMed] [Google Scholar]
- 24. Ikram MA, Brusselle G, Ghanbari M, Goedegebure A, Ikram MK, Kavousi M, Kieboom BCT, Klaver CCW, de Knegt RJ, Luik AI, et al. Objectives, design and main findings until 2020 from the Rotterdam Study. Eur J Epidemiol. 2020;35:483–517. doi: 10.1007/s10654-020-00640-5 [DOI] [PMC free article] [PubMed] [Google Scholar]
- 25. Agatston AS, Janowitz WR, Hildner FJ, Zusmer NR, Viamonte M Jr, Detrano R. Quantification of coronary artery calcium using ultrafast computed tomography. J Am Coll Cardiol. 1990;15:827–832. doi: 10.1016/0735-1097(90)90282-T [DOI] [PubMed] [Google Scholar]
- 26. Hofman A, Brusselle GG, Darwish Murad S, van Duijn CM, Franco OH, Goedegebure A, Ikram MA, Klaver CC, Nijsten TE, Peeters RP, et al. The Rotterdam Study: 2016 objectives and design update. Eur J Epidemiol. 2015;30:661–708. doi: 10.1007/s10654-015-0082-x [DOI] [PMC free article] [PubMed] [Google Scholar]
- 27. Koehler EM, Sanna D, Hansen BE, van Rooij FJ, Heeringa J, Hofman A, Tiemeier H, Stricker BH, Schouten JN, Janssen HL. Serum liver enzymes are associated with all‐cause mortality in an elderly population. Liver Int. 2014;34:296–304. doi: 10.1111/liv.12311 [DOI] [PubMed] [Google Scholar]
- 28. Kestenbaum B, Glazer NL, Kottgen A, Felix JF, Hwang SJ, Liu Y, Lohman K, Kritchevsky SB, Hausman DB, Petersen AK, et al. Common genetic variants associate with serum phosphorus concentration. J Am Soc Nephrol. 2010;21:1223–1232. doi: 10.1681/ASN.2009111104 [DOI] [PMC free article] [PubMed] [Google Scholar]
- 29. Kanai M, Akiyama M, Takahashi A, Matoba N, Momozawa Y, Ikeda M, Iwata N, Ikegawa S, Hirata M, Matsuda K, et al. Genetic analysis of quantitative traits in the japanese population links cell types to complex human diseases. Nat Genet. 2018;50:390–400. doi: 10.1038/s41588-018-0047-6 [DOI] [PubMed] [Google Scholar]
- 30. Leening MJ, Kavousi M, Heeringa J, van Rooij FJ, Verkroost‐van Heemst J, Deckers JW, Mattace‐Raso FU, Ziere G, Hofman A, Stricker BH, et al. Methods of data collection and definitions of cardiac outcomes in the Rotterdam Study. Eur J Epidemiol. 2012;27:173–185. doi: 10.1007/s10654-012-9668-8 [DOI] [PMC free article] [PubMed] [Google Scholar]
- 31. Brahimaj A, Muka T, Kavousi M, Laven JS, Dehghan A, Franco OH. Serum dehydroepiandrosterone levels are associated with lower risk of type 2 diabetes: the Rotterdam Study. Diabetologia. 2017;60:98–106. doi: 10.1007/s00125-016-4136-8 [DOI] [PMC free article] [PubMed] [Google Scholar]
- 32. Marrie RA, Dawson NV, Garland A. Quantile regression and restricted cubic splines are useful for exploring relationships between continuous variables. J Clin Epidemiol. 2009;62:511–517.e511. doi: 10.1016/j.jclinepi.2008.05.015 [DOI] [PubMed] [Google Scholar]
- 33. StataCorp . Stata Statistical Software: Release 16. College Station, TX: StataCorp LLC; 2019. [Google Scholar]
- 34. Shanahan CM, Crouthamel MH, Kapustin A, Giachelli CM. Arterial calcification in chronic kidney disease: key roles for calcium and phosphate. Circ Res. 2011;109:697–711. doi: 10.1161/CIRCRESAHA.110.234914 [DOI] [PMC free article] [PubMed] [Google Scholar]
- 35. Shaw LJ, Giambrone AE, Blaha MJ, Knapper JT, Berman DS, Bellam N, Quyyumi A, Budoff MJ, Callister TQ, Min JK. Long‐term prognosis after coronary artery calcification testing in asymptomatic patients: a cohort study. Ann Intern Med. 2015;163:14–21. doi: 10.7326/M14-0612 [DOI] [PubMed] [Google Scholar]
- 36. Sohl E, de Jongh RT, Heymans MW, van Schoor NM, Lips P. Thresholds for serum 25(OH)D concentrations with respect to different outcomes. J Clin Endocrinol Metab. 2015;100:2480–2488. doi: 10.1210/jc.2015-1353 [DOI] [PubMed] [Google Scholar]
- 37. Haarhaus M, Brandenburg V, Kalantar‐Zadeh K, Stenvinkel P, Magnusson P. Alkaline phosphatase: a novel treatment target for cardiovascular disease in CKD. Nat Rev Nephrol. 2017;13:429–442. doi: 10.1038/nrneph.2017.60 [DOI] [PubMed] [Google Scholar]
- 38. Burgess S, Thompson SG. Use of allele scores as instrumental variables for Mendelian randomization. Int J Epidemiol. 2013;42:1134–1144. doi: 10.1093/ije/dyt093 [DOI] [PMC free article] [PubMed] [Google Scholar]
- 39. UK Biobank — Neale lab [Internet] . Neale lab. 2018. [cited 2020 Aug 11]. Available at: http://www.nealelab.is/uk‐biobank/
- 40. Konig IR, Loley C, Erdmann J, Ziegler A. How to include chromosome X in your genome‐wide association study. Genet Epidemiol. 2014;38:97–103. doi: 10.1002/gepi.21782 [DOI] [PubMed] [Google Scholar]
- 41. Hartwig FP, Davies NM. Why internal weights should be avoided (not only) in MR‐Egger regression. Int J Epidemiol. 2016;45:1676–1678. doi: 10.1093/ije/dyw240 [DOI] [PubMed] [Google Scholar]
- 42. Windmeijer F, Farbmacher H, Davies N, Davey SG. On the use of the lasso for instrumental variables estimation with some invalid instruments. J Am Stat Assoc. 2018;114:1339–1350. doi: 10.1080/01621459.2018.1498346 [DOI] [PMC free article] [PubMed] [Google Scholar]
- 43. Burgess S, Bowden J, Fall T, Ingelsson E, Thompson SG. Sensitivity analyses for robust causal inference from Mendelian randomization analyses with multiple genetic variants. Epidemiology. 2017;28:30–42. doi: 10.1097/EDE.0000000000000559 [DOI] [PMC free article] [PubMed] [Google Scholar]
- 44. Palmer TM, Lawlor DA, Harbord RM, Sheehan NA, Tobias JH, Timpson NJ, Davey Smith G, Sterne JA. Using multiple genetic variants as instrumental variables for modifiable risk factors. Stat Methods Med Res. 2012;21:223–242. doi: 10.1177/0962280210394459 [DOI] [PMC free article] [PubMed] [Google Scholar]
- 45. Berzuini C, Guo H, Burgess S, Bernardinelli L. A Bayesian approach to Mendelian randomization with multiple pleiotropic variants. Biostatistics. 2020;21:86–101. doi: 10.1093/biostatistics/kxy027 [DOI] [PMC free article] [PubMed] [Google Scholar]
- 46. Onufrak SJ, Bellasi A, Cardarelli F, Vaccarino V, Muntner P, Shaw LJ, Raggi P. Investigation of gender heterogeneity in the associations of serum phosphorus with incident coronary artery disease and all‐cause mortality. Am J Epidemiol. 2009;169:67–77. doi: 10.1093/aje/kwn285 [DOI] [PMC free article] [PubMed] [Google Scholar]
- 47. Hemani G, Bowden J, Davey SG. Evaluating the potential role of pleiotropy in Mendelian randomization studies. Hum Mol Genet. 2018;27:R195–R208. doi: 10.1093/hmg/ddy163 [DOI] [PMC free article] [PubMed] [Google Scholar]
- 48. Viegas CSB, Santos L, Macedo AL, Matos AA, Silva AP, Neves PL, Staes A, Gevaert K, Morais R, Vermeer C, et al. Chronic kidney disease circulating calciprotein particles and extracellular vesicles promote vascular calcification: a role for GRP (Gla‐Rich Protein). Arterioscler Thromb Vasc Biol. 2018;38:575–587. doi: 10.1161/ATVBAHA.117.310578 [DOI] [PubMed] [Google Scholar]
- 49. Rzewuska‐Lech E, Jayachandran M, Fitzpatrick LA, Miller VM. Differential effects of 17beta‐estradiol and raloxifene on VSMC phenotype and expression of osteoblast‐associated proteins. Am J Physiol Endocrinol Metab. 2005;289:E105–E112. doi: 10.1152/ajpendo.00366.2004 [DOI] [PubMed] [Google Scholar]
- 50. Felsenfeld AJ, Rodriguez M. Phosphorus, regulation of plasma calcium, and secondary hyperparathyroidism: a hypothesis to integrate a historical and modern perspective. J Am Soc Nephrol. 1999;10:878–890. doi: 10.1681/ASN.V104878 [DOI] [PubMed] [Google Scholar]
- 51. Calvo MS, Kumar R, Heath H III. Elevated secretion and action of serum parathyroid hormone in young adults consuming high phosphorus, low calcium diets assembled from common foods. J Clin Endocrinol Metab. 1988;66:823–829. doi: 10.1210/jcem-66-4-823 [DOI] [PubMed] [Google Scholar]
- 52. Kuro‐o M. Klotho, phosphate and FGF‐23 in ageing and disturbed mineral metabolism. Nat Rev Nephrol. 2013;9:650–660. doi: 10.1038/nrneph.2013.111 [DOI] [PubMed] [Google Scholar]
- 53. Authority EFS . Assessment of one published review on health risks associated with phosphate additives in food. EFSA J. 2013;11:3444–3471. [Google Scholar]
- 54. Komaba H, Fukagawa M. Phosphate—a poison for humans? Kidney Int. 2016;90:753–763. doi: 10.1016/j.kint.2016.03.039 [DOI] [PubMed] [Google Scholar]
Associated Data
This section collects any data citations, data availability statements, or supplementary materials included in this article.
Supplementary Materials
Data S1
Tables S1–S8
Figure S1