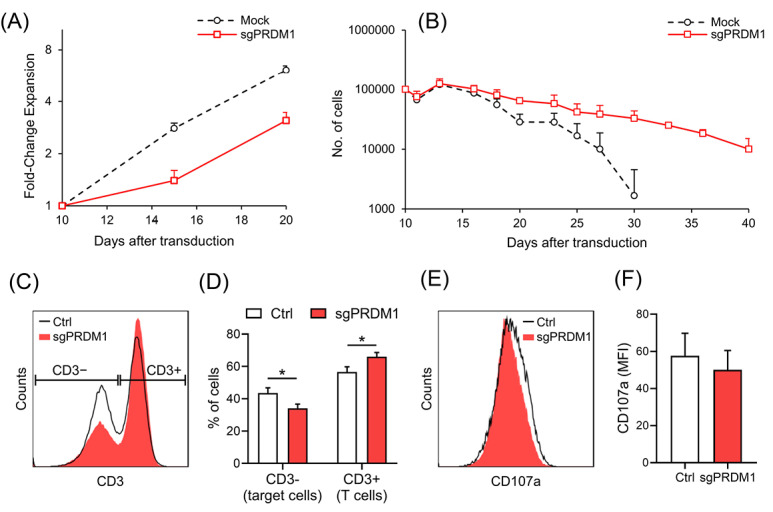
Fig. 8.

The effect of BLIMP1 knock-down on the functional characteristics of T cells. A) The line graph represents fold change expansion in the Mock and sgPRDM1 groups during a 10 day-expansion period. B) The line graph shows the trend for T cell death in the Mock and sgPRDM1 groups during a 30 day-expansion period after a re-stimulation on day 3. C) Representative flow cytometry data of a co-culture of T cells with target cells (K562-OKT3) analyzed after three days. T cells were distinguished from target cells based on CD3 expression. D) A summary of data observed from the co-culture experiment (n = 3) shows significantly fewer target cells in the BLIMP1-deficient T cell group (sgPRDM1) compared to untransduced T cells (Ctrl). E) Representative data for the expression of a degranulation marker, CD107a, on T cells in the co-culture experiment. F) CD107a median fluorescent intensity (MFI) measured in the co-culture experiment (n = 3). The data are presented as mean ± SD, *P < 0.05. BLIMP1: B lymphocyte-induced maturation protein 1.
