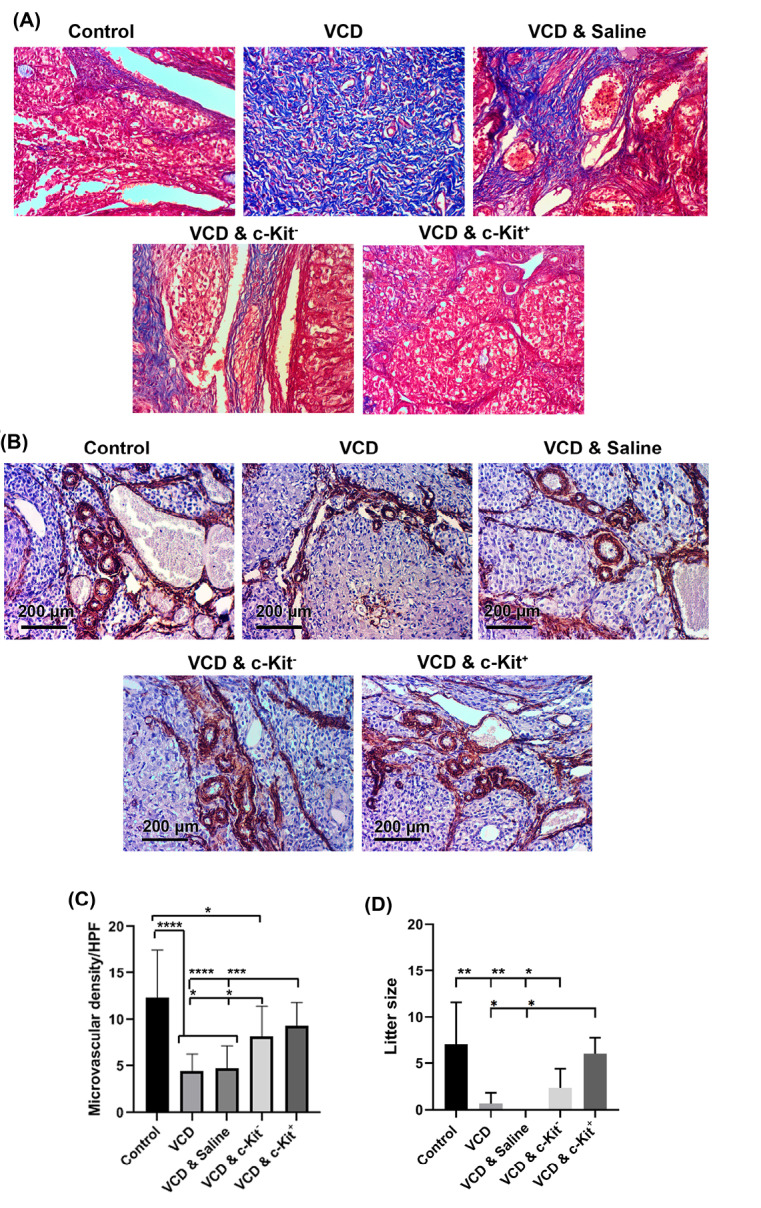
Fig. 5.

Masson’s Trichrome staining 8 weeks after administration of c-Kit cells in VCD-treated rats (A). Measuring angiogenic potential of c-Kit+ cells after IHC staining against α-SMA (B and C); Litter size following the cell transplantation 8 weeks after intervention (D); The increasing number of asterisks represents increasing significant differences (P ≤0.05, P ≤0.01, P ≤0.001, P ≤0.0001, respectively).
