Abstract
Abstract
A simple, accurate, precise, and specific high-performance thin-layer chromatography (HPTLC) method for the quantitative determination and validation of baicalin in different extracts of Oroxylum indicum has been developed for the first time. The mobile phase of acetone‒ethyl acetate‒water‒formic acid (2:10:0.5:0.5, V/V) was used for achieving good separation. Densitometric determination was carried out at 318 nm. The calibration curves were found to be linear in the range between 200 and 1000 ng per spot. During the analysis, the ethanolic extract of O. indicum showed higher content of baicalin than acetone, DMSO, and DMF extracts. Further, the antioxidant potential of different extracts of O. indicum were assessed with the 2,2-diphenyl-1-picrylhydrazyl (DPPH) method. The developed method of HPTLC was validated for specificity, accuracy, precision and linearity. The ethanolic extract has unveiled significant antioxidant activity with a percentage inhibition of 67.34%.
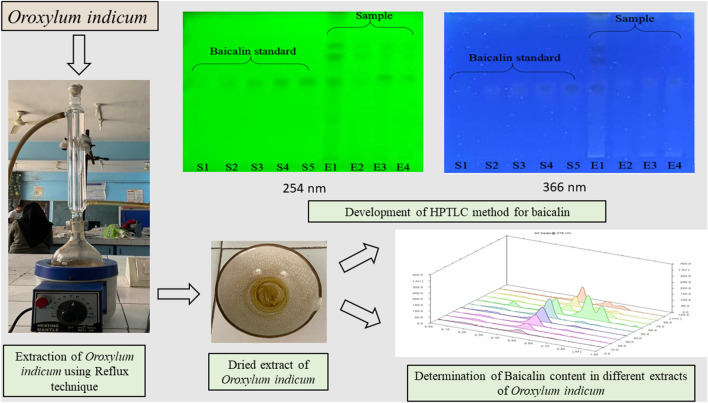
Graphic Abstract
Keywords: Baicalin, Oroxylum indicum, High-performance thin-layer chromatography (HPTLC), Antioxidant activity
Introduction
Oroxylum indicum (L.) Kurz, tree of Damocles, is a widely distributed deciduous tree throughout the Asian continent [1]. It has been used as a prime ingredient in various ayurvedic medicinal preparations such as Dasamula, Brahma Rasayana, Dantyadyarista, Dhanawantara Ghrita, Amartarista, Chyawanprash Awaleha, and Narayana Taila [2, 3]. In folk medicinal practices, the plant has gained significant importance as a blood purifier, astringent, tonic, diuretic, carminative, laxative, and also used for other common problems like diarrohea, allergic dermatitis, and dysentery [4–9].
As per Ayurveda, diversified medicinal properties are ascribed to various parts of the Indian trumpet tree [10]. The plant exhibits antioxidant [11], anti-inflammatory [11], analgesic [11], antimicrobial [14–16], anticancer [10], photocytotoxic [10], antimutagenic [10], antiarthritic [10], immunostimulant [10], and antiproliferative activities [10]. Various other effects like antiallergic [13], antiasthmatic [12], antihelmintic [17], antidiabetic [25], cardioprotective [24], gastroprotective [23], hepatoprotective [18–21], antiobesity [22], and wound-healing [10] have also been explored. The potential against severe acute respiratory syndrome coronavirus 2 (SARS-CoV-2) has also been reported [26].
O. indicum contains a broad variety of phytochemicals such as tannins, alkaloids, saponins, sterols, flavonoids, lignins, glycosides, phenols, fats and oils. The active constituent of the O. indicum is baicalin [10].
Baicalin, a bioactive natural glycosyloxyflavone having the formula 5,6-dihydroxy-4-oxygen-2-phenyl-4H-1-benzopyran-7-β-D-glucopyranose acid (shown in Fig. 1), has been copiously explored both in vivo and in vitro [27]. It possesses a multifaceted biological profile, including cardioprotective, nephroprotective, hepatoprotective, and neuroprotective activity. It exhibits anti-viral, anti-tumor, anti-inflammatory, antibacterial, antioxidant, antiarthritic, and antipsoriatic effects [28]. Baicalin is also the main ingredient of flavocoxid, which is an approved medical food and classified under Generally Recognised as Safe (GRAS) category by the United States Food and Drug Administration (USFDA) [29]. Since it possesses several health-endorsing properties, it can be considered as a suitable chemical marker for the quality control of O. indicum.
Fig. 1.

The chemical structure of baicalin
Thin-layer chromatography (TLC) is an extensively utilized technique for assessing the identity, content, and purity of herbal drugs. Chromatographic fingerprinting analysis along with analytical method development for phytoconstituents are requisite approaches for the quality control of herbal drugs [30, 31]. Several studies have reported the developed high-performance thin-layer chromatography (HPTLC) method for baicalin from Scutellaria radix [32] and Scutellaria lateriflora [33]. However, no researcher has developed the HPTLC method for the identification and quantification of baicalin from O. indicum. Therefore, our present work deals with the development and validation of a simple, rapid, precise, sensitive, economical and specific HPTLC method for the identification and quantification of baicalin in O. indicum as there is a paucity of phytochemical research on this plant. In vitro antioxidant activities of baicalin using the 2,2-diphenyl-1-picrylhydrazyl (DPPH) method in different extracts of O. indicum were also been assessed.
Experimental
Collection, authentication, and preparation of plant specimen
The stem barks of O. indicum L. were procured from the medicinal plant market, Delhi, India. Identification and authentication were done by CSIR-National Institute of Science Communication and Policy Research (NIScPR), New Delhi, India, with authentication number NIScPR/RHMD/Consult/2021/3880-81.
Chemicals
Analytical grade methanol, ethanol, acetone, dimethyl sulfoxide (DMSO), and dimethylformamide (DMF) were purchased from SD Fine Chem Ltd. (Mumbai, India). Pre-coated HPTLC plates 60 F254 were acquired from Merck (Mumbai, India). Standard baicalin was purchased from Sigma-Aldrich (St. Louis, MO, USA).
Preparation of the extract
The stem barks of O. indicum were shade-dried, powdered, and passed through the sieve having 40 mesh size sieve. An aliquot of 10 g of dried plant material was taken and imperiled to a reflux extraction using four different solvents: ethanol, acetone, DMSO, and DMF at a temperature of 50 °C for 60 min, with a drug-to-solvent ratio of 1:10 g/mL. After extraction, solid residue was separated and removed by filtration and the filtrate was being concentrated in a rotary evaporator; each extract was weighed, and the percentage yield was determined.
Prefatory phytochemical evaluations
The presence of various phytochemicals (alkaloids, carbohydrate, glycoside, phenolic compounds, flavonoids, phytosterols, triterpenoids, steroid, resins and tannin) in ethanolic, acetonic, DMSO and DMF extracts of O. indicum were assessed by prefatory phytochemical investigation.
HPTLC fingerprint analysis
Preparation of standard and sample solutions
The sample solutions were prepared by dissolving 1 g of the dried extracts of O. indicum in methanol. A standard baicalin solution (1 mg/mL) was prepared by dissolving 2 mg of baicalin in 2 mL of methanol. The standard solutions and sample solutions (extracts) were filtered by dint of a 0.22 μm Millipore (Burlington, MA, USA) syringe filter for analysis.
Development of a solvent system
For the elution, diverse solvent systems were utilized: chloroform‒methanol‒water‒formic acid (10:2:0.5:0.5, V/V), chloroform‒acetone‒water‒formic acid (10:2:0.5:0.5, V/V), chloroform‒methanol‒water‒formic acid (10:2:1.0:0.5, V/V), chloroform‒acetone‒water‒formic acid (10:2:1.0:0.5, V/V), acetone‒ethyl acetate‒water‒formic acid (2:10:0.5:0.5, V/V), and acetone‒ethyl acetate‒water‒formic acid (2:10:1.0:0.5, V/V). The solvent system consisting of acetone‒ethyl acetate‒water‒formic acid (2:10:0.5:0.5, V/V) was selected based on improved resolution.
Sample application and development of chromatogram
The standard solution and sample solutions were loaded on the 10 × 10 cm plates as 6 mm bands by using a 100 μL syringe with the assistance of a CAMAG (Muttenz, Switzerland) Linomat 5 automatic applicator with an application rate of 150 nL/s in the presence of nitrogen gas. The narrow interspaces between the bands were 10 mm. The plate was developed in a twin-trough critical glass chamber (CAMAG) pre-saturated with the mobile phase consisting of acetone‒ethyl acetate‒water‒formic acid (2:10:0.5:0.5, V/V) and removed when the solvent reached up to 85 mm. To recognize the bands, the plate was further dried and heated at 60 °C in the oven for 5 min.
The densitometric study was carried out using CAMAG TLC Scanner 3 with winCATS software (Version 122.0) at a wavelength of 318 nm in reflectance mode by a tungsten (W) lamp. The slit dimension of 5.00 × 0.45 mm was used for scanning with a scanning rate of 20 ms‒1.
HPTLC method validation
The International Council for Harmonisation (ICH) guidelines were adopted for the validation of the parameters presented below.
Precision
5 simulates of pre-determined concentrations of baicalin (1 μg) were spotted on the plate for determining the instrumental precision. Reproducibility (inter-day), repeatability (intra-day) and precision were analyzed at five varying concentrations (0.2‒1.0 μg) levels by assessing three individual spots of baicalin spotted on the plate consequently for three days. Apropos of relative standard deviation (RSD), estimated values were expressed.
Limit of detection (LOD) and limit of quantification (LOQ)
The LOD and LOQ for baicalin marker were determined using the following expression:
where S represents the slope of the calibration curve, and σ represents the standard deviation.
Range and linearity
For estimating the linearity, the concentration range of baicalin was taken between 0.2 and 1.0 μg/band. Peak area against concentration was focused on for the analysis of intercept and the least square linear regression. From the calibration plot, values of regression and slope were deduced, and a linear correlation between test concentration and peak area was deduced. Densitometric scanning was carried out to estimate the concentration of baicalin in different extracts of O. indicum using a calibration plot.
Specificity
The process specificity was assessed by investigating the test sample, standard, diluent, and solvent system. By matching the RF values of the developed bands, a spot of baicalin in the extract was established. The spectra at three sundry levels of apex peak, end peak, and start peak of the spot were tallied and the purity of the standard peak was assessed.
Accuracy
By assessing the recovery of baicalin in the sample solution, the accuracy for the process was assessed. Fixed amounts of standard solution were impaled to 50%, 75%, and 100% with a pre-measured amount of the sample solution, and peak area was reckoned. Percentage recovery was determined using the following formula:
Robustness
The robustness was assessed by using the five kindred concentration levels (0.2, 0.4, 0.6, 0.8 and 1.0 μg/mL). By changing the ratio of the solvent system, amount of solvent system, time duration of saturation, a run-up of mobile phase on the plate, spotting time of standards and development time, the variations were observed in the baicalin chromatogram run.
Quantification of baicalin
The amount of baicalin in different extracts was quantified by employing the developed HPTLC method. Standard solutions of baicalin and sample solutions (different extracts of O. indicum) were spotted on the TLC plate, further, the plate was placed in the twin-trough chamber for the development. The amount of baicalin was quantified using the winCATS software (Table 1).
Table 1.
Baicalin content determined by the developed HPTLC‒densitometric method in the samples
| Sample | HPTLC Baicalin (mg/g) |
|---|---|
| E1 | 26.498 mg |
| E2 | 8.631 mg |
| E3 | 13.883 mg |
| E4 | 20.529 mg |
E1 Ethanolic extract of Oroxylum indicum, E2 Acetonic extract of Oroxylum indicum, E3 DMSO extract of Oroxylum indicum, E4 DMF extract of Oroxylum indicum
Antioxidant activity using DPPH
The antioxidant potentials of different extracts of O. indicum were determined by employing the DPPH method [34] in assistance with ultraviolet (UV) spectrophotometer at 517 nm. The aliquots of 20, 40, 60, 80, and 100 μg/mL of different extracts of O. indicum were taken in different tubes, to which methanol (5 mL) and 1 mM DPPH (0.5 mL) were added. Ascorbic acid (vitamin C) was availed as standard in a concentration of 20, 40, 60, 80, and 100 μg/mL. A blank solution containing methanol (5 mL) and 1 mM DPPH (0.5 mL) was made, and all the solutions were incubated for 0.5 h at ambient temperature. The antioxidant potential was assessed using the following equation:
Data are represented as mean of 4, IC50 values and sample size were assessed using linear regression analysis.
Results and discussion
Prefatory phytochemical screening
The chemical test and phytochemical screening of O. indicum extracts in ethanol, acetone, DMSO, and DMF signifies the presence of flavonoids and phenolic compounds (Table 2). The extractive value of baicalin in different solvents indicates the character and extent of phytobioactive constituents in each solvent (shown in Table 1). The ethanolic extract of O. indicum revealed the presence of triterpenoids, flavonoids, glycosides, phenolic compounds, alkaloids, reducing sugar and phytosterols as the major secondary metabolites which may be responsible for its therapeutic potential.
Table 2.
Prefatory phytochemical screening of the extracts of Oroxylum indicum stem barks in different solvents
| Plant extract + test reagent | Ethanol | Acetone | DMSO | DMF |
|---|---|---|---|---|
| Alkaloids | + | ‒ | ‒ | ‒ |
| Carbohydrate | + | + | ‒ | ‒ |
| Glycoside | + | + | ‒ | ‒ |
| Phenolic compounds | + + | + | + | + |
| Flavanoids | + + | + | + | + |
| Phytosterols | + | + | ‒ | ‒ |
| Triterpenoids | + | ‒ | ‒ | ‒ |
| Steroid | + | ‒ | ‒ | ‒ |
| Resins | ‒ | ‒ | ‒ | ‒ |
| Tannin | + | + | ‒ | ‒ |
+ : Present, ‒: Absent
HPTLC method development and validation
To quantify the flavonoid compounds in the different extracts of O. indicum, a validated HPTLC method was established for the concurrent quantification of baicalin. ICH guidelines were followed for process validation. The experimental circumstances like the movement of the solvent front, band size, chamber saturation time, and slit length were significantly varied. Further, the quintessential circumstances were selected (shown in Table 3).
Table 3.
Optimized HPTLC conditions for the analysis of baicalin
| HPTLC instrument | CAMAG Linomat 5 |
|---|---|
| Stationary phase | Silica gel 60 G F254 |
| Mobile phase | Acetone‒ethyl acetate‒water‒formic acid (2:10:0.5:0.5, V/V) |
| Observed RF values | Baicalin (0.49) |
| Band width | 6 mm |
| Saturation time | 30 min |
| Solvent front distance | 85 mm |
| Plate activation time | 15 min |
| Detection lamp | Deuterium |
| Detection wavelength | 318 nm |
| Scanning rate | 20 mm/s |
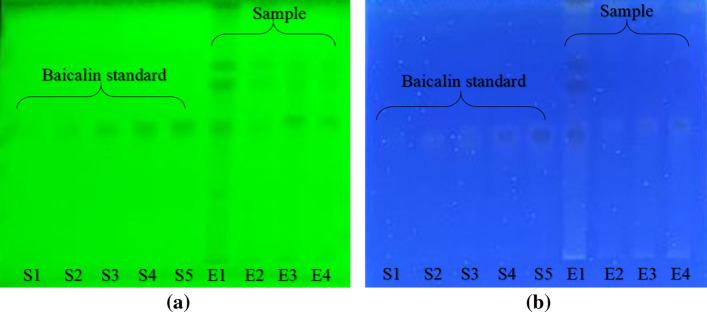
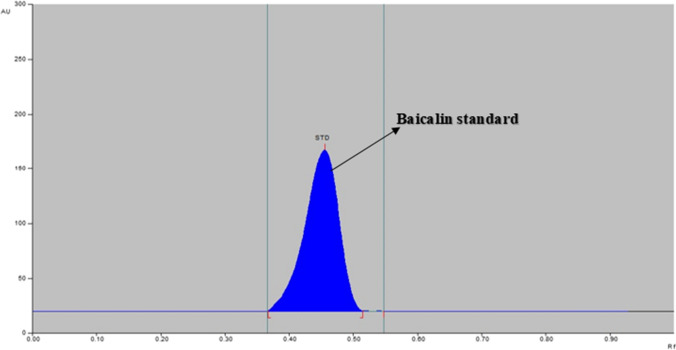
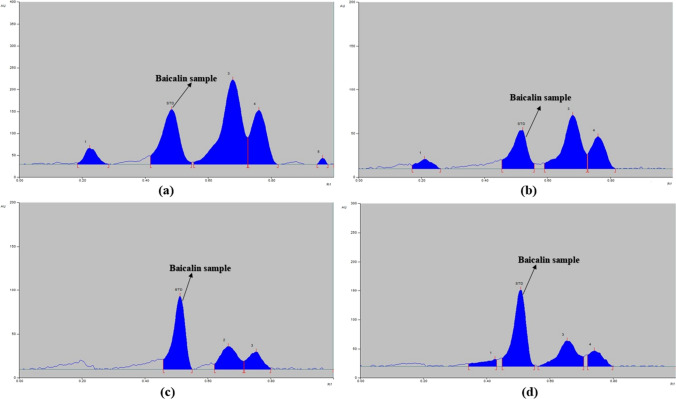
The standard and sample solutions were spotted on the 10 × 10 cm HPTLC plate and further developed using the above-established method. The developed HPTLC plate is shown in Fig. 2 and the chromatograms of standard baicalin (Fig. 3) and extract of O. indicum in ethanol, acetone, DMSO, and DMF are shown in Fig. 4.
Fig. 2.
Developed HPTLC plate a at λmax 254, and b at λmax 366 nm. Lanes S1‒S5: baicalin standard; Lane E1: Ethanolic extract of Oroxylum indicum; Lane E2: Acetonic extract of Oroxylum indicum; Lane E3: DMSO extract of Oroxylum indicum and Lane E4: DMF extract of Oroxylum indicum
Fig. 3.
HPTLC chromatogram of standard baicalin at λmax 318 nm
Fig. 4.
HPTLC chromatogram at λmax 318 nm of a Ethanolic extract of Oroxylum indicum; b Acetonic extract of Oroxylum indicum; c DMSO extract of Oroxylum indicum and d DMF extract of Oroxylum indicum
Precision
The method reproducibility was determined using the sample from the same homogenous batch by different analysis, and inter-day and intra-day precision was used to determine the repeatability. To ascertain the method’s effectiveness, suitability tests were done on a freshly prepared mixture of pre-analyzed ethanolic extract of O. indicum spiked with standard baicalin solution. The measurement of peak area and repeatability of sample application were denoted by %RSD. The %RSD of inter-day and intra-day analysis are shown in Table 4. Inter-day precision based on baicalin content was found to be 0.418%RSD, whereas intra-day precision based on baicalin content was found to be 0.396%RSD, respectively. Finally, the TLC‒densitometric method was reckoned to be precise based on the results obtained from the inter-day and intra-day precision evaluation study.
Table 4.
Regression data of baicalin and intra-day and inter-day precision of the HPTLC method developed for Oroxylum indicum
| Parameters | Value baicalin |
|---|---|
| Linearity range (μg/spot) | 0.2‒1.0 μg/spot |
| λmax | 318 nm |
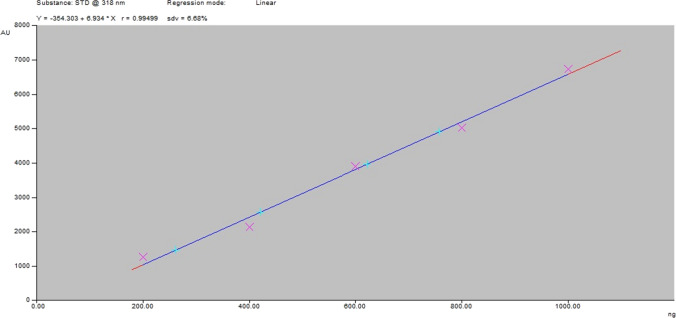
| Regression coefficient | Y = ‒354.303 + 6.934x |
| Correlation coefficient (R2) | 0.99499 |
| Slope (μg/spot) | 354.303 |
| Intercept | 6.934 |
| Limit of detection (μg/spot) | 0.056 |
| Limit of quantification (μg/spot) | 0.188 |
| RF value | 0.49 |
| % Recovery of baicalin | 99.17% |
| Intra-day precision (n = 3) | |||||
|---|---|---|---|---|---|
| Compounds | Conc. (μg/uL) | Area | Mean area | ± SD | %RSD |
| Baicalin | 0.2 | 1274.84 | 1286.27 | 10.41 | 0.81 |
| 0.4 | 2142.92 | 2155.63 | 12.92 | 0.60 | |
| 0.6 | 3912.62 | 3925.53 | 11.63 | 0.30 | |
| 0.8 | 5052.78 | 5062.82 | 8.76 | 0.17 | |
| Mean %RSD | 1.0 | 6758.76 | 6754.82 | 6.94 |
0.10 0.396 |
| Inter-day precision (n = 3) | |||||
|---|---|---|---|---|---|
| Compounds | Conc. (μg/uL) | Area | Mean area | ± SD | %RSD |
| Baicalin | 0.2 | 1251.35 | 1260.68 | 8.82 | 0.7 |
| 0.4 | 2126.03 | 2140.57 | 12.64 | 0.59 | |
| 0.6 | 3892.85 | 3909.51 | 14.47 | 0.37 | |
| 0.8 | 5025.26 | 5040.32 | 13.08 | 0.26 | |
| Mean %RSD | 1.0 | 6736.10 | 6747.26 | 11.40 |
0.17 0.418 |
LOD and LOQ
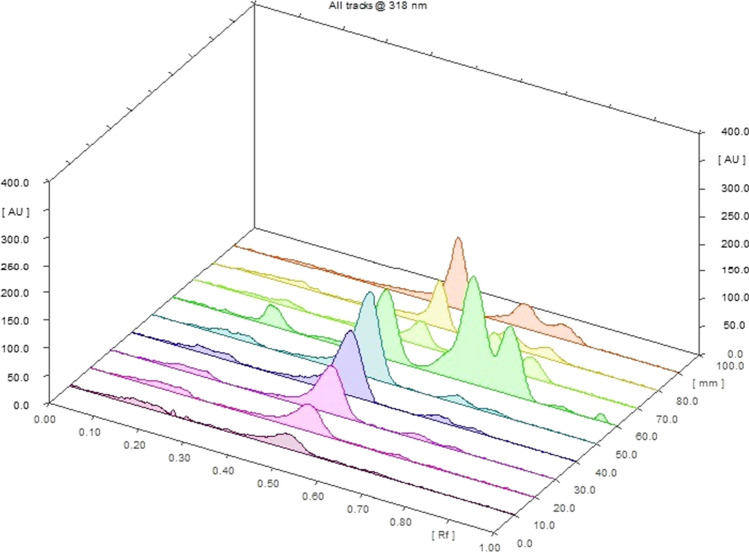
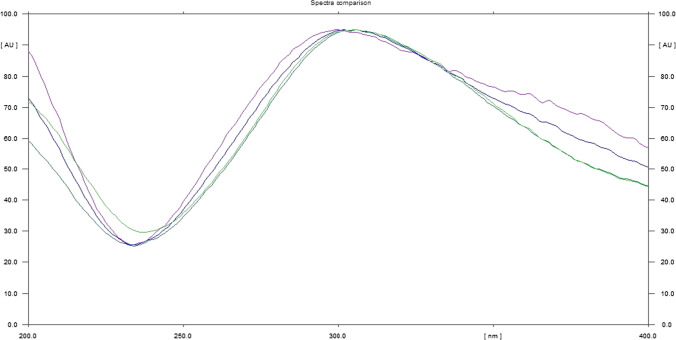
The LOD and LOQ were estimated using standard deviation of blank and slope of the calibration curve acquired from the standard solution of baicalin. The LOD and LOQ for baicalin were estimated to be 0.056 and 0.188 μg/band, respectively (shown in Table 4). The superimposed in situ UV spectra of baicalin and different extracts of O. indicum showed a good correlation (shown in Figs. 5 and 6). The peak clarity of baicalin was recognized by matching the in situ UV spectra of bands at different peaks.
Fig. 5.
3D overlaid HPTLC chromatograms of different extracts of Oroxylum indicum and standard baicalin at λmax 318 nm
Fig. 6.
Overlaid spectra of standard baicalin and sample between the ranges of 200‒400 nm
Range and linearity
A good linear correlation was established between quantity achieved and peak area for baicalin at 318 nm having a concentration range between 0.2 and 1.0 μg/spot and R2 correlation coefficient of 0.99499 (shown in Table 4). Linearity specifies a linear correlation between the analyte concentration and its signals in the test sample range (shown in Fig. 7).
Fig. 7.
Calibration plot for baicalin at λmax 318 nm
Specificity
The peak purity of baicalin was determined by matching the spectra at three sundry levels of apex peak, end peak and start peak of the spots. A good correlation was acquired between the sample and standard. Therefore the method can be reckoned specific as the peak of baicalin in different extracts of O. indicum did not interfere with the peak of standard baicalin.
Accuracy (recovery studies)
For recovery studies, the method of standard addition was employed. At two different levels, the recoveries of added standards were determined. The results of recovery studies and content estimation of baicalin from ethanolic extract of O. indicum after impaling it with 200‒400 ng/spot of the auxiliary standard are shown in Table 5. At two different levels, the average percent recoveries were found in the range of 98.96‒99.52%, which indicates the reproducibility and reliability of the method, respectively.
Table 5.
Recovery studies
| Standard | Amount added | Amount recovered (% mean) |
SD | %RSD |
|---|---|---|---|---|
| Baicalin | 50 | 98.96 | 0.17 | 0.18 |
| 75 | 99.05 | 0.24 | 0.25 | |
| Mean | 100 |
99.52 99.17 |
0.27 | 0.28 |
Robustness
The SD of peak areas was determined for every parameter, and %RSD was reckoned to be < 2%, indicating the method’s robustness. This also shows that the propound method was reproducible and precise.
Antioxidant activity
The antioxidant potential of the different extracts of O. indicum was scrutinized by employing DPPH radical scavenging activity. Test samples were estimated by utilizing DPPH free radicals in the form of purple color in test samples. When the DPPH solution is exposed to tested samples, it donates a hydrogen atom and the resultant gets converted into its reduced form, i.e., diphenylpicrylhydrazine (yellow color non-radical). The antioxidant potential of the different extracts were collated with vitamin C (standard antioxidant compound). The IC50 value was quantified graphically for determining the DPPH scavenging activity of different extracts of O. indicum.
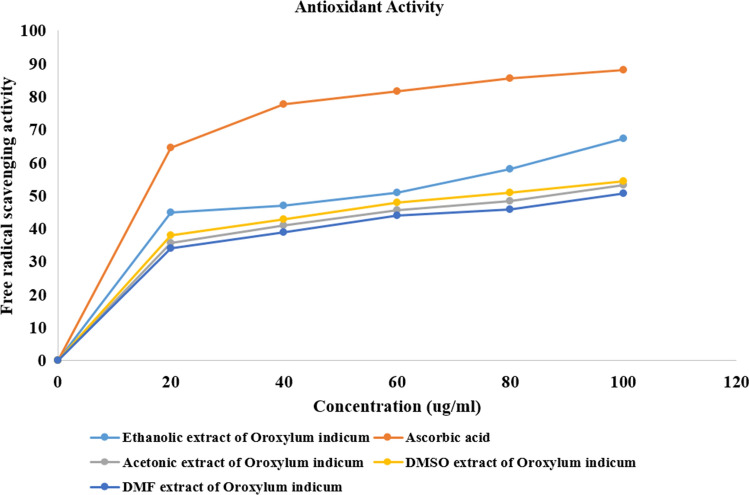
The ethanolic extract of O. indicum showed maximum DPPH scavenging activity at a concentration of 100, i.e., 67.34% compared to O. indicum extracts in acetone, DMSO, and DMF, which were 53.27%, 54.28%, and 50.67%. The standard vitamin C showed 88.15% activity.
From Fig. 8, it is intuited that the DPPH scavenging activity of the extracts increases as the concentration of extracts increases and ethanolic extract showed maximum activity compared to other extracts; it can be divulged that the antioxidant potential of the ethanolic extract of O. indicum may be accredited with the presence of phenolic compounds and flavonoids.
Fig. 8.
Dose-dependent scavenging of DPPH radicals by the different extracts of Oroxylum indicum compared with standard drug ascorbic acid. Each value represent mean ± SD (n = 3)
Conclusion
A simple validated HPTLC method for the quantification of baicalin in O. indicum has been developed. The established method is precise, specific, simple, time-saving, and cost-effective. The proposed HPTLC method can be used as a quality control tool for the quantification of bioactive baicalin in different plant extracts and polyherbal formulations. From DPPH scavenging activity, it was found that the plant exhibits significant antioxidant activity and further research on characterization, separation, and pharmacological evaluation of other antioxidant compounds in different extracts of O. indicum may help the researchers to find new chemical entities with therapeutical potential.
Acknowledgements
Authors are thankful to the Head, Department of Pharmacognosy and Phytochemistry, School of Pharmaceutical Research & Education, Jamia Hamdard, New Delhi, for providing necessary research facilities to carry out this study.
Declarations
Conflict of interest
The authors declare that they have no conflicts of interest.
Footnotes
Syeda Nashvia Adin and Isha Gupta have equal contribution in this article and should be considered joint first author.
Contributor Information
Mohd. Aqil, Email: aqilmalik@yahoo.com
Mohd. Mujeeb, Email: mohdmujeeb72@gmail.com
References
- 1.Chauhan NS. Medicinal and aromatic plants of Himachal Pradesh. 1. New Delhi: Indus Publishing; 1999. Oroxylum indicum; pp. 96–298. [Google Scholar]
- 2.Zaveri M, Khandhar A, Jain S. Quantification of Baicalein, Chrysin, Biochanin-A and Ellagic acid in root bark of Oroxylum indicum by RP-HPLC with UV detection. Eurasian J Anal Chem. 2008;3:245–257. [Google Scholar]
- 3.Jabbar S, Khan MT, Choudhuri MS, Sil BK. Bioactivity studies of the individual ingredients of the Dashamularishta. Pak J Pharm Sci. 2004;17:9–17. [PubMed] [Google Scholar]
- 4.Khare CP. Oroxylum indicum. In: Khare CP, editor. Indian herbal remedies: rational western therapy, ayurvedic and other traditional usage, Botany. 4. New York: Springer; 2004. pp. 340–341. [Google Scholar]
- 5.Bhattacharje SK. Use of flavours and fragrances. In: Bhattacharje SK, editor. Handbook of aromatic plants. 2. Jaipur: Pointer Publishers; 2005. [Google Scholar]
- 6.Kirtikar K, Basu B (2001) Indian Medicinal Plants. Oriental Enterprises, Deharadun, Volume 4.
- 7.Paranjpe P. Indian Medicinal Plants. Delhi: Chaukhamba Sanskrit Pratishthan; 2005. [Google Scholar]
- 8.Warrier P, Nambiar V, Ramankutty C. Indian medicinal plants—a compendium of 500 species. Chennai: Orient Longman Ltd.; 1995. [Google Scholar]
- 9.Dinda B, Silsarma I, Dinda M, Rudrapaul P. Oroxylum indicum (L.) Kurz, an important Asian traditional medicine: from traditional uses to scientific data for its commercial exploitation. J Ethnopharmacol. 2015;161:255–278. doi: 10.1016/j.jep.2014.12.027. [DOI] [PubMed] [Google Scholar]
- 10.Jagetia G. A review on the medicinal and pharmacological properties of traditional ethnomedicinal plant sonapatha, Oroxylum indicum. Sinusitis. 2021;5:71–89. doi: 10.3390/sinusitis5010009. [DOI] [Google Scholar]
- 11.Laloo D, Gogoi B, Lyngdoh W, Zaman K, Sharma H. Antioxidant, analgesic and anti-inflammatory activities of bark of Oroxylum indicum Vent: an endemic medicinal plant of Northeast India. Asian J Chem. 2016;28:2272–2276. doi: 10.14233/ajchem.2016.19968. [DOI] [Google Scholar]
- 12.Bergeron C, Hamid Q. Relationship between asthma and rhinitis: Epidemiologic, pathophysiologic, and therapeutic aspects. Allergy Asthma Clin Immunol. 2005;1:81–87. doi: 10.1186/1710-1492-1-2-81. [DOI] [PMC free article] [PubMed] [Google Scholar]
- 13.Lee AY, Kang S, Park SJ, Huang J, Im DS. Anti-allergic effect of oroxylin a from Oroxylum indicum using in vivo and in vitro experiments. Biomol Ther. 2016;24:283–290. doi: 10.4062/biomolther.2016.071. [DOI] [PMC free article] [PubMed] [Google Scholar]
- 14.Rasadah MA, Houghton PJ, Hoo TS. Antifungal activity of some Bignoniaceae found in Malaysia. Phyther Res. 1998;12:331–334. doi: 10.1002/(SICI)1099-1573(199808)12:5<331::AID-PTR305>3.0.CO;2-W. [DOI] [Google Scholar]
- 15.Samatha T, Sampath A, Sujatha K, Rama Swamy N. Antibacterial activity of stem bark extracts of Oroxylum indicum an endangered ethnomedicinal forest tree. IOSR J Pharm. 2011;7:24–28. [Google Scholar]
- 16.Das S, Choudhury MD. Antimicrobial activity of stem bark extracts from the plant Oroxylum indicum Vent. Assam Univ J Sci Technol. 2010;5:95–99. [Google Scholar]
- 17.Islam M, Rahman MM, Hasan M, Rahaman M, Khan MRH, Al-Faysal A. Evaluation of anthelmintic activity of crude extracts and different fractions of stem bark and fruits of Oroxylum indicum. World J Pharm Res. 2016;5:287–294. [Google Scholar]
- 18.Tripathy B, Panda S, Sahoo S, Mishra S, Nayak L. Phytochemical analysis and hepatoprotective effect of stem bark of Oroxylum indicum (L.) Vent. on carbon tetrachloride induced hepatotoxicity in rat. Int J Pharm Biol Arch. 2011;2:1714–1717. [Google Scholar]
- 19.Bharali MK, Konya H, Bahadur CL. Protective effect of Oroxylum indicum on acetaminophen induced liver injury in rat. Int Curr Pharm J. 2014;3:223–227. doi: 10.3329/icpj.v3i2.17511. [DOI] [Google Scholar]
- 20.More A, Shah T, Parab P, Apte K. Oroxylum indicum (Linn.) whole stem extract regulates expression of TNFα, IL6, NFkB, P38 MAPK and oxidative status in antitubercular therapy induced hepatotoxicity in Wistar rats. Matters. 2017;3:e201704000014. [Google Scholar]
- 21.Mohapatra SS, Roy R, Mohan P, Upadhyaya T, Sarma J. Phytochemical analysis and hepatoprotective effect of hydroethanolic extract of stem bark of Oroxylum indicum. Int J Curr Microbiol Appl Sci. 2018;7:1000–1006. doi: 10.20546/ijcmas.2018.701.120. [DOI] [Google Scholar]
- 22.Sun W, Liu P, Yang B, Wang M, Wang T, Sun W, Wang X, Zheng W, Song X, Li J. A network pharmacology approach: Inhibition of the NF-κB signaling pathway contributes to the NASH preventative effect of an Oroxylum indicum seed extract in oleic acid-stimulated HepG2 cells and high-fat diet-fed rats. Phytomedicine. 2021;88:153498. doi: 10.1016/j.phymed.2021.153498. [DOI] [PubMed] [Google Scholar]
- 23.Zaveri M, Jain S. Gastroprotective effects of root bark of Oroxylum indicum, Vent. J Nat Remed. 2007;7:269–277. [Google Scholar]
- 24.Menon S, Lawrence L, Sivaram VP, Padikkala J. Oroxylum indicum root bark extract prevents doxorubicin-induced cardiac damage by restoring redox balance. J Ayurveda Integr Med. 2019;10:159–165. doi: 10.1016/j.jaim.2017.06.007. [DOI] [PMC free article] [PubMed] [Google Scholar]
- 25.Tamboli A, Karpe S, Shaikh S, Manikrao A. Hypoglycemic activity of extracts of Oroxylum indicum (L.) Vent roots in animal models. Pharmacologyonline. 2011;2:890–899. [Google Scholar]
- 26.Shah S, Chaple D, Arora S, Yende S, Moharir K, Lohiya G. Exploring the active constituents of Oroxylum indicum in intervention of novel coronavirus (COVID-19) based on molecular docking method. Netw Model Anal Health Inf Bioinform. 2021;10:8. doi: 10.1007/s13721-020-00279-y. [DOI] [PMC free article] [PubMed] [Google Scholar]
- 27.Dinda B, Dinda S, DasSharma S, Banik R, Chakraborty A, Dinda M. Therapeutic potentials of baicalin and its aglycone, baicalein against inflammatory disorders. Eur J Med Chem. 2017;131:68–80. doi: 10.1016/j.ejmech.2017.03.004. [DOI] [PubMed] [Google Scholar]
- 28.Yang JY, Li M, Zhang CL, Liu D. Pharmacological properties of baicalin on liver diseases: a narrative review. Pharmacol Rep. 2021;73(5):1230–1239. doi: 10.1007/s43440-021-00227-1. [DOI] [PMC free article] [PubMed] [Google Scholar]
- 29.Bitto A, Squadrito F, Irrera N, Pizzino G, Pallio G, Mecchio A, Galfo F, Altavilla D. Flavocoxid, a nutraceutical approach to blunt inflammatory conditions. Mediators Inflamm. 2014;2014:790851. doi: 10.1155/2014/790851. [DOI] [PMC free article] [PubMed] [Google Scholar]
- 30.Casoni D, Sima IA, Sarbu C. Thin-layer chromatography—an image processing method for the determination of acidic catecholamine metabolites. J Sep Sci. 2014;37:2675–2681. doi: 10.1002/jssc.201400550. [DOI] [PubMed] [Google Scholar]
- 31.Ketmongkhonsit P, Chaichantipyuth C, Palanuvej C, Thitikornpong W, Sukrong S. A validated TLC–image analysis method for detecting and quantifying bioactive phyllanthin in Phyllanthus amarus and commercial herbal drugs. Songklanakarin J Sci Technol. 2015;37:319–326. [Google Scholar]
- 32.Ohkoshi E, Nagashima T, Sato H, Fujii Y, Nozawa K, Nagai M. Simple preparation of baicalin from Scutellariae Radix. J Chromatogr A. 2008;1216(11):2192–2194. doi: 10.1016/j.chroma.2008.03.059. [DOI] [PubMed] [Google Scholar]
- 33.Gafner S, Bergeron C, Batcha L, Angerhofer C, Sudberg S, Sudberg E, Guinaudeau H, Gauthier R. Analysis of Scutellaria lateriflora and Its Adulterants Teucrium canadense and Teucrium chamaedrys by LC–UV/MS, TLC, and Digital Photomicroscopy. J AOAC Int. 2003;86:453–460. doi: 10.1093/jaoac/86.3.453. [DOI] [PubMed] [Google Scholar]
- 34.Olugbami JO, Gbadegesin MA, Odunola OA. In vitro free radical scavenging and antioxidant properties of ethanol extract of Terminalia glaucescens. Pharmacogn Res. 2015;7(1):49–56. doi: 10.4103/0974-8490.147200. [DOI] [PMC free article] [PubMed] [Google Scholar]


