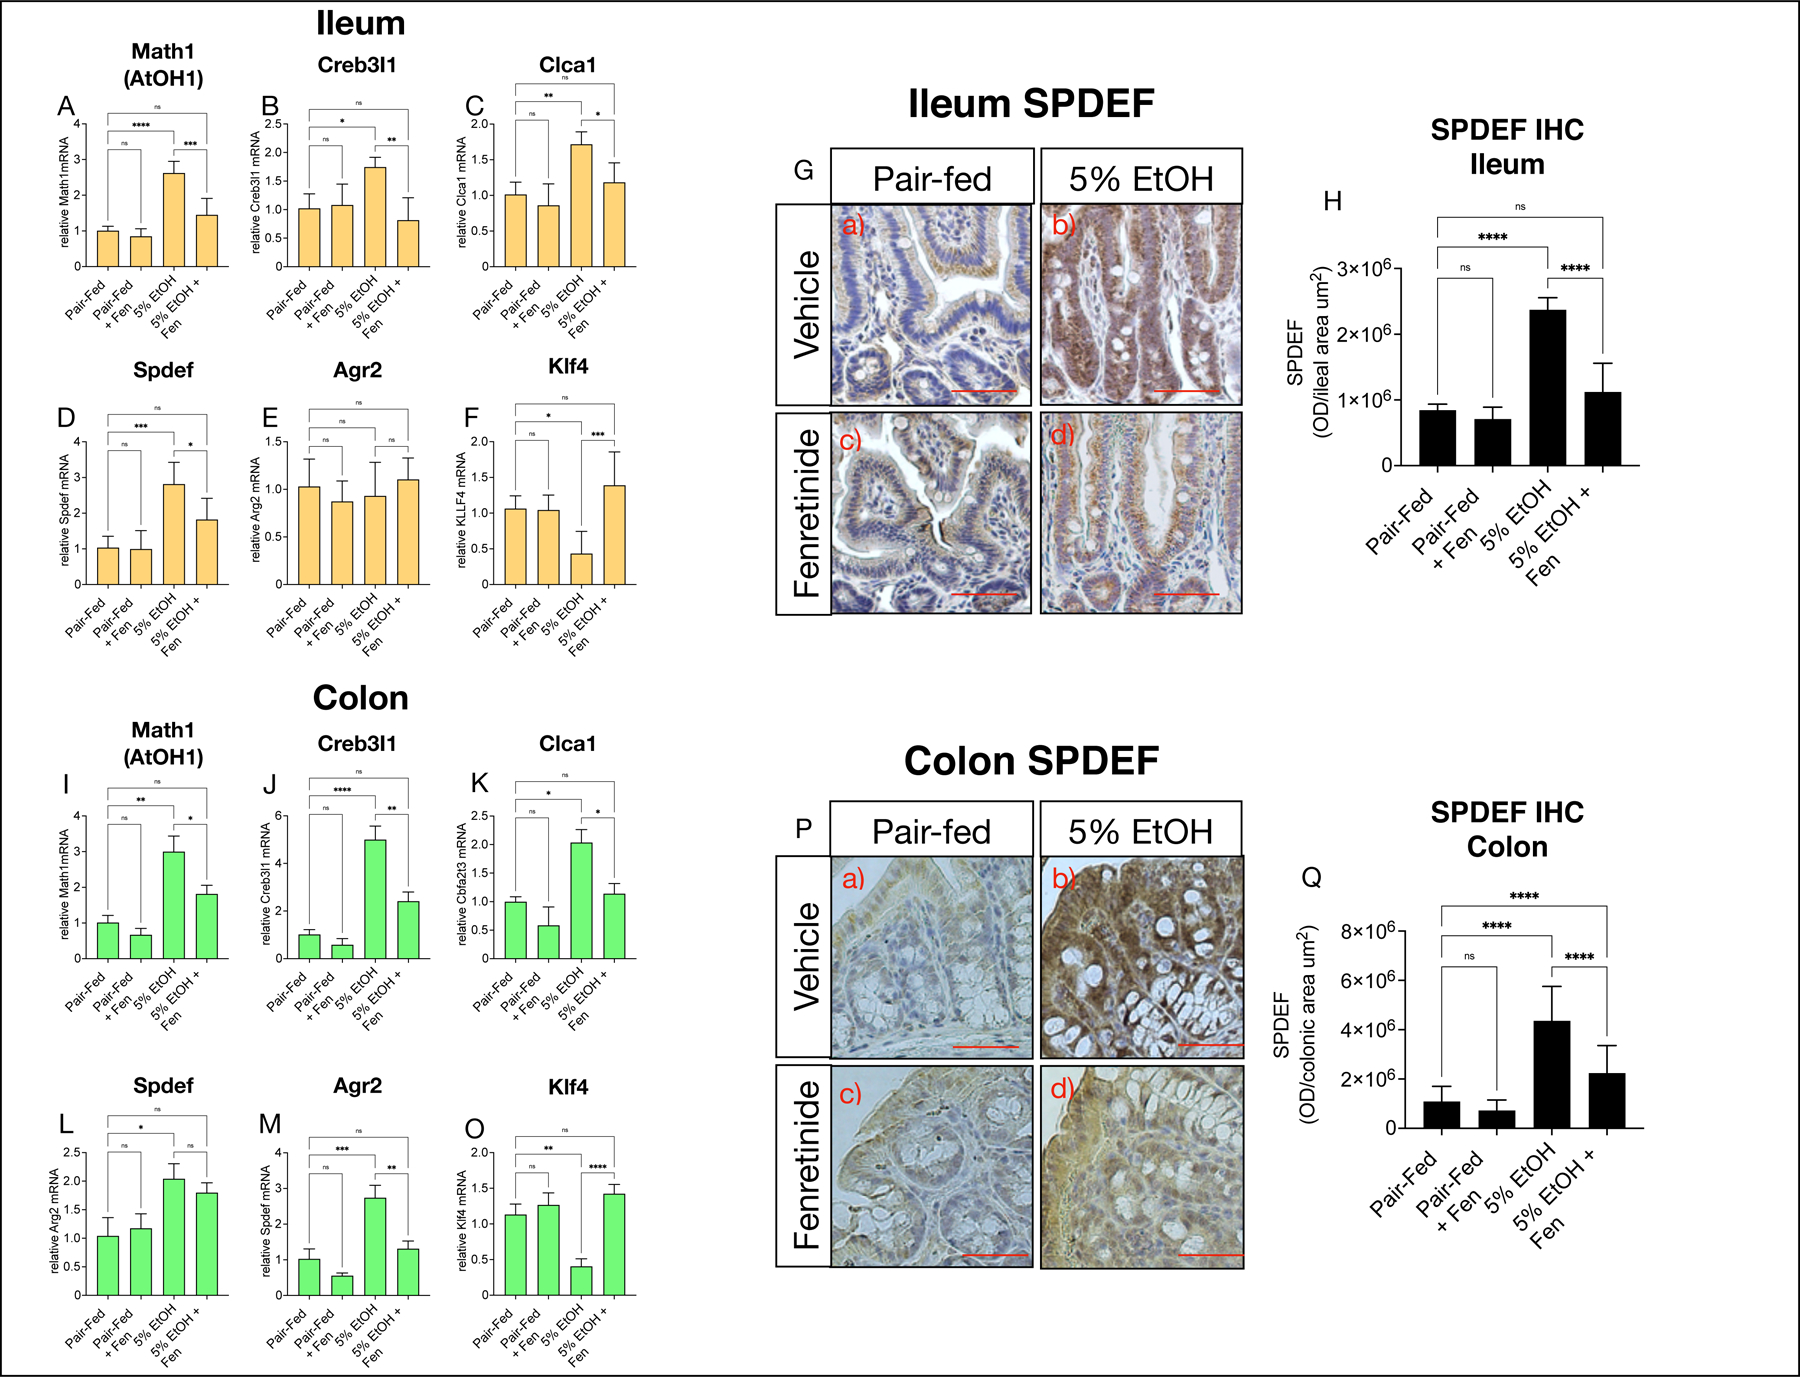
Fig. 4. Fenretinide opposes alcohol-mediated increases in gut goblet specification genes.

Quantitative PCR (qPCR) histograms of A-F) ileal, and I-O) colonic relative mRNA levels of the goblet specification genes Creb3l1, Clca1, Spdef, Agr2, Klf4. G) and P) Representative images, and H) and Q) quantification of ileal, and colonic SPDEF (SAM Pointed Domain Containing ETS Transcription Factor). Magnification: ×200; scale bar = 100 μm. All histogram errors bars represent ±SD, with *p< 0.05, **p < 0.01, ***p < 0.001, ****p < 0.0001, ns = not significant. qPCR results represent gene fold changes relative to pair-fed mice normalized against the housekeeping gene 36B4.
