

Abstract
Background:
Hispanics are expected to experience the largest increase in Alzheimer’s disease (AD) and AD related dementias (ADRDs) over the next several decades. However, few studies have examined biomarkers of AD among Mexican Americans, the largest segment of the U.S. Hispanic population.
Objective:
We sought to examine proteomic profiles of an MRI-based marker of neurodegeneration from the AT(N) framework among a multi-ethnic, community-dwelling cohort.
Methods:
Community-dwelling Mexican Americans and non-Hispanic white adults and elders were recruited. All participants underwent comprehensive assessments including an interview, functional exam, clinical labs, informant interview, neuropsychological testing and 3T MRI of the brain. A neurodegeneration MRI meta-ROI biomarker for the AT(N) framework was calculated.
Results:
Data was examined from n=1,291 participants. Proteomic profiles were highly accurate for detecting neurodegeneration (i.e., N+) among both Mexican Americans (AUC=1.0) and non-Hispanic whites (AUC=0.98). The proteomic profile of N+ was different between ethnic groups. Further analyses revealed that the proteomic profiles of N+ varied by diagnostic status (control, MCI, dementia) and ethnicity (Mexican American vs. non-Hispanic whites) though diagnostic accuracy was high for all classifications.
Conclusion:
A proteomic profile of neurodegeneration has tremendous value and point towards novel diagnostic and intervention opportunities. The current findings demonstrate that the underlying biological factors associated with neurodegeneration are different between Mexican Americans versus non-Hispanic whites as well as at different levels of disease progression.
Keywords: Neurodegeneration, Alzheimer’s disease, mild cognitive impairment, Mexican American, Hispanic, diversity, biomarkers, neurodegeneration
INTRODUCTION
The 2018 AT(N) research framework[1] provided the field with the first ever biological-based system for studying Alzheimer’s disease (AD) and this framework is the underlying foundation for many clinical trials and therapeutic pipelines (academic and industry). One major opportunity of the AT(N) framework is the generation of multi-modal therapeutic options based on the biological marker positivity within specific patients or subgroups of patients; however, this has yet to be tested. In fact, the majority of trials (prevention or intervention) have targeted amyloid (A) and tau (T), rather than N, which, as pointed out by the AT(N) framework itself, is a non-specific marker that can be associated with a range of comorbidities and/or pathologies. Though a non-specific biomarker, MRI-indicators of N have repeatedly been associated with cognitive impairment, diagnosis of mild cognitive impairment (MCI), dementia and AD[2,3]. Additionally, various MRI indicators of N predict cognitive function and decline[4,5][6].
Despite the obvious link between MRI indicators of N and cognitive impairment and cognitive decline, therapeutic pipelines specifically targeting N as a means for treating or preventing cognitive impairment and/or dementia have been overshadowed by amyloid and tau targets. In fact, a current search of ClinicalTrials.gov of trials targeting neuroprotection yielded n=188 results; however, only two were AD trials[7]. The non-specific nature of N may, by some, be viewed as a less attractive target owing to a poor understanding of the underlying pathways to neurodegeneration itself. That is, can a global therapeutic provide “neuroprotection” within the context of cognitive aging for all individuals who may be suffering from a wide range of pathologies including, but not limited to, amyloid, tau, vascular, inflammation, metabolic dysfunction in addition to the environmental, sociocultural and/or behavioral mediators?
It is likely that N is a viable therapeutic target given the growing number of recent studies that have linked general markers of neuronal injury such as neurofilament light chain (NfL) with AD[8,9]; however, a precision medicine approach is potentially the only way to generate a successful pipeline. N positivity (N+) is only indicative that neurodegeneration has occurred, not why. This is a different scenario than targeting amyloid (A) or tau (T). On the other hand, a precision medicine approach has yielded substantial advancements in oncology due to improvements in identification, stratification, and application of treatments based on utilizing a system biology approach [10–12] and, therefore, consideration of such an approach to N (which is part of the fundamental AD framework) is a ripe opportunity. In fact, a precision medicine approach is explicitly pointed out as a key priority area in Milestone 1 of the NIA AD+ADRD Implementation Milestones[13].
Here we sought to conduct a study with two primary goals. First, we sought to determine if a blood-based profile could predict N+. The context of use (COU) of this blood test would be as follows: a blood screening test to rule out neurodegeneration among patients being considered for a clinical trial targeting neuroprotection. This specific COU would have the advantage of being cost-effective, scalable, rapid and could serve as the first-step in the trial screening process with those who screen positive undergoing structural MRI for confirmation of N+. Second, we sought to determine if the proteomic profile of N+ varied by ethnicity as well as by disease severity. In our prior work, we have shown that biological factors associated with MCI and AD vary between Mexican Americans and non-Hispanic whites. For example, when compared to non-Hispanic whites, amyloid positivity rates are lower[14], plasma NfL is lower and differentially associated with medical, imaging and cognitive outcomes[15], blood-based profiles of MCI and dementia are significantly different[16], inflammation is higher [17], and APOE4 genotype prevalence rates are lower [18][19]. In addition, we have found that medical comorbidities are disproportionately suffered by Mexican Americans[19,20], which we have found to be associated with N+[21]. Therefore, the diversity of medical comorbidities and biological pathways including mechanisms of inflammation may be ideal points to begin studying a precision medicine approach by identifying subgroups for targeted interventions as we have previously proposed[22]. Given the recently literature supporting plasma NfL as a putative biomarker of neurodegeneration, we conducted comparison analyses with this marker alone to determine if it, by itself, could serve the COU rather than a broader profile approach.
MATERIALS and METHODS
Participants & Assessment
The Health & Aging Brain Study – Health Disparities (HABS-HD; formally the Health & Aging Brain study among Latino Elders, HABLE study) is an ongoing, longitudinal, community-based project examining health disparities in MCI and AD among Hispanic, Mexican Americans and non-Hispanic whites [14] with recent expansion now enrolling African Americans. HABS-HD methods have been published elsewhere[14]. The HABS-HD protocol includes an interview, functional exam, blood draw for clinical labs and biobanking, neuropsychological testing and 3T MRI of the brain. PET amyloid and tau scans are ongoing as part of Visit 2 assessments. All aspects of the study protocol can be conducted in Spanish or English and the HABS-HD study is conducted under IRB approved protocols and each participant (or his/her legal representative) signs written informed consent. The neuropsychological test battery includes the following: Mini Mental Status Exam (MMSE)[23], Wechsler Memory Scale- Third Edition (WMS-III) Digit Span and Logical Memory[24], Digit Symbol Substitution, Trail Making Test Parts A and B[25], Spanish-English Verbal Learning Test (SEVLT)[26], Animal Naming (semantic fluency)[27], FAS (phonemic fluency)[27] as well as the American National Adult Reading Test (English-speakers)[28] and Word Accentuation Test (Spanish-speakers)[29]. An informant interview is also conducted for completion of the Clinical Dementia Rating Scale[30] by clinicians with expertise in dementia. The HABS-HD data is readily available to the scientific community through the Institute for Translational Research website[31].
Diagnostic Classification
Cognitive diagnoses are assigned algorithmically and verified at consensus review as follows: Normal Control (NC) = no cognitive complaints, CDR sum of boxes score of 0 and cognitive tests scores broadly within normal limits; Mild Cognitive Impairment (MCI): cognitive complaint (self or other), CDR sum of boxes score between 0.5- 2.0[32] and at least one cognitive test score falling 1.5 standard deviation below normative ranges; Dementia: CDR sum of boxes score >=2.5[32] (reflecting functional impairment) and at least two cognitive test scores 2 standard deviation below normative ranges.
Neuroimaging
MRI Data.
The HABS-HD MRI protocol is based on that of ADNI3 using a 3T Siemens Magnetom SKYRA whole-body scanner. We acquired the following scan sequences: T1-weighted whole brain volumetric spoiled Magnetization-Prepared Rapid Gradient (MPRAGE), whole brain volumetric fluid attenuated inversion recovery (FLAIR), susceptibility-weighted imaging (SWI), diffusion tensor MRI (dMRI), 3D arterial spin labeling (3DPASL), resting-state functional (rsfMRI), and high resolution (0.4 x 0.4 mm x 2 mm) T2-weighted hippocampal high resolution (HHR) scans. For this study, the “meta-ROI” for examination of the neurodegeneration (i.e. N) component of the AT(N) framework[1]. was examined as outlined by Jack et al [5]. The “meta-ROI” comprises the surface-area weighted average of the mean cortical thickness in individual ROIs of the entorhinal cortex, fusiform, inferior temporal gyri, and middle temporal gyri. N+ was determined based on a cut-off of 2.68 mm for cortical thickness[5]. Participants who failed quality checks (quality assurance [QA]) for the FreeSurfer software version 5.3.0 segmentation for at least one of the individual ROI sections (referenced above) were excluded when calculating meta-ROI. Meta-ROI was calculated based on the sum of each region in each hemisphere * the surface area for that region divided by the sum of surface areas for all regions included.
Blood Collection & Processing Procedures
Fasting blood collection and processing were completed based on the international guidelines for AD biomarker studies and processed within 2 hours (stick-to-freezer) [33]. All proteomic assays are analyzed at the University of North Texas IRB Biomarker Core and undergo QA/QC procedures[14]. Plasma NfL, Aβ40, Aβ42, and total tau (t-tau) were assayed using the ultra-sensitive Simoa (single molecule array) technology (Quanterix.com). Samples were loaded onto a 96 well plate and analyzed on the Simoa HD-1 platform along with inter-assay controls. The ITR Biomarker Core has conducted >5,000 assays using this Simoa platform and all coefficients of variability (CVs) were <4%. Serum ECL markers were assayed per our previously published protocols[34–37]. Assay preparation was completed with the Hamilton Robotics StarPlus system. The ITR Biomarker Core has conducted >20,000 assays using this ECL platform and all coefficients of variability (CVs) were <=10%. ECL and Simoa assays were selected based on prior work utilizing them to detect AD[15,38–40] as well as other neurodegenerative disorders including Lewy Body Dementia[41], Parkinson’s Disease Dementia[42], and in AD among adults with Down Syndrome[37,43]. Clinical labs were conducted by a local Quest laboratory per HABS-HD protocols.
Statistical Analyses
Statistical Analyses were conducted in SPSS 25 (IBM) and R [44]. Support vector machine (SVM) analyses were used to create the proteomic profile of N+. SVM is based on the concept of decision planes that define decision boundaries and is primarily a classifier method that performs classification tasks by constructing hyperplanes in a multidimensional space that separates cases of different class labels. Here we used 10 times repeated 5-fold cross-validation. Ten times repeated 5-fold cross-validation is used to directly perform SVM parameter tuning and optimal cutoff determination using Grid Search which is traditional way of performing hyperparameter optimization [45]. In 5-fold cross-validation, the data is divided into 5 folds. The model is trained on 4 folds with one-fold held back for testing. This process gets repeated to ensure each fold of the dataset gets the chance to be the held back set. 10 times repeated 5-fold cross-validation repeats the process of 5-fold cross-validation 10 times. Once the process is completed, the evaluation metrics are summarized using the mean. The advantage of 10 times repeated 5-fold cross-validation is that it can provide a more reliable estimate of out-of-sample performance by reducing the variance associated with a single trial of cross-validation. The 10-times repeated five-fold cross-validation based parameter optimization method was additionally used to measure and compare prediction performance between blood proteomic profiles and plasma NfL. Diagnostic accuracy was calculated via receiver operating characteristic (ROC) curves. Covariates included age, gender, and education. Sensitivity (SN), specificity (SP), negative predictive value (NPV) and positive predictive value (PPV) statistics were calculated and reported on. The following metrics were used for comparison: ROC, SN, SP, NPV, and PPV. First the process of 10 times repeated 5-fold cross-validation was used to determine the optimal parameter set. And then the performance was reported for the final model, which was fitted to all the training data using the optimal parameter set. Analyses were conducted as follows: (1) detecting N+ versus N− in the entire cohort, (2) detecting N+ versus N− split by ethnicity, and (3) detecting N+ versus N− split by ethnicity and diagnostic status.
RESULTS
A total of n=1,291 participants had all requisite data for inclusion in the current analyses (Mexican American n=607, non-Hispanic white n=684). The Mexican American group was significantly younger (p<0.001) and obtained fewer years of education (p<0.001) than non-Hispanic whites. Mexican Americans were more likely to have a diagnosis of hypertension (p<0.05) and diabetes (p<0.001) than non-Hispanic whites. Demographic characteristics of the cohort, by ethnic group, is presented in Table 1.
Table 1.
presents the demographic characteristics of the entire cohort. Differences between the groups are presented along with effect sizes.
| Total Cohort Mean (SD) | Mexican American N=684 Mean (SD) | Non-Hispanic White N=607 Mean (SD) | t-value | p-value | Effect Size | |
|---|---|---|---|---|---|---|
| Age | 66.02 (8.65) | 63.57 (7.91) | 68.76 (8.63) | −11.29 | <0.001 | −0.633 |
| Education | 12.37 (4.73) | 9.63 (4.58) | 15.44 (2.47) | −28.76 | <0.001 | −1.55 |
| Gender (% female) | 64% | 70% | 58% | 17.83 | <0.001 | N/A |
| Hypertension (% yes) | 58% | 61% | 55% | 3.123 | 0.077 | N/A |
| Diabetes (% yes) | 25% | 36% | 12% | 1.916 | 0.166 | N/A |
| Dyslipidemia (% yes) | 62% | 64% | 60% | 103.00 | <0.001 | N/A |
| MRI N | 2.72 (0.15) | 2.73 (0.14) | 2.71 (0.15) | 0.96 | 0.324 | N/A |
| Cognitive Diagnosis | 12.19 | 0.002 | N/A | |||
| Normal Controls | 81% (n=1050) | 78% (n=532) | 85% (n=518) | |||
| Normal Control and N+ (%) | 57% | 55% | 58%% | |||
| MCI | 13% (n=168) | 16% (n=107) | 10% (n=61) | |||
| MCI and N+ | 19% | 16% | 22% | |||
| Dementia | 6% (n=73) | 7% (n=45) | 5% (n=28) | |||
| Dementia and N+ | 24% | 29% | 20% |
Blood Profile of N+ Within Entire Cohort and Split By Ethnicity.
The SVM blood-based profile of neurodegeneration in the entire cohort was highly accurate, AUC=0.99, SN=0.97, SP=0.97, NPV=99%, PPV=96% (Figure 1). For comparison purposes, plasma NfL alone yielded an AUC=0.67. When split by ethnicity, the blood-based profile was highly accurate in detecting N+ among non-Hispanic whites (AUC=0.98, SN=0.90, SP=0.96, PPV=93%, and NPV=95%) (Figure 2a) as well as Mexican Americans (AUC=1.0, SN=1.0, SP=1.0, PPV=100%, NPV=100%)(Figure 2b). While all profiles were highly accurate, the relative importance of the markers in the proteomic profiles varied substantially between ethnic groups. The top markers for non-Hispanic whites included cholesterol, A2M, FVII, and TNC, while for Mexican Americans included NfL, A2M, Aβ40, and B2M. For comparison purposes, plasma NfL yielded an AUC=0.64 among non-Hispanic whites and an AUC=0.68 among Mexican Americans.
Figure 1.
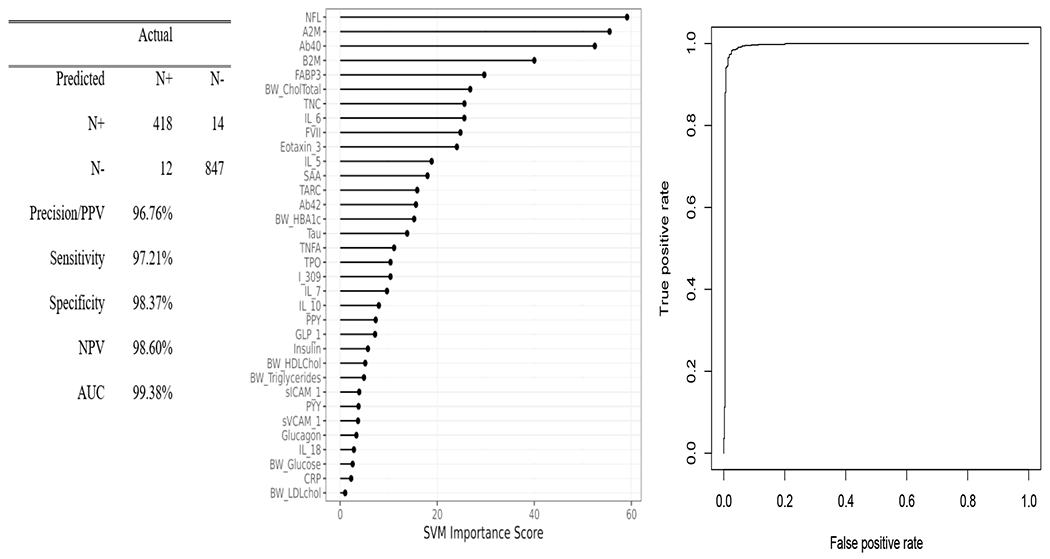
Proteomic profiles were derived from SVM analyses in the total sample. The SVM variable importance plot and AUC were included in Figure 1 along with the confusion matrix and class statistics of sensitivity, specificity and negative predictive value for the blood-based profile of neurodegeneration for the entire cohort.
Figure 2.
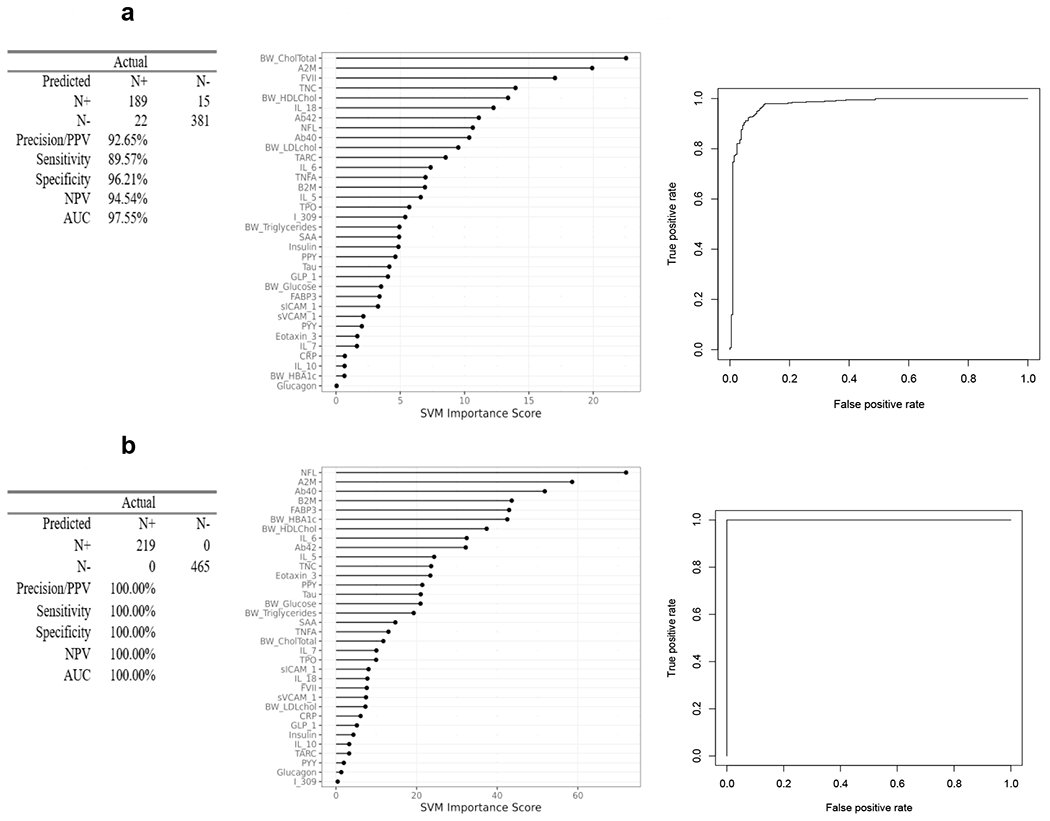
Proteomic profiles were derived from SVM analyses split by ethnic groups. The SVM variable importance plot and AUC were included for blood-based profiles of neurodegeneration in Figure 2a for Non-Hispanic Whites and Figure 2b for Mexican Americans along with the confusion matrix and class statistics of sensitivity, specificity and negative predictive value.
Blood Profile of N+ Within Entire Cohort and Split By Diagnosis.
Next, we examined the blood-based profile for detecting neurodegeneration split by cognitive diagnosis in the cohort (Figure 3). Figure 3a, revealed that for cognitive normal individuals, the blood-based profile was highly accurate in detecting N+ (AUC=1.00, SN=0.99, SP=1.00, PPV=100%, NPV =99%). A similar level of detection was found for those with a diagnosis of Dementia (AUC=1.00, SN=1.00, SP=1.00, PPV=100%, NPV=100%) (Figure 3b); however, among those with mild cognitive impairment, the detection accuracy was good but not at the same level of accuracy (AUC=0.92, SN=0.88, SP=0.82, PPV=78%, NPV=91%) (Figure 3c). The top markers across the diagnostic categories were shown to be distinct (normal controls: Aβ40, A2M, B2M, NfL; MCI: NfL, HDL cholesterol, Aβ40, B2M; dementia: TARC, glucose, Aβ42, TNC). For comparison purposes, plasma NfL yielded an AUC=0.58 for cognitively normal, an AUC=0.74 for mild cognitive impairment, and an AUC=0.72 for dementia participants.
Figure 3.
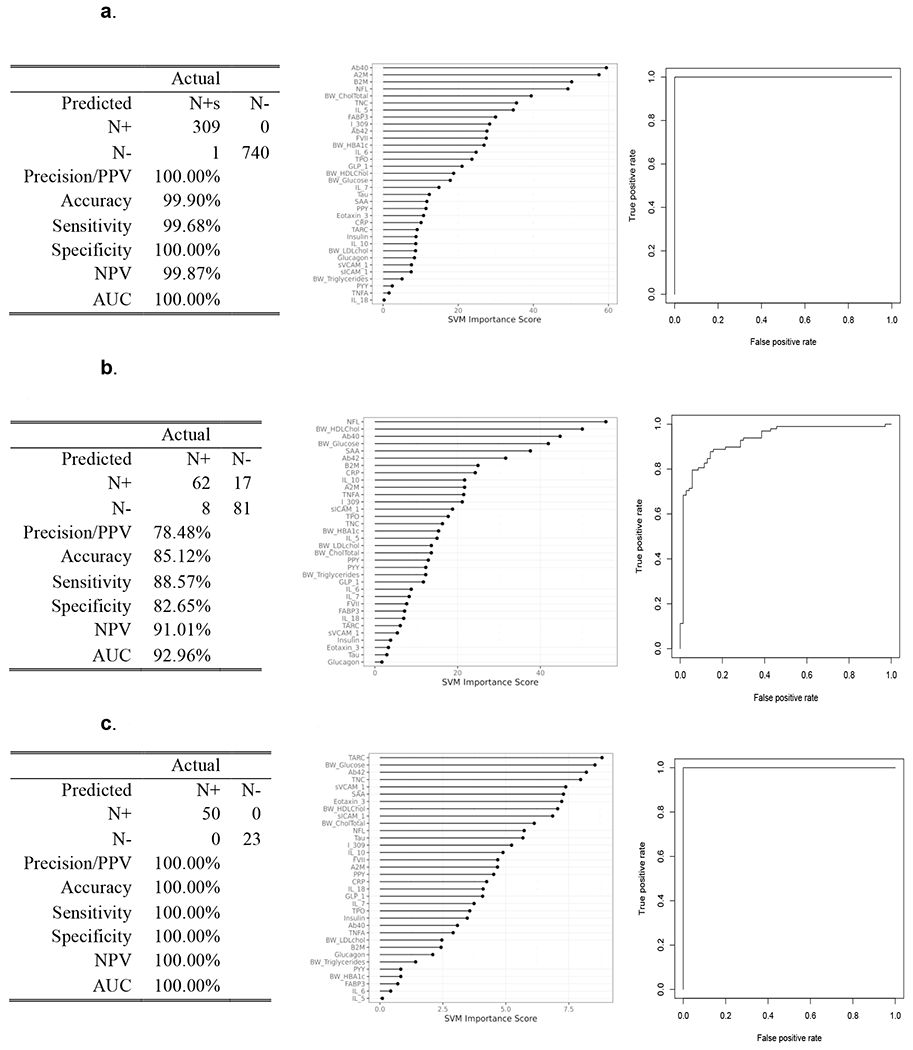
Proteomic profiles derived from SVM analyses are presented for neurodegeneration separated by cognitive diagnosis of normal cognition (Figure 3a), mild cognitive impairment (Figure 3b), and dementia (Figure 3c). The SVM variable importance plot and AUC were included for the blood-based profiles of neurodegeneration for each diagnostic group along with the confusion matrix and class statistics of sensitivity, specificity and negative predictive value.
Blood Profile of N+ Split By Ethnicity and Diagnosis.
We then examined the blood-based profile for detecting N+ split by ethnic group as well as diagnostic status with output of the models reported in Table 2 and Figure 4. Non-Hispanic Whites: Controls (Figure 4a) – AUC=0.99, SN=0.97, SP=0.97, plasma NfL AUC=0.62; MCI (Figure 4b) – AUC=1.0, SN=1.0, SP=1.0, plasma NfL AUC=0.62; dementia (Figure 4c) – AUC=1.0, SN=1.0, SP=1.0, plasma NfL AUC=0.67. Mexican Americans: Controls (Figure 4d) – AUC=1.0, SN=1.0, SP=1.0, plasma NfL AUC=0.65; MCI (Figure 4e)– AUC=1.0, SN=1.0, SP=1.0, plasma NfL AUC=0.74; dementia (Figure 4f) – AUC=1.0, SN=1.0, SP=1.0, plasma NfL AUC=0.57. Again, the relative importance of the blood biomarkers varied substantially by both ethnic status and disease severity. For example, the proteomic profiles for non-Hispanic whites with normal cognition, the top markers in the proteomic profile included cholesterol, Aβ40, TNC, and FVII while for Mexican Americans included A2M, NfL, Aβ40 and B2M. In contrast, among non-Hispanic whites with an MCI diagnosis, the top markers included triglycerides, HDL cholesterol, glucose and HbA1c while for Mexican Americans it included NfL, glucose, HbA1c, and I309. For those with Dementia, the top markers for non-Hispanics whites included HDL cholesterol, Aβ42, A2M, and FABP3 while for Mexican Americans included TNFα, eotaxin3, NfL, and IL10.
Table 2.
presents the performance output for the proteomic profiles of neurodegeneration separated by ethnic group and cognitive diagnosis. Class statistics of Areas Under the Curve (AUC), sensitivity (SN), specificity (SP), negative predictive value (NPV) and positive predictive value (PPV) are provided across the specified groups.
| AUC | SN | SP | NPV | PPV | |
|---|---|---|---|---|---|
| Non-Hispanic Whites | |||||
| Normal Cognition | 0.99 | 0.95 | 0.97 | 0.98 | 0.94 |
| MCI | 1.00 | 1.00 | 1.00 | 1.00 | 1.00 |
| Dementia | 1.00 | 1.00 | 1.00 | 1.00 | 1.00 |
| Mexican Americans | |||||
| Normal Cognition | 1.00 | 1.00 | 1.00 | 1.00 | 1.00 |
| MCI | 1.00 | 1.00 | 1.00 | 1.00 | 1.00 |
| Dementia | 1.00 | 1.00 | 1.00 | 1.00 | 1.00 |
Note: MCI, Mild Cognitive Impairment; AUC, Area Under the Curve; SN, Sensitivity; SP, Specificity; NPV, Negative Predictive Power; PPV, Positive Predictive Power
Figure 4.
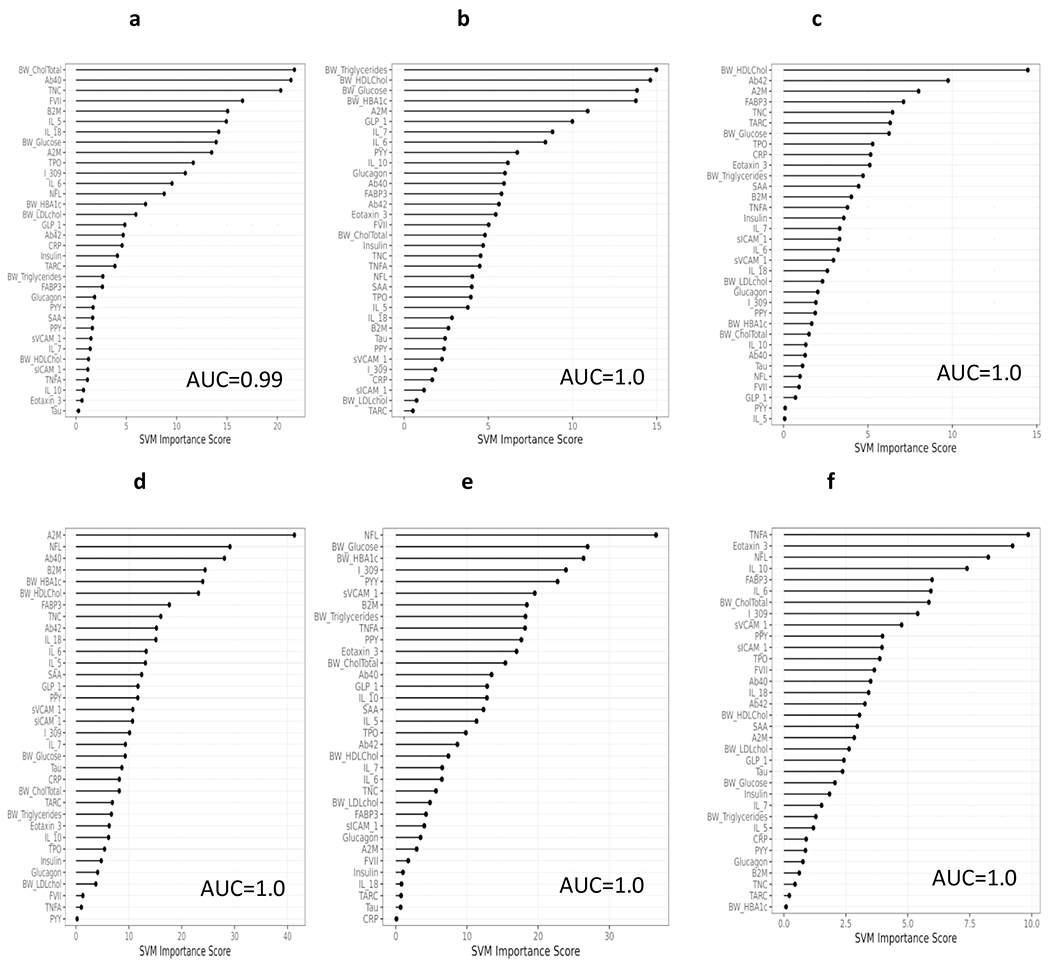
Proteomic profiles derived from SVM analyses split by both ethnicity group and diagnostic status. The SVM variable importance plot and AUC were reported for each ethnic group and cognitive diagnosis (non-Hispanic white [NHW], normal control Figure 4a; NHW, Mild Cognitive Impairment [MCI] Figure 4b; NHW, Dementia Figure 4c; Mexican American [MA], normal control Figure 4d; MA, MCI Figure 4e; MA, Dementia Figure 4d).
DISCUSSION
Here we provide direct support for the concept of a blood-based profile for detecting underlying neurodegeneration (as measured by MRI). The overall profile was highly significant across ethnic groups and diagnostic classifications. However, it is important to note that these profiles not only changed by ethnicity but also by disease severity. Given that N is a non-specific marker of brain damage, it is also highly likely that the underlying factors leading to neurodegeneration are just as non-specific and multi-factorial. The biological pathways underlying the proteomic profiles of N highlight the level of complexity with most showing a combination of general neuronal injury, inflammatory and vascular processes as well as for most, metabolic factors. Amyloid peptides (Aβ40 and Aβ42) also drove a number of profiles with these proteins often falling within the top three markers on the variable importance plots. The impact of proteins involved in these biological pathways appear to differ across ethnic and diagnostic groups; however, interestingly, distinct indicators of a biological pathway were shown to differently drive the profiles across ethnic groups. An example of this was for the diagnostic group of MCI, as metabolic factors were shown to drive the proteomic profiles across ethnic groups; however, for Mexican Americans, glucose, HbA1c, and PPY were the driving variables as compared to triglycerides, HDL cholesterol, and glucose for Non-Hispanic Whites. Among individuals with a diagnosis of Dementia, the metabolic factors became less pronounced with only HDL cholesterol remaining as a top protein among Non-Hispanic Whites. The proteomic profiles across ethnic groups for this diagnostic category instead reflect a strongly inflammatory profile, suggesting the implications of inflammation in the disease process and potential for therapeutic intervention. Therefore, leveraging the heterogeneity of neurodegeneration may very well provide an optimal setting for targeted, precision medicine-based interventions, which we have previously proposed [22,46] targeting the pathways shown to drive the specific N profiles.
Our data suggests that (1) blood-based profiles are highly accurate in detecting underlying neurodegeneration and (2) targeted, disease-severity driven, precision medicine approaches may improve therapeutic outcomes. In fact, we have shown that a specific subset of AD patients benefitted from the previously conducted NSAID trial[22] and we have now shown that this same approach predicts treatment response in the ADAPT prevention trial (manuscript under review). Moreover, more recent work from our group demonstrates that another sub-group approach based on an inflammatory/metabolic profile was highly accurate in predicting treatment to rosiglitazone among AD patients[46]. Based on these findings, it is likely that the responders to these trials were suffering neurodegeneration-related cognitive loss due to inflammatory and/or metabolic pathways that may or may not have been associated with amyloid.
Given the recent literature strongly supporting plasma NfL as a putative biomarker of neurodegeneration, a viable question is if this single marker can serve the purpose of the COU proposed here. In this study, NfL was utilized in combination with a larger proteomic panel and interesting, performed well in predicting N among Mexican Americans and was continually shown to be among the top markers spanning multiple profiles for this ethnic group including when separated by cognitive diagnosis. We recently completed a large-scale examination of the clinical parameters of plasma NfL in the HABS-HD study[15]. Consistent with prior work, plasma NfL was significantly associated with neuropsychological test scores and global amyloid SUVR. NfL levels varied by diagnostic group[15], also consistent with prior work. However, NfL was significantly impacted by demographic factors and medical comorbidities, which likely contributed to the lack of utility of plasma NfL as a diagnostic biomarker for MCI or dementia[15]. Therefore, here we also directly compared plasma NfL to our profile approach. There would be multiple advantageous of a single marker; however, plasma NfL did not achieve acceptable AUCs. This is likely due to the substantial impact of medical comorbidities and demographic factors on plasma NfL levels that causes additional “spread” in values on top of the impact of neurodegeneration causing cognitive loss. Future work is planned to further examine what impact such factors (medical, demographics) have on progression and development of AT(N) pathology as this will be important to better understand AD from a systems biology approach.
According to 2019 Census Bureau data[47], Hispanics make up the largest minority population in the U.S. In fact, approximately 50% of the U.S. population growth from 2010-2019 was due to an increase in the Hispanic population[48]. The percentage of Hispanics aged 65 and older will triple by the year 2050[49] and this ethnic group will experience the largest increase in AD and AD related dementia (ADRD) diagnoses among any racial/ethnic group by 2060[50]. Approximately 65% of Hispanics in the U.S. are of Mexican American ethnicity[51]; however, few studies have explicitly examined MCI and AD among Mexican Americans. Therefore, it is important to consider the factors contributing to A, T and N across diverse groups to have a comprehensive picture and to build more powerful intervention opportunities and strategies. The need to examine A, T, and N among diverse populations was even highlighted in the published text of the framework[1] and is an aim of the HABS-HD study. Another aim of the study is to also expand to examine additional factors underlying aging and cognitive decline such as vascular and inflammatory factors, which are not currently included in the existing A, T, and N Framework.
Overall, the current findings provide strong evidence for the potential utility of a blood-based screening tool for neurodegeneration and one can then directly propose an application of a targeted, multi-modal neuroprotective prevention trial to the current findings (Table 3). From a prevention trial pipeline standpoint with a view on A, T and N, most community-dwelling older adults ages 50-70 will be amyloid and tau negative. In our prior work, N+ rates were 30% among cognitively older adults ages 50 and above; however, that prevalence rate declines to 16% if restricted to 50-70. When looking at Figures 3a and 3d, the blood profile of neurodegeneration is multi-factorial, as expected, with markers relevant to diabetes, heart disease and inflammation all playing prominent roles. Therefore, a preventative neuroprotection strategy may be able to use currently available medications based on the specific individual’s clinical labs. In Table 3, multiple hypothetical examples are provided. Person 1 is a 70-year-old non-Hispanic white patient who is amyloid positive that has elevated clinical labs related to cardiovascular disease. In our work (manuscript under review), cardiovascular disease markers were strong predictors of neurodegeneration specifically among non-Hispanic whites. Therefore, in Person 1, an anti-amyloid agent would be the primary (initial) intervention with the second (and/or 3rd) multi-modal level interventions targeting the clinical lab defined abnormalities. Person 2, however, is 50-year-old Mexican American who only has diabetes. In our work (manuscript under review), duration of diabetes was a powerful driver of N among Mexican Americans. Therefore, in Person 2, the person-centered neuroprotection prevention strategy would be to target and control the diabetes. Numerous other multi-modal opportunities are readily apparent for targeting neuroprotection as a prevention strategy in Table 3. This reflects the broader generalizability and how proteomic profiles such as those presented in this study can be utilized to inform a person-centered approach for identifying therapeutic pipelines. Additional work is ongoing in the HABS-HD study to further advance this line of work with the long-term goal of a multi-modal, population informed precision medicine strategy for preventing neurodegeneration and associated cognitive loss across populations.
Table 3.
outlines how person-centered risk factors (amyloid positivity, tau positivity, etc.) can be utilized to help guide treatment and prevention strategies among cognitive normal older adults.
| Therapeutic Target | Potential Therapeutic Approach | Person 1 | Person 2 |
|---|---|---|---|
| Amyloid Positive | Amyloid lowering agent | X1 | |
| Tau Positive | Tau lowering agent | ||
| HDL/LDL/Triglycerides | Cholesterol medications | X2 | |
| Glucose, HbA1c | Diabetes Medications | X1 | |
| Inflammation | Anti-inflammatory Medications |
NOTE: X1=primary/initial therapeutic; X2=secondary multi-modal therapeutic
Acknowledgments:
Research reported here was supported by the National Institute on Aging of the National Institutes of Health under Award Numbers R01AG054073 and R01AG058533. This work was also supported in part by NIH/NIBIB award P41-EB015992. The content is solely the responsibility of the authors and does not necessarily represent the official views of the National Institutes of Health. The research team also thanks the local Fort Worth community and participants of the HABS-HD study.
Footnotes
Conflicts of Interest: SEO has multiple patents on precision medicine for neurodegenerative diseases and is the scientific found of Cx Precision Medicine, LLC. LAJ has a financial interest in Cx Precision Medicine, LLC.
References
- [1].Jack CR Jr., Bennett DA, Blennow K, Carrillo MC, Dunn B, Haeberlein SB, Holtzman DM, Jagust W, Jessen F, Karlawish J, Liu E, Molinuevo JL, Montine T, Phelps C, Rankin KP, Rowe CC, Scheltens P, Siemers E, Snyder HM, Sperling R (2018) NIA-AA Research Framework: Toward a biological definition of Alzheimer’s disease. Alzheimers Dement 14, 535–562. [DOI] [PMC free article] [PubMed] [Google Scholar]
- [2].Pan D, Zeng A, Jia L, Huang Y, Frizzell T, Song X (2020) Early Detection of Alzheimer’s Disease Using Magnetic Resonance Imaging: A Novel Approach Combining Convolutional Neural Networks and Ensemble Learning. Frontiers in Neuroscience 14,. [DOI] [PMC free article] [PubMed] [Google Scholar]
- [3].Aderghal K, Afdel K, Benois-Pineau J, Catheline G (2020) Improving Alzheimer’s stage categorization with Convolutional Neural Network using transfer learning and different magnetic resonance imaging modalities. Heliyon 6,. [DOI] [PMC free article] [PubMed] [Google Scholar]
- [4].Seo EH, Park WY, Choo IH (2017) Structural MRI and amyloid PET imaging for prediction of conversion to alzheimer’s disease in patients with mild cognitive impairment: A meta-analysis. Psychiatry Investigation 14, 205–215. [DOI] [PMC free article] [PubMed] [Google Scholar]
- [5].Jack CR, Wiste HJ, Therneau TM, Weigand SD, Knopman DS, Mielke MM, Lowe VJ, Vemuri P, Machulda MM, Schwarz CG, Gunter JL, Senjem ML, Graff-Radford J, Jones DT, Roberts RO, Rocca WA, Petersen RC (2019) Associations of Amyloid, Tau, and Neurodegeneration Biomarker Profiles with Rates of Memory Decline among Individuals Without Dementia. JAMA - Journal of the American Medical Association 321, 2316–2325. [DOI] [PMC free article] [PubMed] [Google Scholar]
- [6].Zeng Q, Li K, Luo X, Wang S, Xu X, Li Z, Zhang T, Liu X, Fu Y, Xu X, Wang C, Wang T, Zhou J, Liu Z, Chen Y, Huang P, Zhang M (2020) Distinct Atrophy Pattern of Hippocampal Subfields in Patients with Progressive and Stable Mild Cognitive Impairment: A Longitudinal MRI Study. Journal of Alzheimer’s Disease 1–11. [DOI] [PubMed] [Google Scholar]
- [7].Search of: neuroprotection - List Results - ClinicalTrials.gov.
- [8].Preische O, Schultz SA, Apel A, Kuhle J, Kaeser SA, Barro C, Gräber S, Kuder-Buletta E, LaFougere C, Laske C, Vöglein J, Levin J, Masters C, Martins R, Schofield P, Rossor MN, Graff-Radford N, Salloway S, Ghetti B, Ringman J, Noble J, Chhatwal J, Goate A, Benzinger T, Morris J, Bateman R, Wang G, Fagan A, McDade E, Gordon B, Jucker M, Allegri R, Amtashar F, Berman S, Bodge C, Brandon S, Brooks W, Buck J, Buckles V, Chea S, Chrem P, Chui H, Cinco J, Clifford J, Cruchaga C, D’Mello M, Donahue T, Douglas J, Edigo N, Erekin-Taner N, Farlow M, Farrar A, Feldman H, Flynn G, Fox N, Franklin E, Fujii H, Gant C, Gardener S, Goldman J, Gray J, Gurney J, Hassenstab J, Hirohara M, Holtzman D, Hornbeck R, DiBari SH, Ikeuchi T, Ikonomovic S, Jerome G, Karch C, Kasuga K, Kawarabayashi T, Klunk W, Koeppe R, Lee JH, Marcus D, Mason NS, Maue-Dreyfus D, Montoya L, Mori H, Nagamatsu A, Neimeyer K, Norton J, Perrin R, Raichle M, Roh JH, Shimada H, Shiroto T, Shoji M, Sigurdson W, Sohrabi H, Sparks P, Suzuki K, Swisher L, Taddei K, Wang J, Wang P, Weiner M, Wolfsberger M, Xiong C, Xu X (2019) Serum neurofilament dynamics predicts neurodegeneration and clinical progression in presymptomatic Alzheimer’s disease. Nature Medicine 25, 277–283. [DOI] [PMC free article] [PubMed] [Google Scholar]
- [9].Elahi FM, Casaletto KB, la Joie R, Walters SM, Harvey D, Wolf A, Edwards L, Rivera-Contreras W, Karydas A, Cobigo Y, Rosen HJ, DeCarli C, Miller BL, Rabinovici GD, Kramer JH (2020) Plasma biomarkers of astrocytic and neuronal dysfunction in early- and late-onset Alzheimer’s disease. Alzheimer’s and Dementia 16, 681–695. [DOI] [PMC free article] [PubMed] [Google Scholar]
- [10].Tsimberidou AM, Fountzilas E, Nikanjam M, Kurzrock R (2020) Review of precision cancer medicine: Evolution of the treatment paradigm. Cancer Treatment Reviews 86,. [DOI] [PMC free article] [PubMed] [Google Scholar]
- [11].Greenwalt I, Zaza N, Das S, Li BD (2020) Precision Medicine and Targeted Therapies in Breast Cancer. Surgical Oncology Clinics of North America 29, 51–62. [DOI] [PubMed] [Google Scholar]
- [12].Pinker K, Chin J, Melsaether AN, Morris EA, Moy L (2018) Precision medicine and radiogenomics in breast cancer: New approaches toward diagnosis and treatment. Radiology 287, 732–747. [DOI] [PubMed] [Google Scholar]
- [13].AD+ADRD Research Implementation Milestone Database | National Institute on Aging. [Google Scholar]
- [14].O’Bryant SE, Johnson LA, Barber RC, Braskie MN, Christian B, Hall JR, Hazra N, King K, Kothapalli D, Large S, Mason D, Matsiyevskiy E, McColl R, Nandy R, Palmer R, Petersen M, Philips N, Rissman RA, Shi Y, Toga AW, Vintimilla R, Vig R, Zhang F, Yaffe K (2021) The Health & Aging Brain among Latino Elders (HABLE) Study Methods and Participant Characteristics. Alzheimer’s and Dementia: Diagnosis, Assessment and Disease Monitoring 13,. [DOI] [PMC free article] [PubMed] [Google Scholar]
- [15].O’Bryant S, Petersen M, Hall J, Johnson L, Yaffe K, Braskie M, Toga AW, Rissman RA (2021) Characterizing plasma NfL in a community-dwelling multi-ethnic cohort: Results from the HABLE study. Alzheimer’s & Dementia. [DOI] [PMC free article] [PubMed] [Google Scholar]
- [16].O’Bryant SE, Zhang F, Petersen M, Hall JR, Johnson LA, Yaffe K, Mason D, Braskie M, Barber RA, Rissman RA, Mapstone M, Mielke MM, Toga AW (2021) A blood screening tool for detecting mild cognitive impairment and Alzheimer’s disease among community-dwelling Mexican Americans and non-Hispanic Whites: A method for increasing representation of diverse populations in clinical research. Alzheimer’s and Dementia. [DOI] [PMC free article] [PubMed] [Google Scholar]
- [17].O’Bryant SE, Johnson L, Edwards M, Soares H, Devous MD, Ross S, Rohlfing G, Hall J (2013) The link between c-reactive protein and alzheimer’s disease among mexican americans. Journal of Alzheimer’s Disease. [DOI] [PMC free article] [PubMed] [Google Scholar]
- [18].O’Bryant SE, Xiao G, Edwards M, Devous M, Gupta VB, Martins R, Zhang F, Barber R (2013) Biomarkers of Alzheimer’s disease among Mexican Americans. Journal of Alzheimer’s Disease. [DOI] [PMC free article] [PubMed] [Google Scholar]
- [19].O’Bryant SE, Johnson L, Reisch J, Edwards M, Hall J, Barber R, Devous MD Sr., Royall D, Singh M (2013) Risk factors for mild cognitive impairment among Mexican Americans. Alzheimer’s and Dementia. [DOI] [PMC free article] [PubMed] [Google Scholar]
- [20].O’Bryant SE, Johnson L, Balldin V, Edwards M, Barber R, Williams B, Devous M, Cushings B, Knebl J, Hall J (2013) Characterization of Mexican Americans with mild cognitive impairment and Alzheimer’s disease. Journal of Alzheimer’s Disease 33, 373–379. [DOI] [PMC free article] [PubMed] [Google Scholar]
- [21].O’Bryant SE, Zhang F, Petersen M, Hall JR, Lohnson LA, Yaffe K, Braskie M, Rissman RA, Vig R, Toga AW for the H study team Neurodegenration from the AT(N) Framework is Different among Mexican Americans compared to Non-Hispanic Whites: An HABLE Study. Alzheimer’s & Dementia: Diagnosis, Assessment & Disease Monitoring. [DOI] [PMC free article] [PubMed] [Google Scholar]
- [22].O’Bryant SE, Zhang F, Johnson LA, Hall J, Edwards M, Grammas P, Oh E, Lyketsos CG, Rissman RA (2018) A Precision Medicine Model for Targeted NSAID Therapy in Alzheimer’s Disease. Journal of Alzheimer’s disease 66, 97–104. [DOI] [PMC free article] [PubMed] [Google Scholar]
- [23].Folstein MF, Folstein SE, McHugh PR (1975) “Mini-mental state”. A practical method for grading the cognitive state of patients for the clinician. Journal of Psychiatric Research 12, 189–198. [DOI] [PubMed] [Google Scholar]
- [24].Weschler D (1987) Weschler memory scale - revised, Psychological Corporation, San Antonio. [Google Scholar]
- [25].Reitan RM, Wolfson D (1985) The Halstead-Reitan Neuropsychological Test Battery: Theory and Interpretation, Neuropsychology Press, Tucson, AZ. [Google Scholar]
- [26].González HM, Mungas D, Haan MN (2002) A verbal learning and memory test for English- and Spanish-speaking older Mexican-American adults. Clinical Neuropsychologist. [DOI] [PubMed] [Google Scholar]
- [27].Lezak MD, Howieson DB, Loring DW (2004) Neuropsychological Assessment. 4th ed., Oxford University Press, Oxford. [Google Scholar]
- [28].O’Bryant SE, Edwards M, Johnson L, Hall J, Gamboa A, O’jile J (2018) Texas Mexican American adult normative studies: Normative data for commonly used clinical neuropsychological measures for English- and Spanish-speakers. Developmental Neuropsychology. [DOI] [PMC free article] [PubMed] [Google Scholar]
- [29].Sierra Sanjurjo N, Montañes P, Sierra Matamoros FA, Burin D (2015) Estimating Intelligence in Spanish: Regression Equations with the Word Accentuation Test and Demographic Variables in Latin America. Applied Neuropsychology:Adult. [DOI] [PubMed] [Google Scholar]
- [30].Berg L (1988) Clinical Dementia Rating (CDR). Psychopharmacology Bulletin. [PubMed] [Google Scholar]
- [31].Institute for Translational Research.
- [32].O’Bryant SE, Lacritz LH, Hall J, Waring SC, Chan W, Khodr ZG, Massman PJ, Hobson V, Cullum CM (2010) Validation of the new interpretive guidelines for the clinical dementia rating scale sum of boxes score in the National Alzheimer’s Coordinating Center database. Archives of Neurology 67, 746–749. [DOI] [PMC free article] [PubMed] [Google Scholar]
- [33].O’Bryant SE, Gupta V, Henriksen K, Edwards M, Jeromin A, Lista S, Bazenet C, Soares H, Lovestone S, Hampel H, Montine T, Blennow K, Foroud T, Carrillo M, Graff-Radford N, Laske C, Breteler M, Shaw L, Trojanowski JQ, Schupf N, Rissman RA, Fagan AM, Oberoi P, Umek R, Weiner MW, Grammas P, Posner H, Martins R (2015) Guidelines for the standardization of preanalytic variables for blood-based biomarker studies in Alzheimer’s disease research. Alzheimer’s and Dementia. [DOI] [PMC free article] [PubMed] [Google Scholar]
- [34].O’Bryant SE, Edwards M, Johnson L, Hall J, Villarreal AE, Britton GB, Quiceno M, Cullum CM, Graff-Radford NR (2016) A blood screening test for Alzheimer’s disease. Alzheimer’s and Dementia: Diagnosis, Assessment and Disease Monitoring. [DOI] [PMC free article] [PubMed] [Google Scholar]
- [35].O’Bryant SE, Ferman TJ, Zhang F, Hall J, Pedraza O, Wszolek ZK, Como T, Julovich D, Mattevada S, Johnson LA, Edwards M, Graff-Radford NR (2019) A proteomic signature for dementia with Lewy bodies. Alzheimer’s and Dementia: Diagnosis, Assessment and Disease Monitoring. [DOI] [PMC free article] [PubMed] [Google Scholar]
- [36].O’Bryant SE, Edwards M, Zhang F, Johnson LA, Hall J, Kuras Y, Scherzer CR (2019) Potential two-step proteomic signature for Parkinson’s disease: Pilot analysis in the Harvard Biomarkers Study. Alzheimer’s and Dementia: Diagnosis, Assessment and Disease Monitoring. [DOI] [PMC free article] [PubMed] [Google Scholar]
- [37].Petersen ME, Zhang F, Schupf N, Krinsky-McHale SJ, Hall J, Mapstone M, Cheema A, Silverman W, Lott I, Rafii MS, Handen B, Klunk W, Head E, Christian B, Foroud T, Lai F, Rosas HD, Zaman S, Ances BM, Wang MC, Tycko B, Lee JH, O’Bryant S, Aizenstein HJ, Andrews HF, Bell K, Birn RM, Brickman AM, Bulova P, Cheema A, Chen K, Christian BT, Clare I, Clark L, Cohen AD, Constantino JN, Doran EW, Fagan A, Feingold E, Foroud TM, Handen BL, Hartley SL, Henson R, Hom C, Honig L, Ikonomovic MD, Johnson SC, Jordan C, Kamboh MI, Keator D, Klunk WE, Kofler JK, Kreisl WC, Lao P, Laymon C, Lott IT, Lupson V, Mathis CA, Minhas DS, Nadkarni N, Pang D, Petersen M, Price JC, Pulsifer M, Reiman E, Rizvi B, Sabbagh MN, Silverman WP, Tudorascu DL, Tumuluru R, Varadarajan B, White DA, Yassa MA (2020) Proteomic profiles for Alzheimer’s disease and mild cognitive impairment among adults with Down syndrome spanning serum and plasma: An Alzheimer’s Biomarker Consortium–Down Syndrome (ABC–DS) study. Alzheimer’s and Dementia: Diagnosis, Assessment and Disease Monitoring 12, e12023. [DOI] [PMC free article] [PubMed] [Google Scholar]
- [38].O’Bryant SE, Xiao G, Barber R, Reisch J, Hall J, Cullum M, Doody R, Fairchild T, Adams P, Wilhelmsen K, Diaz-Arrastia R (2011) A blood based algorithm for the detection of Alzheimer’s disease. Dementia and Geriatric Cognitive Disorders 32, 55–62. [DOI] [PMC free article] [PubMed] [Google Scholar]
- [39].O’Bryant SE, Lista S, Rissman RA, Edwards M, Zhang F, Hall J, Zetterberg H, Lovestone S, Gupta V, Graff-Radford N, Martins R, Jeromin A, Waring S, Oh E, Kling M, Baker LD, Hampel H (2016) Comparing biological markers of Alzheimer’s disease across blood fraction and platforms: Comparing apples to oranges. Alzheimer’s and Dementia: Diagnosis, Assessment and Disease Monitoring 3, 27–34. [DOI] [PMC free article] [PubMed] [Google Scholar]
- [40].Zhang F, Petersen M, Johnson L, Hall J, O’Bryant SE (2021) Recursive Support Vector Machine Biomarker Selection for Alzheimer’s Disease. Journal of Alzheimer’s Disease 79, 1691–1700. [DOI] [PubMed] [Google Scholar]
- [41].O’Bryant SE, Ferman TJ, Zhang F, Hall J, Pedraza O, Wszolek ZK, Como T, Julovich D, Mattevada S, Johnson LA, Edwards M, Graff-Radford NR (2019) A proteomic signature for dementia with Lewy bodies. Alzheimer’s and Dementia: Diagnosis, Assessment and Disease Monitoring 11, 270–276. [DOI] [PMC free article] [PubMed] [Google Scholar]
- [42].O’Bryant SE, Edwards M, Zhang F, Johnson LA, Hall J, Kuras Y, Scherzer CR (2019) Potential two-step proteomic signature for Parkinson’s disease: Pilot analysis in the Harvard Biomarkers Study. Alzheimer’s and Dementia: Diagnosis, Assessment and Disease Monitoring 11, 374–382. [DOI] [PMC free article] [PubMed] [Google Scholar]
- [43].Petersen ME, Rafii MS, Zhang F, Hall J, Julovich D, Ances BM, Schupf N, Krinsky-McHale SJ, Mapstone M, Silverman W, Lott I, Klunk W, Head E, Christian B, Foroud T, Lai F, Diana Rosas H, Zaman S, Wang MC, Tycko B, Lee JH, Handen B, Hartley S, Fortea J, O’Bryant S (2021) Plasma Total-Tau and Neurofilament Light Chain as Diagnostic Biomarkers of Alzheimer’s Disease Dementia and Mild Cognitive Impairment in Adults with Down Syndrome. Journal of Alzheimer’s disease : JAD 79, 671–681. [DOI] [PMC free article] [PubMed] [Google Scholar]
- [44].R: A language and environment for statistical computing, Last updated 2009, Accessed on 2009.
- [45].LaValle SM, Branicky MS (2004) On the relationship between classical grid search and probabilistic roadmaps. In Springer Tracts in Advanced Robotics. [Google Scholar]
- [46].O’Bryant SE, Zhang F, Petersen M, Johnson L, Hall J, Rissman RA (2021) A Precision Medicine Approach to Treating Alzheimer’s Disease Using Rosiglitazone Therapy: A Biomarker Analysis of the REFLECT Trials. Journal of Alzheimer’s Disease 81, 557–568. [DOI] [PMC free article] [PubMed] [Google Scholar]
- [47].U.S. Census Bureau QuickFacts: United States. [Google Scholar]
- [48].US Hispanic population reached new high in 2019, but growth slowed | Pew Research Center. [Google Scholar]
- [49].Jacobsen LA, Mather M, Lee M (2011) America’s Aging Population. Population Bulletin 66,. [Google Scholar]
- [50].Matthews KA, Xu W, Gaglioti AH, Holt JB, Croft JB, Mack D, McGuire LC (2019) Racial and ethnic estimates of Alzheimer’s disease and related dementias in the United States (2015–2060) in adults aged ≥65 years. Alzheimer’s and Dementia. [DOI] [PMC free article] [PubMed] [Google Scholar]
- [51].American Fact Finder, Last updated 2004, Accessed on 2004.