

Abstract
Introduction
Patients with predementia Alzheimer's disease (AD) and at‐risk subjects are targets for promising disease‐modifying treatments, and improved polygenic risk scores (PRSs) could improve early‐stage case selection.
Methods
Phenotype‐informed PRSs were developed by selecting AD‐associated variants conditional on relevant inflammatory or cardiovascular traits. The primary outcome was longitudinal changes in measures of AD pathology, namely development of pathological amyloid deposition, medial temporal lobe atrophy, and cognitive decline in a prospective cohort study including 394 adults without AD dementia.
Results
High‐risk groups defined by phenotype‐informed AD PRSs had significantly steeper volume decline in medial temporal cortices, and the high‐risk group defined by the cardiovascular‐informed AD PRS had significantly increased hazard ratio of pathological amyloid deposition, compared to low‐risk groups.
Discussion
AD PRSs informed by inflammatory disorders or cardiovascular risk factors and diseases are associated with development of AD pathology markers and may improve identification of subjects at risk for progression of AD.
Keywords: Alzheimer's disease, cerebrovascular disease, inflammation, polygenic risk score
1. BACKGROUND
Alzheimer's disease (AD) is the most prevalent cause of dementia, imposing huge burdens on society, patients, and carers. Recent evidence has shown that AD‐associated pathological changes occur decades before onset of clinical symptoms, 1 leading research to focus on identification of at‐risk subjects and predementia AD patients for secondary prevention. As disease‐modifying drugs become available, this is increasingly important.
Risk for late‐onset AD is driven by a combination of environmental and genetic factors. Late‐onset AD is a highly heritable polygenetic disorder, 2 with apolipoprotein E (APOE) ε4 as the strongest risk factor. While genetic evidence indicates that amyloid beta (Aβ) dysmetabolism causes early‐onset AD, there is pathoanatomical, 3 , 4 epidemiological, 5 , 6 and experimental 7 , 8 evidence for the involvement of processes related to innate immune response and cholesterol metabolism 9 , 10 in late‐onset AD, although the underlying mechanisms have not yet been determined. Aβ clearance decreases with age and could, in combination with genetic liabilities for compromised innate immune or vascular clearance capacity, contribute to Aβ dysmetabolism and disease inception. 11 Genetic association analyses based on genome‐wide association studies (GWAS) have provided evidence for pleiotropy between AD, inflammatory (INFL), 12 and cardiovascular traits (CVD), 13 lending support to previous results obtained using other genetic approaches. 14
Acknowledging inflammation and cardiovascular risk as two major mechanisms leading toward progression to AD, we developed AD polygenic risk scores (PRSs) informed by inflammatory disorders (PRSINFL) and cardiovascular disease risk factors and disease (PRSCVD), respectively, expecting such scores to be associated with development of pathological amyloid deposition, cerebral atrophy in AD predilection sites, and cognitive decline. In addition, we sought to reveal biological pathways and mechanisms involved in AD development based on phenotype‐specific genetic profiles.
2. METHODS
2.1. Study population
APGeM (pre‐clinical genotype–phenotype predictors of Alzheimer's disease and other dementias) is a European multi‐center network of clinical sites, collecting cases from memory clinics based on standardized examination of cognitive, functional, and behavioral measures. PRSs were computed for subjects in the APGeM cohort. All APGeM subjects with the exception of those in the prospective cohort Dementia Disease Initiation (DDI) 15 served as an independent cohort to select the optimal P‐value threshold for the standard PRS or false discovery rate (FDR) thresholds for the phenotype‐informed PRSs. For details on the APGeM cohort, see Methods in supporting information.
Evaluation of the PRSs was done in DDI, a Norwegian multi‐center network comprising 394 study participants with follow‐up ranging from 0 to 5.4 years (median 2.1 years). The criteria for inclusion were age between 40 and 80 years at baseline and Norwegian, Swedish, or Danish as native language.
RESEARCH IN CONTEXT
Systematic Review: We reviewed literature by conducting a search in PubMed and Google Scholar and reviewing references in relevant publications.
Interpretation: Phenotype‐informed polygenic risk scores (PRSs) were developed by selecting Alzheimer's disease (AD)‐associated variants conditional on relevant inflammatory or cardiovascular traits, and these were associated with development of AD pathology measures. We here show that including biological information can improve the predictive ability of the PRSs and potentially improve identification of subjects at risk for progression of AD.
Future Directions: It is vital to develop tools for better detection of AD risk. To be clinically useful, a PRS must identify at‐risk subjects in samples of sizes typically seen in memory clinics. This article demonstrates that adding biological information to the AD PRSs through this novel method is robust enough to add prediction value in such a sample. This new methodology might be important for better AD risk detection for primary and secondary prevention.
All participants underwent cognitive testing, cerebral magnetic resonance imaging (MRI), blood screening, and standard lumbar puncture as part of the clinical assessment. Based on the cognitive testing, the participants with normal performance on standardized tests, but with reported cognitive symptoms, were classified as having subjective cognitive decline (SCD), as defined in the SCD working group framework. 16 The National Institute on Aging–Alzheimer's Association (NIA/AA) criteria for mild cognitive impairment (MCI) were used for participants with lower performance than expected in one or more cognitive domains but preserving independence in functional ability and not fulfilling the criteria of dementia, as defined in NIA‐AA guidelines. 17 , 18 The cutoff values for SCD versus MCI were results less than 1.5 standard deviation below normative mean on either CERAD (Consortium to Establish a Registry for Alzheimer's Disease) word list (delayed recall), 19 VOSP (Visual Object and Space Perception) silhouettes, 20 COWAT (Controlled Oral Word Association Test), 21 and TMT (Trail Making Test) part B. 21 The same criteria were used to classify participants with no self‐reported symptoms of cognitive decline as cognitively normal (NC) or abnormal controls. The participants are followed until development of dementia.
2.2. Polygenic risk scores
A standard P‐value–based AD PRS was computed following the method described by the International Schizophrenia Consortium 22 using a recent AD GWAS. 2
The phenotype‐informed AD PRSs were computed in the same way but selecting variants on the basis of their association with AD conditional on CVD or INFL traits. Evidence for this comes in the form of conditional false discovery rate (condFDR) 23 as a function of AD association with respective selections of 11 relevant INFL diseases (ulcerative colitis, 24 Crohn's disease, 24 rheumatoid arthritis, 25 celiac disease, 26 psoriasis, 27 multiple sclerosis, 28 primary sclerosing cholangitis, 29 systemic lupus erythematosus, 30 diabetes type 1, 31 vitiligo, 32 and ankylosing spondylitis 33 ) or 11 relevant CVD traits (systolic blood pressure, 34 diastolic blood pressure, 34 coronary artery disease, 35 type 2 diabetes, 36 stroke, 37 body mass index, 38 waist‐hip ratio, 39 high density lipids, 40 low density lipids, 40 triglycerides, 40 and total cholesterol). 40 Genotyping and bioinformatic processing are described in supporting information Methods, together with summary data for all GWASs reported in Tables S1 and S2 in supporting information.
2.3. AD markers
2.3.1. Measures of amyloid deposition
Lumbar punctures were performed similarly on six sites following a detailed standard operating procedure from an EU‐funded multicenter study described previously. 41 For more details, see supporting information Methods.
2.3.2. MRI volumes of medial temporal cortices
Volumetric segmentation was performed with the Automatic Segmentation of Hippocampal Subfields (ASHS) software using the ASHS‐PMC‐T1 atlas, which is free and publicly available (http://www.nitrc.org/). 42 The reference paper for ASHS was based on a cohort aged 54 to 88 years old. 42 Of the 394 participants included in the baseline MRI analyses, 40 (10.2%) were below 54 years of age. However, all segmentations were visually assessed. Multi‐scanner effects were harmonized using the Longitudinal ComBat method, 43 also including age at baseline, sex, intracranial volume, polygenic score, and number of APOE ε4 alleles. As such, harmonization was performed three times, one for each of the polygenic scores. We computed medial temporal cortices (MTC) volumes by summing the harmonized volumes for each PRS of the entorhinal cortex and the early Braak regions Brodmann areas 35 and 36, averaged across both hemispheres. A summary of scanners and associated scanner parameters for the MRI are listed in Table S3 in supporting information.
2.3.3. Cognitive test results
A cognitive composite score was computed by taking the mean of the t‐scores from VOSP silhouettes, 20 CERAD word list (delayed recall), 19 COWAT, 21 and TMT B. 21 Based on these norms, T‐scores were computed as standardized z scores multiplied by 10 and shifted to a mean of 50 (T = z*10+50). As VOSP was not part of the test battery for staging initially, 8.7% of the study participants did not undergo the VOSP silhouettes test at baseline assessment. The composite scores for these participants only included the mean t‐scores from CERAD recall, COWAT, and TMT B. We performed an independent t‐test of differences between the mean of the cognitive composite score used in our analyses and the mean of a composite score omitting VOSP silhouettes for all participants at baseline. There was no significant difference (P = .715).
2.4. Statistical analyses
For a description of the procedure for the selection of optimal P‐value and FDR thresholds and biostatistics, see supporting information Methods.
2.4.1. Cross‐sectional analyses
To investigate the association between PRSs and the AD markers, we fitted cross‐sectional linear regression models of baseline cerebrospinal fluid (CSF) Aβ42 level, MTC volume, and cognitive composite score, for each of the PRSs. All continuous variables were z‐transformed to produce partially standardized coefficients. The analyses were performed in R version 4.0.3. For more details on the cross‐sectional analyses including covariates, cut‐offs, and R packages, see supporting information Methods.
2.4.2. Longitudinal analyses
We identified subgroups of the DDI cohort with high and low genetic risk based on each PRS, defined by PRS values one standard deviation or more above and below the mean in the whole DDI cohort, respectively. To test our main hypothesis, we performed longitudinal analyses comparing high‐ and low‐risk groups for each of the AD markers: amyloid status, MTC volume, and cognitive composite score to assess differences in progression. Those neither defined as high‐ nor low‐risk groups were not included in the longitudinal analyses.
CSF Aβ42 is assumed to have non‐linear development with time, 44 and we therefore performed Cox proportional hazards regression to assess differences in hazard rates of amyloid positivity between high‐ and low‐risk groups.
Regarding MTC volume and cognitive composite score, we assessed the difference in development with time between high‐ and low‐risk groups fitting linear mixed models with either MTC volume or cognitive composite score as dependent variable, categorical risk group variable, years since baseline, and the interaction between risk group and time as fixed independent variables and age at baseline, sex, and APOE ε4 carrier status were included as covariates. An additional covariate was intracranial volume in the analyses of MTC volume, and years of education in the analysis of cognitive composite T‐score.
We evaluated models with random intercepts (subject) or also random slopes (years since baseline) using log‐likelihood ratio tests. For all models, random intercept showed the best fit, except for the model with MTC volume as dependent variable and high‐ and low‐risk groups based on PRSCVD as independent variable. Random intercept only was therefore chosen for all models, called Model 1. In Model 2, we added the interaction term between APOE ε4 carrier status and time. All continuous variables except the time variable were z‐transformed to produce partially standardized coefficients.
The analyses were performed in R version 4.0.3. For more details on the longitudinal analyses, see supporting information Methods.
2.5. Genomic loci definition and functional annotation
We submitted the results from the condFDR analyses to Functional Mapping and Annotation of GWAS (FUMA) v1.3.6 45 to annotate the genomic loci with condFDR value < 0.01. FUMA was also deployed to annotate lead single nucleotide polymorphisms (SNPs) based on functional categories. We tested for overrepresentation of mapped genes in the phenotype‐informed condFDR at condFDR below 0.01 within pathways derived from 12 public resources, collated by ConsensusPathDB and corrected for multiple testing using the q‐value. 46 For further details, see Vethods.
2.6. Ethics
The regional medical research ethics committee approved the study. Participants gave their written informed consent before taking part in the study. The study was conducted in line with the guidelines provided by the Declaration of Helsinki of 1964, 2013 revision, and the Norwegian Health and Research Act.
3. RESULTS
Demographics of the study population are presented in Table 1.
TABLE 1.
Demographic data for the total DDI cohort and the low‐ and high‐risk groups
| Total | AD PRS | PRSINFL | PRSCVD | ||||
|---|---|---|---|---|---|---|---|
| Low‐risk | High‐risk | Low‐risk | High‐risk | Low‐risk | High‐risk | ||
| Group size | |||||||
| Baseline | n = 394 | n = 59 | n = 67 | n = 62 | n = 57 | n = 64 | n = 56 |
| 2. assessment | n = 293 | n = 44 | n = 43 | n = 46 | n = 38 | n = 48 | n = 35 |
| 3. assessment | n = 82 | n = 13 | n = 9 | n = 12 | n = 6 | n = 15 | n = 9 |
| Years of follow‐up: median (IQR) | 2.13 (2.76) | 2.17 (2.57) | 2.12 (2.56) | 2.11 (2.56) | 2.12 (2.50) | 2.11 (2.67) | 2.13 (3.06) |
| Age at baseline: mean (st.dev) | 63.9 (9.34) | 63.5 (9.21) | 63.8 (9.26) | 61.9 (8.63) | 65.5 (8.84)* | 63.3 (9.89) | 64.4 (8.70) |
| Sex: n (% female) | n = 233 (59.1%) | n = 30 (50.8%) | n = 38 (56.7%) | n = 37 (59.7%) | n = 32 (56.1%) | n = 38 (59.4%) | n = 29 (51.8%) |
| MMSE at baseline: median (IQR) | 29.0 (2.0) | 29.0 (1.0) | 29.0 (2.0) | 29.0 (2.0) | 29.0 (2.0) | 29.0 (1.0) | 29.0 (2.0) |
| Framingham Risk Score at baseline: mean (st. dev) | 3.83 (3.41) | 4.60 (3.45) | 3.16 (3.68) | 4.33 (3.57) | 3.81 (3.51) | 4.13 (3.39) | 3.81 (3.94) |
| Erythrocyte sedimentation rate at baseline: median (IQR) | 7.0 (8.0) | 6.0 (7.25) | 7.0 (8.0) | 6.0 (7.0) | 7.0 (9.0) | 7.0 (7.0) | 7.0(8.0) |
| APOE ε4 alleles | |||||||
| 0 alleles | n = 222 (56.3%) | n = 35 (59.3%) | n = 41 (61.2%) | n = 33 (53.2%) | n = 30 (52.6%) | n = 37 (57.8%) | n = 30 (53.6%) |
| 1 alleles | n = 145 (36.8%) | n = 23 (34.6%) | n = 21 (35.6%) | n = 24 (42.1%) | n = 24 (38.7%) | n = 23 (35.9%) | n = 23 (41.1%) |
| 2 alleles | n = 27 (6.9%) | n = 3 (4.5%) | n = 3 (5.1%) | n = 3 (5.3%) | n = 5 (8.1%) | n = 4 (6.3%) | n = 3 (5.4%) |
| Stage at baseline | |||||||
| NC | n = 93 (23.6%) | n = 19 (32.2%) | n = 19 (28.4%) | n = 18 (29.9%) | n = 12 (21.1%) | n = 16 (25.0%) | n = 14 (25.0%) |
| Not‐NC | n = 43 (10.9%) | n = 5 (8.5%) | n = 10 (14.9%) | n = 7 (11.3%) | n = 7 (12.3%) | n = 10 (15.6%) | n = 3 (5.4%) |
| SCD | n = 133 (33.8%) | n = 22 (37.3%) | n = 18 (26.9%) | n = 25 (40.3%) | n = 27 (47.4%) | n = 23 (35.9%) | n = 20 (35.7%) |
| MCI | n = 101 (25.6%) | n = 8 (13.6%) | n = 17 (25.4%) | n = 8 (12.9%) | n = 10 (17.5%) | n = 13 (20.3%) | n = 16 (28.6%) |
| Missing data | n = 24 (6.1%) | n = 5 (8.5%) | n = 3 (4.5%) | n = 4 (6.5%) | n = 1 (1.8%) | n = 2 (3.1%) | n = 3 (5.4%) |
| Aβ status at baseline | |||||||
| A– | n = 279 (70.8%) | n = 47 (79.7%) | n = 51 (76.1%) | n = 50 (80.6%) | n = 38 (66.7%) | n = 52 (81.3%) | n = 38 (67.9%) |
| A+ | n = 73 (18.5%) | n = 7 (11.9%) | n = 10 (14.9%) | n = 7 (11.3%) | n = 13 (22.8%) | n = 7 (10.9%) | n = 13 (23.2%) |
| Missing data | n = 42 (10.7%) | n = 5 (8.5%) | n = 6 (9.0%) | n = 5 (8.1%) | n = 6 (10.5%) | n = 5 (7.8%) | n = 5 (8.9%) |
Note: Overview of demographic data for the total DDI cohort and the low‐ and high‐risk groups based on standard AD PRS, PRSINFL, and PRSCVD, respectively. Median years of follow‐up and the number of participants with 2 and 3 assessments are described for the total cohort and the low‐ and high‐risk groups. The simple Framingham Risk Score for cardiovascular disease (FRS‐CVD) was calculated for each subject, based on information about age, systolic blood pressure (SBP), use of antihypertensive medication, body mass index (BMI), and history of type 2 diabetes mellitus (DM). To illustrate potential group differences in cardiovascular risk beyond age, the FRS‐CVD was calculated without the age component. Age at baseline and FRS‐CVD are described by mean and standard deviation, and we assessed group differences between low‐ and high‐risk groups with independent samples t‐tests. Continuous variables with non‐normal distribution (years of follow‐up, MMSE, and erythrocyte sedimentation rate) are described by median and interquartile ranges and compared across groups with Mann‐Whitney U tests. Categorical variables (sex, number of APOE ε4 alleles, stage at baseline, and Aβ status at baseline) are described by frequencies and percentages and compared across groups with Pearson's chi square tests. The different stages at baseline are NC, subjects recruited as NC with abnormal cognitive staging (Not‐NC), subjects with SCD, MCI, or missing data. Aβ status at baseline is given as non‐pathological (A–), pathological (A+), or missing data. We used version 27 of the Statistical Package for Social Sciences (SPSS) for testing group differences in patient characteristics within the DDI cohort. The high‐risk group based on the PRSINFL were significantly older and had more subjects with SCD and MCI than the low‐risk group. We found no other significant group differences.
P < .05 in comparisons between high‐ and low‐risk groups.
Abbreviations: Aβ, amyloid beta; AD, Alzheimer's disease; APOE, apolipoprotein E; DDI, Dementia Disease Initiation; IQR, interquartile range; MCI, mild cognitive impairment; MMSE, Mini‐Mental State Examination; NC, normal control; PRSCVD, PRS informed by cardiovascular risk factors; PRSINFL, PRS informed by inflammatory disorders; SCD, subjective cognitive decline.
3.1. Cross‐sectional analyses
3.1.1. CSF Aβ42 levels
We found significant negative associations between baseline CSF Aβ42 levels and the PRSINFL (β = –0.116, 95% confidence interval [CI] = [–0.206, –0.026], P = .012, adjusted R2 for the entire model = 0.239), the PRSCVD (β = –0.113, 95% CI = [–0.204, –0.022], P = .015, adjusted R2 for the entire model = 0.238) and the standard P‐value‐based AD PRS (β = –0.104, 95% CI = [–0.194, –0.014], P = .024, adjusted R2 for the entire model = 0.237), meaning that higher PRS are associated with more pathological Aβ42 levels (see scatter plots in Figure 1A–C).
FIGURE 1.

Cross‐sectional association between Alzheimer's disease (AD) measures and the phenotype‐informed AD polygenic risk scores (PRSs) and a standard AD PRS. Scatter plots of cerebrospinal fluid (CSF) amyloid beta (Aβ)42 levels versus standard AD PRS (A), PRS informed by inflammatory disorders (PRSINFL; B) and PRS informed by cardiovascular risk factors (PRSCVD; C) with significant associations between CSF Aβ42 and all three AD PRSs at P = .024, P = .012, and P = .015, respectively. Scatter plots of medial temporal cortices (MTC) volume levels versus standard AD PRS (D), PRSINFL (E), and PRSCVD (F), with a significant association between baseline MTC volume and PRSINFL at P = .034, but not for standard AD PRS (P = .102) nor PRSCVD (P = .316). Scatter plots of cognitive composite scores versus standard AD PRS (G), PRSINFL (H), and PRSCVD (I), with a significant association between the cognitive composite score and both PRSINFL and PRSCVD with P = .013 and P = .043, respectively, and a sub‐threshold tendency for the standard AD PRS with P = .053
3.1.2. MTC volumes
We found a significant negative association of baseline MTC volume with the PRSINFL (β = –0.084, 95% CI = [–0.162, –0.006], P = .034, adjusted R2 for the entire model = 0.452), but not with the PRSCVD (β = –0.042, 95% CI = [–0.124, –0.040], P = .316, adjusted R2 for the entire model = 0.446) or the standard P‐value‐based AD PRS (β = –0.066, 95% CI = [–0.145, 0.013], P = .103, adjusted R2 for the entire model = 0.448; see scatter plots in Figure 1D–F).
3.1.3. Cognitive composite T‐scores
We found significant negative association of cognitive composite T‐scores with both the PRSINFL (β = –0.114, 95% CI = [–0.203, –0.024], P = .013, adjusted R2 for the entire model = 0.098) and the PRSCVD (β = –0.092, 95% CI = [–0.182, –0.003], P = .043, adjusted R2 for the entire model = 0.092), but only a trend association with the standard P‐value‐based AD PRS (β = –0.091, 95% CI = [–0.183, 0.001], P = .053, adjusted R2 for the entire model = 0.092), see scatter plots in Figure 1G–H.
3.2. Longitudinal analyses
3.2.1. Amyloid positivity
We found a significantly increased hazard ratio of 2.836 (95% CI = [1.043, 7.710] and P = .041) comparing high‐ and low‐risk groups defined by the PRSCVD. For high‐ versus low‐risk groups defined by the PRSINFL and the standard P‐value–based AD PRS the hazard ratios were 2.130 (95% CI = [0.810, 5.599] and P = .125) and 1.612 (95% CI = 0.610, 4.260] and P = .335), respectively. Survival plots are shown in Figure 2A–C.
3.2.2. MTC volume
Using Model 1, we found a significant interaction between the risk group variables and time for both the PRSINFL (P = .030) and the PRSCVD (P = .008), meaning that the MTC volume decreased significantly faster in the high‐risk groups than in the low‐risk groups. There was no significant difference with time between the standard AD PRS groups (P = .135). See Table 2 and Figure 2D–F. For the analysis with PRSCVD high‐ and low‐risk groups, it was a significant log‐likelihood test when we compared a model without and with random slopes (P = .009), and using random slopes in the model, there was a significant interaction between the risk group variable and time (β = –0.072, 95% CI = [–0.135, –0.009], P = .029).
TABLE 2.
Longitudinal linear mixed models of differences in time between high‐ and low‐risk groups for MTC volume and cognitive composite T‐score, with low‐risk groups as reference
| AD markers | Independent variable | β | 95% CI | P‐value |
|---|---|---|---|---|
| MTC volume | ||||
|
Standard AD PRS (ntot = 172, n1st = 96, n2nd = 65, n3rd = 11) | ||||
| Model 1 | Group | –0.161 | (–0.420, 0.098) | .235 |
| Time | 0.004 | (–0.033, 0.041) | .843 | |
| Group × time | –0.041 | (–0.095, 0.012) | .135 | |
| Model 2 | Group | –0.161 | (–0.420, 0.098) | .235 |
| Time | 0.005 | (–0.037, 0.048) | .812 | |
| Group × time | –0.041 | (–0.095, 0.013) | .147 | |
|
PRSINFL (ntot = 169, n1st = 93, n2nd = 64, n3rd = 12) | ||||
| Model 1 | Group | –0.220 | (–0.480, 0.040) | .108 |
| Time | 0.023 | (–0.008, 0.055) | .157 | |
| Group × time | –0.056 | (–0.106, –0.007) | .030* | |
| Model 2 | Group | –0.222 | (–0.482, 0.038) | .106 |
| Time | 0.048 | (0.009, 0.088) | .021* | |
| Group × time | –0.051 | (–0.100, –0.003) | .043* | |
|
PRSCVD (ntot = 155, n1st = 84, n2nd = 57, n3rd = 14) | ||||
| Model 1 | Group | –0.169 | (–0.469, 0.131) | .285 |
| Time | 0.015 | (–0.023, 0.054) | .440 | |
| Group × time | –0.080 | (–0.137, –0.023) | .008** | |
| Model 2 | Group | –0.173 | (–0.473, 0.127) | .272 |
| Time | 0.040 | (–0.006, 0.086) | .101 | |
| Group × time | –0.069 | (–0.126, –0.012) | .021* | |
| Cognitive composite T‐score | ||||
|
Standard AD PRS (ntot = 209, n1st = 113, n2nd = 76, n3rd = 20) | ||||
| Model 1 | Group | –0.366 | (–0.689, –0.043) | .031* |
| Time | –0.011 | (–0.081, 0.059) | .762 | |
| Group × time | 0.045 | (–0.059, 0.149) | .397 | |
| Model 2 | Group | –0.367 | (–0.689, –0.044) | .031* |
| Time | –0.002 | (–0.086, 0.082) | .965 | |
| Group × time | 0.046 | (–0.058, 0.150) | .387 | |
|
PRSINFL (ntot = 206, n1st = 112, n2nd = 78, n3rd = 16) | ||||
| Model 1 | Group | –0.167 | (–0.510, 0.176) | .350 |
| Time | 0.033 | (–0.040, 0.106) | .380 | |
| Group x time | –0.015 | (–0.127, 0.097) | .798 | |
| Model 2 | Group | –0.167 | (–0.510, 0.176) | .350 |
| Time | 0.040 | (–0.060, 0.140) | .438 | |
| Group x time | –0.014 | (–0.126, 0.098) | .805 | |
|
PRSCVD (ntot = 213, n1st = 114, n2nd = 76, n3rd = 23) | ||||
| Model 1 | Group | –0.088 | (–0.430, 0.255) | .624 |
| Time | 0.058 | (–0.010, 0.126) | .095 | |
| Group x time | –0.071 | (–0.175, 0.033) | .186 | |
| Model 2 | Group | –0.088 | (–0.431, 0.254) | .620 |
| Time | 0.092 | (–0.0005, 0.183) | .052 | |
| Group x time | –0.068 | (–0.172, 0.035) | .203 | |
Notes: In Model 1, a linear mixed model was fitted with either MTC volume or cognitive composite score as the dependent variable, and categorical risk group variable, years since baseline, and interaction between risk group and time as fixed independent variables. For the analyses of MTC volume, age at baseline, sex, intracranial volume, and APOE ε4 carrier status were included as covariates. For the analyses of cognitive composite T‐score, age at baseline, sex, years of education, and APOE ε4 carrier status were included as covariates. In Model 2, an interaction term of APOE ε4 positivity and time was added. The subject identification variable was included as random effect variable with random intercept in both models. In the table, the group variable's coefficient represents the baseline difference between the high‐risk group and the low‐risk group. The time variable's coefficient represents the development with time for the low‐risk group. The Group × Time variable represent the difference in development with time for the high‐risk compared to the low‐risk group, and the sum of the coefficients for Time and Group × Time gives the coefficient for the high‐risk group. Analyses were performed in R version 4.0.3 (R core team 2019); package lmerTest and function lmer for longitudinal linear mixed model regression.
Abbreviations: AD, Alzheimer's disease; APOE, apolipoprotein E; CI, confidence interval; MTC, medial temporal cortices; PRSCVD, PRS informed by cardiovascular risk factors; PRSINFL, PRS informed by inflammatory disorders; SCD, subjective cognitive decline.
FIGURE 2.

Longitudinal changes in Alzheimer's disease (AD) measures for high‐ and low‐risk groups defined by the phenotype‐informed AD polygenic risk scores (PRSs) and a standard AD PRS. Survival plots of amyloid status for high‐ versus low‐risk groups, unadjusted for apolipoprotein E ε4 alleles; in (A) for standard AD PRS (hazard ratio 1.612, 95% confidence interval [CI] = [0.610, 4.260], P = .335), in (B) for PRS informed by inflammatory disorders (PRSINFL; hazard ratio 2.130, 95% CI = [0.810, 5.599], P = .125), and in (C) for PRS informed by cardiovascular risk factors (PRSCVD; hazard ratio 2.836, 95% CI = [1.043, 7.710], P = .041). Adjusted fixed effects plots of group × time interaction of medial temporal cortices (MTC) volume for high‐ versus low‐risk groups; in (D) showing non‐significant interaction for standard AD PRS (β = –0.041, 95% CI = [–0.095, 0.012], P = .135), but significant interaction in (E) for PRSINFL (β = –0.056, 95% CI = [–0.106, –0.007], P = .030) and in (F) for PRSCVD (β = – 0.080, 95%CI = [–0.137, 0.023], P = .008). Adjusted fixed effects plots of group × time interaction of cognitive composite scores for high‐ versus low‐risk groups, showing non‐significant interaction in (G) for standard AD PRS (β = –0.045, 95% CI = [–0.059, 0.149], P = .397), in (H) for PRSINFL (β = –0.015, 95% CI = [–0.127, 0.097], P = .798) and in (I) for PRSCVD (β = –0.071, 95% CI = [–0.175, 0.033], P = .186)
Using Model 2, the interaction between APOE ε4 positivity and time did not meet the pre‐specified requirement for significance, although P‐values were at subthreshold levels for PRSINFL and for PRSCVD (P = .896 for standard AD PRS, P = .056 for PRSINFL, and P = .085 for PRSCVD). It was a significant interaction between the risk group variables and time also with Model 2 for both the PRSINFL (P = .043) and the PRSCVD (P = .021), see Table 2.
3.2.3. Cognitive composite score
We found no significant interaction between the risk group variables and time for standard P‐value‐based PRS, PRSINFL, or PRSCVD. As there was no significant time interaction between APOE ε4 positivity and MTC volume (for standard AD PRS P = .711, for PRSINFL P = .839, and for PRSCVD P = .839, model 2, Table 2), reported results are from Model 1 (see Table 2), with similar coefficients and P‐values for both models. Adjusted fixed effects plots of group–time interaction from Model 1 are shown in Figure 2G‐I.
3.3. Genetic characterization of the genetic association studies on which the phenotype‐informed AD PRSs are based
3.3.1. AD‐associated loci identified with phenotype‐informed condFDR
Using a condFDR threshold of 0.01, 181 and 72 of the loci comprising the phenotype‐informed PRSs were identified as most likely susceptibility loci for AD conditional on the 11 different INFL diseases or the 11 different CVD traits, respectively. This is illustrated in Manhattan plots in Figure 3A and B, as well as Figure S1 in supporting information for the Q‐Q plots illustrating the genetic overlap, Tables S1 and S2 with functional annotation, Figure S2 in supporting information for distribution of the annotations, expression quantitative trait loci (eQTL) analyses (Tables S3 and S4 in supporting information) and mapped genes (Tables S5 and S6 in supporting information) based on the lead SNPs. Details on the top 10 AD‐associated loci identified with the phenotype‐informed condFDR are reported in supporting information Methods and Results. The differential expression of the mapped genes is illustrated in Figure S3 in supporting information.
FIGURE 3.
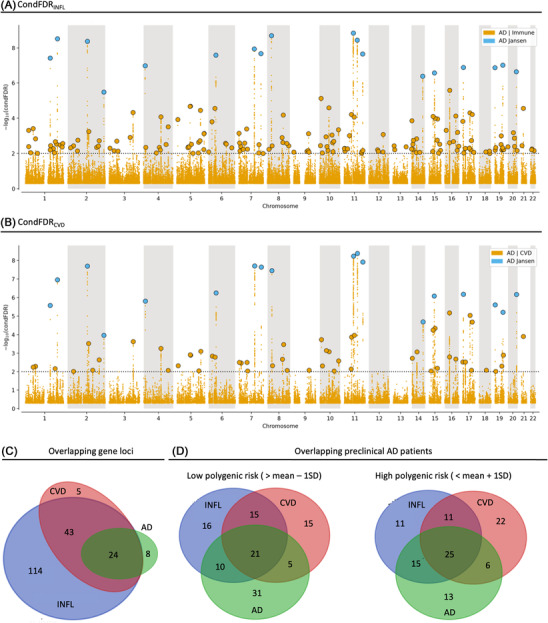
Unique and overlapping single nucleotide polymorphisms (SNPs), gene loci, and patients identified by Alzheimer's disease (AD) genome‐wide association studies (GWAS), conditional false discovery rate for inflammatory disorders (condFDRINFL) and cardiovascular risk factors (condFDRCVD) and their respective polygenic risk scores (PRSs). Manhattan plot in (A) and (B) showing the ‐log10 transformed condFDR values for each SNP on the y‐axis and the chromosomal positions along the x‐axis. The dotted horizontal line represents the threshold chosen for reporting the conditional associations (condFDR < 0.01). Independent lead SNPs are marked by blue outlined circles if they are genome‐wide significant (P < 5×10⁻⁸) in AD GWAS (Jansen et al. 2 ) and in yellow if unique for the phenotypes informing the AD score. Further details are provided in Tables S1 and S2 in supporting information. Venn diagram in (C) showing unique and overlapping gene loci between AD GWAS, condFDRINFL, and condFDRCVD, while the Venn diagrams in (D) shows the different populations identified as low‐ and high risk by one standard deviation below or above mean of the respective PRSs
Of the 181 candidate gene loci identified by the INFL condFDR analysis (condFDRINFL), 157 represent unique gene loci not detected by the AD GWAS (see Figure 3A and C). Of the 72 gene loci identified by the CVD condFDR analysis (condFDRCVD), 48 represent unique gene loci not detected by the AD GWAS (see Figure 3B and C). Details on the gene loci unique for the phenotype‐informed condFDR analysis are reported in supporting information Methods and Results. In a clinical setting, the scores based on these phenotype‐informed condFDR analyses identify partially overlapping patient cohorts with low and high AD PRS and phenotype‐informed AD PRSs, respectively (see Figure 3D).
3.3.2. Overrepresented pathway for condFDRINFL and condFDRCVD
Using three gene mapping strategies (positional mapping, eQTL, and chromatin interaction mapping) on FUMA, 45 we functionally mapped the 181 and 72 loci found in the condFDRINFL and condFDRCVD, respectively (see Tables S1–S6). All 11 of the pathways overrepresented for condFDRINFL remained significant after correcting for multiple testing. Two pathways were related to synthesis of GDP‐mannose (both q = 0.0383) and others to fatty acids, antiviral response, and mitochondrial energy production. None of the pathways overrepresented for condFDRCVD remained significant after correcting for multiple testing. See Tables S9 and S10 in supporting information for pathway overrepresentation analysis.
3.3.3. Gene set for condFDRINFL and condFDRCVD
The gene ontology analysis of all mapped genes (Tables S7 and S8 in supporting information) revealed 80 and 23 significant gene sets associated to biological processes for the condFDRINFL and condFDRCVD, respectively. The gene set analyses showed a dominance of biological processes relevant for immune activation, as positive regulation of catalytic activity (P = .01 for condFDRCVD and P = 3.00×10⁻⁷ for condFDRINFL), regulation of immune response (P = .001 for condFDRCVD and P = 2.12×10⁻⁵ for condFDRINFL), and regulation of immune system process (P = 9.13×10⁻⁵ for condFDRCVD and P = .0001 for condFDRINFL). Candidate genes from both condFDR analyses were significantly abundant in gene sets for lipid metabolic process (P = .006 for condFDRCVD and P = .005 for condFDRINFL) and Aβ metabolic process (P = .014 for condFDRCVD and P = 7.11×10⁻⁵ for condFDRINFL). In addition to these shared gene sets, more gene sets relevant for immune activation are enriched of genes singled out by condFDRINFL, for instance cytokine production (P = .001), proteolysis (P = .0016), innate immune response (P = .011), and myeloid leukocyte mediated immunity (P = .029).
The gene ontology analysis also revealed 33 and 22 cellular components significantly enriched of genes from condFDRCVD and condFDRINFL, respectively, like early endosomes (P = .047 for condFDRCVD and P = 1.59×10⁻⁵ for condFDRINFL) and endosomes (P = .0003 for condFDRCVD and P = 2.67×10⁻⁸ for condFDRINFL). The condFDRCVD pointed rather to gene sets relevant for cell motility, like cell leading edge (P = .0007), ruffle (P = .021), and cell projection membrane (P = .049). Gene sets relevant for endocytosis (P = .0012) and phagocytosis (P = .031) were enriched from the condFDRINFL. All P‐values presented above are Bonferroni‐corrected.
4. DISCUSSION
Here we show that our novel PRSINFL and PRSCVD are associated with progression of AD markers in an early‐stage clinical setting. The high‐risk groups identified by the PRSINFL and PRSCVD had significantly steeper decline in MTC volume over time compared to low‐risk groups. Also, the high‐risk group defined by the PRSCVD had significantly increased hazard ratio for pathological amyloid deposition compared to the low‐risk group. Finally, we found associations between baseline cognitive performance and both the PRSINFL and PRSCVD and between baseline MTC volume and the PRSINFL. No significant associations were observed between the standard P‐value–based AD PRS and any of these AD measures.
A standard P‐value–based AD PRS captures overall genetic AD risk, which includes a range of biological pathways and mechanisms. We here show that including biological information in the form of phenotype‐specific GWASs can potentially help stratify clinical subgroups in need of different treatment strategies. Also, the process of constructing phenotype‐informed AD PRSs, by means of condFDR estimation, can provide further insight into the genetic mechanisms underlying AD.
Conditioning the AD association on 11 INFL or 11 CVD GWASs, the number of candidate variants included in the PRSs are increased from 28 of the standard P‐value–based AD PRS to 181 and 72 in the PRSINFL and PRSCVD, respectively. As recently suggested by Zhou et al., 47 AD risk might be modulated by the aggregate effects of many hidden variants. The phenotype‐informed scores could embody such effects by virtue of the condFDR method used to enrich the AD PRS. Extensive information can be gleaned about the INFL‐ and CVD‐related candidate AD genes, even though not every individual gene function is known. The results of this study add to the extensive literature on condFDR‐based methods 23 and encourages us to regard the gene loci identified using the condFDR‐based approach as valuable non‐APOE candidate AD loci even though several of them did not reach genome‐wide significance in the AD GWAS.
Notably, a previous study found scores for an immune pathway including six gene loci and a cholesterol pathway including three gene loci to provide no additive predictive value for AD biomarkers compared to APOE alone. 48 As APOE genotyping is often part of clinical AD risk evaluation, an AD PRS is only relevant if it has a predictive value beyond that of APOE alone. 49 We therefore excluded SNPs from the APOE region from all the scores and corrected for APOE ε4 allele number or carrier status 49 to evaluate the PRS's value added to the APOE genotype. More than half of the patients referred to memory clinics that eventually develop AD are APOE ε4 negative. An APOE‐naive PRS could be important in the early identification of these patients. To what extent the genetic phenotype‐informed scores detect distinct clinical phenotypes will need to be further examined in subsequent work.
As attempts at using standard AD PRS, even in large cohorts, have been inconclusive, 49 , 50 an improvement of AD PRS is warranted. To be clinically useful, a PRS must identify at‐risk subjects in samples of sizes typically seen in memory clinics. We showed here that the phenotype‐informed AD scores are robust enough to add prediction value in such a sample. While the signs and symptoms are unspecific in early‐phase disease, it may represent an important window of opportunity for treatment. Thus, it is important to develop tools for better detection of AD risk, for primary or secondary prevention.
We have chosen three different AD markers as outcome variables. In the survival model we look at amyloid positivity, which has a high specificity for AD. Hence, we believe that the results correspond with actual AD, regardless of pleiotropic effects. MTC atrophy and cognitive decline are less specific parameters of AD, where for example, cerebrovascular disease might affect cognition without involvement of AD pathology. Another limitation of this study is the application of the MRI segmentation ASHS in this young pre‐dementia cohort (up to 14% of scans of participants below 54 years of age), as the reference study for ASHS was based on a cohort aged 54–88 years old. 42 However, all segmentations were visually assessed.
In summary, the PRSINFL and PRSCVD seem capable of identifying subjects at risk for progression of AD. This innovative polygenic risk modeling may be useful in early‐stage diagnostics and for inclusion in clinical trials, as well as future development of personalized treatment strategies.
AUTHOR CONTRIBUTIONS
Kaja Nordengen, Lene Pålhaugen, Francesco Bettella, Lavinia Athanasiu, and Tormod Fladby conceived and designed the study. Francesco Bettella performed the analysis and developed the new scores, with help from Lavinia Athanasiu, Shahram Bahrami, and Alexey Shadrin. Shahram Bahrami performed the gene mapping. Jonas Jarholm and Per Selnes performed the ASHS segmentation and Per Selnes performed the ComBAT harmonization. Kaja Nordengen and Lene Pålhaugen did the statistical analyses in the clinical cohort and wrote the first draft. All authors contributed to and approved the final manuscript.
CONFLICTS OF INTEREST
K.N., O.A.A., and T.F. have funding from South Eastern Norway Health Authority; K.N. and T.F. have funding from JPND/EU Precision Medicine in Alzheimer's disease. O.A.A. also has funding from Research Council of Norway and KG Jebsen Stiftelsen. Other authors report nothing to disclose related to the manuscript. Author disclosures are available in the supporting information.
Supporting information
Supporting information
Supporting information
ACKNOWLEDGMENTS
The authors were funded by the Research Council of Norway (O.A.A.: 213837, 223273, 248778, 273291, 262656, 229129, 283798, 311993), the EU Joint Program Neurodegenerative Disease Research (K.N. and T.F.: PMI‐AD RCN 311993), and the South Eastern Norway Health Authority (K.N., O.A.A., and T.F.). This work was performed on the TSD (Tjeneste for Sensitive Data) facilities, owned by the University of Oslo, operated and developed by the TSD service group at the University of Oslo, IT‐Department (USIT) and on resources provided by UNINETT Sigma2 the National Infrastructure for High Performance Computing and Data Storage in Norway.
Nordengen K, Pålhaugen L, Bettella F, et al. Phenotype‐informed polygenic risk scores are associated with worse outcome in individuals at risk of Alzheimer's disease. Alzheimer's Dement. 2022;14:e12350. 10.1002/dad2.12350
Kaja Nordengen and Lene Pålhaugen contributed equally to the work.
REFERENCES
- 1. Sperling RA, Aisen PS, Beckett LA, Bennett DA, Craft S, Fagan AM, et al. Toward defining the preclinical stages of Alzheimer's disease: recommendations from the National Institute on Aging‐Alzheimer's Association workgroups on diagnostic guidelines for Alzheimer's disease. Alzheimers Dement. 2011;7:280‐292. 10.1016/j.jalz.2011.03.003 [DOI] [PMC free article] [PubMed] [Google Scholar]
- 2. Jansen IE, Savage JE, Watanabe K, Bryois J, Williams DM, Steinberg S, et al. Genome‐wide meta‐analysis identifies new loci and functional pathways influencing Alzheimer's disease risk. Nat Genet. 2019;51:404‐413. 10.1038/s41588-018-0311-9 [DOI] [PMC free article] [PubMed] [Google Scholar]
- 3. Hopperton K, Mohammad D, Trépanier M, Giuliano V, Bazinet R. Markers of microglia in post‐mortem brain samples from patients with Alzheimer's disease: a systematic review. Mol Psychiatry. 2018;23:177‐198. [DOI] [PMC free article] [PubMed] [Google Scholar]
- 4. Bouras C, Kövari E, Herrmann FR, Rivara CB, Bailey TL, von Gunten A, et al. Stereologic analysis of microvascular morphology in the elderly: Alzheimer disease pathology and cognitive status. J Neuropathol Exp Neurol. 2006;65:235‐244. [DOI] [PubMed] [Google Scholar]
- 5. Weggen S, Rogers M, Eriksen J. NSAIDs: small molecules for prevention of Alzheimer's disease or precursors for future drug development? Trends Pharmacol Sci. 2007;28:536‐543. [DOI] [PubMed] [Google Scholar]
- 6. Duron E, Hanon O. Vascular risk factors, cognitive decline, and dementia. Vasc Health Risk Manag. 2008;4:363. [DOI] [PMC free article] [PubMed] [Google Scholar]
- 7. Bourasset F, Ouellet M, TRemblay C, Julien C, Do TM, Oddo S, et al. Reduction of the cerebrovascular volume in a transgenic mouse model of Alzheimer's disease. Neuropharmacology. 2009;56:808‐813. [DOI] [PubMed] [Google Scholar]
- 8. Andreone BJ, Przybyla L, Llapashtica C, Rana A, Davis SS, van Lengerich B, et al. Alzheimer's‐associated PLCγ2 is a signaling node required for both TREM2 function and the inflammatory response in human microglia. Nat Neurosci. 2020;23:1‐12. [DOI] [PubMed] [Google Scholar]
- 9. Sarlus H, Heneka MT. Microglia in Alzheimer's disease. J Clin Investig. 2017;127:3240‐3249. 10.1172/jci90606 [DOI] [PMC free article] [PubMed] [Google Scholar]
- 10. Love S, Miners JS. Cerebrovascular disease in ageing and Alzheimer's disease. Acta Neuropathol. 2016;131:645‐658. [DOI] [PMC free article] [PubMed] [Google Scholar]
- 11. Patterson BW, Elbert DL, et al. Age and amyloid effects on human central nervous system amyloid‐beta kinetics. Ann Neurol. 2015;78:439‐453. [DOI] [PMC free article] [PubMed] [Google Scholar]
- 12. Yokoyama JS, Wang Y, Schork AJ, Thompson WK, Karch CM, Cruchaga C, et al. Association between genetic traits for immune‐mediated diseases and Alzheimer disease. JAMA Neurol. 2016;73:691‐697. 10.1001/jamaneurol.2016.0150 [DOI] [PMC free article] [PubMed] [Google Scholar]
- 13. Broce IJ, Tan CH, Fan CC, Jansen I, Savage JE, Witoelar A, et al. Dissecting the genetic relationship between cardiovascular risk factors and Alzheimer's disease. Acta Neuropathol. 2019;137:209‐226. [DOI] [PMC free article] [PubMed] [Google Scholar]
- 14. Jones L, Holmans PA, Hamshere ML, Harold D, Moskvina V, Ivanov D, et al. Genetic evidence implicates the immune system and cholesterol metabolism in the aetiology of Alzheimer's disease. PLoS One. 2010;5:e13950. [DOI] [PMC free article] [PubMed] [Google Scholar]
- 15. Fladby T, Paalhaugen L, Selnes P, Waterloo K, Braathen G, Hessen E, et al. Detecting at‐risk Alzheimer's disease cases. J Alzheimers Dis. 2017;60:97‐105. 10.3233/jad-170231 [DOI] [PMC free article] [PubMed] [Google Scholar]
- 16. Jessen F, Amariglio RE, van Boxtel M, Breteler M, Ceccaldi M, Chetelat G, et al. A conceptual framework for research on subjective cognitive decline in preclinical Alzheimer's disease. Alzheimers Dement. 2014;10:844‐852. 10.1016/j.jalz.2014.01.001 [DOI] [PMC free article] [PubMed] [Google Scholar]
- 17. Albert MS, DeKosky ST, Dickson D, Dubois B, Feldman HH, Fox NC, et al. The diagnosis of mild cognitive impairment due to Alzheimer's disease: recommendations from the National Institute on Aging‐Alzheimer's Association workgroups on diagnostic guidelines for Alzheimer's disease. Alzheimers Dement. 2011;7:270‐279. 10.1016/j.jalz.2011.03.008 [DOI] [PMC free article] [PubMed] [Google Scholar]
- 18. McKhann GM, Knopman DS, Chertkow H, Hyman BT, Jack CR Jr, Kawas CH, et al. The diagnosis of dementia due to Alzheimer's disease: recommendations from the National Institute on Aging‐Alzheimer's Association workgroups on diagnostic guidelines for Alzheimer's disease. Alzheimers Dement. 2011;7:263‐269. 10.1016/j.jalz.2011.03.005 [DOI] [PMC free article] [PubMed] [Google Scholar]
- 19. Sotaniemi M, Pulliainen V, Hokkanen L, Pirttila T, Hallikainen I, Soininen H, Hanninen T. CERAD‐neuropsychological battery in screening mild Alzheimer's disease. Acta Neurologica Scandinavica. 2012;125:16‐23. 10.1111/j.1600-0404.2010.01459.x [DOI] [PubMed] [Google Scholar]
- 20. Warrington EK, James M. The visual object and space perception battery. Thames Valley Test Company; 1991. [Google Scholar]
- 21. Heaton RK. Revised comprehensive norms for an expanded halstead‐reitan battery: demographically adjusted neuropsychological norms for African American and Caucasian adults: professional manual. Psychological Assessment Resources; 2004. [Google Scholar]
- 22. Consortium IS. Common polygenic variation contributes to risk of schizophrenia that overlaps with bipolar disorder. Nature. 2009;460:748. [DOI] [PMC free article] [PubMed] [Google Scholar]
- 23. Smeland OB, Frei O, Shadrin A, O'Connell K, Fan C‐C, Bahrami S, et al. Discovery of shared genomic loci using the conditional false discovery rate approach. Hum Genet. 2020;139:85‐94. [DOI] [PubMed] [Google Scholar]
- 24. Liu JZ, van Sommeren S, Huang H, Ng SC, Alberts R, Takahashi A, et al. Association analyses identify 38 susceptibility loci for inflammatory bowel disease and highlight shared genetic risk across populations. Nat Genet. 2015;47:979‐986. 10.1038/ng.3359 [DOI] [PMC free article] [PubMed] [Google Scholar]
- 25. Okada Y, Wu D, Trynka G, Raj T, Terao C, Ikari K, et al. Genetics of rheumatoid arthritis contributes to biology and drug discovery. Nature. 2014;506:376‐381. 10.1038/nature12873 [DOI] [PMC free article] [PubMed] [Google Scholar]
- 26. Dubois PC, Trynka G, Franke L, Hunt KA, Romanos J, Curtotti A, et al. Multiple common variants for celiac disease influencing immune gene expression. Nat Genet. 2010;42:295‐302. 10.1038/ng.543 [DOI] [PMC free article] [PubMed] [Google Scholar]
- 27. Ellinghaus D, Ellinghaus E, Nair RP, Stuart PE, Esko T, Metspalu A, et al. Combined analysis of genome‐wide association studies for Crohn disease and psoriasis identifies seven shared susceptibility loci. Am J Hum Genet. 2012;90:636‐647. 10.1016/j.ajhg.2012.02.020 [DOI] [PMC free article] [PubMed] [Google Scholar]
- 28. Sawcer S, Hellenthal G, Pirinen M, Spencer CC, Patsopoulos NA, Moutsianas L, et al. Genetic risk and a primary role for cell‐mediated immune mechanisms in multiple sclerosis. Nature. 2011;476:214‐219. 10.1038/nature10251 [DOI] [PMC free article] [PubMed] [Google Scholar]
- 29. Liu JZ, Hov JR, Folseraas T, Ellinghaus E, Rushbrook SM, Doncheva NT, et al. Dense genotyping of immune‐related disease regions identifies nine new risk loci for primary sclerosing cholangitis. Nat Genet. 2013;45:670‐675. 10.1038/ng.2616 [DOI] [PMC free article] [PubMed] [Google Scholar]
- 30. Bentham J, Morris DL, Cunninghame Graham DS, Pinder CL, Tombleson P, Behrens TW, et al. Genetic association analyses implicate aberrant regulation of innate and adaptive immunity genes in the pathogenesis of systemic lupus erythematosus. Nat Genet. 2015;47:1457‐1464. 10.1038/ng.3434 [DOI] [PMC free article] [PubMed] [Google Scholar]
- 31. Barrett JC, Clayton DG, Concannon P, Akolkar B, Cooper JD, Erlich HA, et al. Genome‐wide association study and meta‐analysis find that over 40 loci affect risk of type 1 diabetes. Nat Genet. 2009;41:703‐707. 10.1038/ng.381 [DOI] [PMC free article] [PubMed] [Google Scholar]
- 32. Jin Y, Birlea S, et al. Genome‐wide association analyses identify 13 new susceptibility loci for generalized vitiligo. Nat Genet. 2012;44:676‐680. 10.1038/ng.2272 [DOI] [PMC free article] [PubMed] [Google Scholar]
- 33. Cortes A, Hadler J, Pointon JP, Robinson PC, Karderi T, Leo P, et al. Identification of multiple risk variants for ankylosing spondylitis through high‐density genotyping of immune‐related loci. Nat Genet. 2013;45:730‐738. 10.1038/ng.2667 [DOI] [PMC free article] [PubMed] [Google Scholar]
- 34. Ehret GB, Munroe PB, Rice KM, Bochud M, Johnson AD, Chasman DI, et al. Genetic variants in novel pathways influence blood pressure and cardiovascular disease risk. Nature. 2011;478:103‐109. [DOI] [PMC free article] [PubMed] [Google Scholar]
- 35. Nelson CP, Goel A, Butterworth AS, Kanoni S, Webb TR, Marouli E, et al. Association analyses based on false discovery rate implicate new loci for coronary artery disease. Nat Genet. 2017;49:1385‐1391. [DOI] [PubMed] [Google Scholar]
- 36. Mahajan A, Taliun D, Thurner M, Robertson NR, Torres JM, Rayner NW, et al. Fine‐mapping type 2 diabetes loci to single‐variant resolution using high‐density imputation and islet‐specific epigenome maps. Nat Genet. 2018;50:1505‐1513. [DOI] [PMC free article] [PubMed] [Google Scholar]
- 37. Malik R, Traylor M, Pulit SL, Bevan S, Hopewell JC, Holliday EG, et al. Low‐frequency and common genetic variation in ischemic stroke: the METASTROKE collaboration. Neurology. 2016;86:1217‐1226. [DOI] [PMC free article] [PubMed] [Google Scholar]
- 38. Locke AE, Kahali B, Berndt SI, Justice AE, Pers TH, Day FR, et al. Genetic studies of body mass index yield new insights for obesity biology. Nature. 2015;518:197‐206. [DOI] [PMC free article] [PubMed] [Google Scholar]
- 39. Shungin D, Winkler TW, Croteau‐Chonka DC, Ferreira T, Locke AE, Mägi R, et al. New genetic loci link adipose and insulin biology to body fat distribution. Nature. 2015;518:187‐196. [DOI] [PMC free article] [PubMed] [Google Scholar]
- 40. Willer CJ, Schmidt EM, Sengupta S, Peloso GM, Gustafsson S, Kanoni S, et al. Discovery and refinement of loci associated with lipid levels. Nat Genet. 2013;45:1274. [DOI] [PMC free article] [PubMed] [Google Scholar]
- 41. Reijs BL, Teunissen CE, Goncharenko N, Betsou F, Blennow K, Baldeiras I, et al. The central biobank and virtual biobank of BIOMARKAPD: a resource for studies on neurodegenerative diseases. Front. Neurol. 2015;6:216. [DOI] [PMC free article] [PubMed] [Google Scholar]
- 42. Xie L, Wisse LW, Pluta J, de Flores R, Piskin V, Manjón JV, et al. Automated segmentation of medial temporal lobe subregions on in vivo T1‐weighted MRI in early stages of Alzheimer's disease. Human brain mapping. 2019;40(12):3431‐3451. [DOI] [PMC free article] [PubMed] [Google Scholar]
- 43. Beer JC, Tustison NJ, Cook PA, Davatzikos C, Sheline YI, Shinohara RT, et al. Longitudinal ComBat: a method for harmonizing longitudinal multi‐scanner imaging data. Neuroimage. 2020;220:117129. [DOI] [PMC free article] [PubMed] [Google Scholar]
- 44. Toledo JB, Bjerke M, Da X, Landau SM, Foster NL, Jagust W, et al. Nonlinear association between cerebrospinal fluid and florbetapir F‐18 β‐amyloid measures across the spectrum of Alzheimer disease. JAMA Neurol. 2015;72:571‐581. [DOI] [PMC free article] [PubMed] [Google Scholar]
- 45. Watanabe K, Taskesen E, Van Bochoven A, Posthuma D. Functional mapping and annotation of genetic associations with FUMA. Nat Commun. 2017;8:1‐11. [DOI] [PMC free article] [PubMed] [Google Scholar]
- 46. Herwig R, Hardt C, Lienhard M, Kamburov A. Analyzing and interpreting genome data at the network level with ConsensusPathDB. Nat Protoc. 2016;11:1889‐1907. [DOI] [PubMed] [Google Scholar]
- 47. Zhou X, Li YY, Fu AK, Ip NY. Polygenic score models for Alzheimer's disease: from research to clinical applications. Front. Neurosci. 2021;15:346. [DOI] [PMC free article] [PubMed] [Google Scholar]
- 48. Darst BF, Koscik RL, Racine AM, Oh JM, Krause RA, Carlsson CM, et al. Pathway‐specific polygenic risk scores as predictors of amyloid‐β deposition and cognitive function in a sample at increased risk for Alzheimer's disease. J Alzheimer's Dis. 2017;55:473‐484. [DOI] [PMC free article] [PubMed] [Google Scholar]
- 49. Altmann A, Scelsi MA, Shoai M, de Silva E, Aksman LM, Cash DM, et al. A comprehensive analysis of methods for assessing polygenic burden on Alzheimer's disease pathology and risk beyond APOE. Brain commun. 2020;2:fcz047. [DOI] [PMC free article] [PubMed] [Google Scholar]
- 50. Adams HH, de Bruijn RF, Hofman A, Uitterlinden AG, van Duijn CM, Vernooij MW, et al. Genetic risk of neurodegenerative diseases is associated with mild cognitive impairment and conversion to dementia. Alzheimers Dement. 2015;11:1277‐1285. [DOI] [PubMed] [Google Scholar]
Associated Data
This section collects any data citations, data availability statements, or supplementary materials included in this article.
Supplementary Materials
Supporting information
Supporting information