

Abstract

Due to the great potential of surface-enhanced Raman scattering (SERS) as local vibrational probe of lipid–nanostructure interaction in lipid bilayers, it is important to characterize these interactions in detail. The interpretation of SERS data of lipids in living cells requires an understanding of how the molecules interact with gold nanostructures and how intermolecular interactions influence the proximity and contact between lipids and nanoparticles. Ceramide, a sphingolipid that acts as important structural component and regulator of biological function, therefore of interest to probing, lacks a phosphocholine head group that is common to many lipids used in liposome models. SERS spectra of liposomes of a mixture of ceramide, phosphatidic acid, and phosphatidylcholine, as well as of pure ceramide and of the phospholipid mixture are reported. Distinct groups of SERS spectra represent varied contributions of the choline, sphingosine, and phosphate head groups and the structures of the acyl chains. Spectral bands related to the state of order of the membrane and moreover to the amide function of the sphingosine head groups indicate that the gold nanoparticles interact with molecules involved in different intermolecular relations. While cryogenic electron microscopy shows the formation of bilayer liposomes in all preparations, pure ceramide was found to also form supramolecular, concentric stacked and densely packed lamellar, nonliposomal structures. That the formation of such supramolecular assemblies supports the intermolecular interactions of ceramide is indicated by the SERS data. The unique spectral features that are assigned to the ceramide-containing lipid model systems here enable an identification of these molecules in biological systems and allow us to obtain information on their structure and interaction by SERS.
Introduction
The interaction of lipids with nanostructures plays an important role in a wide range of applications in biotechnology and theranostics.1−5 The impact that nanostructures have on lipid structure and interaction in natural and artificial membranes is based on a local interaction that occurs at the nanoscale.6−10 Therefore, in addition to ultrastructural imaging of membranes and nanostructures, e.g., by advanced microscopy,11,12 lipid molecular structure must be characterized by a local spectroscopic probe.
In the case of gold nanostructures, frequently used in nanobiotechnology in the context of lipids, the structure and intermolecular interaction of lipid molecules and their contact with the nanostructure surface can be probed in a label-free way by exploiting surface-enhanced Raman scattering (SERS) and the high local fields in the nanometer-scaled environment of the nanostructure. By SERS, Raman spectral information is obtained selectively at the site of the lipid–nanostructure contact within nanometer proximity,13,14 and probing of noninteracting species is avoided.15 This is different from normal Raman scattering, useful to elucidate lipid structure in bulk samples and in microspectroscopy.16−21 By combining molecular structural information from SERS with cryogenic electron microscopy (cryo-EM), we have shown that SERS reveals lipid organization and liposome structure and composition.15 In initial work, we reported on the possibility to characterize the state-of-order of lipid chains in liposomes by SERS, specifically changes that take place in the presence of cholesterol and excess negative charge.15 The polar head groups were identified as the main contact site in the gold nanoparticle–membrane interaction in liposome models and in wrapped, adsorbed, or encapsulated nanoparticles.15,22 Nevertheless, a detailed insight into the head group molecular interactions is needed to better understand the lipid SERS spectra of real biological systems, e.g., of the plasma membrane or as products of enzyme function in living cells,23,24 specifically when head groups are involved that lack the pronounced signals from a phospho/choline function that is known to strongly interact with gold nanostructures.15,25
The structure and interaction of ceramide in membranes are of great interest due to the wide range of functions taken by this molecule26−28 and its important role in sphingolipid metabolism.29,30 SERS can be used to elucidate the local lipid composition in living cells, e.g., upon enzyme inhibition or malfunction,24,31 but the interpretation of spectra from such complex systems requires reference data from suitable models.32−34 The normal Raman spectra of ceramide molecules with different head groups and acyl chains are well-known from work with different pure and complex samples.35−39 Moreover, the investigation on the properties and functions of ceramide in biophysical models and cells has been realized by X-ray diffraction, nuclear magnetic resonance spectroscopy, fluorescence spectroscopy, and differential scanning calorimetry.26,40−42 As an example, the probing of lipid phases and their transitions revealed profound differences from long- and short-chain ceramides, providing interesting insights on the ceramide–phospholipid interactions in membranes.42 The SERS spectrum of ceramide and the influence of ceramide on the SERS spectra of other components in artificial lipid mixtures are not known yet, but they are crucial to understand lipid SERS spectra from real biological environments such as living cells.
Here, we report the SERS spectra of lipid preparations with ceramide, the simplest sphingolipid, containing an amide-linked fatty acyl chain and a small polar head group. We have obtained data from liposomes of a ternary mixture of phosphatidylcholine (PC), phosphatidic acid (PA), and ceramide (CER), as well as liposomes of a PC/PA mixture and pure CER. As will be discussed, the spectra reveal the specific composition and structure of the liposomes and give a clear indication of an interaction of ceramide with the gold nanostructures. Moreover, the data indicate that the ceramide molecules undergo intermolecular interactions via their head groups and that such interactions are probed directly by SERS. Cryo-EM data support the interpretation of the SERS spectra from the lipid mixtures and reveal a range of nonliposomal structures formed by pure ceramide that are probed by SERS. The specific SERS spectra of the ceramide-containing models here will be useful for probing the molecule in more complex biological systems.
Materials and Methods
Preparation of Gold Nanoparticles
Gold(III) chloride hydrate and sodium citrate dihydrate were purchased from Sigma-Aldrich. All solutions were prepared using Milli-Q water. Gold nanoparticles were synthesized by the protocol described in ref (43). Absorbance spectra were acquired with a UV/vis/NIR spectrometer (Jasco, Tokyo, Japan) in the wavelength range of 300–1200 nm, and transmission electron microscopy was used to determine the size of the nanoparticles.
Preparation of Lipid–Nanoparticle Samples
l-α-Phosphatidic acid sodium salt (≥98%), l-α-phosphatidylcholine (≥99%), and C16-ceramide (shown as Figure 1) were purchased from Sigma-Aldrich. Three kinds of liposomes were prepared: (1) 80 mol % phosphatidylcholine and 20 mol % phosphatidic acid, (2) 100 mol % ceramide, and (3) 80 mol % phosphatidylcholine, 10 mol % ceramide, and 10 mol % phosphatidic acid. They are referred to as PA/PC, CER and PA/PC/CER, respectively.
Figure 1.
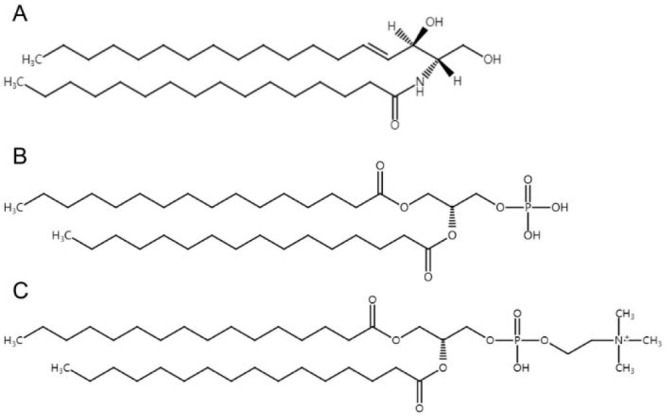
Molecular structures of (A) ceramide, (B) phosphatidic acid, and (C) phosphatidylcholine used in the liposome preparations.
The liposome–nanoparticle composites are prepared by the thin layer hydration method as described previously.15 Briefly, a single lipid or several lipids are dissolved in a 1:1 (v:v) mixture of methanol and chloroform in a total concentration of 2 mM. After evaporation of the solvents under a nitrogen stream, the dry lipid film is rehydrated by the citrate-stabilized gold nanoparticle solution, allowing liposomes to form. The solution is frozen in liquid nitrogen and thawed at 37 °C several times. The lipid–nanoparticle suspensions are then extruded through a polycarbonate membrane with a pore size of 200 nm.
SERS Experiments
The Raman spectra were excited by a 785 nm diode laser (Toptica, Munich, Germany) using an intensity of 3.5 × 10⁵ W cm–2 yielded when focusing the excitation light with a 60× water immersion objective into a droplet of liposome suspension. Raman light was directed to a single-stage spectrograph equipped with a liquid-nitrogen-cooled CCD detector (Horiba, Munich, Germany). The spectral resolution is ∼2 cm–1 considering the full spectral range of 300–1900 cm–1. From each sample, a series of 300 spectra was collected using an acquisition time of 1 s per spectrum. The spectra were frequency-calibrated using a spectrum of a toluene–acetonitrile mixture (1:1).
Preprocessing of the spectra comprised removal of spikes, background correction using asymmetric least-squares (AsLS) algorithm,44 and vector-normalization in MatLab R2020b (The MathWorks, Inc.). After removal of spectra with no signal, there were 98, 136, and 174 spectra remaining for the PA/PC/CER, PA/PC, and CER samples, respectively. The remaining 98 spectra of PA/PC/CER in a range of 500–1700 cm–1 were subjected to hierarchical cluster analysis (HCA) using SPSS 20 software (IBM Corporation, Armonk, NY). Band occurrences in all individual spectra were analyzed using a script in Mathematica 12.1 (Wolfram) as detailed in ref (45). Average spectra of each HCA class were calculated for further qualitative analysis of SERS signals.
Cryoelectron Microscopy of Liposome–Nanoparticle Composites
Cryogenic electron microscopy (cryo-EM) was carried out on a JEOL JEM-2100 transmission electron microscope (JEOL GmbH, Eching, Germany). Cryo-EM specimens were prepared as follows: a 4 μL drop of liposome–nanoparticles suspension was deposited on a lacey carbon-coated copper TEM grid (Electron Microscopy Sciences, Hatfield, PA) and then plunge-frozen in liquid ethane with a Vitrobot Mark IV (FEI, Eindhoven, The Netherlands) (conditions: 4 °C and 95% humidity). The vitrified grids were either directly transferred to the microscope cryotransfer holder (Gatan, Munich, Germany) or stored in liquid nitrogen. Imaging was carried out at temperatures around 90 K. The TEM was operated at an acceleration voltage of 200 kV, and a defocus of the objective lens of about 0.5–1 μm was used to increase the contrast. Cryo-EM micrographs were recorded at a number of magnifications with a bottom-mounted 4k CMOS camera (TemCam-F416, TVIPS, Gauting, Germany). The total electron dose in each micrograph was kept below 20 e–/Å2.
Results and Discussion
SERS Spectra of Liposomes of Different Composition
Liposomes consisting of a mixture of phosphatidic acid and phosphatidylcholine (PA/PC), pure ceramide (CER), and a ternary mixture of the three lipids (PA/PC/CER), respectively, were prepared in the presence of gold nanoparticles by thin layer hydration,15 and SERS spectra were acquired from the three samples using an excitation wavelength of 785 nm. Under the chosen excitation conditions, it was not possible to obtain normal Raman signals of the liposomes that are freely diffusing in the focal volume. Figure 1 shows the chemical structures of the three molecules. Figure 2 shows representative SERS spectra of PA/PC, CER, and PA/PC/CER liposomes, which were picked from the individual spectra of each sample and included as many bands as possible to illustrate enormous spectral information. Tentative assignment of the vibrational bands is provided in Table 1. Assignment of the prominent bands shows that the spectra probe the lipid head groups and the acyl chains, in agreement with SERS data on liposomes of very different composition and obtained at different excitation wavelength.15 On the basis of the SERS spectra, the interaction of the lipid head groups and the gold nanoparticles, as well as the conformational order and the lateral packing of the acyl chains in the lipid molecules can be discussed.
Figure 2.
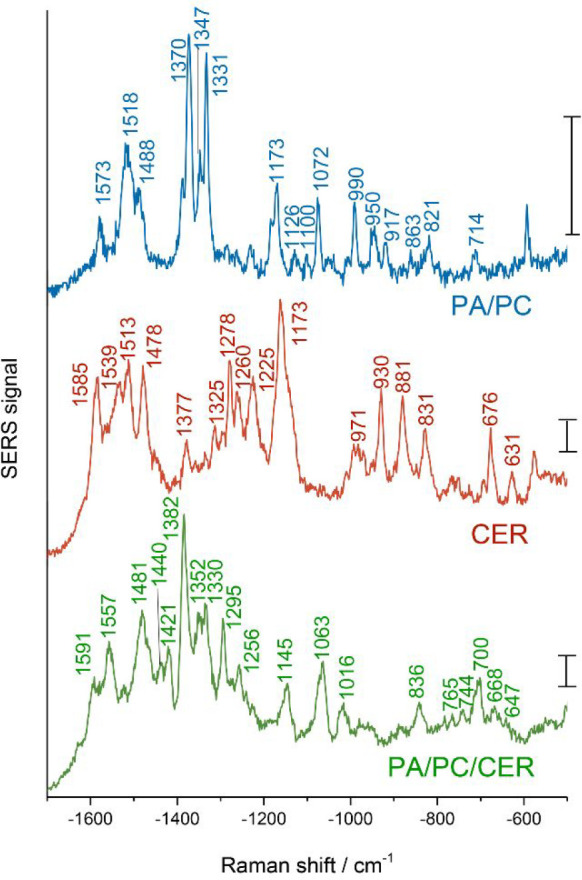
Representative SERS spectra of gold nanoparticles (cAuNP = 6 × 10⁻¹⁰ M) and liposomes composed of PA/PC, CER, and PA/PC/CER: total lipid concentration, 2 mM; excitation wavelength, 785 nm; intensity, 3.5 × 10⁵ W cm–2; acquisition time, 1 s; scale bars, 20 cps.
Table 1. Raman Shifts and Band Assignments of the SERS Spectra of Liposomes Containing Phosphatidylcholine, Phosphatidic Acid, and/or Ceramidea.
| Raman shift, cm-1 | assignment | ref |
|---|---|---|
| ∼1575 | C–N symmetric stretch of choline group, C–C stretch | (23, 24) |
| 1540–1550* | N–H in-plane bend and C–N stretch of amide II | (39, 49, 50) |
| 1481 | CH2 scissor | (49, 57) |
| 1459 | CH2 bend | (46) |
| 1445 | CH2 scissor | (46, 56) |
| 1421 | CH2 scissor | (37, 57) |
| 1378 | CH3 symmetric bend | (49) |
| 1370 | CH2 wag | (50) |
| ∼1350 | N+(CH3)3 asymmetric stretch of choline group | (48) |
| 1325 | CH3/CH2 deformation | (23, 24) |
| 1293 | CH2 twist | (17, 37, 46, 50, 56) |
| ∼1270* | CN stretch and NH deformation of amide III (α-helix like) | (39,55) |
| 1260 | C=C–H out-of-plane bend | (21, 37, 50) |
| 1220* | CH2 deformation and CN stretch of amide III (disordered) | (39, 55) |
| 1183 | Ester linking group | (14, 23) |
| 1175 | CH2 rock | (35) |
| ∼1130 | C–C symmetric stretch, all-trans chain conformation | (14, 37,46, 50,54, 55) |
| ∼1090 | C–C symmetric stretch, gauche chain conformation | (14, 37,46, 50,54, 55) |
| ∼1070 | C–C asymmetric stretch, all-trans chain conformation | (14,37,46,50,54,55) |
| 1027 | P–O–C stretch and P–OH stretch | (46, 47) |
| 990 | PO32– symmetric stretch | (47) |
| 970 | C=C–H in-plane bend | (21, 37, 50) |
| 960 | C–N asymmetric stretch of amide or choline group | (23,50) |
| 890 | CH3 rock, trans–trans chain-end conformation | (37, 46) |
| 870 | CH3 rock, gauche–trans chain-end conformation | (37, 46) |
| 860 | PO2 asymmetric stretch | (38, 48) |
| 845 | CH3 rock, trans–gauche chain-end conformation | (37) |
| 827 | PO2 diester asymmetric stretch | (47) |
| 777 | O–P–O asymmetric stretch | (48, 58) |
| 753 | PO2 diester symmetric stretch | (47) |
| 700–720 | C–N symmetric stretch of choline group | (47, 59) |
| 671* | O=CN deformation of amide IV | (35, 39) |
| 647 | Phosphate group | (47) |
| 632* | C–N deformation of secondary amide group | (54) |
Signals characteristic of ceramide are labeled by an asterisk.
The inclusion of phosphatidic acid in liposomes induces negative charge, which has previously been discussed to influence the interaction of gold nanoparticles with the lipid structures.15,24 The PA/PC and PA/PC/CER liposomes, both containing phosphatidylcholine and phosphatidic acid, display the spectral pattern characteristic of phosphate and choline head groups that interact with nanoparticles here. The vibrational modes of the phosphate groups of the PA/PC liposomes arise at 990 and 647 cm–1, together with a strong signal of the ester linking group at 1173 cm–1 (Figure 2, blue spectrum). The PA/PC/CER liposome spectra (Figure 2, green spectrum) exhibit a combination of the P–O–C and P–OH stretching modes at 1016 cm–1, as well as signals of the PO2 diester asymmetric and symmetric stretching vibrations at 836 and 744 cm–1, respectively.14,24,46,47 Moreover, several spectral features attributed to the choline group are observed for the two PC containing liposome samples. Specifically, the bands assigned to the N+(CH3)3 symmetric and asymmetric stretching are visible at ∼1575, ∼1350, and ∼700 cm–1, respectively,15,23,47,48 in both preparations (Figure 2, blue and green spectra).
In the SERS spectra of the lipid preparations containing ceramide, CER, and PA/PC/CER (Figure 2, red and green spectra), various bands are revealed that can be attributed to the amide specific to the ceramide and that are absent from the spectra of the PA/PC sample. The bands around 1540 cm–1 are assigned to an N–H in-plane bending and a C–N stretching mode that compose the amide II band, while the vibrational mode at around 672 cm–1 can be attributed to the amide IV mode.35,39,49,50 The CER spectra (Figure 2, red spectrum) also show signals at 1278 and 1225 cm–1, C–N stretching, and N–H deformation, indicating interactions of the sphingosine heads with one another that resemble those typically found for polypeptides with dihedral angles characteristic of all different kinds of secondary structures including both α-helix and β-sheet structure, respectively.39,51−53 In the spectra of the PA/PC/CER liposomes (Figure 2, green spectrum), the strong 1225 cm–1 signal is absent, suggesting a different intermolecular interaction and orientation with respect to the gold nanoparticle of the sphingosine heads than in the pure CER preparations. With the indication that the amide group in ceramide is in proximity to the gold nanoparticles, this sphingolipid differs from sphingomyelin, where no SERS signals from sphingosine were found.15 Instead, the presence of choline group signals in the spectra of pure sphingomyelin liposomes suggested the close proximity of the head group with gold nanostructures via the choline part of the head group.15
The pronounced signals from sphingosine support the observation made for the phosphate and choline signals, that the PA/PC/CER liposomes interact with the gold nanostructures via the lipid head groups. This is consistent with our earlier reports on data obtained with liposomes of different composition.15,23 On the basis of the differences between the binary mixture of PA/PC and the ternary mixture containing PA/PC/CER, we conclude that the presence of ceramide alters the interaction of the phosphate heads with the nanoparticles but that the interaction with the choline is less affected.
The three samples of different composition also show different conformational order and lateral packing of the acyl chains. In the samples containing the phospholipids (Figure 2, blue and green spectra), the vibrational band assigned to the C–C asymmetric stretching mode appears at 1072 cm–1 in the PA/PC and at 1063 cm–1 in the PA/PC/CER sample and indicates a predominately trans-conformation of the lipid chains. In agreement with this, both spectra also show a band assigned to the corresponding symmetric mode of the all-trans conformation of the intrachain acyl backbone at 1126 and 1145 cm–1, respectively.14,37,50,54,55 A sharp peak at 1295 cm–1 in the spectrum of the PA/PC/CER liposomes is assigned to a twisting mode of CH2 groups, specifically reflecting the presence of predominately trans conformers of the oriented hydrocarbon chains.17,37,50 In contrast, the spectra of the CER preparations show bands at frequencies of the CH3 rocking mode that are characteristic of a gauche–trans and/or trans–trans conformation, indicated by the signal at 881 cm–1, and a trans–gauche conformation, represented by the shifted band at 831 cm–1, all indicating a higher degree of disorder at the ends of the lipid chains.37,50 The deformation modes of the CH2 groups of the lipid chains, found in the spectral region of 1420–1480 cm–1, can be related to the lateral packing between lipid molecules.37,46,49,56 Evidenced by pronounced signals at 1421 and 1481 cm–1, the PA/PC/CER liposomes display a supramolecular structure of orthorhombically packed hydrocarbon chains (Figure 2, green spectrum).57 Differently, the band at 1421 cm–1 is not seen in the spectra of the PA/PC and CER samples, indicating a hexagonal-like packing of the chains.37 In the CER liposomes, different ordering of the lipid tails is also indicated by the vibrations involving the double bonds in the alkyl chains, specifically out-of-plane and in-plane C=C–H bending modes at 970 cm–1 and at 1260 cm–1, respectively.21,37,50 The variation observed in lipid chain conformation indicates that the profound differences must come from the different composition of the lipid–nanoparticle preparations.
Different Interaction of the Sphingosine Head Groups in Ceramide
Due to the localized probing by SERS and the varying interactions in the different lipid samples, particularly the different head groups, it is of interest to disentangle the types of contact between the lipids with the gold nanoparticles in the lipid mixture in the presence of ceramide. To assess the heterogeneity of the data from the PA/PC/CER liposomes, where individual spectra show that interactions of the head groups as well as the organization of the lipid tails vary from that in other two samples, all spectra with SERS signals were analyzed. As a multivariate statistical tool that can be applied in a nonsupervised fashion, a hierarchical cluster analysis (HCA) is ideal to obtain groups of spectra based on their dissimilarity/similarity. In an HCA of the PA/PC/CER data set, four different groups of SERS spectra are identified, denoted as C1, C2, C3, and C4 in Figure 3. The average spectra of the four classes (Figure 3A) display quite distinct spectral patterns and combinations of predominant contributions by the different parts of the molecules. To take into account all interactions between the lipids and the gold nanoparticles, the occurrence of specific bands in the data sets was quantified by analyzing each individual spectrum in the different groups, independent of variations in absolute and relative signal intensities that are typical of SERS data (Figure 3B).
Figure 3.

After a hierarchical cluster analysis of the PA/PC/CER liposome data set consisting of 98 spectra, (A) average spectra of four spectral classes are obtained and (B) relative band occurrences of the individual spectra of the four classes C1, C2, C3, and C4 were determined. Liposome composition: 10 mol % CER, 10 mol % PA, and 80 mol % PC. Total lipid concentration: 2 mM. Excitation wavelength: 785 nm. Intensity: 3.5 × 10⁵ W cm–2. Acquisition time: 1 s.
In most spectra, the signals assigned to the different vibrations of the head groups of PC and PA are scarce, with a few exceptions. The spectra of a class termed C2 here (Figure 3B), comprising 12% of the whole data set, show in a greater number obvious bands of the polar heads at 753 cm–1, assigned to the PO2 diester symmetric stretching mode and the 1183 cm–1 O=C–O–C ester linking.14,23,47 Only some of the spectra in each class contain bands assigned to different vibrational modes of the phosphate moieties of PC and PA, namely, the P–O–C and P–OH stretching modes at 1027 cm–1 in the two classes termed C2 and C4 here, the symmetric stretching of PO32– at 998 cm–1 in C1 and C4, the PO2 asymmetric stretch at 827 cm–1 in classes C3 and C4, and the O–P–O asymmetric stretching at 777 cm–1 in very few spectra of classes C3 and C4.37,47,48,58
In contrast, the typical vibrations of the PC choline display in many spectra from all classes, with the N+(CH3)3 asymmetric stretching mode around 1575 cm–1, albeit with a lower occurrence in class C2. Also the signals around 960 cm–1 in many spectra of C1, C3, and C4 (Figure 3, black, green, and red plots) can be related to choline, although here also a contribution from amide of CER is possible. Class C2, where fewer spectra show a contribution by the N+(CH3)3 asymmetric stretching vibration of the choline group, contains many spectra with strong bands at 701 cm–1 (Figure 3B, blue plot), also indicated by the prominent signal in the average spectrum (Figure 3A, blue spectrum). We assign this band to a C–N stretching vibration that can occur across a broad frequency range.59 This suggests the proximity of choline group backbones that are in gauche conformation47,59 and leads to the conclusion that different interactions by choline can occur that are distinguished here.
Nearly all spectra show contributions from the ceramide units, specifically the pronounced amide II bands that are visible in the average spectra of all classes (Figure 3A) and that have maxima at different positions in the different groups of spectra, with many spectra in classes C1 and C2 displaying a band at 1555 cm–1, while those in the other two classes mostly show a signal at 1544 cm–1 (Figure 3B). The observation of more spectra that show lower frequencies in classes C3 and C4 indicates that the amide N–H is involved in weaker H-bonds37 than in those molecules represented by the spectral classes C1 and C2. Structural differences in ceramide molecular interactions have been reported in infrared spectra.37 Here, the amide II vibrational modes become pronounced in our Raman data, due to altered selection rules in the close proximity of the surface.
In agreement with probing of different interactions of the sphingosine head of the ceramide molecules, also the amide III signal shows differences, in class C1 with two components, at 1262 cm–1 and at 1220 cm–1, indicating intermolecular interactions of the sphingosine heads that resemble the conformation/interaction of amide bonds in peptide structures with both α-helix content and some unordered and β-sheet structure.39,55 As discussed above, also the spectra of pure CER preparations show this feature (cf. Figure 2, red spectrum). In contrast, the spectra of classes C3 and C4 lack the low-frequency component and show amide III signals at 1262 and 1254 cm–1 (Figure 3, green and red traces), respectively, giving evidence of the different interactions of the amide group that are probed here. This higher-frequency amide III component, involving the N–H deformation,60 is in agreement with a weaker H-bonding as indicated by the lower amide II frequency found in this type of spectrum as well. The spectra of the classes C3 and C4 also show a pronounced contribution from the amide IV mode at 677 cm–1 (Figure 3, green and red traces).39,58 The spectra of class C2 contain very little information on the amide III and amide IV modes. Instead, the C–N deformation of a secondary amide at 632 cm–1 dominates these spectra (Figure 3, blue traces).54 It is weaker in the spectra of class C1 (Figure 3, black traces). The spectra of the functional groups of the sphingosine heads in ceramide indicate that very diverse interactions take place with the gold nanoparticles, as well as between ceramide molecules and the other constituents of the liposomes.
In the C–C skeletal stretching region of the lipid chains, all average spectra (Figure 3B) display pronounced signals at 1148 cm–1 and ∼1070 cm–1 discussed above, which indicates a trans conformation of the lipid chains, independent of the different interactions of the head groups discussed above. Nevertheless, compared with the other classes, many spectra in C2 show a lower degree of order, as inferred from a stronger C–C asymmetric all-trans stretching band at 1061 cm–1 in the average spectra (Figure 3A).14,37,46,50,54,55 Moreover, a higher content of oriented chains is observed from the sharp band at ∼1293 cm–1 in the average spectrum of class C4 and from the high occurrence of spectra showing such a band (Figure 3, blue traces), indicating more conformational disorder.17,37,50 The types of spectra vary with respect to the bands that indicate chain-end conformation. The spectra in classes C1 and C3 mainly present trans–gauche and gauche–trans chain-end conformers with signals at 850 and 867 cm–1, respectively(Figure 3B), while features of gauche–trans and trans–gauche chain-end conformation co-occur in classes C2 and C4 indicated by signals at 870 and 845 cm–1 (Figure 3, blue traces).37,46 Despite similar intrachain conformation, the chain-end and intramolecule disorganization varies among the four classes.
Cryoelectron Microscopy Shows Liposomes and Nonliposomal Aggregations
Cryo-EM micrographs were used to visualize the lipid structures that were generated upon thin layer hydration of the different lipids using the aqueous solution of gold nanoparticles. Figure 4 shows typical bilayer liposomes that are obtained from all three preparations that were obtained in the presence of gold nanoparticles. The PA/PC, CER, and also the PA/PC/CER liposome formed unilamellar, multilamellar, and multivesicular vesicles of various sizes not exceeding the pore size of the membrane that was used during extrusion. The amount of multivesicular and multilamellar inclusions varied slightly in the different samples. This is in agreement with cryo-EM results that we obtained for gold–nanoparticle liposome preparations of other lipid composition.15 In previous work, we had observed the formation of scrambled lipid accumulations in the preparation of liposomes of ternary mixtures of phosphatidylcholine, sphingomyelin, and cholesterol and ascribed the formation of these agglomerates to additional negative charge that was present in the form of excess citrate during certain preparation protocols.15 Later, we found signals in SERS data of liposomes that contained phosphatidic acid, in addition to sphingomyelin, cholesterol, and phosphatidylcholine that resembled those obtained for the same samples prepared in the presence of excess citrate.22 As indicated by the formation of intact bilayer structures here (Figure 4A,C and Supporting Information Figure S2), the negative charge introduced by phosphatidic acid in the PA/PC and the PA/PC/CER mixtures does not interfere with liposome formation, suggesting that our previous observation of “lipid scrambling” was probably related to the particular lipid composition of these samples.15,22
Figure 4.
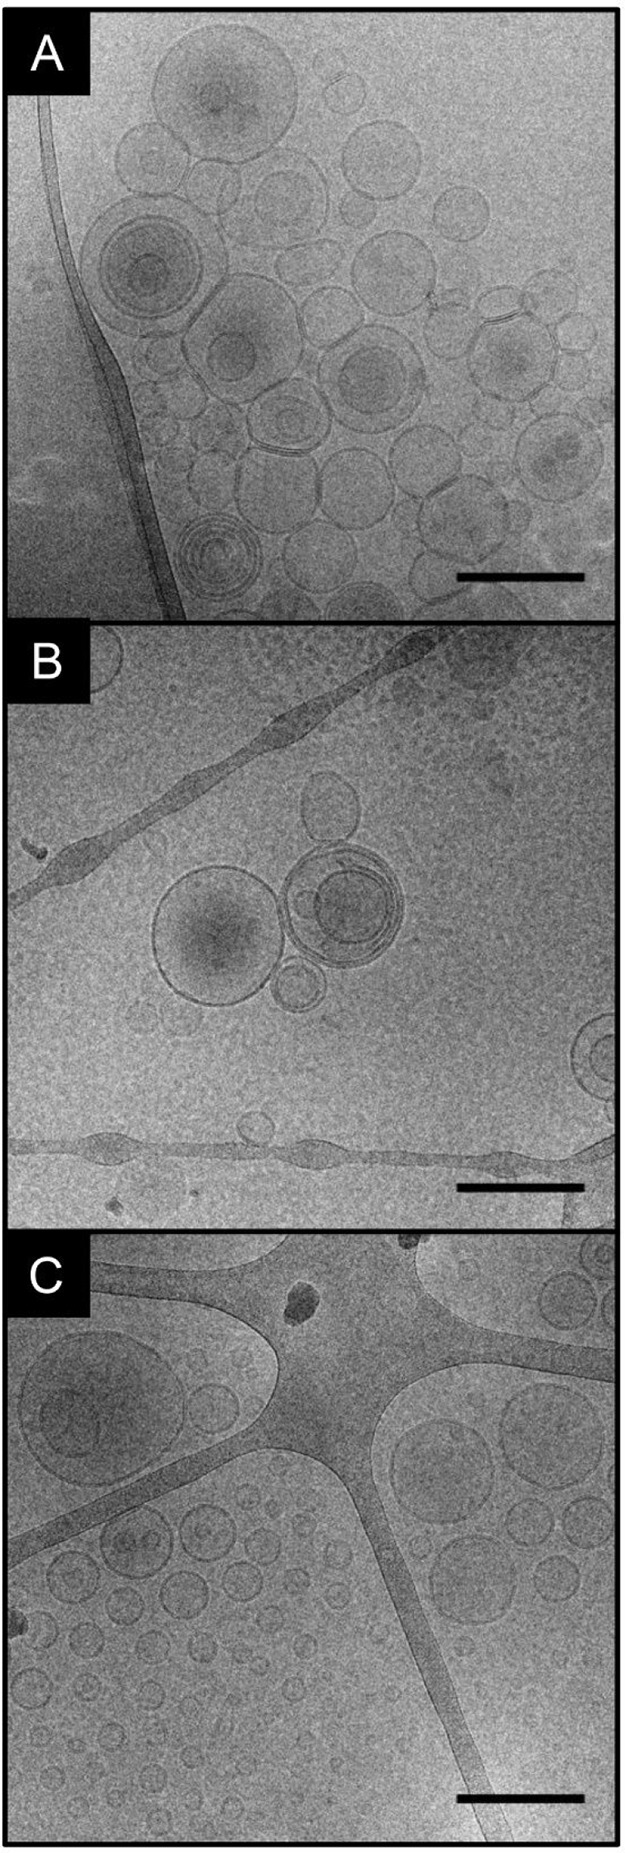
Cryo-EM micrographs of liposomes composed of (A) PA/PC/CER, (B) CER, and (C) PA/PC prepared with AuNPs. Total lipid concentration: 2 mM. Scale bars: 200 nm.
The pure ceramide samples formed the spherical vesicles displayed in Figure 4B and Figure 5A but in addition a large variety of supramolecular structures (Figure 5B–D). Figure 5B displays concentric, stacked lamellar structures overlapping one another. Stacking of the liposome layers appears to progress toward a very dense packing, revealing compact, condensed lamellae that appear as short black lines (Figure 5C). Comparing the former two types of dense structure (Figure 5B,C), they vary regarding lamellar spacing and curvature. It should be noted that the majority of gold nanoparticles was found to interact with ceramide in nonliposomal aggregations. The structure of another type of lipid aggregate (Figure 5D) differed from the other two in its greater tendency to suffer damage by the electron beam (see Supporting Information Figure S3 for an example). The observation that many gold nanoparticles of the pure ceramide sample were contained in nonliposomal accumulations leads us to the conclusion that most SERS spectra obtained from this sample must represent such accumulations. Densely packed structures as those found in Figure 5B,C can possibly enable the molecule–molecule interaction of sphingosine heads that is suggested by the amide signals in the spectra, and the nonliposomal accumulation is in agreement with a greater disorder discussed for the lipid tails in the CER sample (Figure 2, red spectrum).
Figure 5.
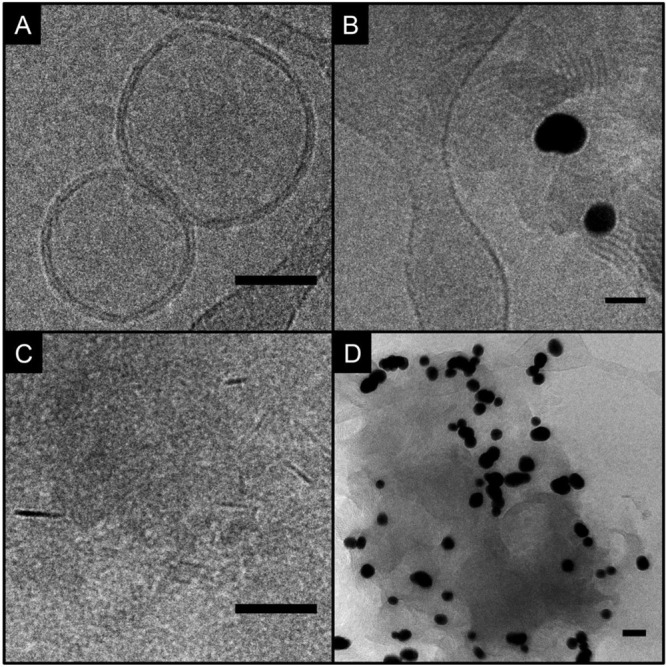
Cryo-EM micrographs of ceramide preparation: (A) intact liposomes, (B) concentric, stacked lamellar structures, (C) compact, condensed lamellae, and (D) lipid aggregate with many AuNPs. Total lipid concentration: 2 mM. Scale bars: 50 nm.
Conclusions
The SERS spectra of liposomes composed of ceramide, phosphatidic acid, and phosphatidylcholine indicate an interaction of the lipids with gold nanoparticles via sphingosine, phosphate, and choline head groups. The data corroborate earlier observations made with SERS for liposomes of different composition,15 for sphingomyelin accumulations in cells,24 and for the outer cell membrane23 that gold nanostructures interact with the polar head of the membrane lipids. On the basis of fewer characteristic signals that were found, the interaction of the phosphate head groups with the nanoparticles must be weaker than that of the choline and sphingosine groups. A detailed analysis of liposomes formed by the ternary mixture of all three lipids and a comparison of the data obtained with a preparation of gold nanoparticles with pure ceramide revealed that ceramide is clearly identified by the vibrational features of its sphingosine head group. Several bands were assigned to the amide function and revealed molecule–molecule interactions of the ceramide head. The direct observation of interactions of the sphingosine head group had not been made in gold nanoparticle–liposome preparations with sphingomyelin,15 due to the strong interaction of the phosphocholine group that is present in this molecule.25
As shown by cryo-EM, intact bilayer liposomes were formed in the preparation of PA/PC, pure CER, and PA/PC/CER regardless of the additional negative charge introduced by phosphatidic acid and its potential influence on membrane curvature.61 The pure ceramide samples displayed a large variety of concentric stacked and densely packed lamellar structures. The predominant interaction of the gold nanoparticles with these structures suggests that the structural features revealed in the SERS spectra of pure ceramide, including distinct acyl chain conformation and lateral packing, must be characteristic of nonliposomal aggregations.
The SERS spectra of the PA/PC/CER liposomes are the result of a superposition of spectral features from sphingosine, choline, and phosphate head groups to different extent, together with characteristic signals that reveal interactions of the ceramide head groups, as well as of the lipid chains. The different spectral groups that were observed therefore represent the diverse types of interaction of the gold nanoparticles with the sphingosine heads but also their different intermolecular interactions. The ceramide specific spectra found in the liposomes from the ternary lipid mixtures illustrate that ceramide can be probed without labels also in complex environments. In particular, enzymes responsible for ceramide generation and degradation, such as acid sphingomyelinase (ASM), have gained increasing attention because of their involvement in many diseases.62−66 The label-free characterization of ceramide as enzyme product could therefore be applied to explore activities of enzymes related to the lipid metabolism in cells, as proven recently to be feasible, e.g., by the detection of ASM activity by SERS.24 The ability to characterize ceramide structure and interaction extends the capabilities of SERS for studies of lipids in biophysical and biological models.
Acknowledgments
The authors gratefully acknowledge the support from the Einstein Center of Catalysis/Berlin International School of Natural Sciences and Engineering (EC2/BIG-NSE) and Department of Chemistry, Humboldt-Universität zu Berlin. The authors also thank Jan Simke at the Center for Electron Microscopy (ZELMI), Technical University of Berlin for the TEM measurements and the Joint Lab for Structural Research at the Integrative Research Institute for the Sciences (IRIS Adlershof) for cryo-TEM measurements. We thank Dr. Sabrina Diehn and Dr. Gergo Peter Szekeres for support with software scripts and Dr. Vesna Živanović and Dr. Cecilia Spedalieri for fruitful discussions.
Supporting Information Available
The Supporting Information is available free of charge at https://pubs.acs.org/doi/10.1021/acs.jpcc.2c01930.
Absorbance spectrum and TEM micrograph of the gold nanoparticles (Figure S1), cryo-EM micrograph of intact PA/PC/CER liposomes in the presence of gold nanoparticles (Figure S2), and ceramide lipids/gold nanoparticle preparation (Figure S3) (PDF)
Author Contributions
The manuscript was written through contributions of all authors. All authors have given approval to the final version of the manuscript.
The authors declare no competing financial interest.
Special Issue
Published as part of The Journal of Physical Chemistry virtual special issue “Nanophotonics for Chemical Imaging and Spectroscopy”.
Supplementary Material
References
- Alipour E.; Halverson D.; McWhirter S.; Walker G. C. Phospholipid Bilayers: Stability and Encapsulation of Nanoparticles. Annu. Rev. Phys. Chem. 2017, 68, 261–283. 10.1146/annurev-physchem-040215-112634. [DOI] [PubMed] [Google Scholar]
- Allen T. M.; Cullis P. R. Liposomal Drug Delivery Systems: From Concept to Clinical Applications. Adv. Drug Delivery Rev. 2013, 65 (1), 36–48. 10.1016/j.addr.2012.09.037. [DOI] [PubMed] [Google Scholar]
- Lum W.; Bruzas I.; Gorunmez Z.; Unser S.; Beck T.; Sagle L. Novel Liposome-Based Surface-Enhanced Raman Spectroscopy (SERS) Substrate. J. Phys. Chem. Lett. 2017, 8 (12), 2639–2646. 10.1021/acs.jpclett.7b00694. [DOI] [PubMed] [Google Scholar]
- Michel R.; Plostica T.; Abezgauz L.; Danino D.; Gradzielski M. Control of the Stability and Structure of Liposomes by Means of Nanoparticles. Soft Matter 2013, 9 (16), 4167–4177. 10.1039/c3sm27875a. [DOI] [Google Scholar]
- Zhang L.; Tong H.; Garewal M.; Ren G. Optimized Negative-Staining Electron Microscopy for Lipoprotein Studies. Biochim. Biophys. Acta 2013, 1830 (1), 2150–2159. 10.1016/j.bbagen.2012.09.016. [DOI] [PMC free article] [PubMed] [Google Scholar]
- Ginzburg V. V.; Balijepalli S. Modeling the Thermodynamics of the Interaction of Nanoparticles with Cell Membranes. Nano Lett. 2007, 7 (12), 3716–3722. 10.1021/nl072053l. [DOI] [PubMed] [Google Scholar]
- Salassi S.; Simonelli F.; Bochicchio D.; Ferrando R.; Rossi G. Au Nanoparticles in Lipid Bilayers: A Comparison between Atomistic and Coarse-Grained Models. J. Phys. Chem. C 2017, 121 (20), 10927–10935. 10.1021/acs.jpcc.6b12148. [DOI] [Google Scholar]
- Burgess S.; Vishnyakov A.; Tsovko C.; Neimark A. V. Nanoparticle Engendered Rupture of Lipid Membranes. J. Phys. Chem. Lett. 2018, 9 (17), 4872–4877. 10.1021/acs.jpclett.8b01696. [DOI] [PubMed] [Google Scholar]
- Wang F.; Liu J. Self-Healable and Reversible Liposome Leakage by Citrate-Capped Gold Nanoparticles: Probing the Initial Adsorption/Desorption Induced Lipid Phase Transition. Nanoscale 2015, 7 (38), 15599–15604. 10.1039/C5NR04805B. [DOI] [PubMed] [Google Scholar]
- Park J.-W.; Shumaker-Parry J. S. Structural Study of Citrate Layers on Gold Nanoparticles: Role of Intermolecular Interactions in Stabilizing Nanoparticles. J. Am. Chem. Soc. 2014, 136 (5), 1907–1921. 10.1021/ja4097384. [DOI] [PubMed] [Google Scholar]
- Li Y.; Yuan H.; von dem Bussche A.; Creighton M.; Hurt R. H.; Kane A. B.; Gao H. Graphene Microsheets Enter Cells Through Spontaneous Membrane Penetration at Edge Asperities and Corner Sites. Proc. Natl. Acad. Sci. U. S. A. 2013, 110 (30), 12295–12300. 10.1073/pnas.1222276110. [DOI] [PMC free article] [PubMed] [Google Scholar]
- Franken L. E.; Boekema E. J.; Stuart M. C. Transmission Electron Microscopy as a Tool for the Characterization of Soft Materials: Application and Interpretation. Adv. Sci. 2017, 4 (5), 1600476. 10.1002/advs.201600476. [DOI] [PMC free article] [PubMed] [Google Scholar]
- Kundu J.; Levin C. S.; Halas N. J. Real-Time Monitoring of Lipid Transfer Between Vesicles and Hybrid Bilayers on Au Nanoshells Using Surface Enhanced Raman Scattering (SERS). Nanoscale 2009, 1 (1), 114–117. 10.1039/b9nr00063a. [DOI] [PubMed] [Google Scholar]
- Taylor R. W.; Benz F.; Sigle D. O.; Bowman R. W.; Bao P.; Roth J. S.; Heath G. R.; Evans S. D.; Baumberg J. J. Watching Individual Molecules Flex within Lipid Membranes Using SERS. Sci. Rep. 2015, 4 (1), 5940. 10.1038/srep05940. [DOI] [PMC free article] [PubMed] [Google Scholar]
- Živanović V.; Kochovski Z.; Arenz C.; Lu Y.; Kneipp J. SERS and Cryo-EM Directly Reveal Different Liposome Structures during Interaction with Gold Nanoparticles. J. Phys. Chem. Lett. 2018, 9 (23), 6767–6772. 10.1021/acs.jpclett.8b03191. [DOI] [PubMed] [Google Scholar]
- Ando J.; Kinoshita M.; Cui J.; Yamakoshi H.; Dodo K.; Fujita K.; Murata M.; Sodeoka M. Sphingomyelin Distribution in Lipid Rafts of Artificial Monolayer Membranes Visualized by Raman Microscopy. Proc. Natl. Acad. Sci. U. S. A. 2015, 112 (15), 4558–4563. 10.1073/pnas.1418088112. [DOI] [PMC free article] [PubMed] [Google Scholar]
- Gaber B. P.; Yager P.; Peticolas W. L. Interpretation of Biomembrane Structure by Raman Difference Spectroscopy: Nature of the Endothermic Transitions in Phosphatidylcholines. Biophys. J. 1978, 21 (2), 161–176. 10.1016/S0006-3495(78)85516-7. [DOI] [PMC free article] [PubMed] [Google Scholar]
- Lippert J. L.; Peticolas W. L. Laser Raman Investigation of the Effect of Cholesterol on Conformational Changes in Dipalmitoyl Lecithin Multilayers. Proc. Natl. Acad. Sci. U. S. A. 1971, 68 (7), 1572–1576. 10.1073/pnas.68.7.1572. [DOI] [PMC free article] [PubMed] [Google Scholar]
- Mendelsohn R.; Sunder S.; Bernstein H. Structural Studies of Biological Membranes and Related Model Systems by Raman Spectroscopy: Sphingomyelin and 1, 2-Dilauroyl Phosphatidylethanolamine. Biochim. Biophys. Acta 1975, 413 (3), 329–340. 10.1016/0005-2736(75)90119-4. [DOI] [PubMed] [Google Scholar]
- Fox C. B.; Uibel R. H.; Harris J. M. Detecting Phase Transitions Iin Phosphatidylcholine Vesicles by Raman Microscopy and Self-Modeling Curve Resolution. J. Phys. Chem. B 2007, 111 (39), 11428–11436. 10.1021/jp0735886. [DOI] [PubMed] [Google Scholar]
- Wu H.; Volponi J. V.; Oliver A. E.; Parikh A. N.; Simmons B. A.; Singh S. In Vivo Lipidomics Using Single-Cell Raman Spectroscopy. Proc. Natl. Acad. Sci. U. S. A. 2011, 108 (9), 3809–3814. 10.1073/pnas.1009043108. [DOI] [PMC free article] [PubMed] [Google Scholar]
- Živanović V.; Kneipp J. Nano-Bio Interactions as Characterized by SERS: The Interaction of Liposomes with Gold Nanostructures is Highly Dependent on Lipid Composition and Charge. Proc. SPIE 2019, 10894, 1089404. 10.1117/12.2508584. [DOI] [Google Scholar]
- Živanović V.; Milewska A.; Leosson K.; Kneipp J. Molecular Structure and Interactions of Lipids in the Outer Membrane of Living Cells Based on Surface-Enhanced Raman Scattering and Liposome Models. Anal. Chem. 2021, 93 (29), 10106–10113. 10.1021/acs.analchem.1c00964. [DOI] [PubMed] [Google Scholar]
- Živanović V.; Seifert S.; Drescher D.; Schrade P.; Werner S.; Guttmann P.; Szekeres G. P.; Bachmann S.; Schneider G.; Arenz C.; et al. Optical Nanosensing of Lipid Accumulation due to Enzyme Inhibition in Live Cells. ACS Nano 2019, 13 (8), 9363–9375. 10.1021/acsnano.9b04001. [DOI] [PubMed] [Google Scholar]
- Wang B.; Zhang L.; Bae S. C.; Granick S. Nanoparticle-Induced Surface Reconstruction of Phospholipid Membranes. Proc. Natl. Acad. Sci. U. S. A. 2008, 105 (47), 18171–18175. 10.1073/pnas.0807296105. [DOI] [PMC free article] [PubMed] [Google Scholar]
- Wartewig S.; Neubert R. H. H. Properties of Ceramides and Their Impact on the Stratum Corneum Structure: A Review. Skin Pharmacol. Physiol. 2007, 20 (5), 220–229. 10.1159/000104420. [DOI] [PubMed] [Google Scholar]
- Futerman A. H.; Hannun Y. A. The Complex Life of Simple Sphingolipids. EMBO Reports 2004, 5 (8), 777–782. 10.1038/sj.embor.7400208. [DOI] [PMC free article] [PubMed] [Google Scholar]
- Obeid L. M.; Linardic C. M.; Karolak L. A.; Hannun Y. A. Programmed Cell Death Induced by Ceramide. Science 1993, 259 (5102), 1769–1771. 10.1126/science.8456305. [DOI] [PubMed] [Google Scholar]
- Hannun Y. A.; Obeid L. M. The Ceramide-Centric Universe of Lipid-Mediated Cell Regulation: Stress Encounters of the Lipid Kind. J. Biol. Chem. 2002, 277 (29), 25847–25850. 10.1074/jbc.R200008200. [DOI] [PubMed] [Google Scholar]
- Arana L.; Gangoiti P.; Ouro A.; Trueba M.; Gómez-Muñoz A. Ceramide and Ceramide 1-Phosphate in Health and Disease. Lipids Health Dis. 2010, 9 (1), 15. 10.1186/1476-511X-9-15. [DOI] [PMC free article] [PubMed] [Google Scholar]
- Živanović V.; Semini G.; Laue M.; Drescher D.; Aebischer T.; Kneipp J. Chemical Mapping of Leishmania Infection in Live Cells by SERS Microscopy. Anal. Chem. 2018, 90 (13), 8154–8161. 10.1021/acs.analchem.8b01451. [DOI] [PubMed] [Google Scholar]
- Spedalieri C.; Kneipp J. Surface Enhanced Raman Scattering for Probing Cellular Biochemistry. Nanoscale 2022, 14 (14), 5314–5328. 10.1039/D2NR00449F. [DOI] [PMC free article] [PubMed] [Google Scholar]
- Faried M.; Suga K.; Okamoto Y.; Shameli K.; Miyake M.; Umakoshi H. Membrane Surface-Enhanced Raman Spectroscopy for Cholesterol-Modified Lipid Systems: Effect of Gold Nanoparticle Size. ACS Omega 2019, 4 (9), 13687–13695. 10.1021/acsomega.9b01073. [DOI] [PMC free article] [PubMed] [Google Scholar]
- Suga K.; Yoshida T.; Ishii H.; Okamoto Y.; Nagao D.; Konno M.; Umakoshi H. Membrane Surface-Enhanced Raman Spectroscopy for Sensitive Detection of Molecular Behavior of Lipid Assemblies. Anal. Chem. 2015, 87 (9), 4772–4780. 10.1021/ac5048532. [DOI] [PubMed] [Google Scholar]
- Wegener M.; Neubert R.; Rettig W.; Wartewig S. Structure of Stratum Corneum Lipids Characterized by FT-Raman Spectroscopy and DSC. I. Ceramides. Int. J. Pharm. 1996, 128 (1–2), 203–213. 10.1016/0378-5173(95)04309-8. [DOI] [Google Scholar]
- Wegener M.; Neubert R.; Rettig W.; Wartewig S. Structure of Stratum Corneum Lipids Characterized by FT-Raman Spectroscopy and DSC. III. Mixtures of Ceramides and Cholesterol. Chem. Phys. Lipids 1997, 88 (1), 73–82. 10.1016/S0009-3084(97)00050-9. [DOI] [PubMed] [Google Scholar]
- Tfayli A.; Guillard E.; Manfait M.; Baillet-Guffroy A. Thermal Dependence of Raman Descriptors of Ceramides. Part I: Effect of Double Bonds in Hydrocarbon Chains. Anal. Bioanal. Chem. 2010, 397 (3), 1281–1296. 10.1007/s00216-010-3614-y. [DOI] [PubMed] [Google Scholar]
- Krafft C.; Neudert L.; Simat T.; Salzer R. Near Infrared Raman Spectra of Human Brain Lipids. Spectrochim. Acta, Pt. A: Mol. Spectrosc. 2005, 61 (7), 1529–1535. 10.1016/j.saa.2004.11.017. [DOI] [PubMed] [Google Scholar]
- Barry B. W.; Edwards H. G. M.; Williams A. C. Fourier Transform Raman and Infrared Vibrational Study of Human Skin: Assignment of Spectral Bands. J. Raman Spectrosc. 1992, 23 (11), 641–645. 10.1002/jrs.1250231113. [DOI] [Google Scholar]
- Lipsky N. G.; Pagano R. E. Sphingolipid Metabolism in Cultured Fibroblasts: Microscopic and Biochemical Studies Employing a Fluorescent Ceramide Analogue. Proc. Natl. Acad. Sci. U. S. A. 1983, 80 (9), 2608–2612. 10.1073/pnas.80.9.2608. [DOI] [PMC free article] [PubMed] [Google Scholar]
- Li L.; Tang X.; Taylor K. G.; Dupré D. B.; Yappert M. C. Conformational Characterization of Ceramides by Nuclear Magnetic Resonance Spectroscopy. Biophys. J. 2002, 82 (4), 2067–2080. 10.1016/S0006-3495(02)75554-9. [DOI] [PMC free article] [PubMed] [Google Scholar]
- Sot J.; Aranda F. J.; Collado M.-I.; Goñi F. M.; Alonso A. Different Effects of Long- and Short-Chain Ceramides on the Gel-Fluid and Lamellar-Hexagonal Transitions of Phospholipids: A Calorimetric, NMR, and X-Ray Diffraction Study. Biophys. J. 2005, 88 (5), 3368–3380. 10.1529/biophysj.104.057851. [DOI] [PMC free article] [PubMed] [Google Scholar]
- Lee P.; Meisel D. Adsorption and Surface-Enhanced Raman of Dyes on Silver and Gold Sols. J. Phys. Chem. 1982, 86 (17), 3391–3395. 10.1021/j100214a025. [DOI] [Google Scholar]
- Eilers P. H. A perfect smoother. Anal. Chem. 2003, 75 (14), 3631–3636. 10.1021/ac034173t. [DOI] [PubMed] [Google Scholar]
- Szekeres G. P.; Werner S.; Guttmann P.; Spedalieri C.; Drescher D.; Živanović V.; Montes-Bayón M.; Bettmer J.; Kneipp J. Relating the Composition and Interface Interactions in the Hard Corona of Gold Nanoparticles to the Induced Response Mechanisms in Living Cells. Nanoscale 2020, 12 (33), 17450–17461. 10.1039/D0NR03581E. [DOI] [PubMed] [Google Scholar]
- Pemberton J. E.; Chamberlain J. R. Raman Spectroscopy of Model Membrane Monolayers of Dipalmitoylphosphatidic Acid at the Air–Water Interface Using Surface Enhancement from Buoyant Thin Silver Films. Biopolymers 2000, 57 (2), 103–116. . [DOI] [PubMed] [Google Scholar]
- Spiker R. C. Jr; Levin I. W. Raman Spectra and Vibrational Assignments for Dipalmitoyl Phosphatidylcholine and Structurally Related Molecules. Biochim. Biophys. Acta 1975, 388 (3), 361–373. 10.1016/0005-2760(75)90095-8. [DOI] [PubMed] [Google Scholar]
- Koyama Y.; Toda S.; Kyogoku Y. Raman Spectra and Conformation of the Glycerophosphorylcholine Headgroup. Chem. Phys. Lipids 1977, 19 (1), 74–92. 10.1016/0009-3084(77)90082-2. [DOI] [PubMed] [Google Scholar]
- Garidel P.; Folting B.; Schaller I.; Kerth A. The Microstructure of the Stratum Corneum Lipid Barrier: Mid-Infrared Spectroscopic Studies of Hydrated Ceramide:Palmitic Acid:Cholesterol Model Systems. Biophys. Chem. 2010, 150 (1–3), 144–156. 10.1016/j.bpc.2010.03.008. [DOI] [PubMed] [Google Scholar]
- Tfayli A.; Guillard E.; Manfait M.; Baillet-Guffroy A. Molecular Interactions of Penetration Enhancers within Ceramides Organization: A Raman Spectroscopy Approach. Analyst 2012, 137 (21), 5002–5010. 10.1039/c2an35220f. [DOI] [PubMed] [Google Scholar]
- Lippert J. L.; Tyminski D.; Desmeules P. J. Determination of the Secondary Structure of Proteins by Laser Raman Spectroscopy. J. Am. Chem. Soc. 1976, 98 (22), 7075–7080. 10.1021/ja00438a057. [DOI] [PubMed] [Google Scholar]
- Rygula A.; Majzner K.; Marzec K. M.; Kaczor A.; Pilarczyk M.; Baranska M. Raman Spectroscopy of Proteins: A Review. J. Raman Spectrosc. 2013, 44 (8), 1061–1076. 10.1002/jrs.4335. [DOI] [Google Scholar]
- Garcia-Leis A.; Sanchez-Cortes S. Label-Free Detection and Self-Aggregation of Amyloid β-Peptides Based on Plasmonic Effects Induced by Ag Nanoparticles: Implications in Alzheimer’s Disease Diagnosis. ACS Appl. Nano Mater. 2021, 4 (4), 3565–3575. 10.1021/acsanm.1c00093. [DOI] [Google Scholar]
- Lin-Vien D.; Colthup N. B.; Fateley W. G.; Grasselli J. G.. The Handbook of Infrared and Raman Characteristic Frequencies of Organic Molecules; Elsevier, 1991. [Google Scholar]
- Parker F. S.Applications of Infrared, Raman, and Resonance Raman Spectroscopy in Biochemistry; Springer Science & Business Media, 1983. [Google Scholar]
- Czamara K.; Majzner K.; Pacia M. Z.; Kochan K.; Kaczor A.; Baranska M. Raman Spectroscopy of Lipids: A Review. J. Raman Spectrosc. 2015, 46 (1), 4–20. 10.1002/jrs.4607. [DOI] [Google Scholar]
- O’Leary T. J.; Levin I. W. Raman Spectroscopic Study of an Interdigitated Lipid Bilayer. Dipalmitoylphosphatidylcholine Dispersed in Glycerol. Biochim. Biophys. Acta 1984, 776 (2), 185–189. 10.1016/0005-2736(84)90207-4. [DOI] [PubMed] [Google Scholar]
- Gaber B. P.; Peticolas W. L. On the Quantitative Interpretation of Biomembrane Structure by Raman Spectroscopy. Biochim. Biophys. Acta 1977, 465 (2), 260–274. 10.1016/0005-2736(77)90078-5. [DOI] [PubMed] [Google Scholar]
- Akutsu H. Direct Determination by Raman Scattering of the Conformation of the Choline Group in Phospholipid Bilayers. Biochemistry 1981, 20 (26), 7359–7366. 10.1021/bi00529a006. [DOI] [PubMed] [Google Scholar]
- Ford S. J.; Wen Z. Q.; Hecht L.; Barron L. D. Vibrational Raman Optical Activity of Alanyl Peptide Oligomers: A New Perspective on Aqueous Solution Conformation. Biopolymers 1994, 34 (3), 303–313. 10.1002/bip.360340302. [DOI] [Google Scholar]
- Kooijman E. E.; Chupin V.; de Kruijff B.; Burger K. N. J. Modulation of Membrane Curvature by Phosphatidic Acid and Lysophosphatidic Acid. Traffic 2003, 4 (3), 162–174. 10.1034/j.1600-0854.2003.00086.x. [DOI] [PubMed] [Google Scholar]
- Göggel R.; Winoto-Morbach S.; Vielhaber G.; Imai Y.; Lindner K.; Brade L.; Brade H.; Ehlers S.; Slutsky A. S.; Schütze S.; et al. PAF-Mediated Pulmonary Edema: A New Role for Acid Sphingomyelinase and Ceramide. Nat. Med. 2004, 10 (2), 155–160. 10.1038/nm977. [DOI] [PubMed] [Google Scholar]
- Park J. H.; Schuchman E. H. Acid Ceramidase and Human Disease. Biochim. Biophys. Acta 2006, 1758 (12), 2133–2138. 10.1016/j.bbamem.2006.08.019. [DOI] [PubMed] [Google Scholar]
- Kato Y.; Ozawa S.; Tsukuda M.; Kubota E.; Miyazaki K.; St-Pierre Y.; Hata R.-I. Acidic Extracellular pH Increases Calcium Influx-Triggered Phospholipase D Activity Along With Acidic Sphingomyelinase Activation to Induce Matrix Metalloproteinase-9 Expression in Mouse Metastatic Melanoma. FEBS J. 2007, 274 (12), 3171–3183. 10.1111/j.1742-4658.2007.05848.x. [DOI] [PubMed] [Google Scholar]
- Kornhuber J.; Rhein C.; Müller C. P.; Mühle C. Secretory Sphingomyelinase in Health and Disease. Biol. Chem. 2015, 396 (6–7), 707–736. 10.1515/hsz-2015-0109. [DOI] [PubMed] [Google Scholar]
- Kappe C.; Mohamed Z. H.; Naser E.; Carpinteiro A.; Arenz C. A Novel Visible Range FRET Probe for Monitoring Acid Sphingomyelinase Activity in Living Cells. Chem.—Eur. J. 2020, 26 (26), 5780–5783. 10.1002/chem.202000133. [DOI] [PMC free article] [PubMed] [Google Scholar]
Associated Data
This section collects any data citations, data availability statements, or supplementary materials included in this article.