

Abstract
Severe acute respiratory syndrome coronavirus-2 (SARS-CoV-2), which causes COVID-19, utilizes angiotensin-converting enzyme 2 (ACE2) for entry into target cells. ACE2 has been proposed as an interferon-stimulated gene (ISG). Thus, interferon-induced variability in ACE2 expression levels could be important for susceptibility to COVID-19 or its outcomes. Here, we report the discovery of a novel, transcriptionally-independent truncated isoform of ACE2, which we designate as deltaACE2 (dACE2). We demonstrate that dACE2, but not ACE2, is an ISG. In The Cancer Genome Atlas (TCGA), the expression of dACE2 was enriched in squamous tumors of the respiratory, gastrointestinal, and urogenital tracts. In vitro, dACE2, which lacks 356 N-terminal amino acids, was non-functional in binding the SARS-CoV-2 spike protein and as a carboxypeptidase. Our results suggest that the ISG-type induction of dACE2 in IFN-high conditions created by treatments, inflammatory tumor microenvironment, or viral co-infections is unlikely to increase the cellular entry of SARS-CoV-2 and promote infection.
Cells expressing ACE2 are potential targets of SARS-CoV-2 infection1,2. Studies based on single-cell RNA-sequencing (scRNA-seq) of lung cells have identified type II pneumocytes, ciliated cells, and transient secretory cells as the main types of ACE2-expressing cells3,4. Furthermore, ACE2 was proposed to be an ISG, based on its inducible expression in cells treated with interferons (IFNs) or infected by viruses that induce IFN responses, such as influenza4,5. These findings implied that the induction of ACE2 expression in IFN-high conditions could result in an amplified risk of SARS-CoV-2 infection4,5. Concerns could also be raised about possible ACE2-inducing side effects of IFN-based treatments proposed for COVID-196–9. ACE2 plays multiple roles in normal physiological conditions and as part of host tissue-protective machinery in damaging conditions, including viral infections. As a terminal carboxypeptidase, ACE2 cleaves a single C-terminal residue from peptide hormones such as angiotensin II and des-Arg9-bradykinin. ACE and ACE2 belong to the renin-angiotensin-aldosterone system, which regulates blood pressure and fluid-electrolyte balance; dysfunction of this system contributes to comorbidities in COVID-1910,11. des-Arg9-bradykinin is generated from bradykinin and belongs to the kallikrein-kinin system, which is critical in regulating vascular leakage and pulmonary edema, early signs of severe COVID-1912,13.
High plasma angiotensin II levels were found responsible for coronavirus-associated acute respiratory distress syndrome (ARDS), lung damage, and high mortality in mouse models14,15 and as a predictor of lethality in avian influenza in humans16,17. In the same conditions, ACE2, which decreases the levels of angiotensin II, was identified as a protective factor. The hijacking of the normal host tissue-protective machinery guarded by ACE2 was suggested as a mechanism through which SARS-CoV could infect more cells4,5. Thus, it is critically important to identify factors affecting ACE2 expression in normal physiological processes and during viral infections and associated pathologies, such as in COVID-19.
Herein, aiming to explore the IFN-inducible expression of ACE2 and its role in SARS-CoV-2 infection, we identified a novel, truncated isoform of ACE2, which we designate as deltaACE2 (dACE2). We then showed that dACE2, but not ACE2, is induced in various human cell types by IFNs and viruses; this information is important to consider for future therapeutic strategies and understanding susceptibility and outcomes of COVID-19.
RESULTS
dACE2 is a novel inducible isoform of ACE2
To address the extent to which IFNs induce the expression of ACE2 in human cells, we used our existing RNA-seq dataset (NCBI SRA: PRJNA512015) of a breast cancer cell line T47D infected with Sendai virus (SeV), known to be a strong inducer of IFNs and ISGs18–20. IFNs were not expressed in T47D cells at baseline, but SeV strongly induced expression of IFNB1, a type I IFN, and all type III IFNs (IFNL1, 2, 3, and 4). Several well-known ISGs (ISG15, MX1, and IFIT1) were moderately expressed at baseline but were strongly induced by SeV (Supplementary Table 1). ACE2 was not expressed at baseline but was strongly induced by SeV, exclusively as an isoform initiated from a novel first exon in intron 9 of the full-length ACE2 gene (Fig. 1a, b).
Fig. 1. dACE2 is a novel truncated virally-induced isoform of ACE2.
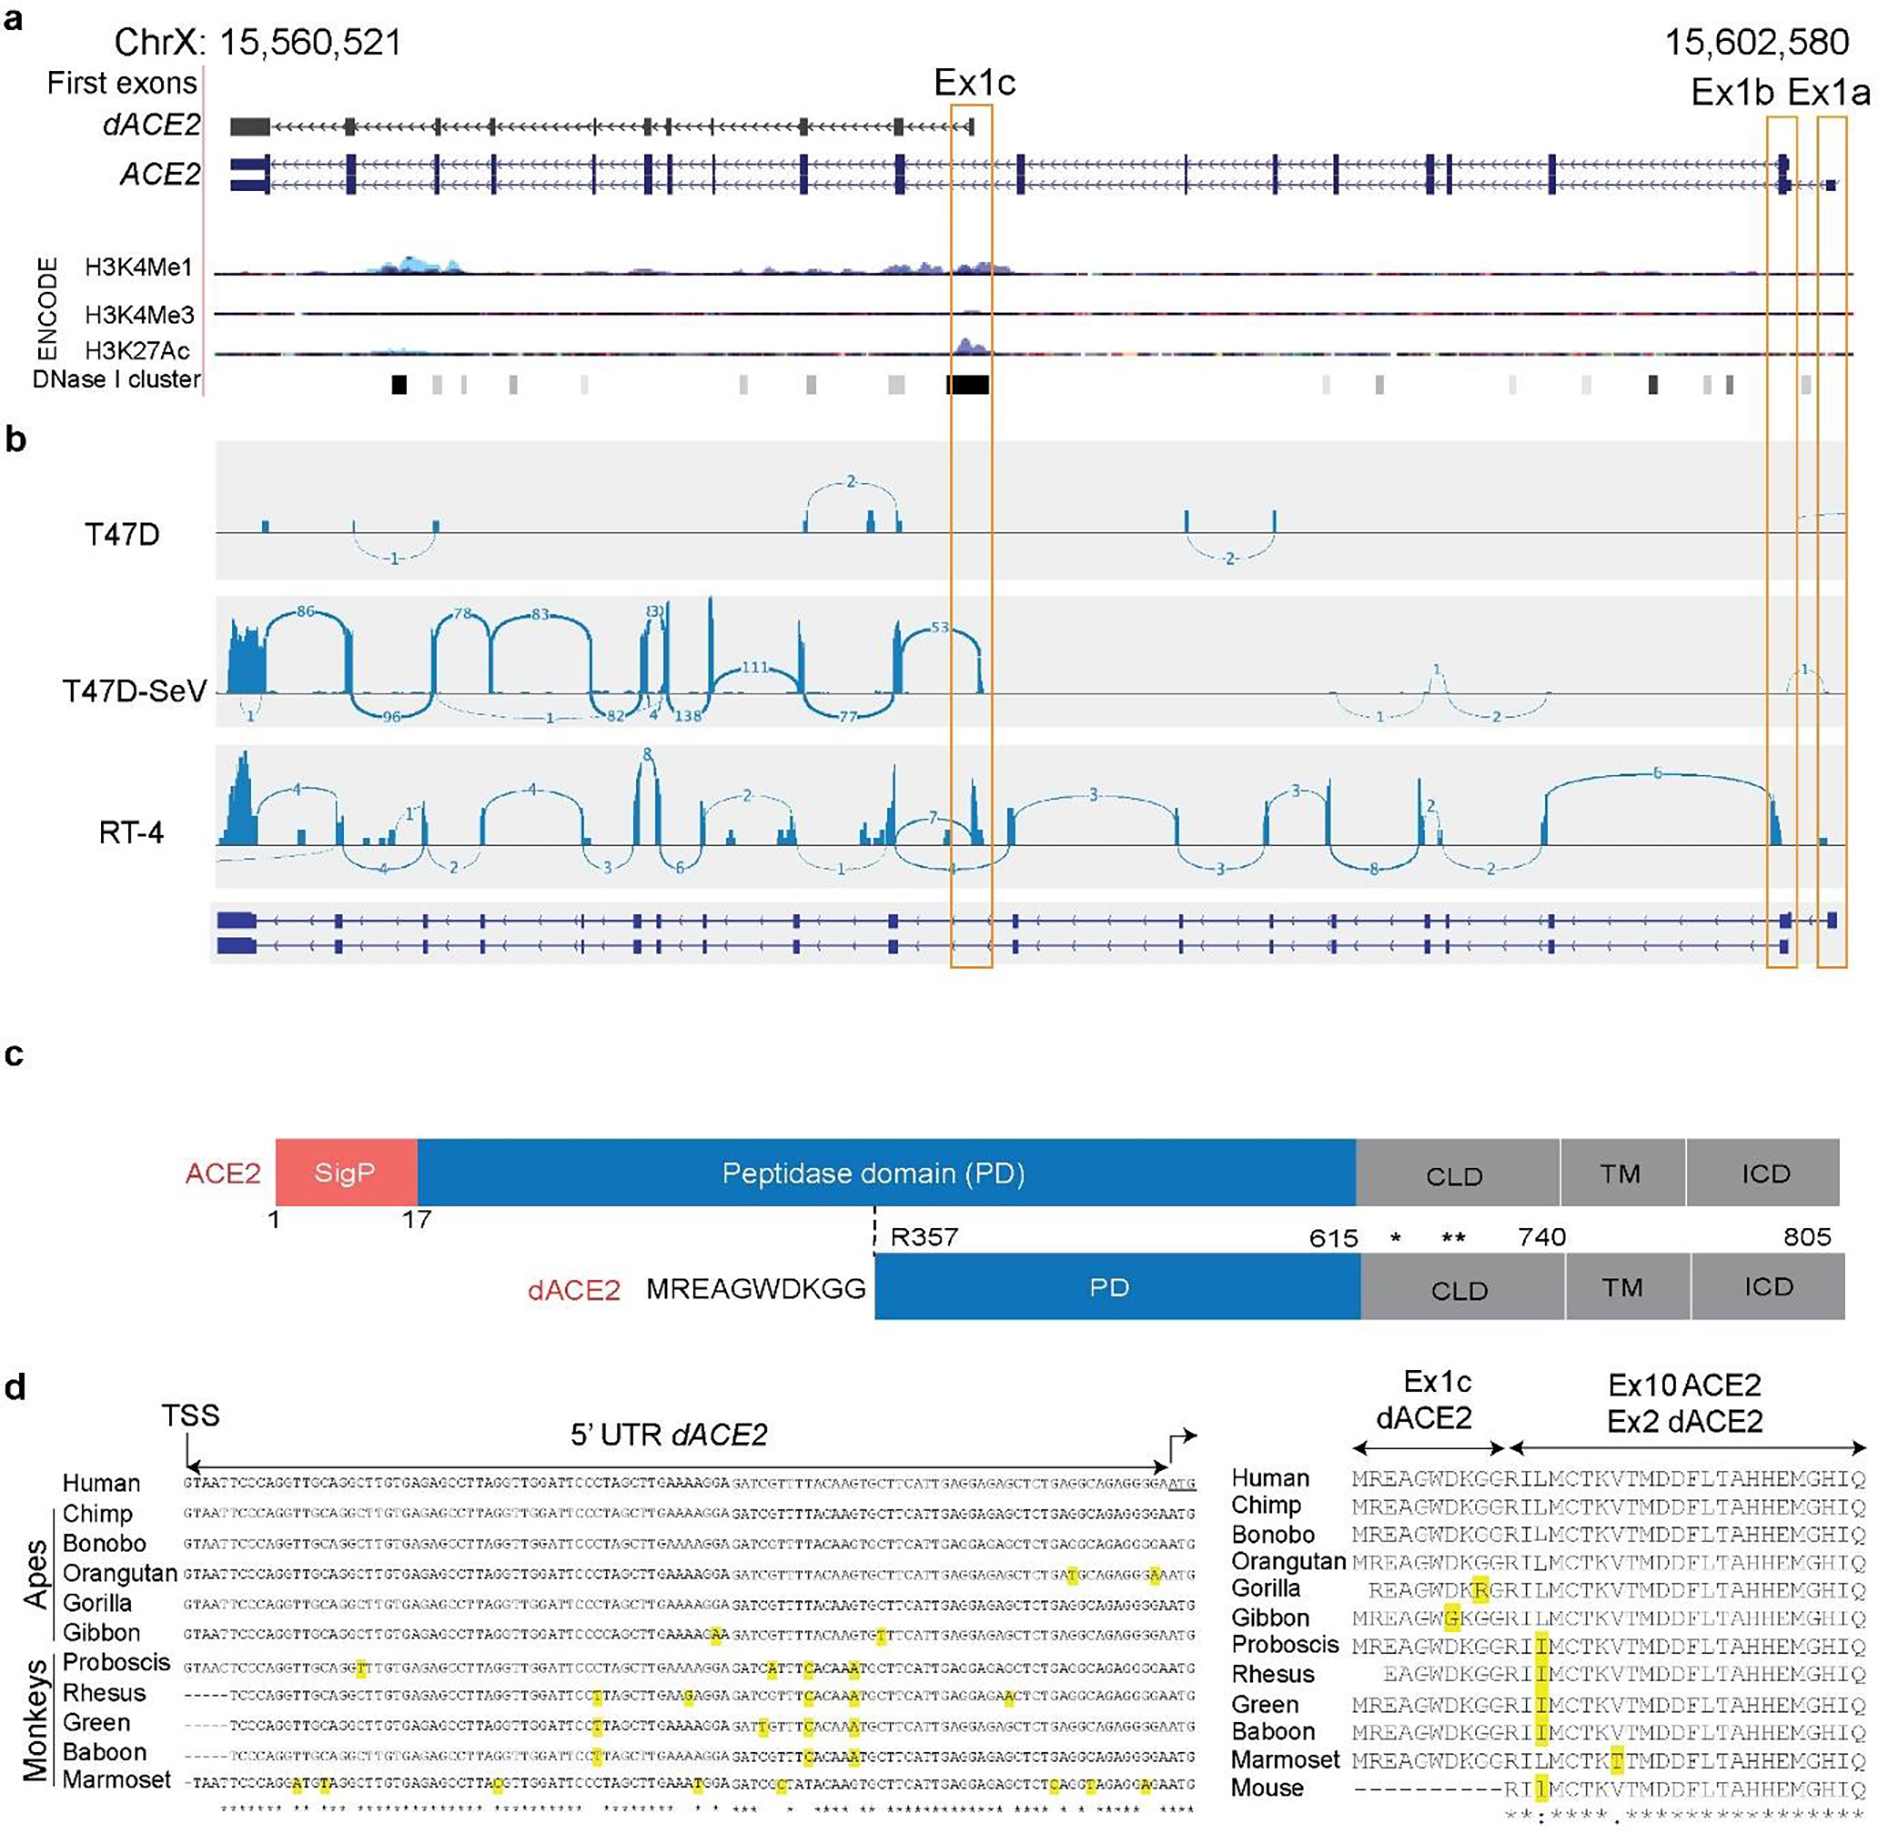
a, UCSC genome browser view of the human ACE2 region (chrX:15,560,521–15,602,580, GRCh38/hg38) showing alternative first exons ACE2-Ex1a, ACE2-Ex1b and a novel Ex1c that creates a truncated ACE2 isoform designated as deltaACE2 (dACE2). The combination of various ENCODE epigenetic marks for human cells (H3K4me1, H3K4me3 and H3K27ac) shown as peaks and DNase I hypersensitivity sites (DHS) clusters shown as bars indicates that dACE2-Ex1c is located within a putative regulatory region that can affect gene expression. The DHS overlaying Ex1c is detected in 38 of 95 cell lines tested. b, RNA-seq Sashimi plots depict splicing patterns defining ACE2 and dACE2 isoforms in SeV/mock-infected T47D cells and uninfected RT-4 cells. The numbers on the Sashimi plots indicate the counts of exon-exon splicing reads. c, ACE2 is a single-span transmembrane protein with a signal peptide (SigP) of 17 aa and four functional domains – peptidase domain (PD, aa 18–615), collectrin-like domain (CLD, aa 616–740), transmembrane domain (TM, aa 741–761), and intracellular domain (ICD, aa 762–805). In dACE2, the signal peptide is not predicted; the peptidase domain starts from aa R357; the first 356 aa are replaced by 10 aa of a unique protein sequence; * and ** - cleavage sites of membrane-bound proteases ADAM17 and TMPRSS2, respectively. d, and e) Sequence alignments of the 5’UTR and protein sequences encoded by dACE2-Ex1c and part of the downstream exon in select primates. dACE2 is not predicted to be encoded in any non-primate species. Additional alignment analyses are shown in Supplementary Fig. 1a, b.
RNA-seq analysis in T47D and RT4 cell lines (Fig. 1b) demonstrated that ACE2 exists as two full-length transcripts initiated from two independent first exons, which we designated as Ex1a and Ex1b (the latter is shared between these transcripts). Additionally, an alternative transcript was initiated from the novel first exon in intron 9, which we designated as Ex1c (Fig. 1b). The combination of ENCODE chromatin modification marks (H3K4me1, H3K4me3, H3K27ac, and a cluster of DNase I hypersensitivity sites (Fig. 1a), suggests that Ex1c, but not Ex1a and Ex1b, is located within a putative regulatory region that might affect gene expression.
The novel ACE2 isoform is predicted to encode a protein of 459 aa, including the first 10 aa encoded by Ex1c. Compared to the full-length ACE2 protein of 805 aa, the truncation eliminates 17 aa of the signal peptide (SigP) and 339 aa of the N-terminal peptidase domain (PD, Fig. 1c). We designate this novel isoform as deltaACE2 (dACE2, NCBI GenBank accession number MT505392). Analysis of 100 vertebrate species with genomic sequences available through the UCSC Genome Browser showed that the putative dACE2 protein could be encoded only in primates (Supplementary Fig. 1a). Comparison of the human Ex1c and its proximal promoter in select species showed 96.7–99.6% of sequence identity in primates and 54.0–73.5% in non-primate mammals (Supplementary Fig. 1b). In primates, despite some differences on the mRNA level, there was strong conservation within the putative protein encoded by dACE2-Ex1c (Fig. 1d, e).
Several binding motifs for transcription factors relevant for IFN signaling were predicted within the promoter of dACE2-Ex1c (P3) (Fig. 2a). In contrast, ISG-type motifs were not predicted in promoters of ACE2-Ex1a (P1) and ACE2-Ex1b (P2) (Fig. 2a). We evaluated the IFN-inducible activity of all three promoters (ACE2-P1, ACE2-P2 and dACE2-P3) by testing their ability to drive expression of the Luciferase reporter (Fig. 2b). The reporter constructs were transiently transfected into HepG2 cells, in which the signaling of all IFNs has been reported. Only dACE2-P3 significantly induced Luciferase expression in response to 6 hrs of treatment with IFNβ or IFNγ (Fig. 2c). The deletion of the first 100 bp of the dACE2-P3 promoter resulted in the loss of Luciferase activity, suggesting that the predicted ISG-type motifs in the proximal promoter are important for IFN-driven dACE2 expression (Fig. 2c). The promoter of IFIT1, an ISG, was used as a positive control, and as expected, was strongly responsive to treatments with IFNs (Fig. 2d).
Fig. 2. Evaluation of ACE2 and dACE2 promoters.
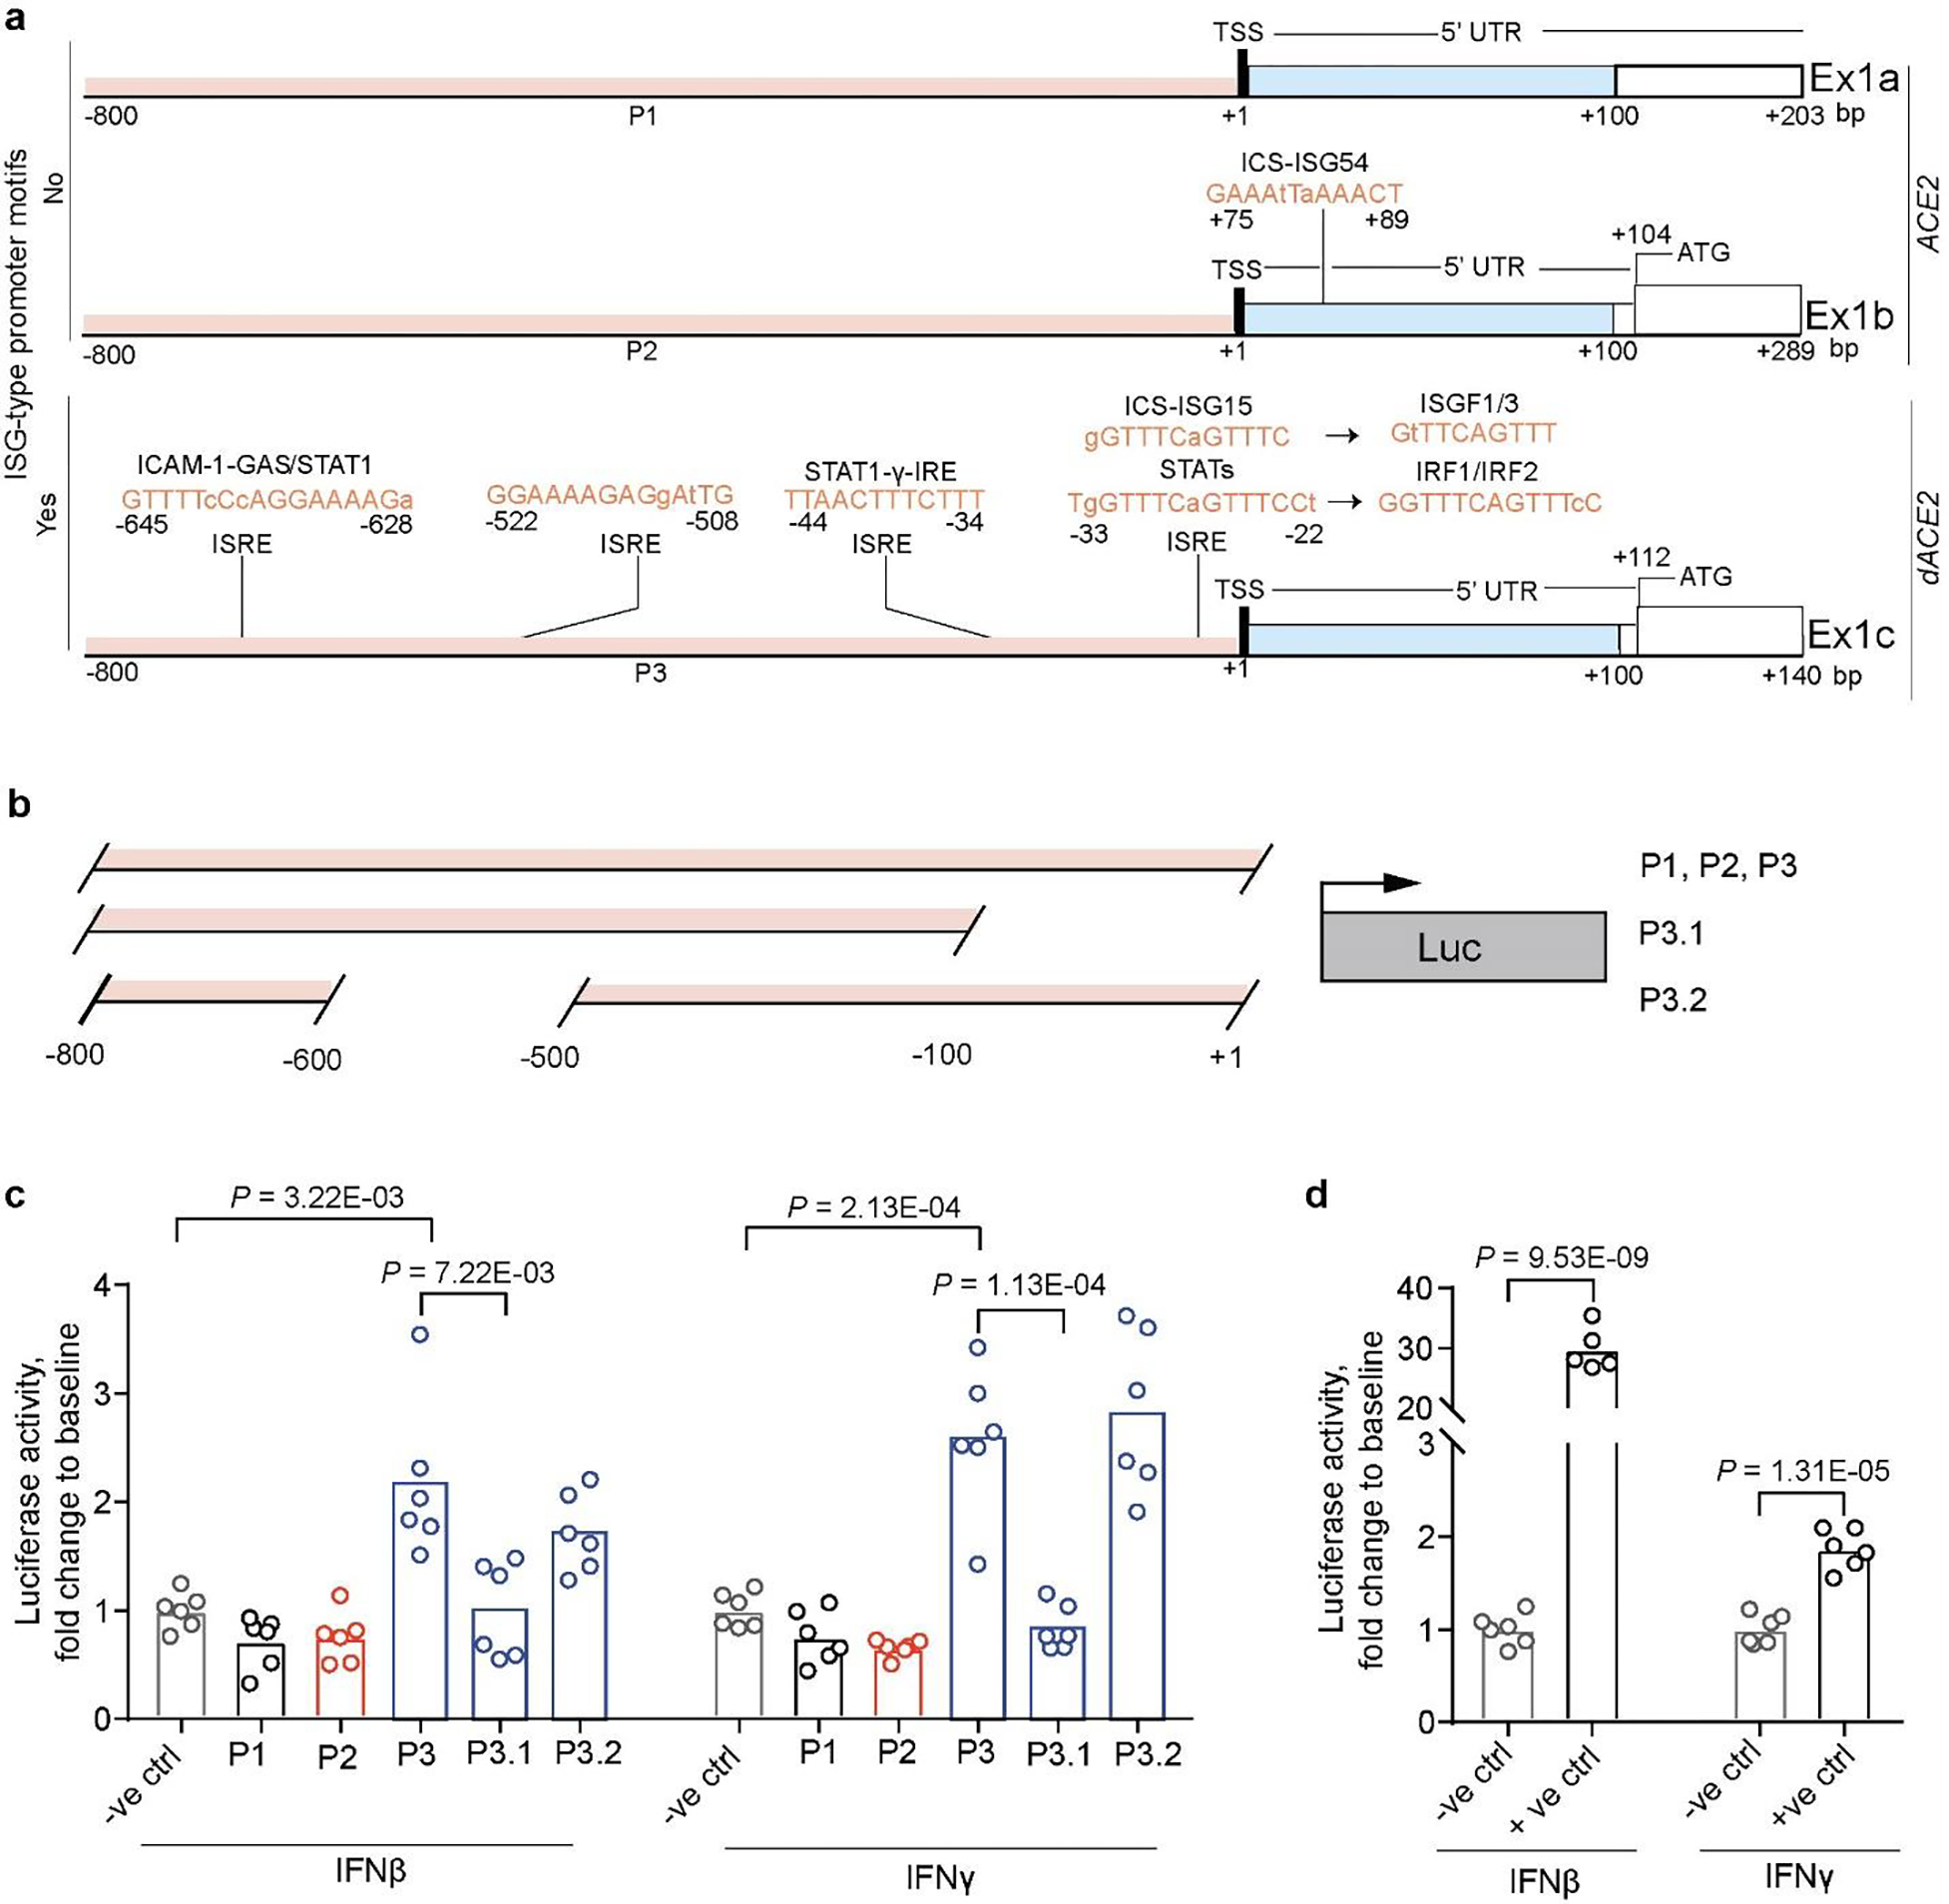
a, Promoters of ACE2 (P1 and P2) and dACE2 (P3) were analyzed for binding motifs of transcription factors relevant for IFN signaling. Promoters were defined within the −800/+100 bp windows from the corresponding transcription start sites (TSS). b, Schematics of Luciferase (Luc) reporter constructs. c, Luciferase activity in HepG2 cells transiently co-transfected with indicated Luciferase reporter constructs and Renilla (normalization control) and treated with 1 ng/ml of IFNβ or 2 ng/ml of IFNγ for 6 hrs. d, Luciferase activity driven by the promoter of IFIT1 (an ISG and positive control). Luciferase/Renilla ratios were normalized by corresponding mock-treated samples and presented as fold change to the negative control (empty promoterless pGL4.21 vector). P-values are for unpaired, two-sided Student’s T-tests. The experiment was conducted in 6 biological replicates per construct, and the results of one of three independent experiments are shown.
dACE2 is induced by in vitro treatment with IFNs
We confirmed the SeV-induced expression of the full-length dACE2 by RT-PCR (Fig. 3a, b) and verified the corresponding PCR products by Sanger sequencing. Using custom-designed assays, we explored ACE2 and dACE2 expression in multiple cell lines at baseline and after SeV infection (Fig. 3c, Supplementary Table 2A). In most cell lines tested, dACE2 but not ACE2 was strongly upregulated by SeV infection (Fig. 3b, c). To directly address whether IFN was responsible for the induced expression of dACE2, we performed expression analysis in primary normal human bronchial epithelial (NHBE) cells21 and human intestinal (colon and ileum) organoid cultures22. In NHBE cells from 5 healthy donors, baseline expression levels of dACE2 and ACE2 were comparable, but only dACE2 was significantly induced by treatment with IFNα or IFNλ3 (Fig. 3d, Supplementary Table 2B). In contrast, ACE2 was highly expressed already at baseline both in colon and ileum organoid cultures, while the expression of dACE2 was very low. Treatments with IFNβ or a cocktail of IFNλ1–3 significantly induced only expression of dACE2 and not ACE2 (Fig. 3e, Supplementary Table 2C). In both cell models, the expression pattern of dACE2 was similar to that of the known ISGs – MX1 (Fig. 3d, Supplementary Table 2B) and IFIT1 (Fig. 3e, Supplementary Table 2C).
Fig. 3. dACE2 is induced by IFNs in vitro.

a, Schematic representation of ACE2 and dACE2 transcripts and the position of the forward (F) and reverse (R) PCR primers to generate full-length dACE2 amplicons. b, Agarose gel showing an RT-PCR product of 1535 bp corresponding to full-length dACE2 in several cell lines with/without SeV infection. c, Heatmap of ACE2 and dACE2 expression and a positive control ISG (ISG15) measured by TaqMan expression assays in human cell lines infected with SeV for 12 hrs; colors represent expression differences as ddCt (log2) normalized by endogenous controls (GAPDH and ACTB) and comparing SeV-infected to uninfected samples. d, Expression of ACE2 and dACE2 and a positive control ISG MX1 in primary normal human bronchial epithelial (NHBE) cells from 5 healthy donors; NHBEs were untreated or treated with IFNα or IFNλ3 for 24 hrs. Data is presented as means and SD. P-values are for the paired Student’s T-tests. e, Expression of ACE2 and dACE2 and a positive control ISG IFIT1 in colon and ileum organoid cultures from one donor; the organoids were treated with IFNβ or a cocktail of IFNλ1–3 for 24 hrs in 3 biological replicates. The results are presented with means and SD; P-values are for the unpaired, two-sided Student’s T-tests. Full expression results are presented in Supplementary Table 2B–C.
dACE2 is induced in virally-infected human respiratory cells
To investigate whether dACE2 expression is induced by RNA viruses, which are potent inducers of the IFN response, we de novo quantified the expression of ACE2-Ex1a, ACE2-Ex1b, and the newly annotated dACE2-Ex1c in several public RNA-seq datasets of virally-infected human respiratory epithelial cells. In an RNA-seq dataset of human nasal airway epithelial cells from asthmatic patients ex-vivo infected with respiratory rhinovirus strains RV-A16 and RV-C15 (NCBI SRA: PRJNA627860), both ACE2 and dACE2 were expressed (Fig. 4a). Compared to uninfected cells, dACE2-Ex1c expression was strongly induced by both viruses – by RV-A16 (2.58-fold) and RV-C15 (2.42-fold), while expression of ACE2-Ex1b was moderately induced only by RV-C15 (1.13-fold) (Fig. 4b). Only dACE2 expression strongly correlated with multiple ISGs and IFNs (Fig. 4c). Similarly, in human lung explants infected with a seasonal influenza A/H3N2 strain (NCBI SRA: PRJNA557257), only dACE2 was induced by infection, and its expression correlated with the levels of IFNs and ISGs (Fig. 4d, e).
Fig. 4. dACE2 is induced in virally-infected human respiratory cells.

Expression patterns of ACE2, represented by Ex1a and Ex1b and dACE2, represented by Ex1c in a-c) uninfected and rhinovirus (RV)-infected human nasal epithelial cells and d-e) in uninfected and influenza H3N2-infected cells from human lung explants. a, RNA-seq Sashimi plots. b, and d, First exon-specific expression levels of ACE2 and dACE2 are presented by box-and-whisker plots as: mean (+), median (center line); box (25th to 75th interquartile range), whiskers (5–90 percentile range) and outliers (individual data points). FC – fold change compared to mock. P-values are for the non-parametric, two-sided Wilcoxon matched-pairs signed rank test. c, and e, Pearson correlation coefficients with p-values for two-sided tests for exon-specific expression levels of ACE2 and dACE2 with select ISGs and IFNs in the full datasets.
It was reported that in contrast to ACE2 expression in human cells, Ace2 was not induced in primary mouse tracheal basal cells in response to in vitro and in vivo IFN stimulation, and upon in vivo viral infection4. To explore this further, we analyzed a dataset for human and mouse lung cells infected with the respiratory syncytial virus (RSV, NCBI SRA: PRJNA588982). Indeed, we did not observe induction of Ace2 in mouse lung cells (Extended Data Fig. 1a), while dACE2 but not ACE2 was induced in RSV-infected human pulmonary carcinoma cell line (H292) (Extended Data Fig. 1b). These results illustrate that the identification of ACE2 as an ISG4,5 was likely based on the detection of inducible expression of dACE2, since 3’-scRNA-seq would detect both ACE2 and dACE2. The significant differences between the human and mouse sequences corresponding to dACE2-Ex1c and promoters (Supplementary Fig. 1b) might be responsible for the lack of ISG-type ACE2 expression in the mouse (Extended Data Fig. 1a). We also analyzed Ace2 expression in an RNA-seq dataset of nasal washes from mock/SARS-CoV-2-infected ferrets and did not observe any dAce2-type transcripts (Extended Data Fig. 1c). We also tested ACE2 and dACE2 expression in a commonly used cell line Vero E6 derived from green monkey kidney. ACE2 expression was high at baseline but not inducible by treatments with IFNβ or IFNλ1 (which induced an ISG control MX1), while dACE2 was not detected in any conditions (Supplementary Table 2B). In comparison, in the human kidney cells HEK293T, ACE2 expression was also high at baseline and not inducible by IFN treatment, while dACE2 was moderately induced by IFNβ (Supplementary Table 2B). Although dACE2 was not inducible by IFNs in Vero E6, while being moderately expressed HEK293T cells, this should be further tested in additional cell lines and primary tissues before making conclusions whether dACE2 could be induced in non-human primates.
dACE2 is enriched in squamous epithelial tumors
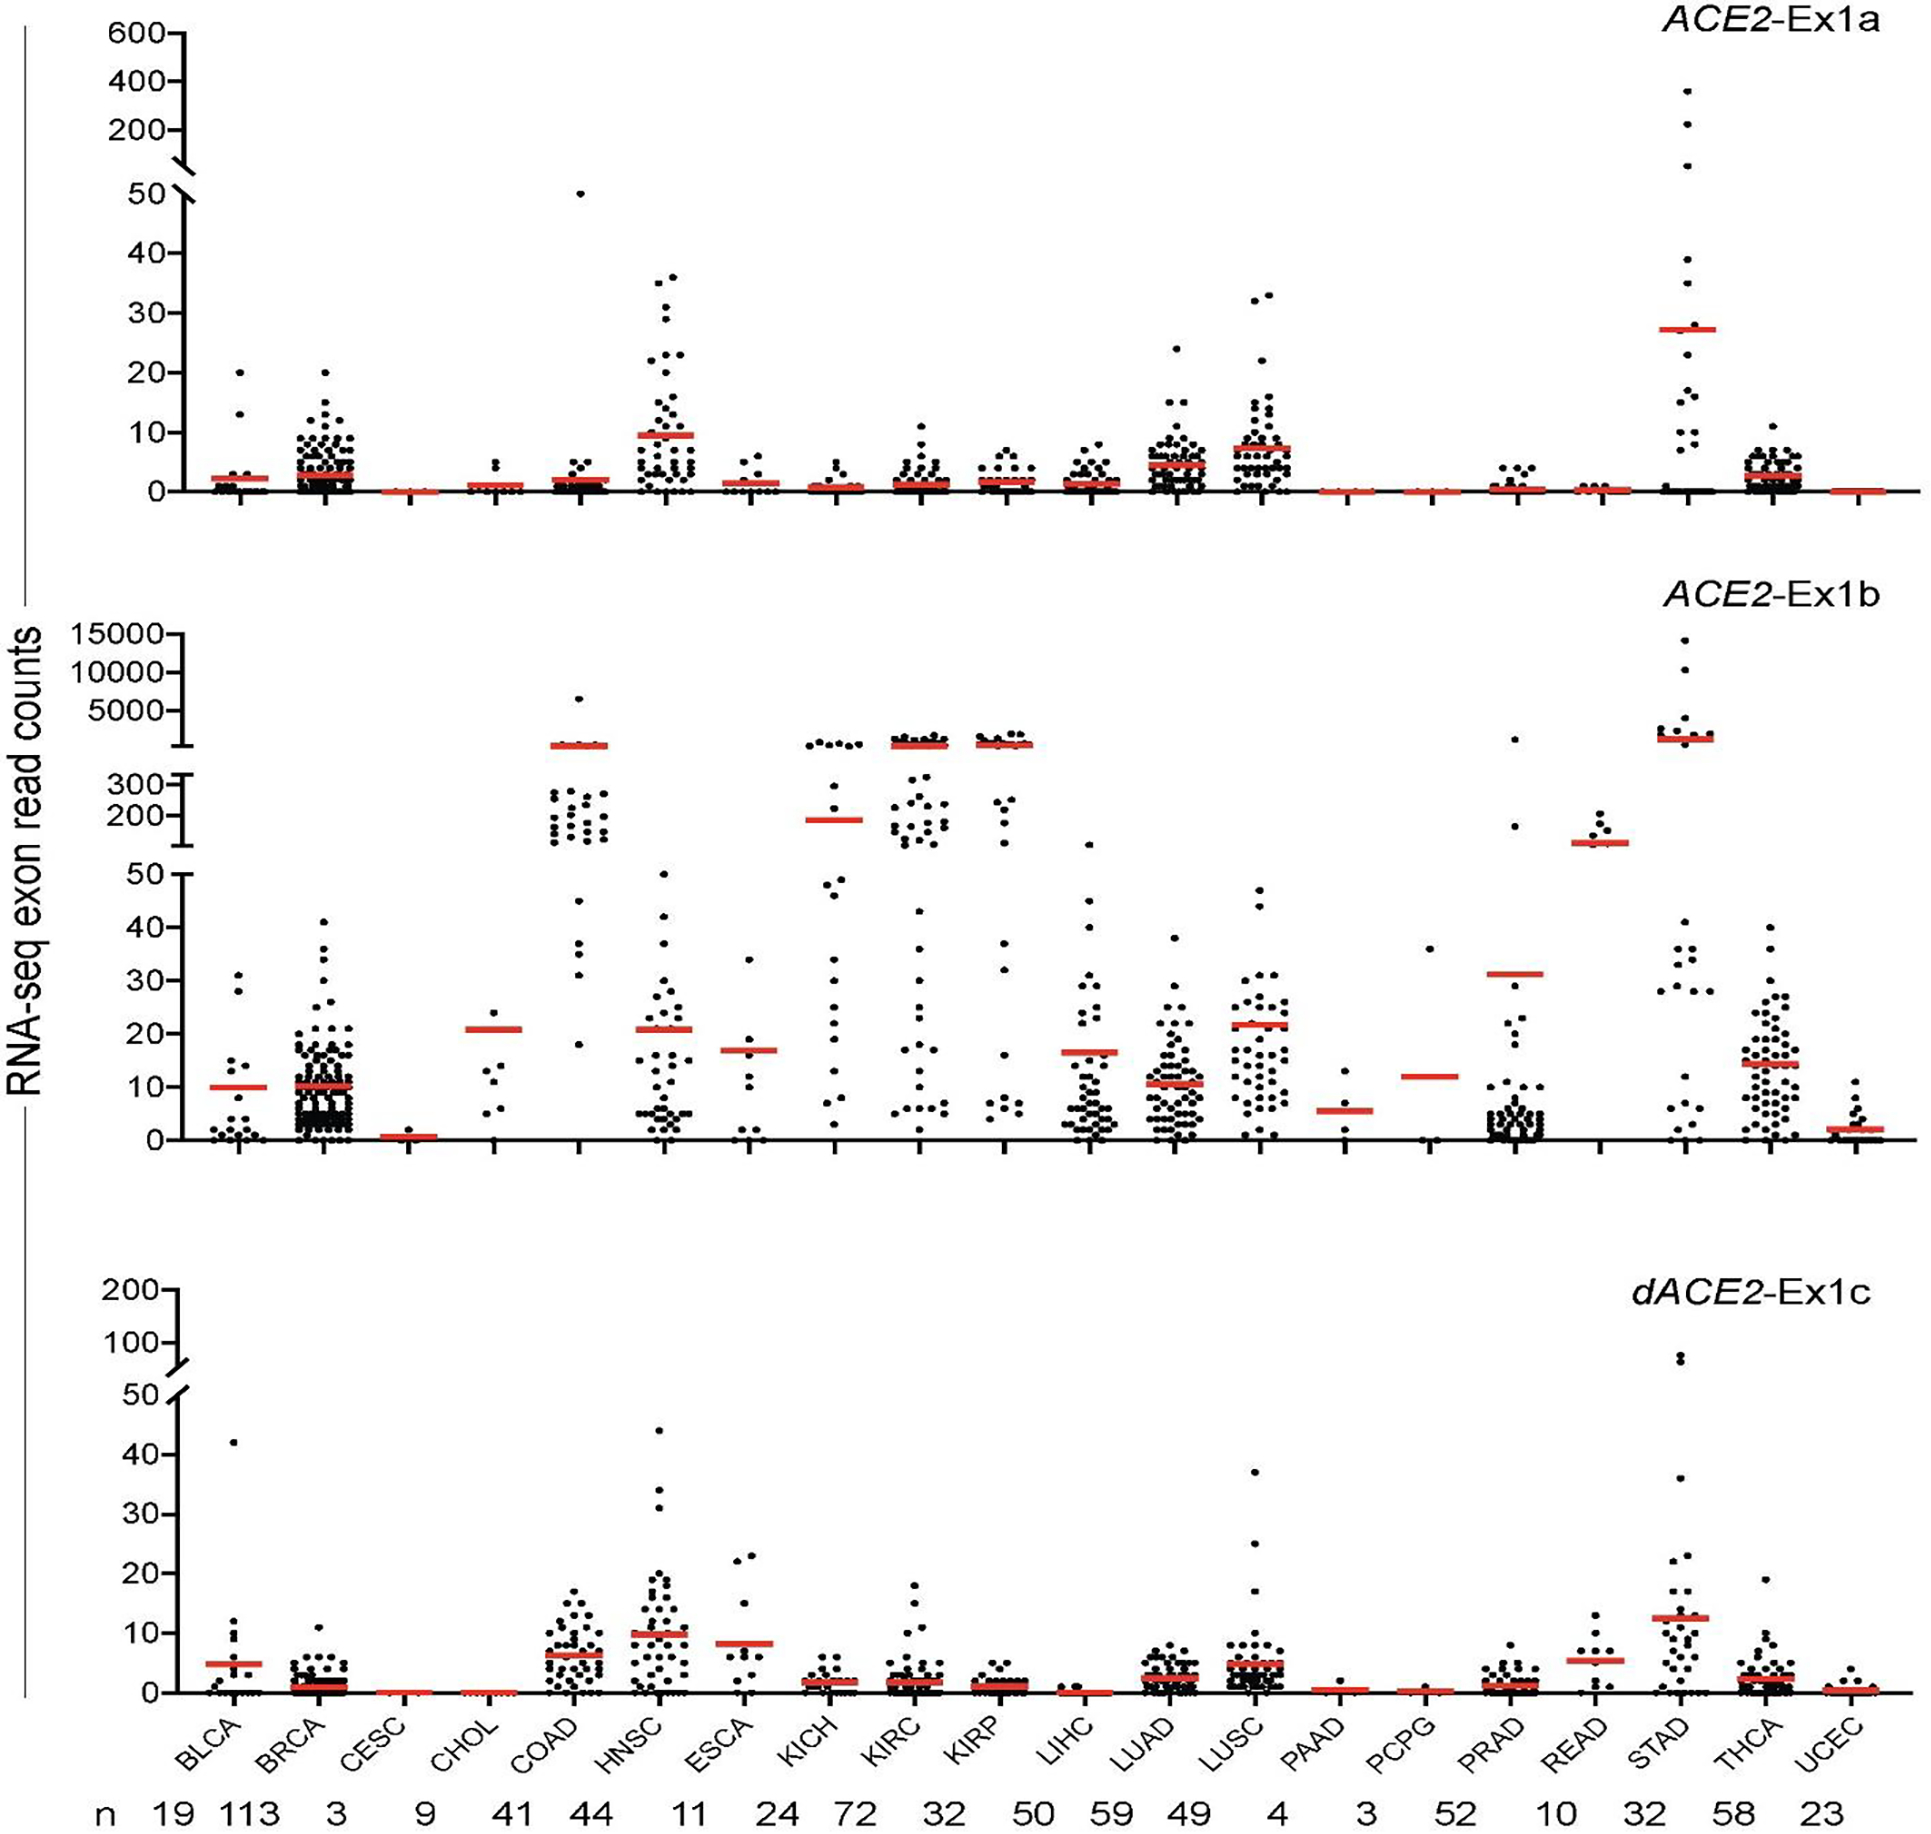
We explored the expression patterns of dACE2 in various human tissues. In a dataset of 95 normal human tissues of 27 types, dACE2-Ex1c was detectable in select tissues but at very low levels (≤ 10 RNA-seq reads), while ACE2-Ex1b expression was common (Extended Data Fig. 2). In the set of normal human tissues from the Genotype-Tissue Expression (GTEx) Project, only total gene expression was available for ACE2, with the highest expression observed in the testes and small intestine (Supplementary Fig. 2). We hypothesized that as an ISG, dACE2 might be absent or expressed at low levels in normal tissues, but could be induced by the inflammatory tissue microenvironment. We explored the data from The Cancer Genome Atlas (TCGA), which represents the largest collection of tumors and tumor-adjacent normal tissues, and de novo quantified the expression of ACE2 and dACE2 in all TCGA samples (Supplementary Table 2F–H). Expression of both ACE2 and dACE2 was detectable in many tumor-adjacent normal tissues (Fig. 5a, Extended Data Fig. 3). In the set of 10,185 TCGA tumors of 33 cancer types, ACE2-Ex1a, ACE2-Ex1b, and dACE2-Ex1c were expressed in 12.6, 38.0, and 16.8% of tumors, respectively, with ≥5 RNA-seq reads/sample. dACE2 was most expressed in head and neck squamous carcinoma (HNSC) and lung squamous carcinoma (LUSC), which represent oral and bronchial mucosal epithelial surfaces, while ACE2 was most expressed in kidney tumors (Extended Data Fig. 4).
Fig. 5. dACE2 expression is enriched in squamous epithelial tumors.
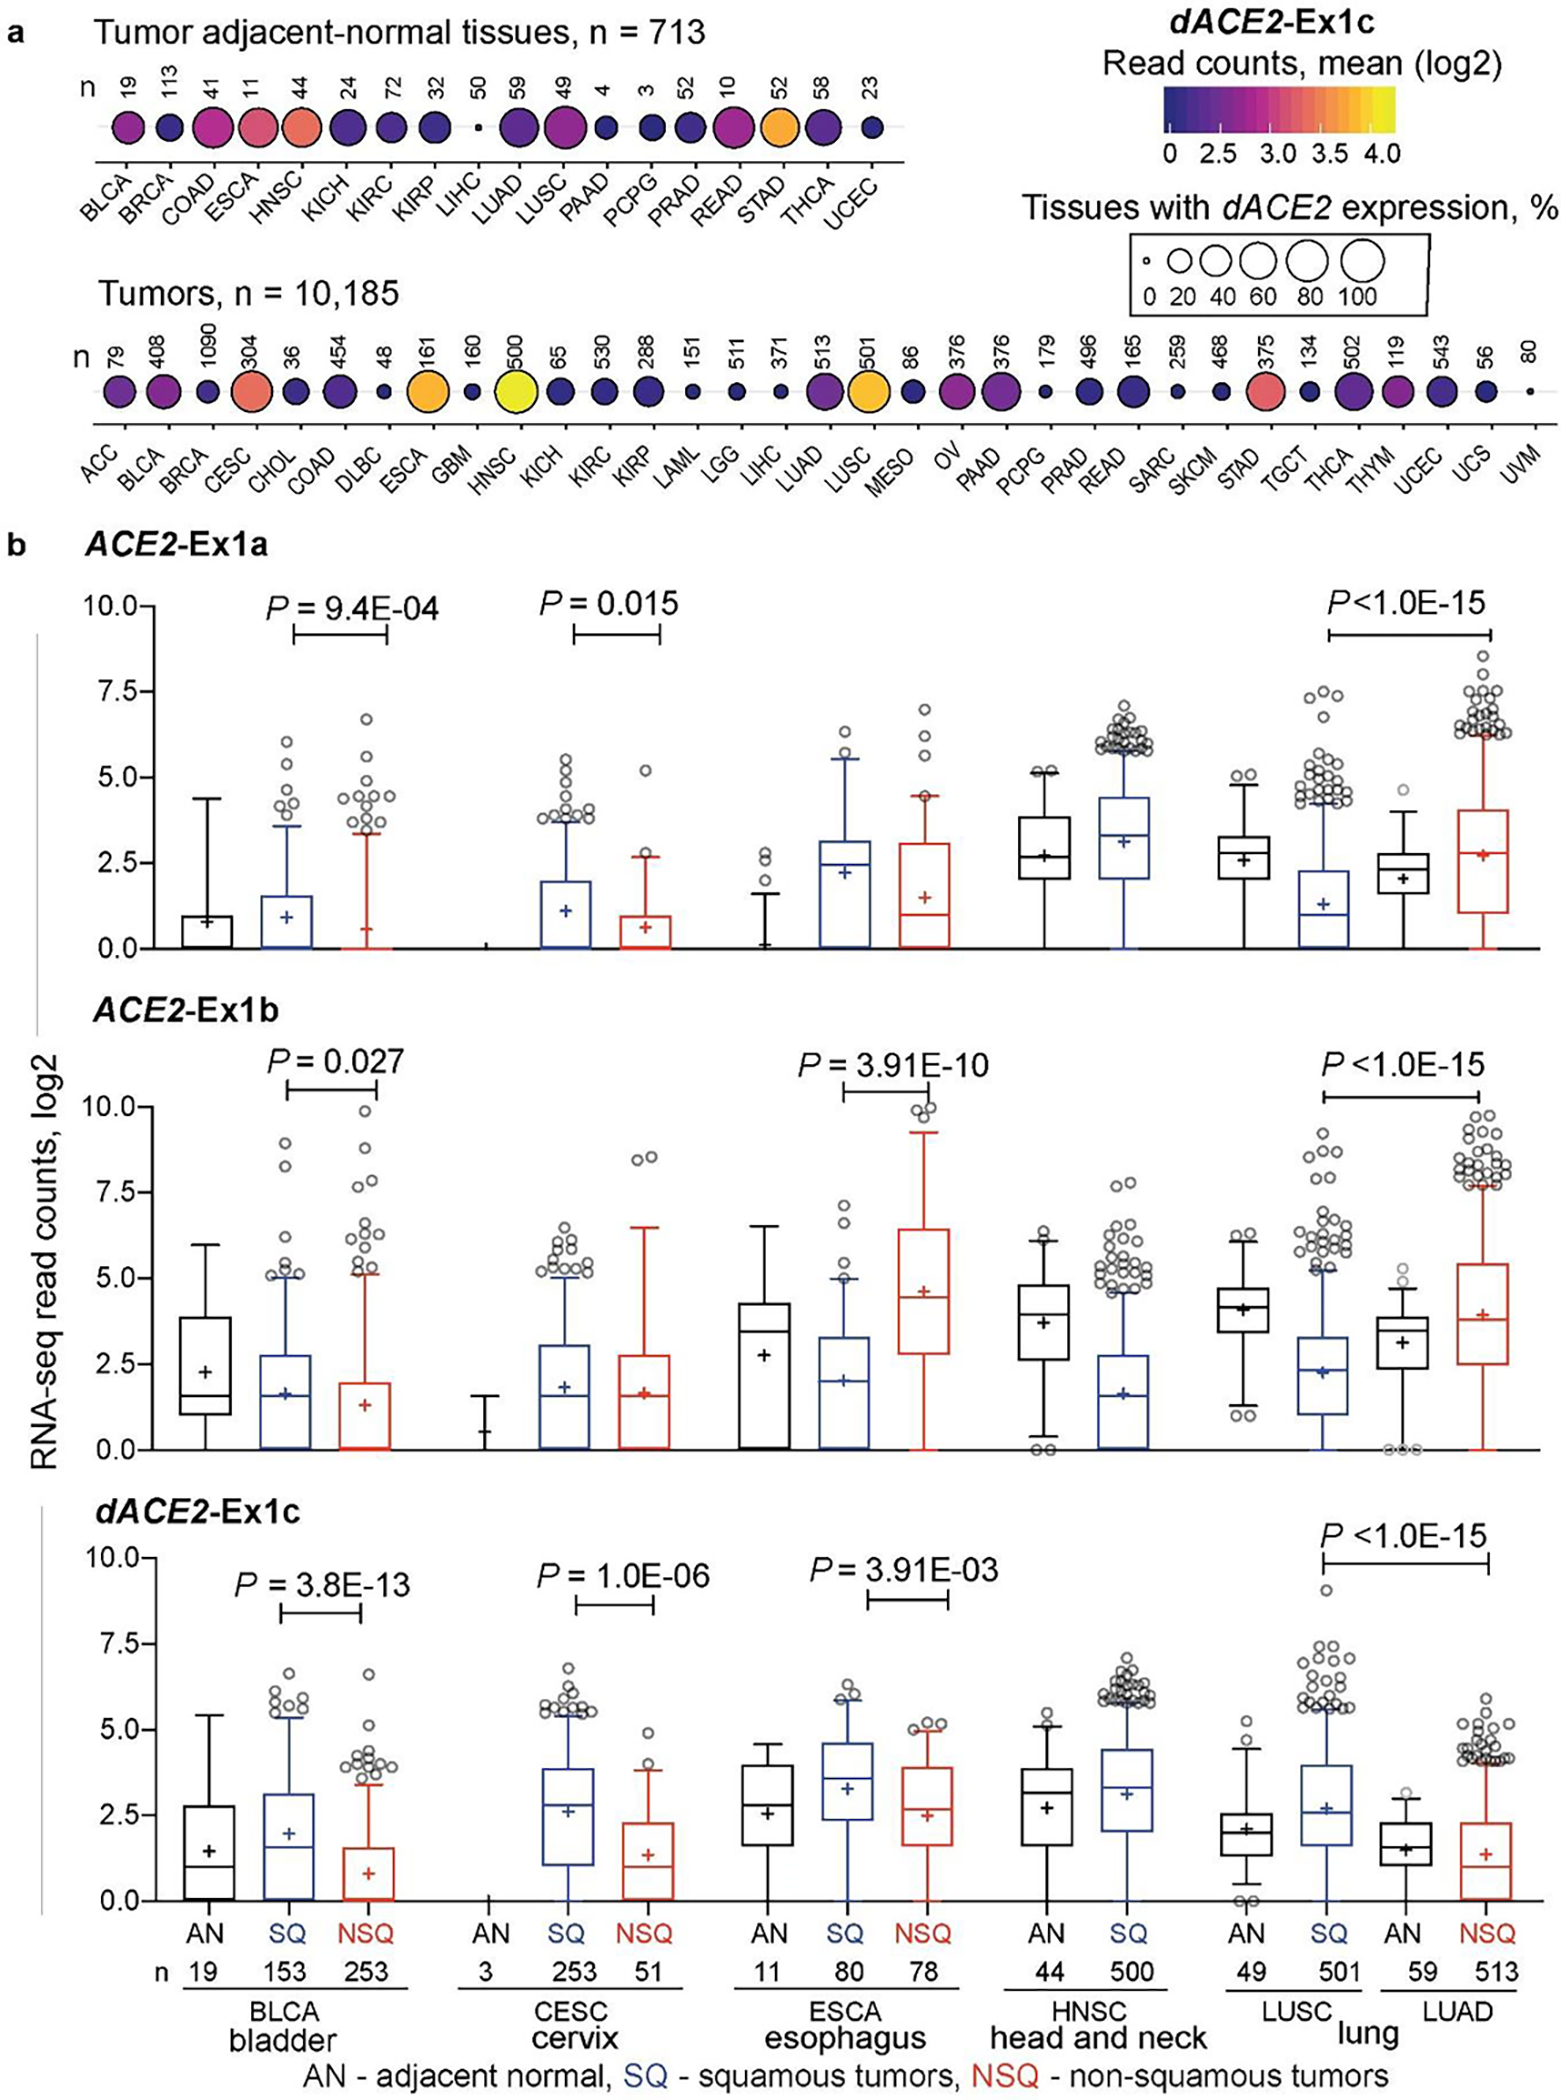
a, Bubble plot showing mean expression levels (RNA-seq read counts) and proportions of samples with dACE2-Ex1c in TCGA tumor-adjacent normal (AN) tissues and 33 tumor types. dACE2-Ex1c is expressed at relatively high levels and in many tumors of the bladder (BLCA), cervix (CESC), esophagus (ESCA), head and neck (HNSC), and lung squamous carcinoma (LUSC). b, RNA-seq counts of ACE2-Ex1a, ACE2-Ex1b and dACE2-Ex1c in tumor-adjacent normal (AN), squamous tumors (SQ) and non-squamous tumors (NSQ). The dACE2 expression is significantly higher in SQ compared to NSQ tumors of the same tissue origin and corresponding AN tissues. Specifically – dACE2-Ex1c is expressed similarly in AN tissues adjacent to LUSC and LUAD, while it is significantly higher in corresponding tumors and higher in LUSC than in LUAD, due to the clonal origin of these tumors from cells with differential expression of dACE2. The box-and-whisker plots represent mean (+), median (center line); box (25th to 75th interquartile range), whiskers (5–90 percentile range) and outliers (individual data points). P-values are for the non-parametric, two-sided Mann–Whitney U test.
Generally, dACE2 expression was enriched in squamous tumors representing epithelial tracts. Squamous carcinomas of the lung (LUSC) and head and neck (HNSC) represent respiratory tract, esophageal cancer (ESCA) - upper gastrointestinal, and bladder cancer (BLCA) and cervical squamous carcinoma (CESC) - urogenital tract (Fig. 5a). In each tumor type, dACE2 expression was significantly higher in squamous compared to non-squamous tumors and adjacent-normal tissues (Fig. 5b). Because tumors represent results of clonal expansion of individual cells, this analysis highlighted the differential etiology (squamous vs. non-squamous) of ACE2- and dACE2 expressing cells in various tissues.
dACE2 expression is IFNγ-inducible
In addition to cell type origin, the observed enrichment of dACE2 expression in some tumors might reflect persistent IFN exposure due to an inflammatory tumor microenvironment or underlying infection. IFNγ-induced signature emerged as a prominent feature in airway epithelial cells of patients with COVID-19, and this signature was linked with enrichment of cytotoxic T lymphocytes (CTLs)5. Unlike normal tissues, tumors are extensively infiltrated by immune cells, making TCGA dataset particularly informative for the analysis of IFN signatures. IFNG was the most commonly expressed IFN in TCGA tumors (with 61% of all tumors expressing IFNG at RSEM ≥ 1, mean RSEM = 19.8), while other IFNs were poorly expressed (mean RSEM ≤ 1.3, Extended Data Fig. 5a). dACE2-Ex1c levels significantly correlated (P ≤ 0.01, r ≥ 0.2) with IFNG expression in 8 out of 32 tumor types tested (Extended Data Fig. 5b), while ACE2-Ex1b showed only moderate and predominantly negative correlations with IFNG expression in some tumor types (Extended Data Fig. 5c). Furthermore, in vitro treatment with IFNγ significantly induced dACE2, but not ACE2 (Extended Data Fig. 5d). Thus, in addition to type I and type III IFNs (Fig. 3e–g), dACE2 expression might be partly driven by IFNγ contributed by tumor-infiltrating immune cells or inflamed virally infected tissues.
In the initial analysis of the TCGA-LUSC dataset (n=501), which represents ACE2- and dACE2-expressing tumors of bronchial origin (Fig. 5b), IFNG expression did not correlate with dACE2 (Extended Data Fig. 5b). To further investigate ACE2- and dACE2 expression in this tumor dataset, we used an unsupervised machine learning approach to assign all LUSC tumors to 6 clusters based on the expression of 270 ISGs23 (Extended Data Fig. 6a, b). A set of ISGs (n=100) that most strongly contributed to the definition of these clusters was used for correlation analysis. The analysis of a cluster that included 114 LUSC tumors with the highest ISG expression (Cluster 5) showed that dACE2 was strongly and significantly (FDR p-value < 0.05) correlated with expression of 20 ISGs and ACE2 - with 5 ISGs (Extended Data Fig. 6c, d). Thus, ISG-type dACE2 expression could be contributed by various factors, possibly determined by cell and tissue-specific microenvironments and exposures.
dACE2 is induced by SARS-CoV-2 in vitro
Once we established that dACE2 is an ISG in multiple human cell types under various conditions, we tested whether its expression could also be induced by SARS-CoV-2. There was a noticeable difference in baseline expression levels of ACE2 and dACE2 in three cell lines tested (Calu3, Caco-2, and T84). Expression of ACE2 and dACE2 was much higher in a lung adenocarcinoma cell line Calu3 compared to both colon adenocarcinoma cell lines Caco2 and T84 (Fig. 6a, Supplementary Table 2D). Baseline dACE2 expression in T84 was higher than in Caco-2, in line with the RT-PCR results (Fig. 1b). All cell lines were successfully infected with SARS-CoV-2 (Fig. 6b, Supplementary Table 2D), but ACE2 expression was not affected by infection in any cell line tested (Fig. 6a, Supplementary Table 2D). Induction of dACE2 expression tracked with previously reported SARS-CoV-2 infectivity rates in these cells22. Specifically, dACE2 was most strongly induced in Caco-2 cells, in which over 80% of cells were infected by 24 hrs, moderately induced in T84 cells (20% of cells were infected), and not induced in Calu3 cells (10% of cells were infected). A similar expression pattern was observed for an ISG, IFIT1, except for Calu3 cells, in which only IFIT1 was significantly induced (Fig. 6a, Supplementary Table 2d). We performed similar analyses in human colon and ileum organoid cultures derived from three donors. Overall, the expression of dACE2 and IFIT1, but not of ACE2, was significantly induced by SARS-CoV-2 infection (Fig. 6c, and d, Supplementary Table 2e).
Fig. 6. dACE2 is induced by SARS-CoV-2 in human cell lines and organoid cultures.
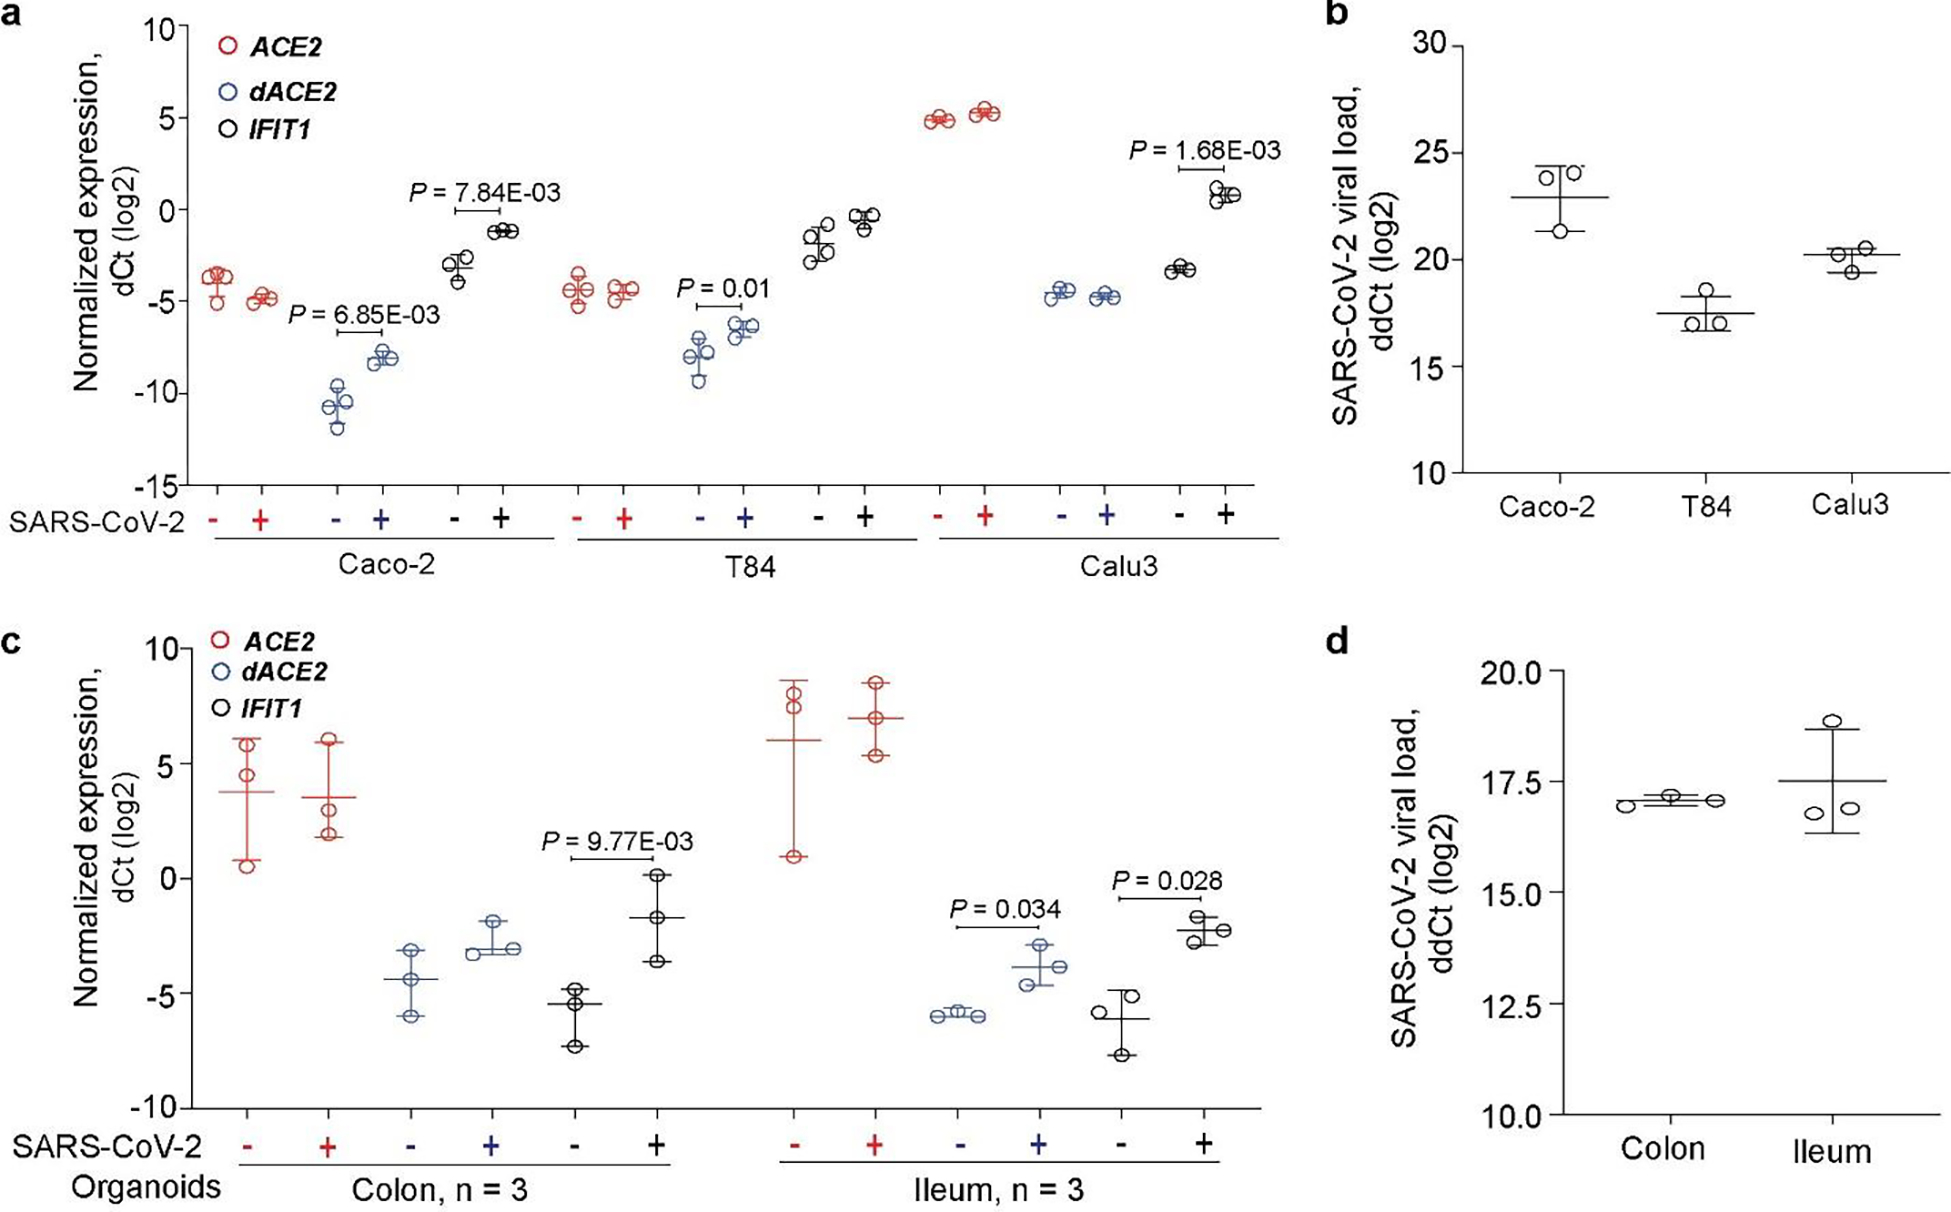
Expression of ACE2, dACE2 and a control ISG IFIT1 in a, colon cancer cell lines Caco2 and T84 and a lung cancer cell line Calu3 (all in 3–4 biological replicates) and c, colon and ileum organoid cultures from 3 donors; b, and d, SARS-CoV-2 viral loads in corresponding cells. P-values are for the two-sided Student’s T-tests, unpaired tests for cell lines and paired tests for organoids. The results are presented with means and SD.
dACE2 is non-functional as SARS-CoV-2 receptor and peptidase
Despite the strong induction of dACE2 mRNA expression, we were unable to detect endogenous dACE2 in SeV-infected cell lines by Western blotting with commercial antibodies for ACE2 (data not shown). However, in the proteome database of mass spectrometry data available for breast, colon, and ovarian TCGA tumors24, we detected human-specific peptides matching the 10 aa encoded by the dACE2-Ex1c (Extended Data Fig. 7), suggesting that dACE2 protein could be expressed in some conditions.
Transiently overexpressed dACE2-GFP was detected on the cell surface, although at levels lower than ACE2-GFP (Extended Data Fig. 8). However, the substantial N-terminal truncation by 356 aa in the peptidase domain of the putative dACE2 protein is expected to have significant functional consequences compared to the activity of the full-length ACE2 protein of 805 aa. For example, decreased or no binding by the SARS-CoV-2 spike receptor-binding domain (spike-RBD) would be expected for dACE2. Indeed, only cells overexpressing ACE2-GFP but not GFP alone or dACE2-Myc were able to bind and internalize the spike-RBD (Fig. 7a–c). Compared to ACE2-GFP alone, a moderately increased ACE2-GFP expression and binding of spike-RBD was observed in cells co-expressing dACE2-Myc and ACE2-GFP (Fig. 7d, e, Extended Data Fig. 9a), which could suggest that dACE2 increases infection. However, when we transiently transfected ACE2-GFP with a plasmid for an unrelated transmembrane protein, TMEM129-Myc, we observed a similar pattern (Extended Data Fig. 9b, c). This suggests that the observed effect of dACE2 on the increased ACE2 levels and spike-RBD binding might be a non-specific effect due to transient overexpression of multiple plasmids.
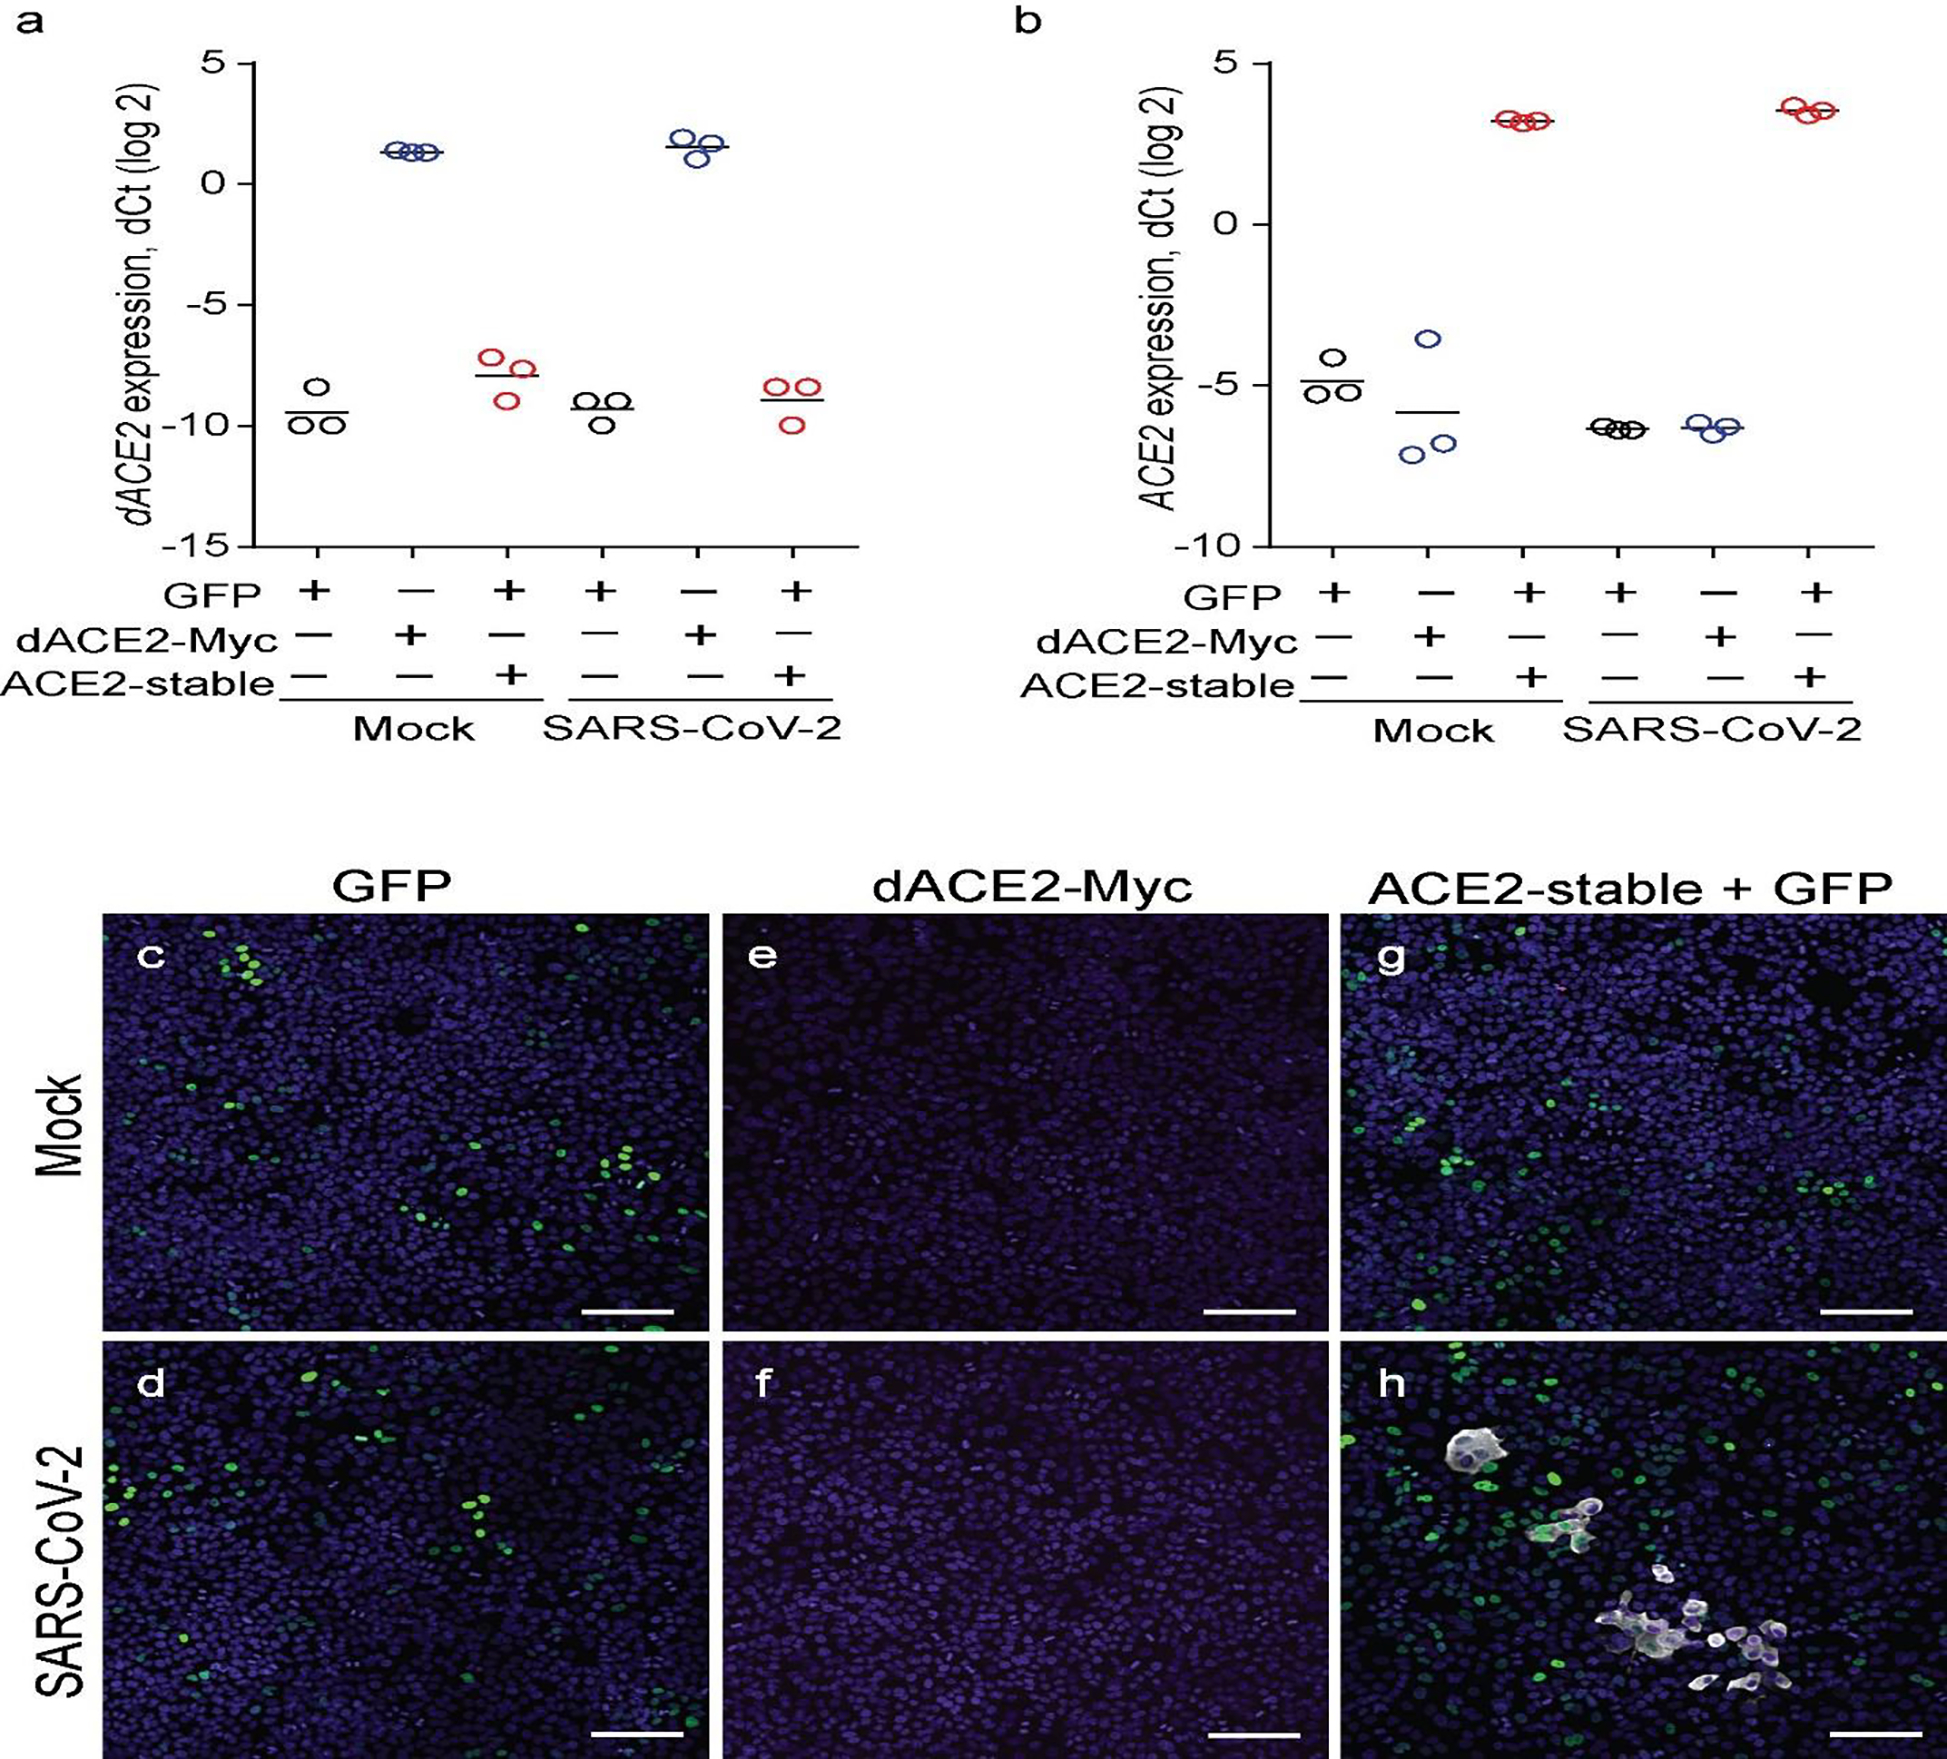
Fig. 7. dACE2 is non-functional for binding SARS-CoV-2 spike protein RBD and as a carboxypeptidase.
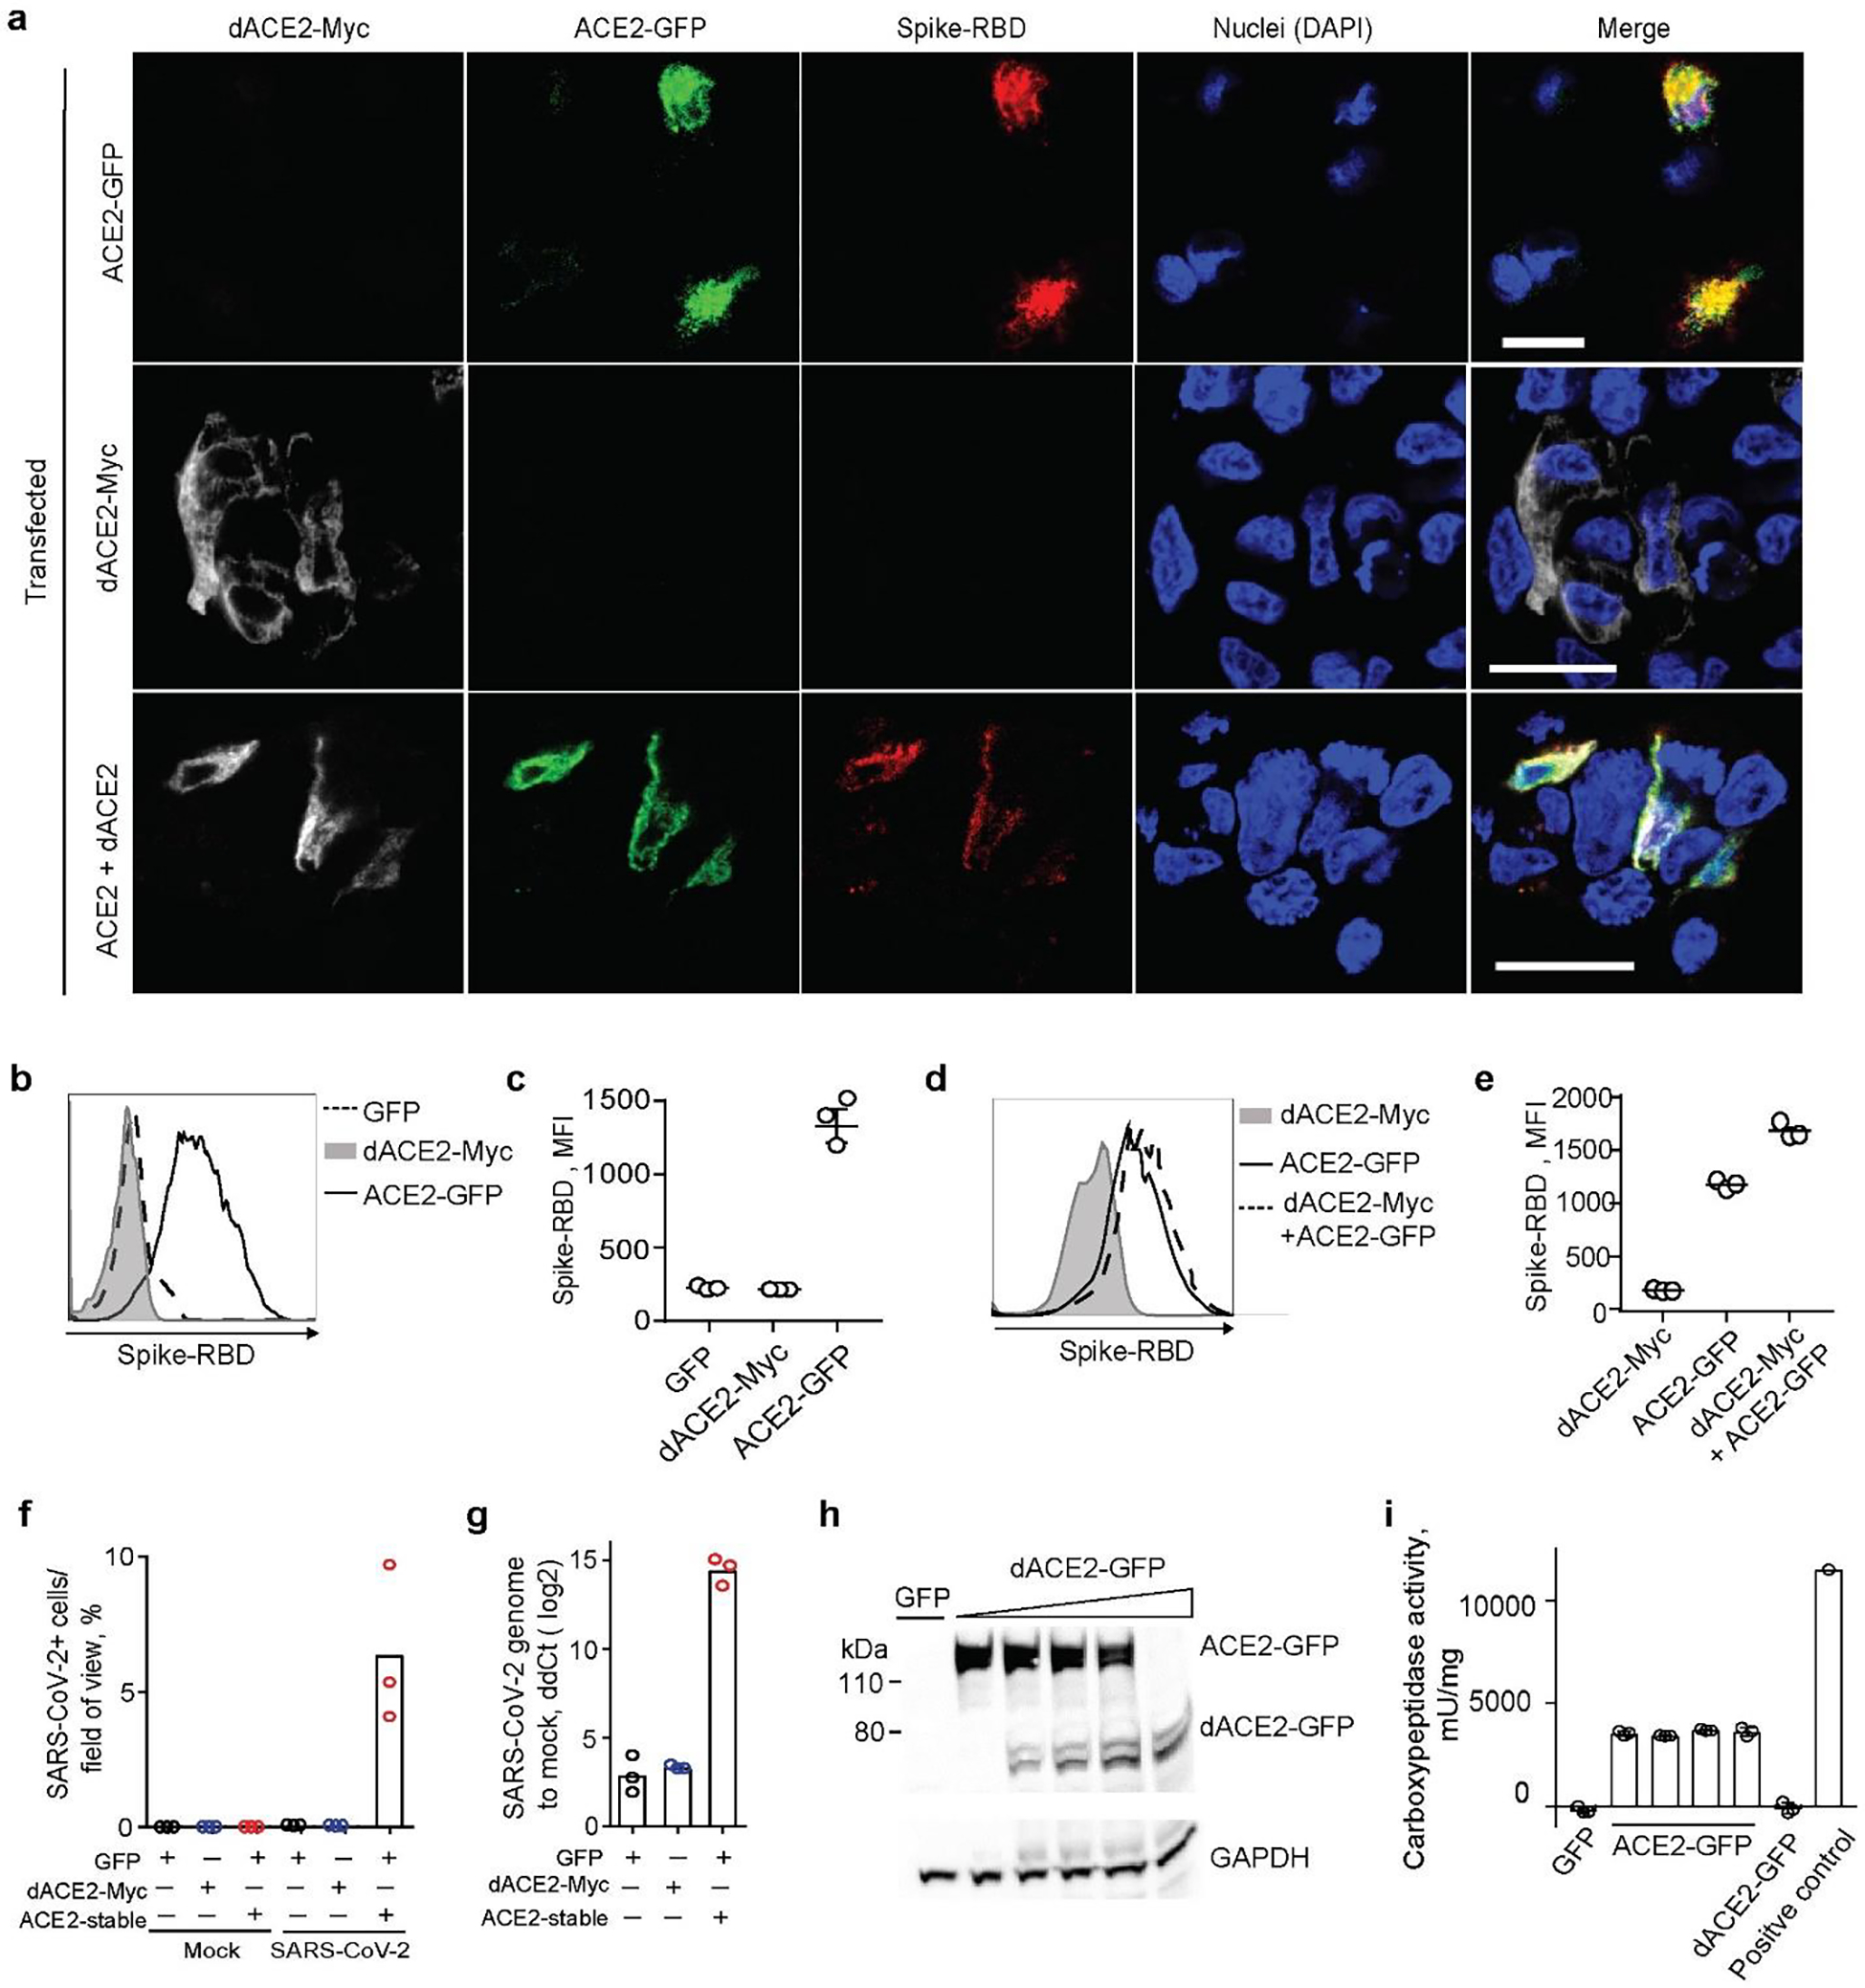
a, Representative confocal images of T24 cells transiently overexpressing dACE2-Myc (white), ACE2-GFP (green) and treated with receptor-binding domain (RBD) of SARS-CoV-2 spike protein (red), nuclei (DAPI)-blue; bars=20μM. b-d) Representative flow cytometry histogram b, and mean fluorescence intensity (MFI) values from 3 biological replicates c, of spike-RBD binding to the surface of ACE2-GFP but not dACE2-Myc expressing T24 cells. Gating for cells expressing dACE2-Myc, ACE2-GFP, or both proteins, is shown in Extended Data Fig. 9a. e, plot depicting MFI of spike protein-RBD binding. The results are based on 3 biological replicates, shown one of two independent experiments. f, SARS-CoV-2 infectivity rates (%) in a lung cancer cell line A549 transfected with GFP, or dACE2-Myc, or stably expressing ACE2 (ACE2-stable) and transfected with GFP. g, SARS-CoV-2 viral load as ddCt values compared to mock, corresponding to plot f. Additional details are provided in Extended Data Fig. 10. h, A representative Western blot with an anti-ACE2 antibody that detects both recombinant ACE2-GFP and dACE2-GFP overexpressed in T24 cells. The amount of the ACE2-GFP lysate was kept constant, while the amount of dACE2-GFP cell lysate was increased and the difference in the lysate volume was compensated by the empty GFP vector. i, Results of carboxypeptidase assays using variable amounts lysates of cells (as described in plot H, showing that the activity of ACE2 is not affected by increasing amounts of dACE2. The results are based on 3 biological replicates and presented with means and SD. WB is showing the results of one representative replicate.
We then evaluated the effect of dACE2 expression on SARS-CoV-2 infection in the lung cancer cell line, A549. The wild-type A549 cells (transfected with GFP as a transient transfection control) were not infected by SARS-CoV-2, even after transfection with dACE2-Myc, because of low expression of endogenous ACE2 (Extended Data Fig. 10a, b). However, the A549 cells stably expressing recombinant ACE2 (ACE2-stable), were infected (Fig. 7f, g, Extended Data Fig. 10c–h). These results further support the conclusion that, if expressed, dACE2 induced by viruses or IFNs is unlikely to increase SARS-CoV-2 infection.
The N-terminal truncation is also predicted to affect carboxypeptidase activity of dACE2, which is important for its ability to cleave angiotensin II, des-Arg9-bradykinin, and other substrates of ACE2. Indeed, we observed carboxypeptidase activity in lysates of cells transfected with ACE2-GFP but not with dACE2-GFP, and this activity was not affected by the addition of lysates of cells overexpressing dACE2-GFP (Fig. 7h, i).
DISCUSSION
ACE2 was recently proposed to be an ISG due to its induction in IFN-high conditions, raising concerns about its potential role in increasing SARS-CoV-2 infection4,5 and the safety of IFN-based treatments proposed for COVID-19. Our discovery of dACE2, a truncated version of ACE2 demonstrates that it is dACE2 and not ACE2 that is induced by IFNs and viruses, including SARS-CoV-2. Overexpressed recombinant dACE2, however, did not appear to bind SARS-CoV-2 spike-RBD or affect the binding of ACE2 in our in vitro experiments, thus suggesting that ISG-type induction of dACE2 would not increase viral entry.
Along with previously reported data3,4, our results indicate that the expression of both ACE2 and dACE2 is limited to specific cell populations and conditions, contributing to low levels of their expression when analyzed by bulk RNA-seq methods. Although sc-RNA-seq analyses provide more specific information about cell populations that express these transcripts, the commonly used 3’scRNA-seq methods do not discriminate between ACE2 and dACE2. Thus, dACE2 expression should be considered in expression studies of ACE2 by various methods (RNA-seq, microarrays or targeted expression assays). By analyses in multiple human cell types and tissues, we showed that expression of dACE2, but not ACE2, is inducible by IFNs (type I, II and III) and viruses that induce IFN responses. Suppression of IFN signaling by SARS-CoV-2 has been reported by several studies25,26, possibly explaining only a moderate effect of SARS-CoV-2 infection on dACE2 induction in our experiments. While the levels and the role of type I and III IFNs in COVID-19 remain controversial9,27–29, high levels of IFNγ in peripheral blood of patients with COVID-19 have been reported5. Thus, in tissues, dACE2 could be induced due to exposure to IFNγ-expressing immune infilltrates30–32. Specifically, a 3’-scRNA-seq analysis showed ACE2 induction by SARS-CoV-2 infection in ciliated epithelia, where high levels of IFNγ producing immune cells were also detected5. Our results strongly suggest that the induction of dACE2 and not ACE2 was detected in these patients.
We explored the extensive TCGA dataset of more than 10,000 tumors in which we de-novo quantified dACE2 expression based on RNA-seq data and concluded that IFNγ-driven ISG signatures can be contributed by tumor-infiltrating immune cells. These conclusions can be extended to inflamed virally infected tissues, for which comparable RNA-seq data is limited by small sample sets, a low percentage of mappable reads due to substantially degraded input RNA, or unavailability of raw data due to patient privacy restrictions. Furthermore, the expression patterns observed in TCGA indicated that dACE2 expression might be intrinsically enriched in squamous epithelial cells, which give rise to corresponding tumors of the respiratory, gastrointestinal, and urogenital tracts. We found that in normal primary bronchial respiratory cells, baseline expression levels of dACE2 were comparable to ACE2, and further strongly induced by IFN treatments, suggesting some cell-type specific role of dACE2, which should be further explored.
The detection of dACE2-specific peptides in some TCGA tumors and the predicted existence of dACE2 protein only in primates argue for its potentially important role. Although dACE2 expression was induced by IFNs and viruses in various human cell lines, the dACE2 was not detected in these cell lines by Western blotting with a C-terminal ACE2 antibody. The detection of endogenous dACE2 might require generating dACE2-specific antibodies. Alternatively, the translation of dACE2 mRNA might be tightly regulated to exist only in specific conditions, as has been found for several mRNAs33. Further studies are required to confirm dACE2 cell surface expression in stable expression systems. However, based on our in vitro data, we conclude that dACE2 does not increase the binding and cellular access of SARS-CoV-2 or serve as a carboxypeptidase. Extrapolation of these findings into biological and COVID-19 related mechanisms should be done with caution until confirmed by studies based on endogenous dACE2.
Although possible ISG-type ACE2 induction was considered as a risk for increasing SARS-CoV-2 infection, ACE2 deficiency rather than overexpression is discussed as a greater problem potentially contributing to COVID-19 morbidity11–13,34. Functional ACE2 deficiency occurs due to internalization of the SARS-CoV-2-ACE2 complex2,35, which restricts ACE2 from performing its physiological functions, including its role as carboxypeptidase for angiotensin II and des-Arg9-bradykinin and other peptide hormones. ACE2 deficiency might also be created due to its regulation at the mRNA level, such as through regulation by micro-RNAs (miRs). The downregulation of ACE2 protein levels by miR-200c-3p has been reported in vitro36. Since miR-200c-3p binds to the 3’UTR shared by ACE2 and dACE2, the ISG-type induction of dACE2 might serve as a decoy for binding miR-200c-3p and possibly other miRNAs and reduce the downregulation of ACE2 protein. Expression of miRNA-200c-3p is induced through the NF-kB pathway during infection with pandemic flu strain H5N1 and is associated with acute respiratory distress syndrome (ARDS)36. Signaling through the NF-kB pathway is hyper-activated by SARS-CoV infections37, suggesting that miRNA-200c-3p could also be upregulated in patients with COVID-19, possibly resulting in decreased levels of ACE2 protein. In these conditions, the ISG-type induction of dACE2 mRNA could be beneficial to preserve ACE2 protein levels. It will be important to examine this potential cross-talk between the ISG-type induction of dACE2 and its role in the regulation of ACE2 protein levels, especially in COVID-19 conditions.
Cancer patients are considered to be at a higher risk of more severe COVID-19 outcomes compared to the general population38,39 due to older age, comorbidities, and effects of cancer and cancer treatments. Lung cancer patients are at a specifically increased risk of severe COVID-19 outcomes38. In our analysis, dACE2 expression was common in tumors and particularly enriched in lung tumors of bronchial origin (LUSC), where the proper function of ACE2 is essential for protection from virus-induced tissue damage. The possible role of dACE2 expression and COVID-19 outcomes, specifically in cancer patients, should be further explored. ACE inhibitors (ACEIs) and angiotensin-receptor blockers (ARBs) are widely used to control hypertension and treat heart disease and chronic kidney disease10. Significant concerns were raised that ACEIs and ARBs could induce ACE2 expression, leading to increased SARS-CoV-2 infection and possibly accounting for COVID-19 severity and high mortality in those who are likely to use these medications - the elderly and patients with cardiovascular disease. We demonstrated that ACE2 expression is not inducible by IFNs, but it would be important to explore the effects of ACEIs and ARBs on dACE2 expression to properly assess this risk. The effects of other factors, such as smoking on ACE2 and dACE2 expression, should also be considered.
In conclusion, we present the first report of the discovery and functional annotation of dACE2, an IFN-inducible isoform of ACE2. The existence of two functionally distinct ACE2 isoforms reconciles several biological properties previously attributed to ACE2, with dACE2 being an ISG, and ACE2 acting as the SARS-CoV-2 entry receptor and carboxypeptidase, without being regulated by IFNs. While our understanding of the functional role of dACE2, a novel ISG, is still unfolding, we believe these insights will clarify our knowledge on ACE2 and provide new research leads in understanding COVID-19 susceptibility, mechanisms, and outcomes.
ONLINE METHODS
Cells
All cell lines and primary cells used are listed in Supplementary Table 3. Cell lines were either used within six months after purchase or were periodically authenticated by microsatellite fingerprinting (AmpFLSTR Identifiler, Thermo Fisher) by the Cancer Genomics Research Laboratory/NCI). All cell lines were regularly tested for mycoplasma contamination using the MycoAlert Mycoplasma Detection kit (Lonza). The previously described21 normal human bronchial epithelial (NHBE) cells were isolated from normal lungs that were not used for transplantation. The lungs were obtained from de-identified donors via a tissue retrieval service (International Institute for the Advancement of Medicine, Edison, NJ) with ethical approval from the Conjoint Health Research Ethics Board of the University of Calgary and the Internal Ethics Board of the International Institute for the Advancement of Medicine. Anonymized human tissue from colon resections was obtained from the University Hospital Heidelberg, in accordance with the recommendations of the University Hospital Heidelberg and written informed consent obtained from all subjects in accordance with the Declaration of Helsinki. The protocol (S-443/2017) was approved by the Ethics Commission of the University Hospital Heidelberg. Organoids were generated from these tissues, as previously described22.
Viral infections
Stocks of Sendai virus (SeV) Cantell strain were purchased from Charles River Laboratories. Cells listed in Supplementary Table 3 were infected in duplicates or triplicates with SeV (7.5×10⁵ CEID50/ml) for 12 hrs as previously described18–20. SARS-CoV-2 (strain BavPat1) was obtained from Prof. Christian Drosten at the Charité in Berlin, Germany, and provided via the European Virology Archive.
Infections with SARS-CoV-2 were done with MOI=1 in cell lines and 3×10⁵ FFU of the virus in organoids based on titers in Vero E6 cells. Infections in colon cancer cell lines (Caco2 and T84), lung cancer cell line (Calu3), and colon and ileum organoid cultures were previously described22. Lung cancer cells A549 (wild-type or stably overexpressing human ACE2 (ACE2-stable)) were seeded either in 48-well plates (for RNA) or on iBIDI glass-bottom 8-well chamber slides (for immunofluorescence analysis) at a density of 7.5×10⁴ cells/well or chamber. Cells were transduced 24 hrs post-seeding with lentiviruses expressing GFP or dACE2-Myc and infected 3 days post-transduction. Culture media was removed and the virus was added to cells for 1 hr at 37°C. After virus removal, cells were washed 1x with PBS, and media was added back to the cells. Cells were harvested 24 hrs post-infection for RNA extraction or were fixed in 4% paraformaldehyde (PFA) for 20 mins at room temperature (RT) for infectivity analysis by immunofluorescence staining, as was previously described22. Briefly, cells were washed and permeabilized in 0.5% Triton-X for 15 mins at RT. Mouse monoclonal antibody against SARS-CoV-2 nucleoprotein (Sino Biologicals) was diluted in PBS and incubated for 1 hr at RT. Cells were washed in 1X PBS three times and incubated with goat anti-mouse Alexa Fluor 568 (Molecular Probes) and DAPI for 45 mins at RT. Cells were washed in 1X PBS three times and imaged by epifluorescence on a Nikon Eclipse Ti-S (Nikon) to quantify the number of infected cells relative to the number of nuclei. It was determined that infection rates were 80% in Caco2 cells, ~20% in T84 cells, and ~10% in Calu3 cells and organoids22. Organoids from 3 donors were infected in 3–4 biological replicates that were averaged and presented as one value per donor.
PCR, cloning and Sanger sequencing
cDNA was synthesized from 250 ng of total RNA per 20 μl reactions using the RT2 First-Strand cDNA kit and random hexamers (Qiagen). PCR for the full-length dACE2 was performed using primers and conditions listed in Supplementary Table 4. PCR-amplified products were resolved on 1% agarose gel, cut, purified, and Sanger-sequenced. After cDNA sequences were validated, constructs for dACE2 with C-terminal Myc-DDK and GFP tags cloned in pcDNA3.4 vector were custom-synthesized by Thermo Fisher. ACE2 with C-terminal GFP-tag (RG208442) and Myc-DDK tag (RC208442) were purchased from Origene. Empty vectors pMax-GFP (Lonza) and pCMV6-AC-Myc-DDK (Origene) were used as controls.
Treatments with IFNs
All IFNs used are listed in Supplementary Table 5. IFN-treatment of NHBE cells was previously described21. Briefly, cells were cultured in BEGM with supplements (Lonza), seeded in 6-well plates and utilized at ~70% confluency (typically after 10–11 days with media change every 2 days). Cells were left untreated or treated with IFNα2b (INTRON A, Merck, 100 IU/ml) or IFNλ3 (R&D Systems, 100 ng/ml) for 24 hrs. Cells were washed with PBS, resuspended in TRIzol (Thermo Fisher) and stored at −80°C for future RNA isolation. IFN treatment of human colon and ileum organoids was previously described22. Briefly, at ~70% of cell confluence, media was replaced with a cocktail of IFNλ1–3 (100 ng/mL of each for a total of 300 ng/mL) for 24 hrs. T84 and Caco-2 cells were treated with IFNγ (2 ng/ml) for 24 hrs.
qRT-PCR
Total RNA was extracted using the RNAeasy kit (Qiagen) from all samples except for NHBEs, for which Direct-zol mini RNA isolation kit was used (Zymo Research). cDNA was synthesized from the total RNA with the RT2 First Strand kit (Qiagen, for all cell lines except for SARS-CoV-2-infected cells), Superscript VILO IV (Thermo Fisher, for HNBEs), or iSCRIPT cDNA kit (BioRad, for organoids and SARS-CoV-2-infected cell lines), always with an additional DNase I treatment step. qRT-PCR assays were performed in technical duplicates in 96- or 384-well plates on QuantStudio 7 (Life Technologies) or Bio-Rad CFX 96 instrument, with RT2 SYBR Green (Qiagen), POWER SYBR (Thermo Fisher), iTaq SYBR (BioRad) or TaqMan (Thermo Fisher) expression assays (Supplementary Table 4). The expression of target genes was normalized by geometric means of endogenous controls (GAPDH, HPRT1, TBP or ACTB, as indicated in Supplementary Table 2A), and presented as dCt values relative to endogenous controls (log2 scale). For cell lines, the analyses were based on biological replicates for samples obtained from donors (NHBEs and organoids), 3–4 biological replicates were averaged and presented per each donor.
RNA sequencing (RNA-seq) of T47D and RT4 cells
Total RNA was extracted from T47D and RT4 cells using RNeasy Mini kit with an on-column DNase digestion (Qiagen) and treated with Ribo-Zero (Illumina). RNA-seq libraries were prepared from high-quality RNA samples (RIN scores >9.0) with KAPA Stranded RNA-seq kit with RiboErase (Roche). Paired 150-bp reads (21.2 – 118.8 million reads per sample) were generated with HiSeq 2500 (Illumina) by the Cancer Genomics Laboratory (DCEG/NCI). The reads were aligned with STAR alignment tool version 7.1.2a (21) using the GRChg37/hg19 genome assembly and visualized using the Integrative Genomics Viewer (IGV).
RNA-seq analysis of data from NCBI Sequence Read Archive (SRA) and TCGA
RNA-seq datasets (Supplementary Table 6) were downloaded from NCBI SRA using SRA tools. The FASTQ files were compressed using GZIP and aligned with STAR version 7.1.3a to the human GRChg38/hg38 genome assembly. BAM files with ≤80% of mappable reads were excluded. BAM files were indexed and sliced using SAMtools to include 51.6 Kb of the human ACE2 genomic region (chrX:15,556,393–15,608,016, hg38). For non-human RNA-seq datasets, the alignment was done with reference genomes mm10 for mouse, and MusPutFur1.0 for ferret. For TCGA STAR-aligned RNA-seq data, BAM slices for the ACE2 region were acquired for 10, 898 TCGA samples (10,185 tumors and 713 tumor-adjacent normal tissues) through the NCI Genomics Data Commons (GDC) portal accessed on May 12, 2020, using workflow https://docs.gdc.cancer.gov/API/Users_Guide/BAM_Slicing/.
Estimation of RNA-seq read counts for ACE2 exons
RNA-seq reads corresponding to the ACE2-Ex1a and ACE2-Ex1b and dACE2-Ex1c, were counted by processing RNA-seq BAM slices using R package ASpli version 1.5.1 with default settings. Genomic coordinates were manually curated in the GTF file and the ‘counts’ function was used to generate and export RNA-seq reads for the selected exons in a tab file format. The analysis of exon expression patterns within tissue subtypes was based on log 2-transformed raw reads for each exon. The reads were normalized by dividing by the exon length (Supplementary Table 7) and multiplying by the geometric mean of the total reads of the three exons (Ex1a, Ex1b and Ex1c) across all samples as a scaling factor to adjust for variability in sequencing coverage between samples. Correlation analyses of log2 (normalized exon expression+1) of ACE2-Ex1a, ACE2-Ex1b and dACE2-Ex1c with log2 (TPMs+1) of IFNs, STATs, IRFs and select ISG controls (ISG15 and ISG20) were performed in R using package dplyr.
Expression values for all IFN genes for all tumors in TCGA PanCancer Atlas were downloaded as RSEM values from cBioPortal for Cancer Genomics (https://www.cbioportal.org/). Expression of IFNL4, a most recently discovered IFN40, was not available in TCGA dataset based on hg19/GRCh37 reference. Because IFNG was expressed in most samples compared to other IFN genes (Extended Data Fig. 5a), it was used for further analysis. Correlation analyses of the log2 (normalized exon expression+1) of ACE2-Ex1b and dACE2-Ex1c were performed with log2(RSEM+1) values for IFNG. Correlation patterns between IFNG and ACE2-Ex1a were similar to those between IFNG and ACE2-Ex1b (data not shown). Correlation analyses were performed with Spearman and Pearson methods and provided similar results. The P-values and coefficients presented are for Pearson correlations.
Unsupervised clustering and correlation analyses in TCGA
Gene expression Z-scores in the lung squamous cell carcinoma (TCGA-LUSC, n=501) dataset were calculated for 270 ISGs from a previously curated list23. ISGs with low expression values (below 10 reads), or expressed in less than 5% of tumors were excluded. The data was used for self-organizing maps (SOM) clustering, which is an unsupervised machine learning approach enabling data dimensionality reduction without relying on any assumption about the data structure41,42. The SOM algorithm was iterated 100,000 times with Euclidean distance, linearly decreasing the learning rate from 0.05 to 0.01 using the “Kohonen” R package. The ISG expression patterns were projected onto a two-dimensional 10×10 hexagonal map. Thus, each node in this map is an expression profile representing a subset of the samples. SOM output, trained based on 100,000 iterations, was used to estimate the contribution of each ISG to defining the clusters as a variance weighted according to the size of each node. A total of 6 clusters were estimated by kmeans algorithm and used to generate an expression heatmap. Expression Z-scores of the top 100 ISGs ranked based on their contribution to defining the clusters were plotted using the “pheatmap” R package. Pearson correlation coefficients and corresponding FDR-adjusted p-values were calculated between Z-scores for the top 100 ISGs and both ACE2 and dACE2 in cluster 5, which included 114 tumors with the highest ISG expression. The analysis was performed using the “Hmisc” R package.
In silico analysis of promoter regulatory elements relevant for IFN signaling
Promoters were defined within the −800 bp/+100 bp window from the corresponding transcription start sites (TSS). The window was limited by 800 bp, based on the intronic distance between TSS of Ex1c and its upstream exon. Promoters of ACE2-Ex1a (P1), ACE2-Ex1b (P2) and dACE2-Ex1c (P3) were analyzed using Nsite tool43 from the online bioinformatics gateway Softberry (www.softberry.com) to predict transcription factor binding sites. The search was set against the ooTFD (Object-oriented Transcription Factors Database) of human and animal transcription factor binding sites largely curated according to the functional data from the literature. The parameters were set to allow a maximum of 1 or 2 mismatches with the known motifs. ISG-type motifs were manually curated from ~300 predicted and annotated motifs per promoter.
Luciferase promoter assays
ACE2-P1, ACE2-P2, and dACE2-P3 promoters (here defined as −800/−1 bp from the corresponding TSS), and two variants of the dACE2-P3 promoter with 100 bp deletions harboring predicted ISG-type motifs (Fig. 2b), were custom-synthesized by Thermo Fisher and cloned upstream of the Luciferase reporter in a promoterless vector pGL4.21 (Promega) using Xho1 and HindIII restriction sites. HepG2 cells were seeded in 96-well plates (4×10³ cells/well) and 24 hrs after plating transiently co-transfected with the corresponding Luciferase constructs together with a normalization control (Renilla pGL4.74 plasmid, Promega, in a 10:1 ratio), in 6 biological replicates per construct. Media was changed 6 hrs after transfection and cells were treated with IFNβ (1 ng/ml, R&D Systems), IFNγ (2 ng/ml, R&D Systems) or media (mock) starting from 48 hrs post-transfection. After 6 hrs of treatment, cells were lysed and analyzed with GloMax multi-detection system (Promega) and Luciferase levels in each well were normalized to corresponding Renilla levels. The results were normalized by respective mock-treated controls and presented as fold change over negative control (empty pGL4.21vector).
Mining of proteomics datasets
Mass-spectrometry datasets generated for TCGA colon, breast and ovarian tumors (http://www.pepquery.org/) were mined for matches to the 36-aa fragment of dACE2, including the unique 10 aa encoded by dACE2-Ex1c. The analysis was done with PepQuery peptide-centric search engine24, using the following parameters: MS dataset of a specific cancer type; target event as protein; scoring algorithm as Hyperscore and not selecting for Unrestricted modification filtering. The identified peptides for each cancer type were exported as CSV files and manually analyzed for further assessment of peptide quality.
Transient transfections
Transient transfections were performed with Lipofectamine 3000 (Thermo Fisher). Unless specified, T24, a bladder cancer cell line in which no baseline expression of ACE2 or dACE2 was detected (Supplementary Table 2A), was used for transfections at 70–90% confluency in 12- or 6-well plates for 24 hrs.
Western blot
Cells were lysed with RIPA buffer (Sigma) supplemented with protease inhibitor cocktail (Promega) and PhosSTOP (Roche) and placed on ice for 30 min, with vortexing every 10 min. Lysates were pulse-sonicated for 30 sec, with 10 s burst-cooling cycles, at 4°C, boiled in reducing sample buffer for 5 min and resolved on 4–12% Bis-Tris Bolt gels and transferred using an iBlot 2 (Thermo Fisher). Blots were blocked in 2.5% milk in 1% TBS-Tween before staining with antibodies (Supplementary Table 5). The signals were detected with HyGLO Quick Spray (Denville Scientific) or SuperSignal West Femto Maximum Sensitivity Substrate (Thermo Fisher) and viewed on a ChemiDoc Touch Imager with Image Lab 5.2 software (BioRad).
Cell surface biotinylation and pull-down with streptavidin beads
T24 cells were transiently transfected with dACE2-Myc, ACE2-Myc or both constructs for 24 hrs. Cell surface biotinylation and pull-down with streptavidin beads were done using the Pierce Cell Surface Biotinylation and Isolation kit (Thermo Fisher). Briefly, the cell surface of T24 cells was biotinylated using EZ-Link Sulfo-NHS-SS-Biotin. Cells were lysed with RIPA buffer (Sigma) supplemented with protease inhibitor cocktail (Promega) and PhosSTOP (Roche) and placed on ice for 30 mins, with vortexing every 10 mins. Lysates were pulse-sonicated for 30 s, with 10 s burst-cooling cycles, at 4°C. Biotinylated proteins were isolated with Neutravidin beads supplied with the kit. Input lysates and pull-down proteins from biotin + and biotin− fractions were analyzed by Western blotting with the C-terminal ACE2 antibody (Abcam) as described above and anti-GAPDH antibody (Abcam).
Confocal microscopy
T24 cells were transiently transfected with ACE2-GFP, dACE2-Myc, or co-transfected with both constructs in 4-well chambered slides (2×10⁴ cells/well, LabTek). After 24 hrs, cells were treated with 2 ng/ml of recombinant biotinylated SARS-CoV-2 spike protein RBD (spike protein-RBD, Sino Biological) for 1 hour at 37°C. Cells were washed twice with media and then stained with 5 μg/ml streptavidin PE (Thermo Fisher) for 30 min at 37°C. Cells were then washed twice with PBS and fixed with 4% paraformaldehyde (BD Biosciences) for 30 min. After rinsing twice in PBS and permeabilization buffer (BD Biosciences), cells were incubated with permeabilization buffer for 1 hr. Fixed cells were incubated with rabbit anti-FLAG antibody (1:250 dilution, Thermo Fisher) overnight, washed and then stained with anti-rabbit Alexa Fluor 680 (1:500 dilution, Thermo Fisher). Slides were mounted with antifade mounting media with DAPI (Thermo Fisher) and imaged at 40X magnification on an LSM700 confocal laser scanning microscope (Carl Zeiss) using an inverted oil lens.
Flow cytometry analysis of SARS-CoV-2 spike protein-RBD binding
T24 cells were transiently transfected with ACE2-GFP, dACE2-Myc, or co-transfected with both constructs in 12-well plates (1×10⁴ cells/well). After 24 hrs, cells were stained with recombinant biotinylated spike protein RBD as described above and analyzed with multiparametric flow cytometry on a FACS Aria III (BD Biosciences) and FlowJo.v10 software (BD Biosciences).
Carboxypeptidase activity assays
T24 cells were plated overnight in T-25 flasks (5×10⁵ cells/flask) and transiently transfected with 10 μg of ACE2-GFP, dACE2-GFP, or empty GFP-vector. After 24 hrs post-transfection, cells were pelleted and lysed with 400 μl of Lysis Buffer provided with the ACE2 activity kit (#K897, BioVision). Keeping the reaction volumes and the amount of ACE2-GFP lysates constant, we added dACE2-GFP lysate in the ratio of 0.25, 0.5 and 1.0 to ACE2-GFP, with differences in volume compensated by lysates from GFP-expressing cells. The lysate mixtures were processed in triplicates using the kit reagents and according to protocol. The carboxypeptidase activity was measured as fluorescence (Ex/Em = 365/410–460 nm) using a Promega GlowMax plate reader for two time points between 30 mins and 2 hrs after adding the corresponding substrate mix. A positive control was provided by the kit. Cell lysates were also analyzed by Western blots with C-terminal anti-ACE2 antibody (Abcam), that detects both ACE2 and dACE2, with GAPDH as a loading control.
Statistical analysis
Expression of ACE2-Ex1a, ACE2-Ex1b and dACE2-Ex1c between groups of samples was evaluated by the two-sided tests: unpaired non-parametric Mann–Whitney U test, paired Student’s T-test (for NHBE cells from 5 donors and organoids for 3 donors) and unpaired Student’s T-test (for biological replicates of cell lines and organoids from 1 donor). Statistical tests for other analyses are indicated in corresponding sections. FDR adjustment was applied when indicated. P-values <0.05 were considered significant.
Computational resources
We used the NIH Biowulf supercomputing cluster and specific packages for R version 3.6.2.
Data availability:
The sequence for dACE2 was deposited to NCBI GenBank with accession number MT505392 The data used in the paper is presented in Supplementary Materials. Please address requests for any additional data or reagents to Ludmila Prokunina-Olsson (prokuninal@mail.nih.gov).
Extended Data
Extended Data Fig. 1. ACE2 expression patterns in the mouse and human lung cells infected with the respiratory syncytial virus (RSV) and nasal washes from ferrets infected with SARS-CoV-2.

a, Sashimi plots of the Ace2 region in a lung RNA-seq dataset from mice mock/RSV-infected in triplicates. The expression of dAce2-Ex1c is not observed and Ace2 expression is not affected by the infection. b, Sashimi plots of the ACE2 region in H292, a human lung mucoepidermoid pulmonary carcinoma cell line. Expression of ACE2 from Ex1a and Ex1b is very low, while the dACE2 from Ex1c is expressed at baseline and is further induced by RSV infection. c, Representative IGV plots showing exon and exon-exon junction RNA-seq reads from nasal washes of mock/SARS-CoV-2-infected ferrets. The expression of dAce2-Ex1c is not observed. Note: The mouse and human/ferret ACE2/Ace2 genes are shown in opposite orientations, as presented in IGV. The positions corresponding to the human dACE2-Ex1c are marked in the mouse and ferret genomes.
Datasets: PRJNA588982, PRJNA61503.
Extended Data Fig. 2. ACE2 and dACE2 expression in normal human tissues.
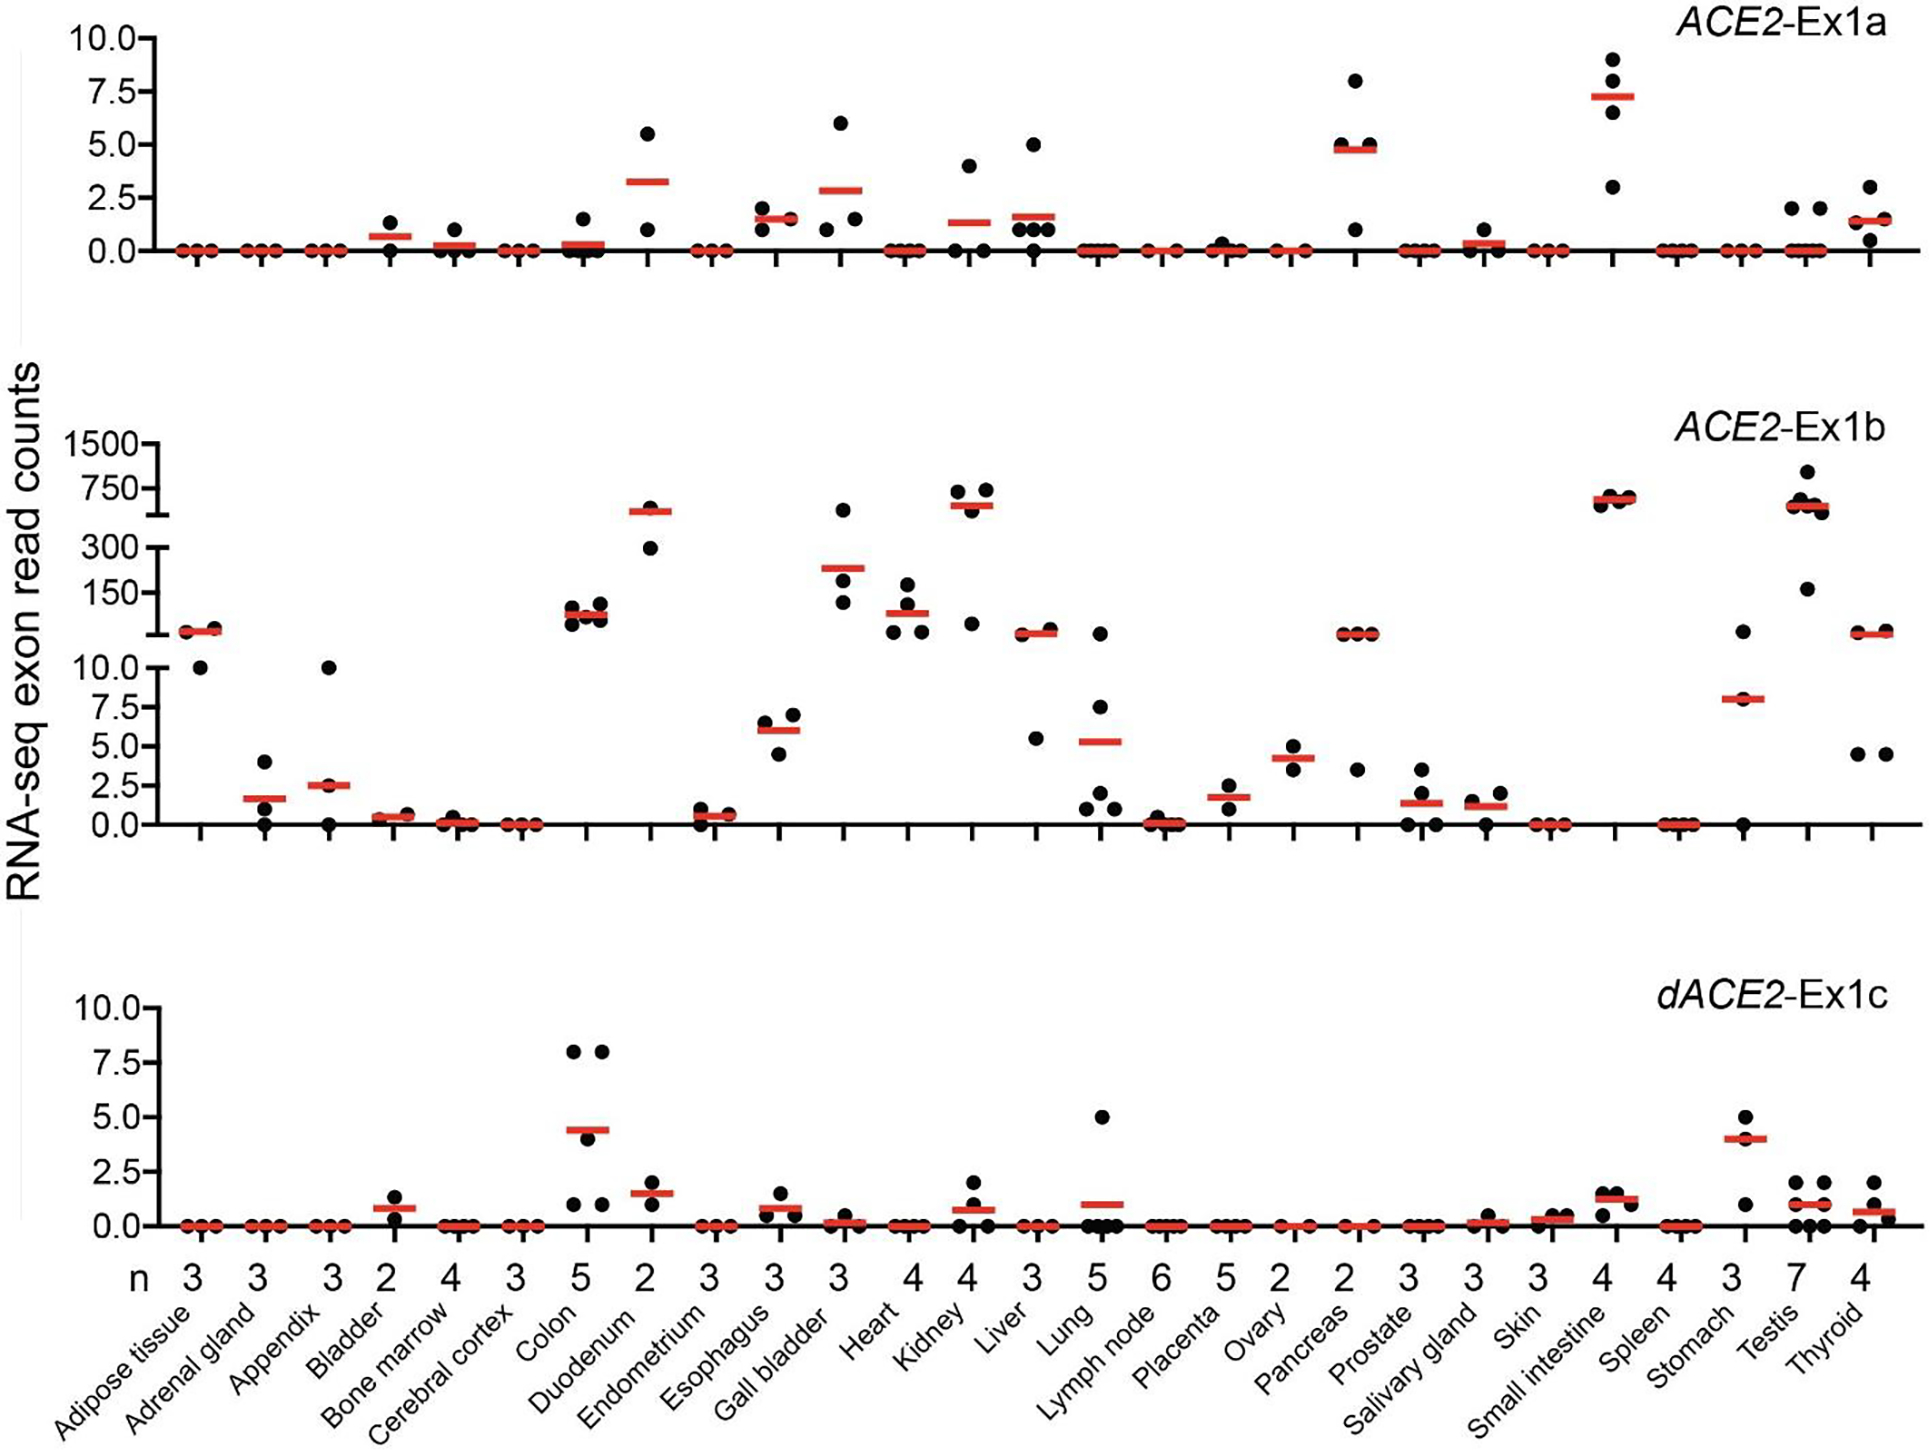
RNA-seq read counts for ACE2-Ex1a, ACE2-Ex1b, and dACE2-Ex1c in 27 human tissues. Dataset: PRJEB4337, n = 95.
Extended Data Fig. 3. ACE2 and dACE2 expression in tumor-adjacent normal tissues in TCGA.
Based on RNA-seq read counts, ACE2-Ex1b is detectable in multiple samples of several tissue types. dACE2-Ex1c expression is more restricted and most common in normal tissue adjacent to tumors of head and neck (HNSC), stomach (STAD), lung squamous carcinoma (LUSC), colon (COAD), and esophagus (ESCA).
Extended Data Fig. 4. ACE2 and dACE2 expression across 10,185 tumors of 33 types in TCGA.
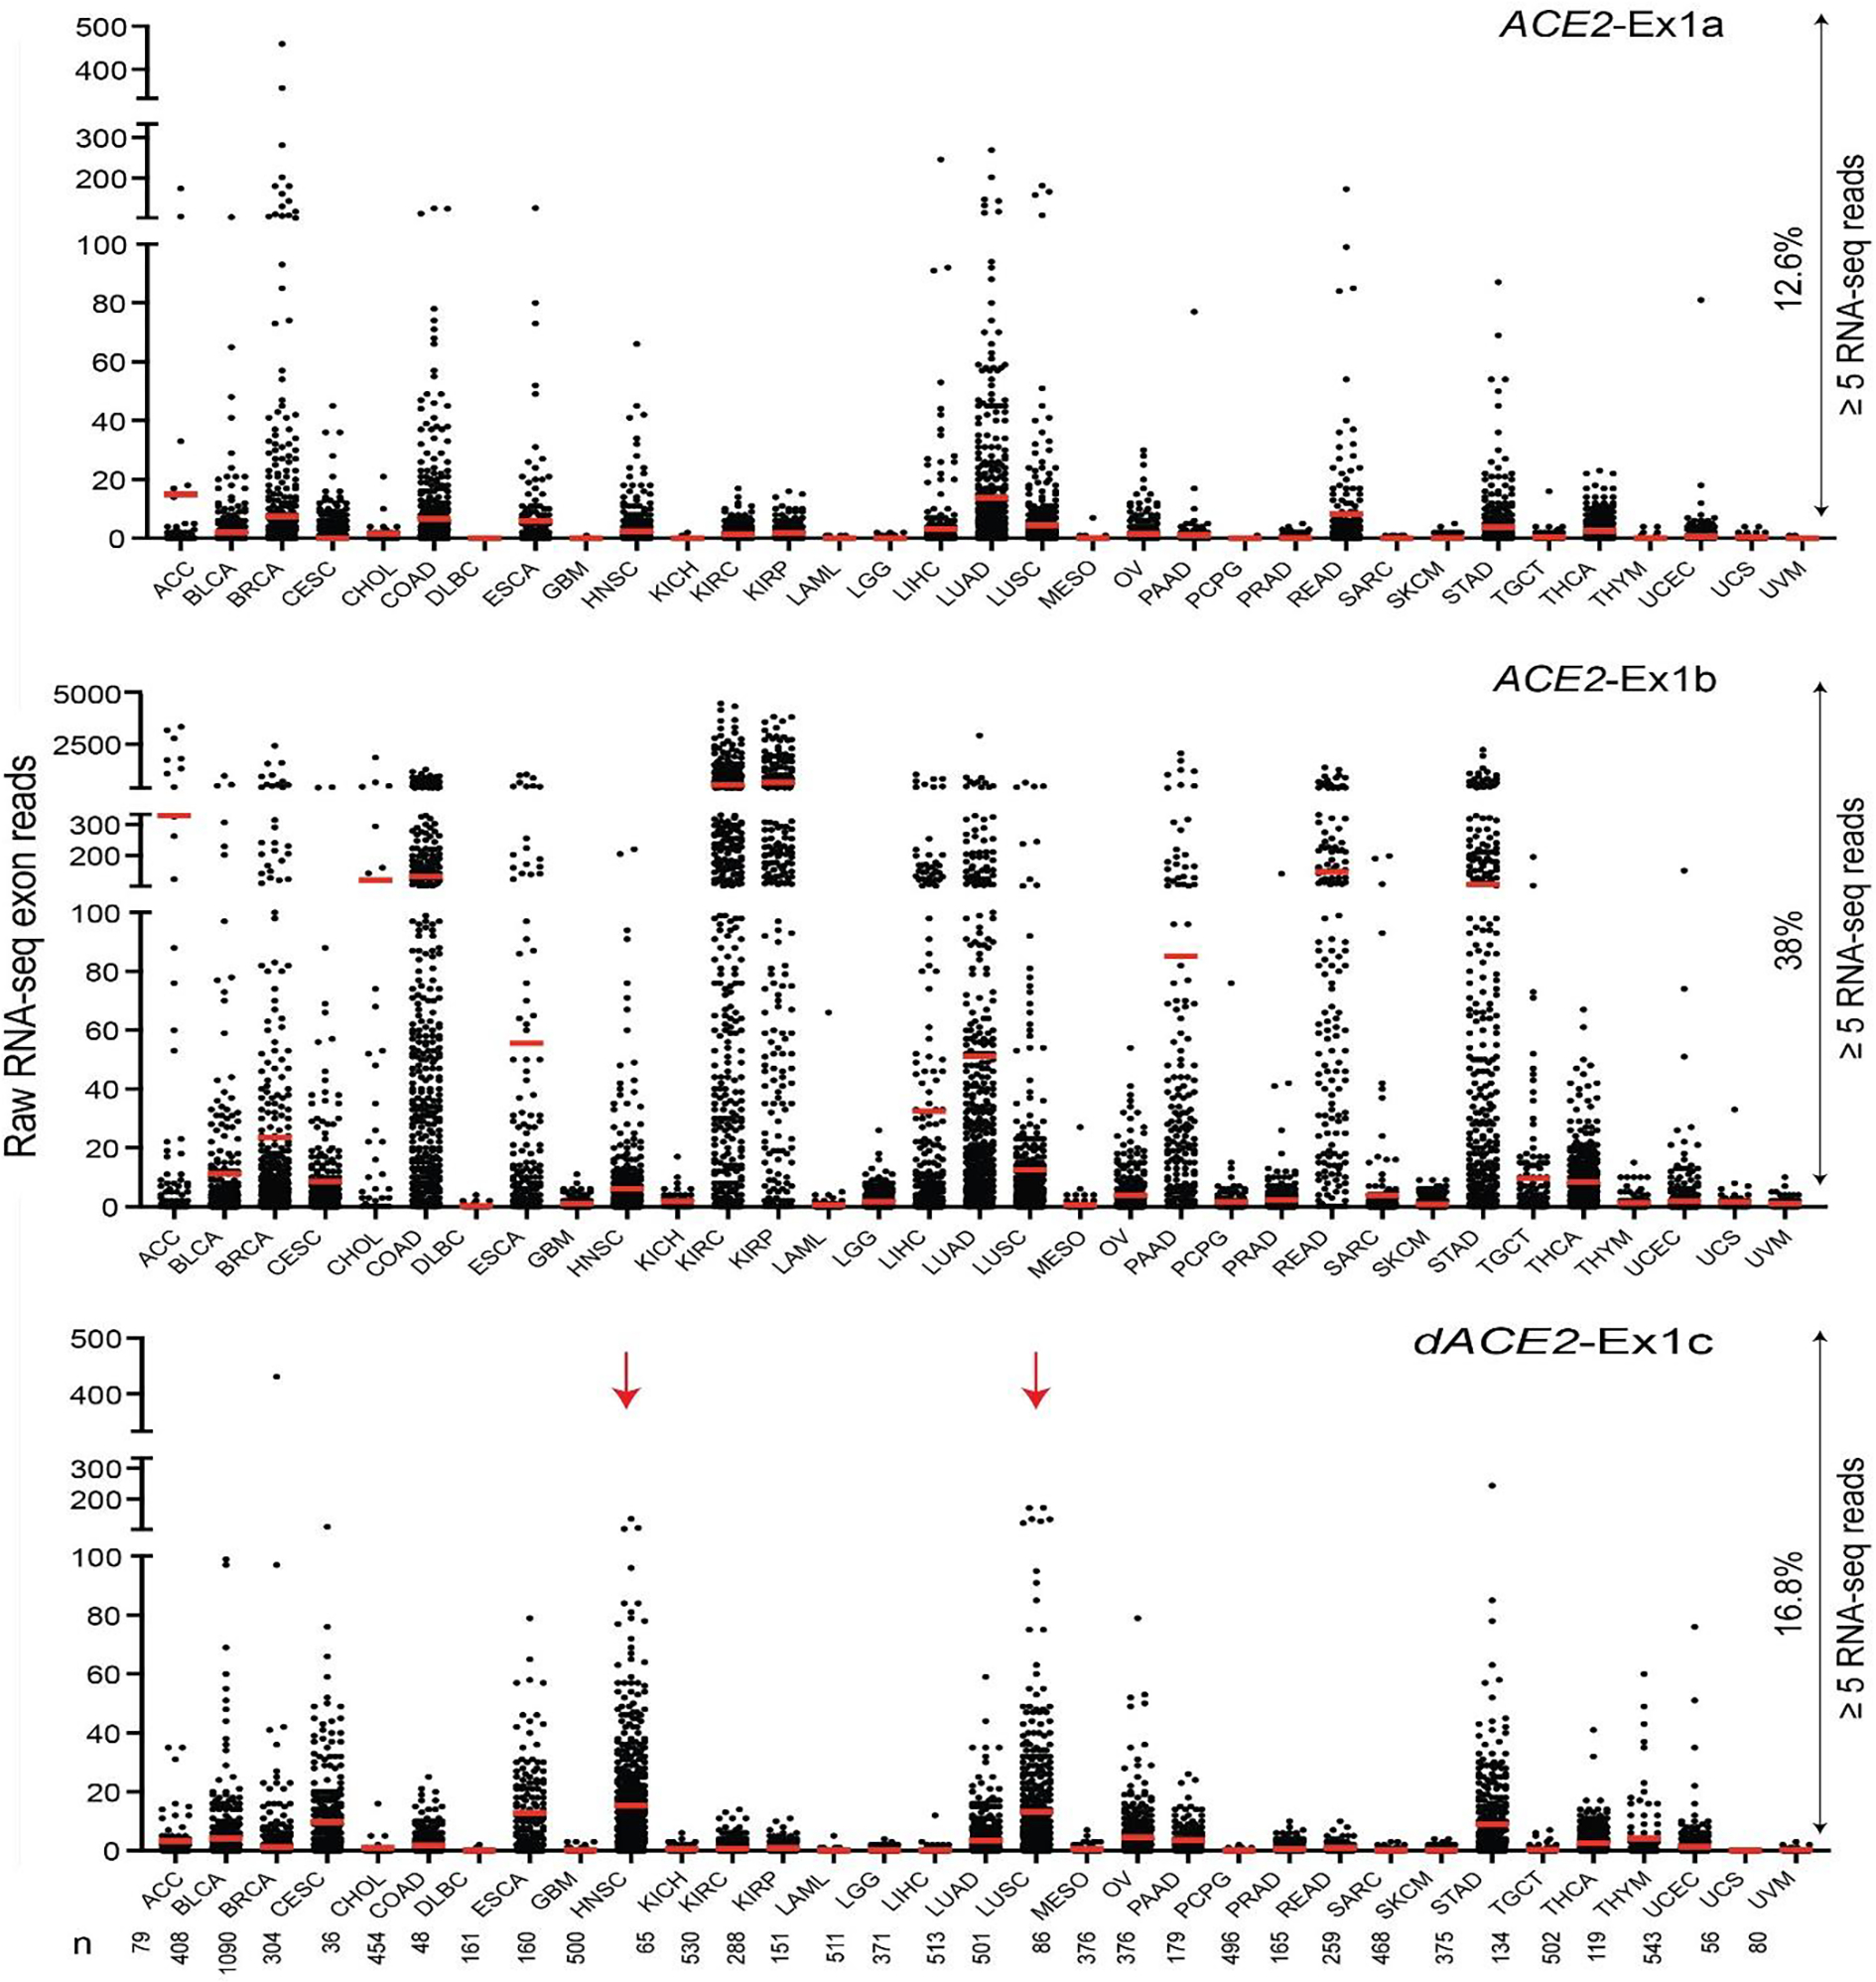
Based on RNA-seq read counts, ACE2-Ex1b is most expressed in kidney tumors—kidney renal clear cell carcinoma (KIRC) and kidney renal papillary cell carcinoma (KIRP). Most samples expressing dACE2-Ex1c are squamous tumors of head and neck (HNSC) and the lungs (LUSC). Based on a ≥ 5 reads/sample threshold, ACE2-Ex1a is expressed in 12.6%, ACE2-Ex1b – in 38.0% and dACE2-Ex1c—in 16.8% of all tumors.
Extended Data Fig. 5. dACE2 and ACE2 expression in relation to IFNG expression in TCGA tumors and in cells treated with IFNγ.

a, Expression levels of all IFN genes annotated in TCGA tumors (n = 10,185) were acquired from cBioPortal (https://www.cbioportal.org/); expression of IFNL4 was not annotated in this dataset. At RSEM ≥ 1, only expression of IFNG is common (61% samples), with mean RSEM = 19.8 compared to other IFN genes (mean RSEM ≤ 1.3). b, and c, Pearson correlation coefficients (r) for dACE2 and ACE2 vs. IFNG expression across tumors. dACE2 showed significant positive correlations (r ≥ 0.2) with IFNG in 8 tumor types, while ACE2 showed mainly negative correlations and only one positive correlation in breast cancer (r = 0.15). Expression values for dACE2 and ACE2 were based on log2-normalized exon read counts (Ex1b and Ex1c) and for IFNG—on RSEM values. d, Treatment of cell lines with IFNγ (2 ng/ml for 24 hrs) induced expression of dACE2 but not ACE2 in T84 cells. The results are presented with means + /- SD for three biological replicates; P-values are for the unpaired, two-sided Student’s T-tests.
Extended Data Fig. 6. Unsupervised self-organizing map (SOM) analysis in TCGA-LUSC tumors.
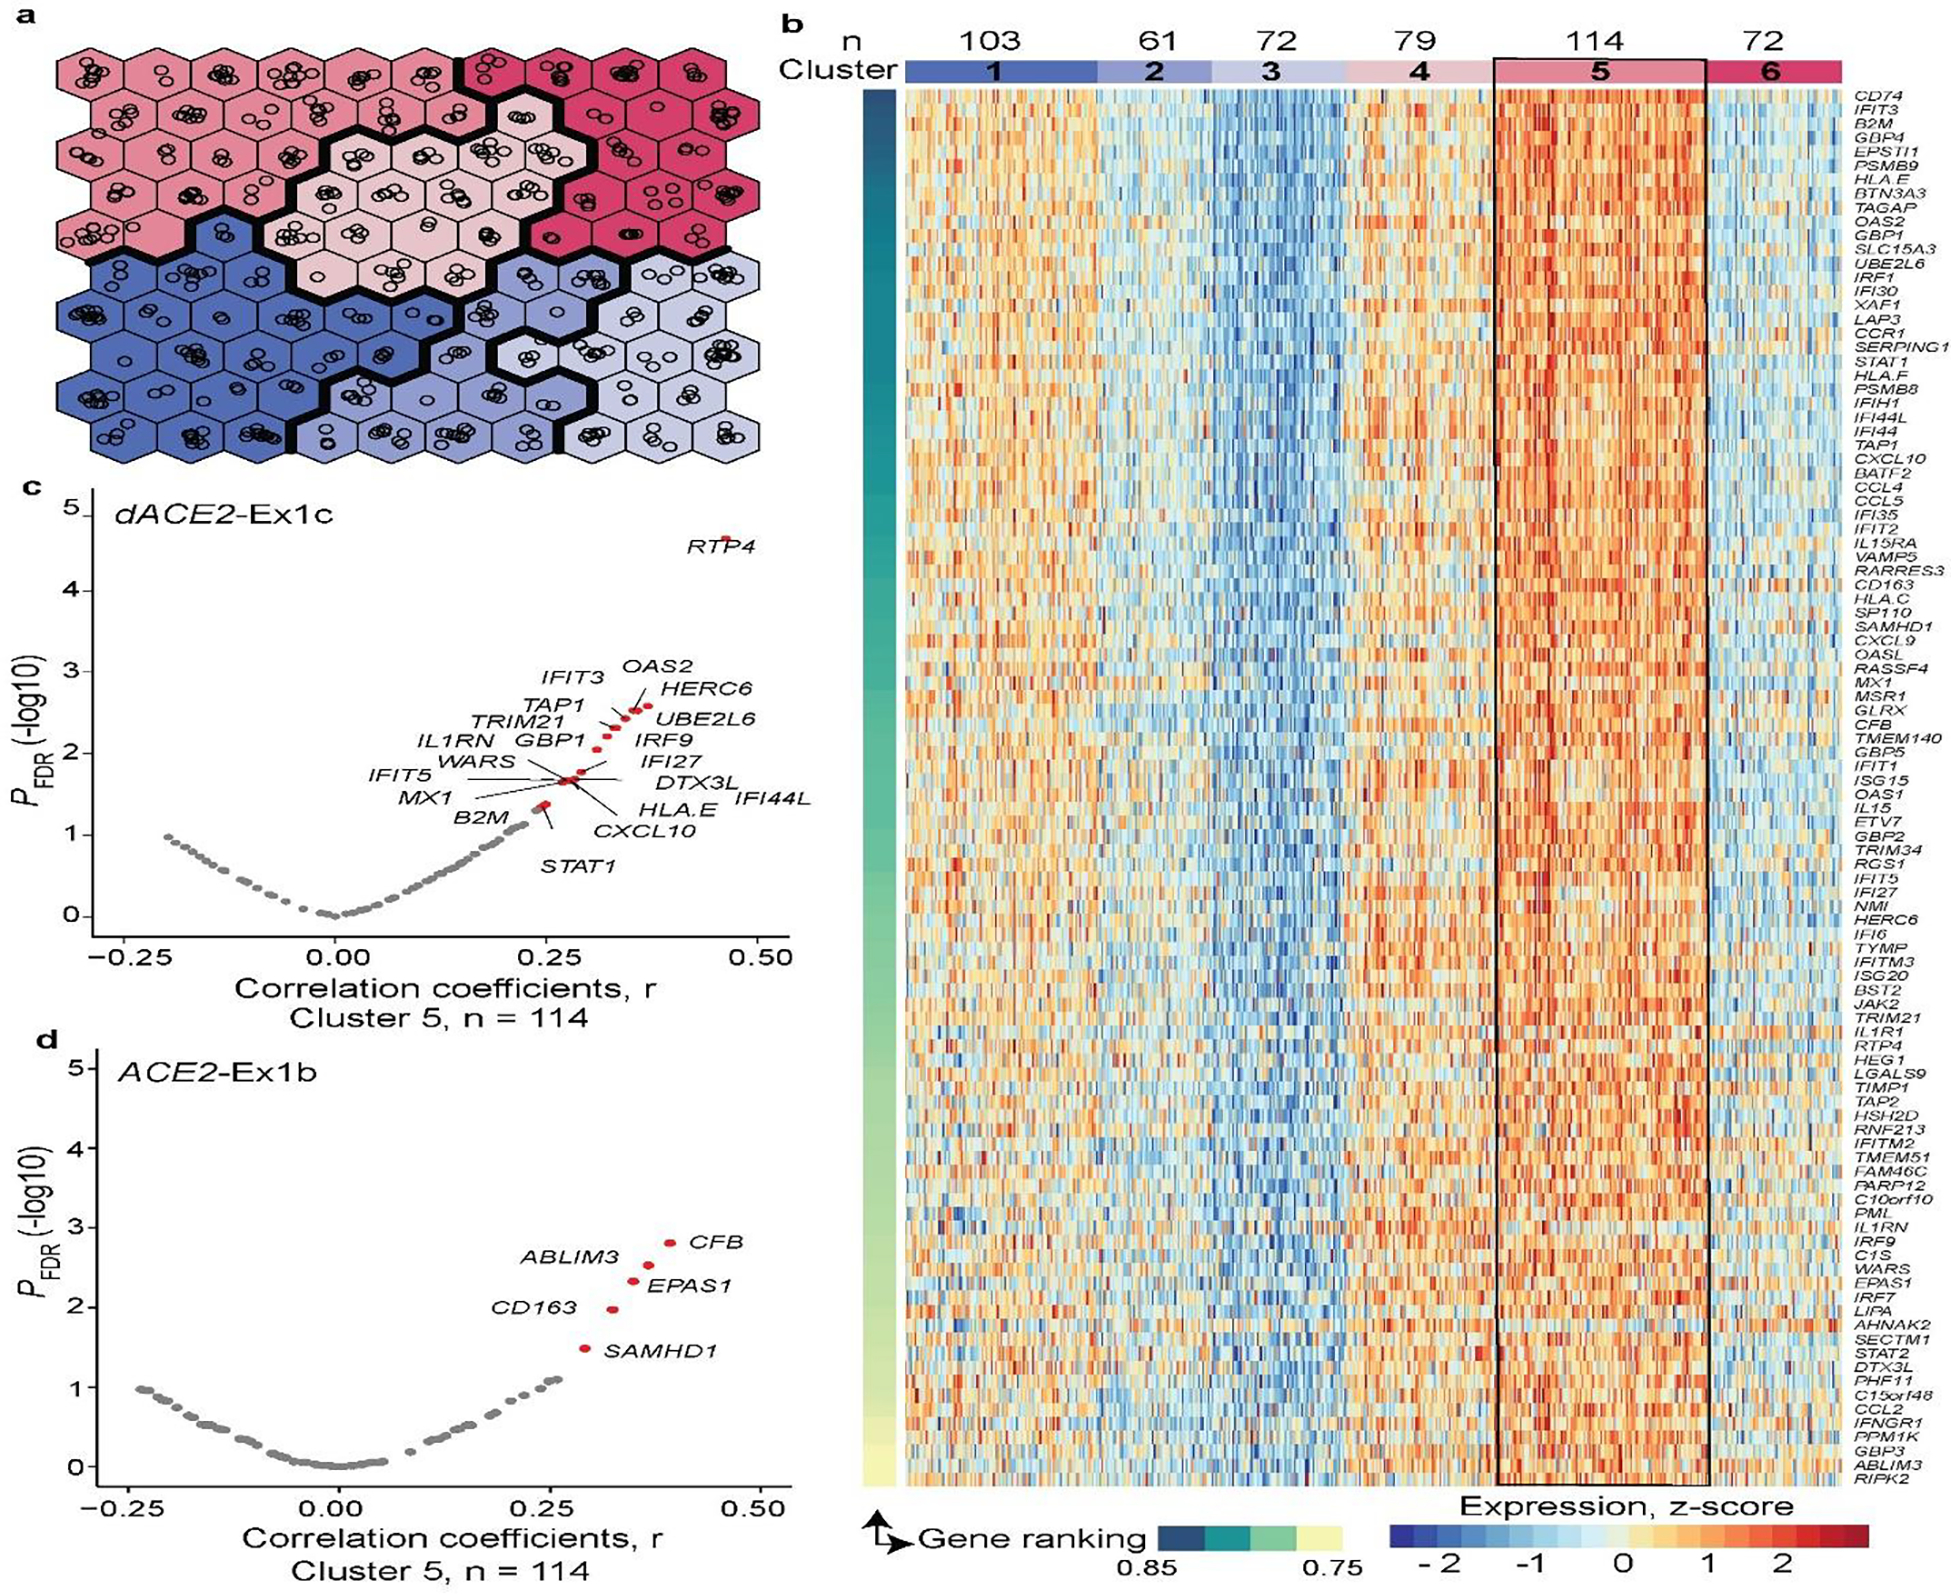
a, Construction of the unsupervised SOM of TCGA-LUSC tumors (n = 501) based on Z-scores calculated for each of the 270 curated ISGs. Each hexagon includes a mean of 5 (range 1–14) tumors with similar ISG expression profiles. Colors denote clusters (1–6) of tumors with similar ISG expression profiles. b, Heatmap of the six SOM-defined clusters, visualized by plotting the expression levels of top 100 ISGs selected by the ranking of the initial set of 270 ISGs based on their contribution to these clusters. Cluster 5 includes 114 tumors with the highest ISG expression, whereas cluster 3 includes 72 tumors with the lowest ISG expression. c, and d, Volcano plots showing FDR-adjusted p-values and Pearson correlation coefficients (r), for two-sided tests, for expression of dACE2 and ACE2 in relation to the expression of the top 100 ISGs within cluster 5. In total, dACE2 was significantly (FDR p-value < 0.05) correlated with the expression of 20 ISGs and ACE2—with 5 ISGs.
Extended Data Fig. 7. Peptides encoded by dACE2-Ex1c are detected by protein sequencing in tumors.
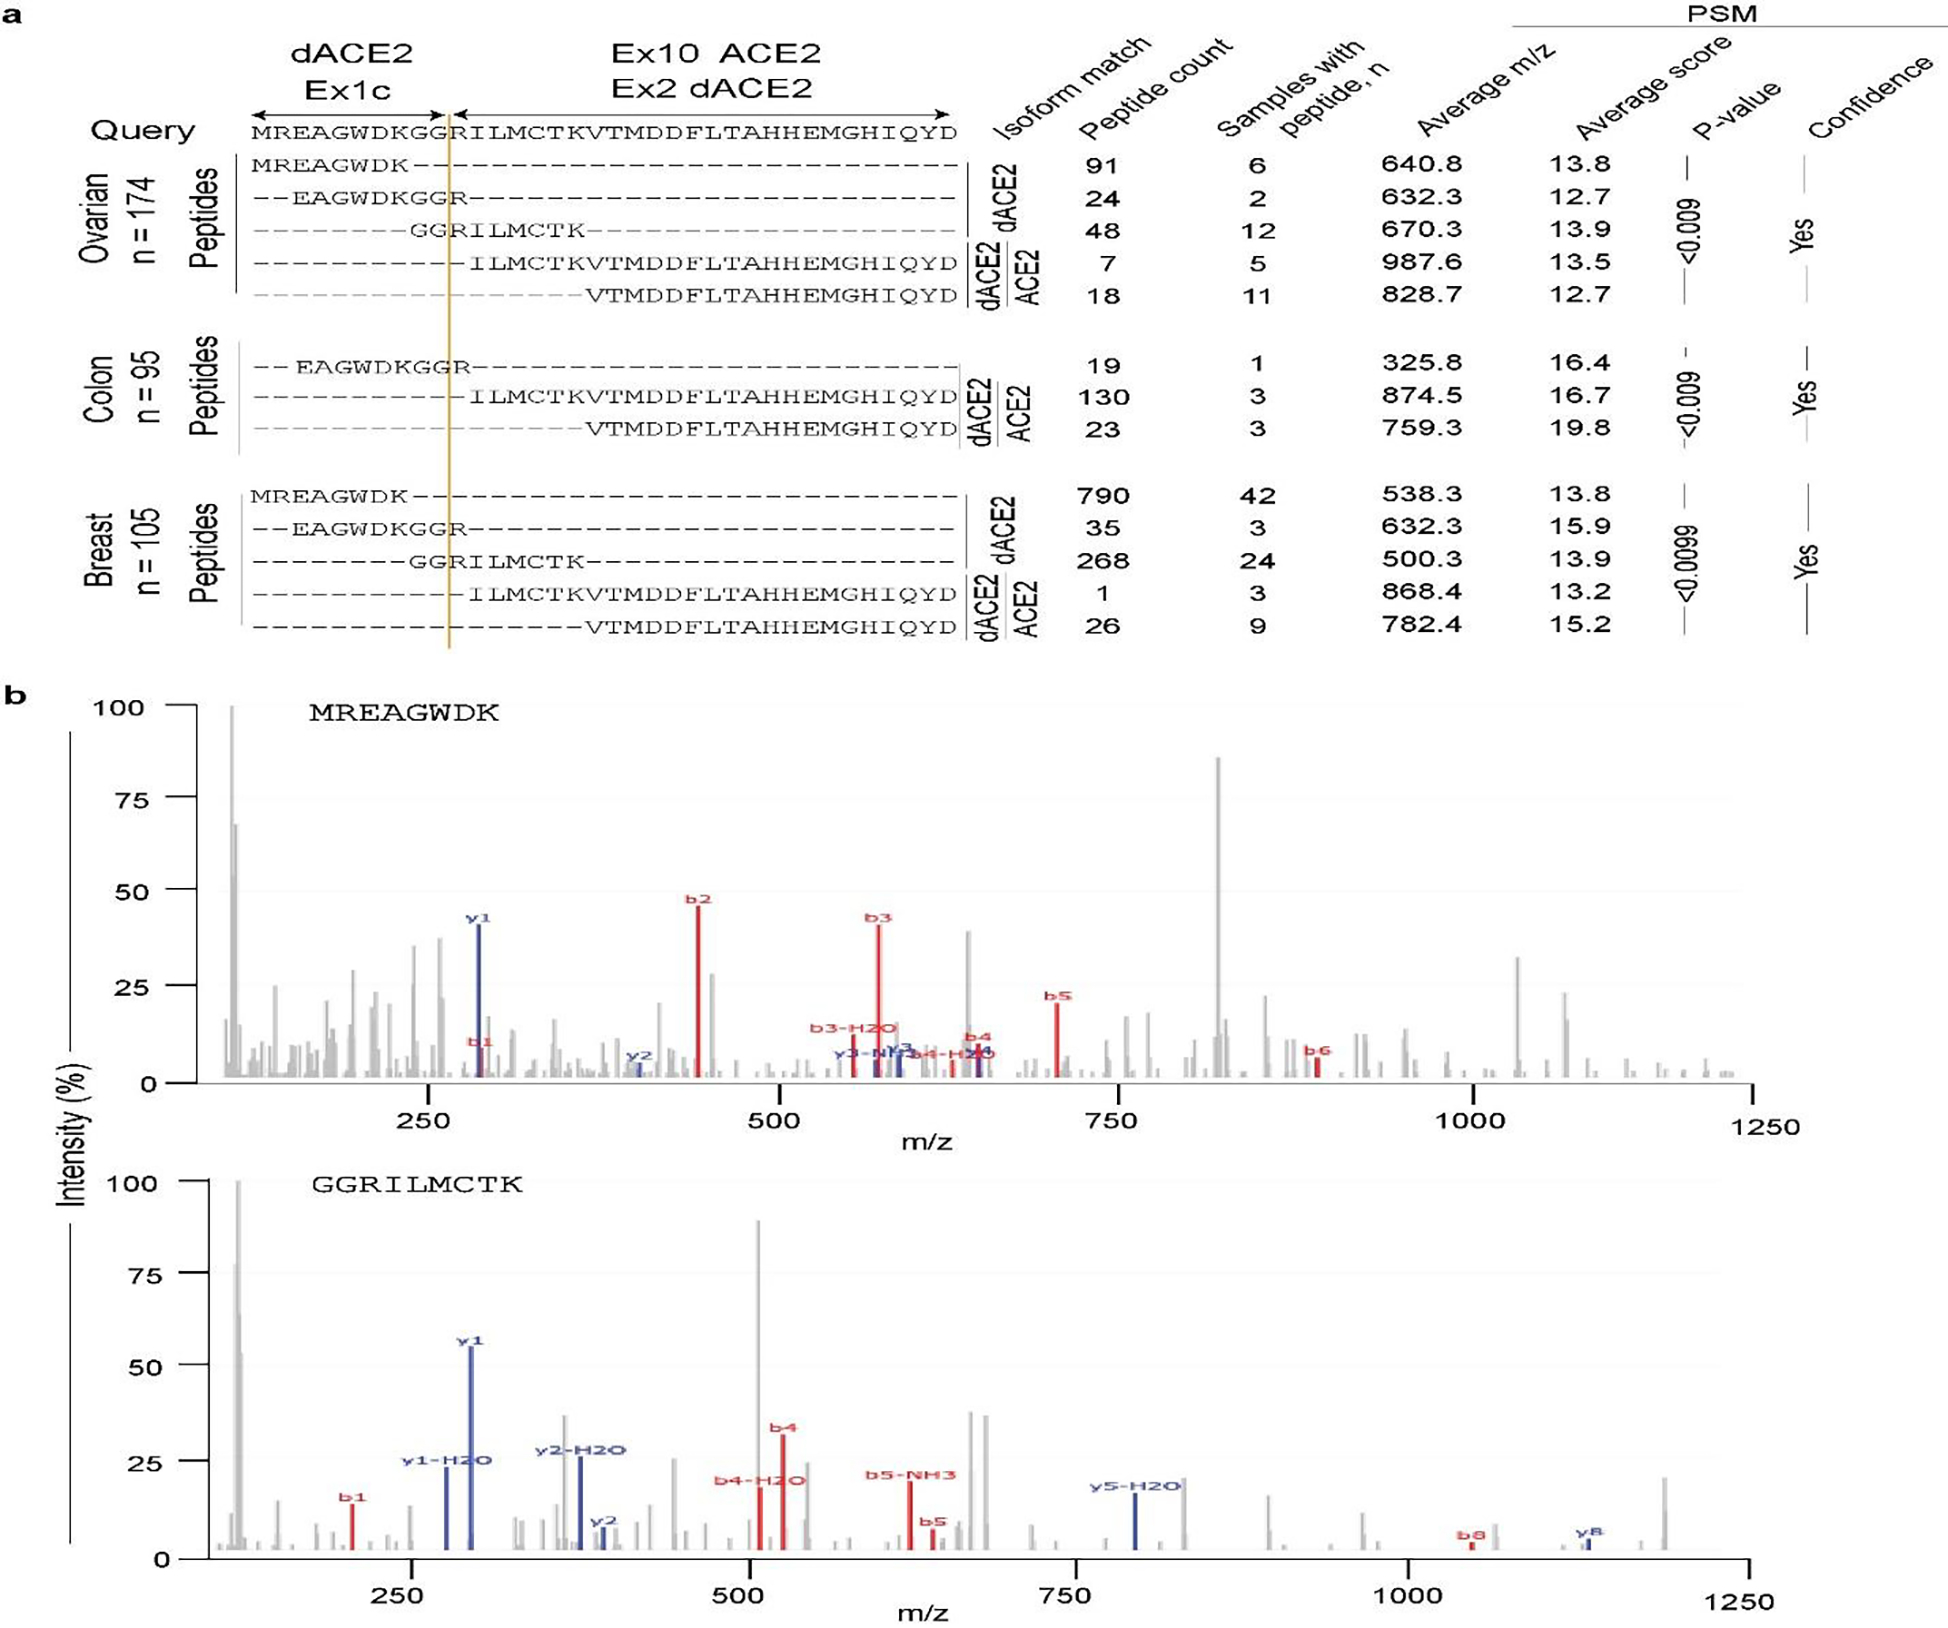
a, Results of peptide query in PepQuery2 proteomics database of mass-spec data in 174 ovarian, 95 colon, and 105 breast tumors in TCGA7. Three peptides – MREAGWDK, EAGWDKGGR, and GGRILMCTK uniquely correspond to the 10 aa encoded by dACE2-Ex1c. The latter peptide results from the splicing of dACE2-Ex1c with its downstream exon. The total number of identified peptides, the number of samples with specific peptides, and corresponding parameters for a peptide-spectrum match (PSM) are shown in table format. b, Representative spectra of two peptides matching with the protein encoded by dACE2-Ex1c. M/z refers to the mass by charge ratio. The b-series and y-series ions showed the correct mapping of residues in the query aa sequence.
Extended Data Fig. 8. Transiently overexpressed ACE2-GFP and dACE2-GFP are detectable on the cell surface.
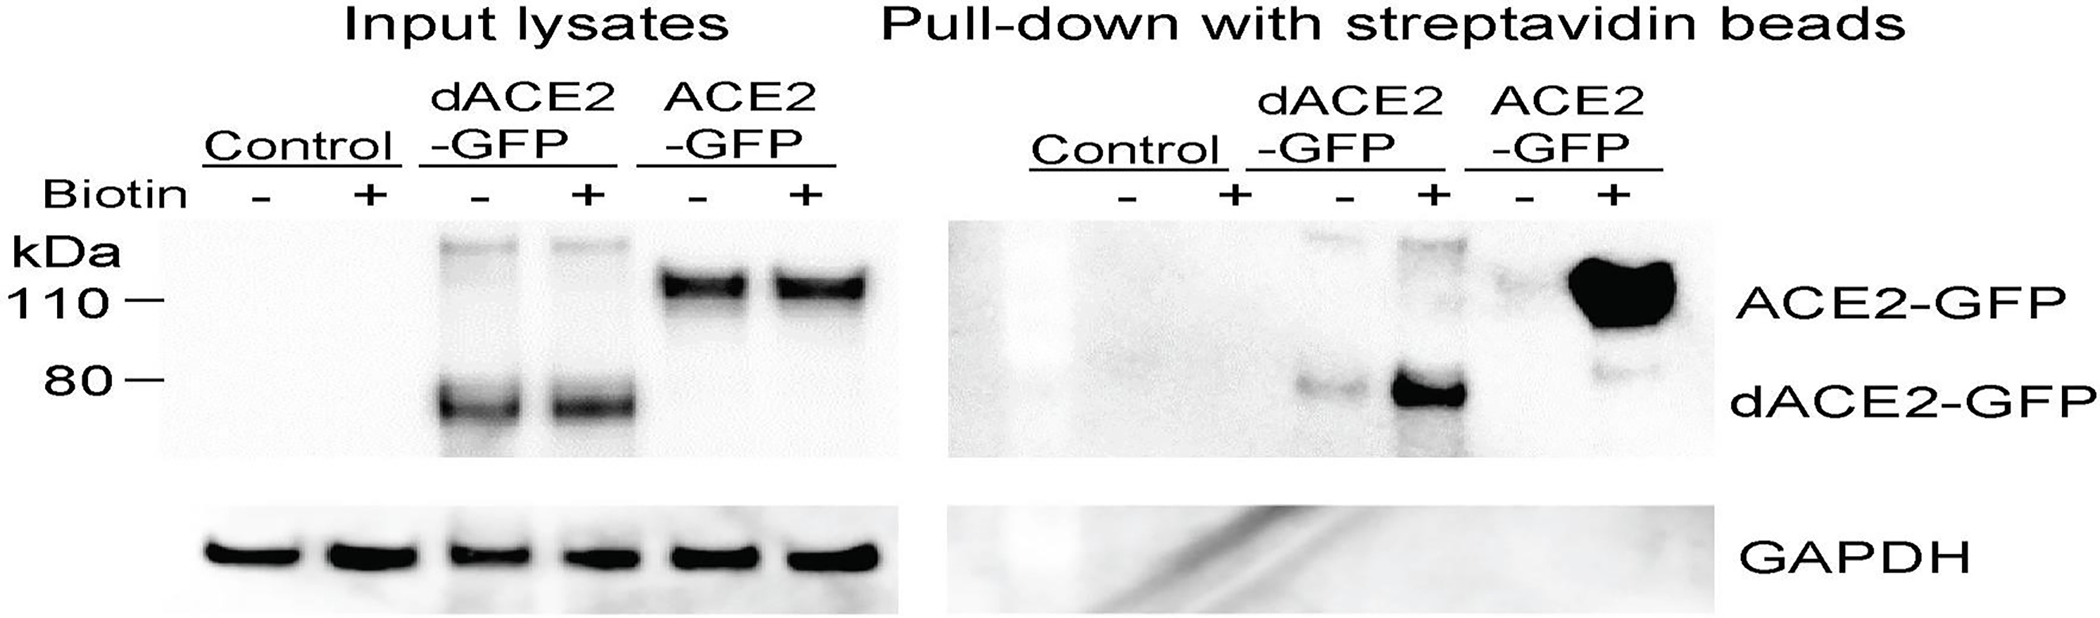
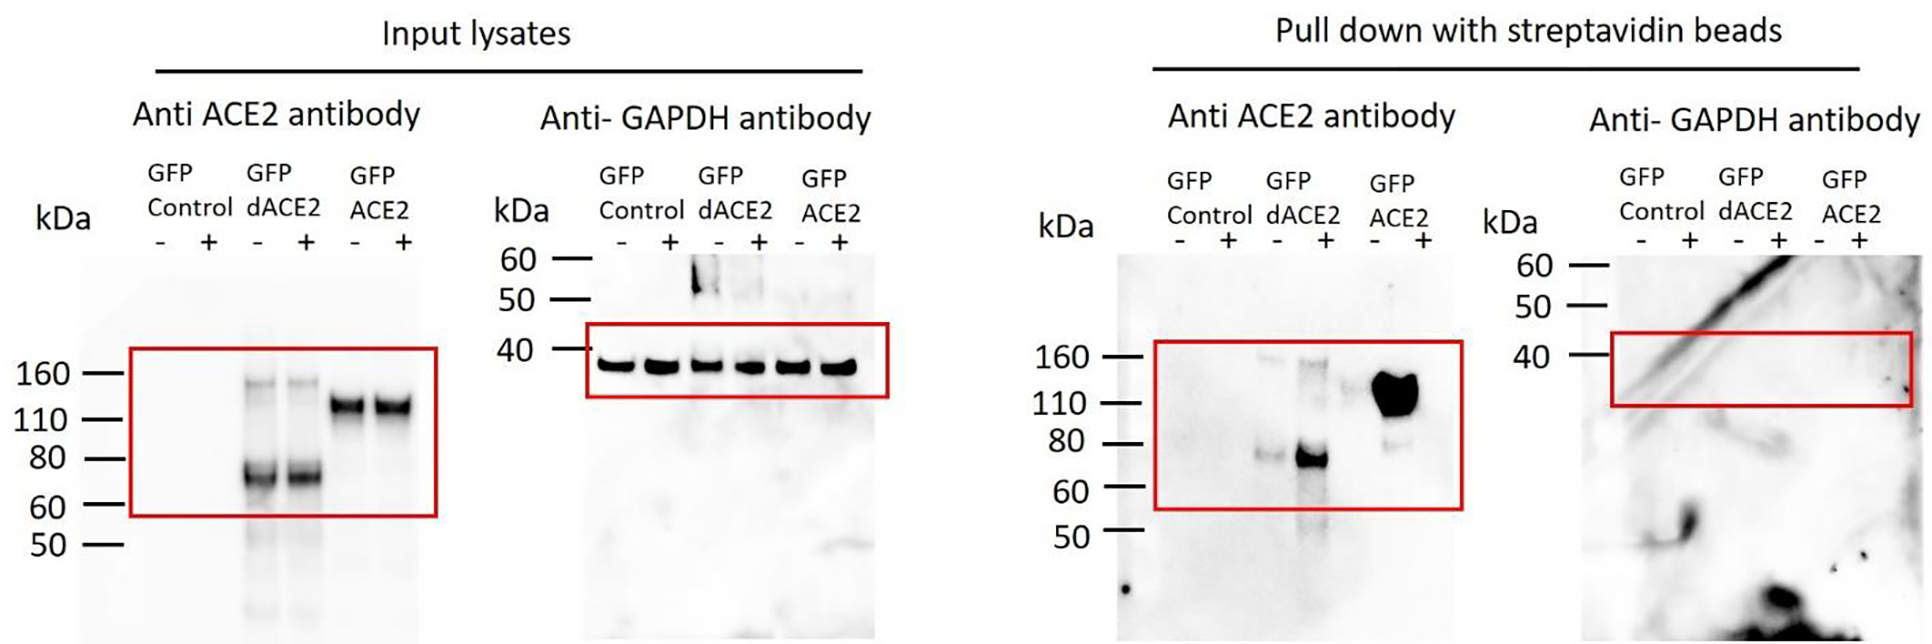
T24 cells were transiently transfected for 24 hrs with indicated constructs or not transfected (control) and then treated with (+) or without (−) biotin. Western blots with the C-terminal anti-ACE2 antibody detected a similar expression of both proteins in input lysates, but only in the biotin+ fraction after pull-down with streptavidin beads, showing much stronger expression of ACE2 compared to dACE2. GAPDH, a cytoplasmic protein, is undetectable in the pull-down fraction. The experiment was repeated three times, and representative results are shown.
Source data: Unprocessed western blots for Extended Data Fig. 8.
Extended Data Fig. 9. ACE2-GFP levels are non-specifically increased in cells co-transfected with dACE2-Myc or TMEM129-Myc.

a, A representative flow cytometry plot showing gates for the T24 cells co-transfected with dACE2-Myc and ACE2-GFP, corresponding to Fig. 7d, and e. The gates were drawn to identify cells expressing dACE2-Myc, ACE2-GFP, or both proteins. b, and c, Mean fluorescence intensity (MFI) of ACE2-GFP expression in the T24 cells transiently co-transfected in triplicates with ACE2-GFP and dACE2-Myc b, or ACE2-GFP and TMEM129-Myc c, and gated as described in a. TMEM129 is a transmembrane protein, which serves as an independent control, showing that the increase in ACE2-GFP expression might be a non-specific effect due to transfection rather than due to dACE2 co-expression.
Extended Data Fig. 10. Immunofluorescence analysis of SARS-CoV-2 infection in the A549 cells.
a, and b, Quantification of dACE2 expression a, and ACE2 expression. b, in SARS-CoV-2 (MOI = 1) or mock-infected lung cancer cell line A549 transfected with GFP (used as a transient transfection control), dACE2-Myc, or stably expressing ACE2 (ACE2-stable cell line) and transfected with GFP. The results are presented with means for three biological replicates. c-h) Immunofluorescence images in cells corresponding to plots a, and b. Cells were fixed and stained 72 hours after infection—SARS-CoV-2 nuclear protein (white), nuclei—DAPI (blue). Representative images from one of three biological replicates are shown. Corresponding plots for viral load and % of infected cells are presented in Fig. 7f and g. Scale bars, 100 μM.
Supplementary Material
Acknowledgments
We thank N. Cole (DCEG/NCI) for help with the acquisition of TCGA sliced BAM files and D. Proud (University of Calgary) for providing NHBE cells. We thank the CGR/DCEG/NCI for help with RNA-sequencing and authentication of cell lines by Identifiler profiling. The results are partially based on data generated by TCGA Research Network. The project was supported by the Intramural Research Program of the Division of Cancer Epidemiology and Genetics, National Cancer Institute; the NIH grant R21AG064479-01 and a Brain Health Research Institute Pilot Award from Kent State University (H.P.); SB and MS received financial support from the Deutsche Forschungsgemeinschaft (DFG): project number 240245660 (SFB1129) 415089553 (Heisenberg) and 272983813 (TRR179) to SB and project number 416072091 to MS. D.M.S. and D.L.T received financial support from the Li Ka Shing Institute of Virology.
Footnotes
Competing interests
The authors declare no competing interests.
REFERENCES
- 1.Hoffmann M et al. SARS-CoV-2 Cell Entry Depends on ACE2 and TMPRSS2 and Is Blocked by a Clinically Proven Protease Inhibitor. Cell 181, 271–280 e8 (2020). [DOI] [PMC free article] [PubMed] [Google Scholar]
- 2.Li W et al. Angiotensin-converting enzyme 2 is a functional receptor for the SARS coronavirus. Nature 426, 450–4 (2003). [DOI] [PMC free article] [PubMed] [Google Scholar]
- 3.Lukassen S et al. SARS-CoV-2 receptor ACE2 and TMPRSS2 are primarily expressed in bronchial transient secretory cells. EMBO J 39, e105114 (2020). [DOI] [PMC free article] [PubMed] [Google Scholar]
- 4.Ziegler CGK et al. SARS-CoV-2 Receptor ACE2 Is an Interferon-Stimulated Gene in Human Airway Epithelial Cells and Is Detected in Specific Cell Subsets across Tissues. Cell 181, 1016–1035 e19 (2020). [DOI] [PMC free article] [PubMed] [Google Scholar]
- 5.Chua RL et al. COVID-19 severity correlates with airway epithelium-immune cell interactions identified by single-cell analysis. Nat Biotechnol (2020). [DOI] [PubMed] [Google Scholar]
- 6.Zhou Q et al. Interferon-alpha2b Treatment for COVID-19. Front Immunol 11, 1061 (2020). [DOI] [PMC free article] [PubMed] [Google Scholar]
- 7.Hung IF et al. Triple combination of interferon beta-1b, lopinavir-ritonavir, and ribavirin in the treatment of patients admitted to hospital with COVID-19: an open-label, randomised, phase 2 trial. Lancet 395, 1695–1704 (2020). [DOI] [PMC free article] [PubMed] [Google Scholar]
- 8.Prokunina-Olsson L et al. COVID-19 and emerging viral infections: The case for interferon lambda. J Exp Med 217(2020). [DOI] [PMC free article] [PubMed] [Google Scholar]
- 9.O’Brien TR et al. Weak Induction of Interferon Expression by SARS-CoV-2 Supports Clinical Trials of Interferon Lambda to Treat Early COVID-19. Clin Infect Dis (2020). [DOI] [PMC free article] [PubMed] [Google Scholar]
- 10.Re RN Mechanisms of disease: local renin-angiotensin-aldosterone systems and the pathogenesis and treatment of cardiovascular disease. Nat Clin Pract Cardiovasc Med 1, 42–7 (2004). [DOI] [PubMed] [Google Scholar]
- 11.Diamond B The renin-angiotensin system: An integrated view of lung disease and coagulopathy in COVID-19 and therapeutic implications. J Exp Med 217(2020). [DOI] [PMC free article] [PubMed] [Google Scholar]
- 12.van de Veerdonk FL et al. Kallikrein-kinin blockade in patients with COVID-19 to prevent acute respiratory distress syndrome. Elife 9(2020). [DOI] [PMC free article] [PubMed] [Google Scholar]
- 13.de Maat S, de Mast Q, Danser AHJ, van de Veerdonk FL & Maas C Impaired Breakdown of Bradykinin and Its Metabolites as a Possible Cause for Pulmonary Edema in COVID-19 Infection. Semin Thromb Hemost (2020). [DOI] [PMC free article] [PubMed] [Google Scholar]
- 14.Imai Y et al. Angiotensin-converting enzyme 2 protects from severe acute lung failure. Nature 436, 112–6 (2005). [DOI] [PMC free article] [PubMed] [Google Scholar]
- 15.Kuba K et al. A crucial role of angiotensin converting enzyme 2 (ACE2) in SARS coronavirus-induced lung injury. Nat Med 11, 875–9 (2005). [DOI] [PMC free article] [PubMed] [Google Scholar]
- 16.Huang F et al. Angiotensin II plasma levels are linked to disease severity and predict fatal outcomes in H7N9-infected patients. Nat Commun 5, 3595 (2014). [DOI] [PMC free article] [PubMed] [Google Scholar]
- 17.Zou Z et al. Angiotensin-converting enzyme 2 protects from lethal avian influenza A H5N1 infections. Nat Commun 5, 3594 (2014). [DOI] [PMC free article] [PubMed] [Google Scholar]
- 18.Middlebrooks CD et al. Association of germline variants in the APOBEC3 region with cancer risk and enrichment with APOBEC-signature mutations in tumors. Nat Genet 48, 1330–1338 (2016). [DOI] [PMC free article] [PubMed] [Google Scholar]
- 19.Obajemu AA et al. IFN-lambda4 Attenuates Antiviral Responses by Enhancing Negative Regulation of IFN Signaling. J Immunol 199, 3808–3820 (2017). [DOI] [PMC free article] [PubMed] [Google Scholar]
- 20.Minas TZ et al. IFNL4-DeltaG is associated with prostate cancer among men at increased risk of sexually transmitted infections. Commun Biol 1, 191 (2018). [DOI] [PMC free article] [PubMed] [Google Scholar]
- 21.Santer DM et al. Differential expression of interferon-lambda receptor 1 splice variants determines the magnitude of the antiviral response induced by interferon-lambda 3 in human immune cells. PLoS Pathog 16, e1008515 (2020). [DOI] [PMC free article] [PubMed] [Google Scholar]
- 22.Stanifer ML et al. Critical Role of Type III Interferon in Controlling SARS-CoV-2 Infection in Human Intestinal Epithelial Cells. Cell Rep, 107863 (2020). [DOI] [PMC free article] [PubMed] [Google Scholar]
- 23.Schoggins JW et al. A diverse range of gene products are effectors of the type I interferon antiviral response. Nature 472, 481–5 (2011). [DOI] [PMC free article] [PubMed] [Google Scholar]
- 24.Wen B, Wang X & Zhang B PepQuery enables fast, accurate, and convenient proteomic validation of novel genomic alterations. Genome Res 29, 485–493 (2019). [DOI] [PMC free article] [PubMed] [Google Scholar]
- 25.Blanco-Melo D et al. Imbalanced Host Response to SARS-CoV-2 Drives Development of COVID-19. Cell 181, 1036–1045 e9 (2020). [DOI] [PMC free article] [PubMed] [Google Scholar]
- 26.Chu H et al. Comparative replication and immune activation profiles of SARS-CoV-2 and SARS-CoV in human lungs: an ex vivo study with implications for the pathogenesis of COVID-19. Clin Infect Dis (2020). [DOI] [PMC free article] [PubMed] [Google Scholar]
- 27.Lee JS et al. Immunophenotyping of COVID-19 and influenza highlights the role of type I interferons in development of severe COVID-19. Sci Immunol 5(2020). [DOI] [PMC free article] [PubMed] [Google Scholar]
- 28.Broggi A et al. Type III interferons disrupt the lung epithelial barrier upon viral recognition. Science 369, 706–712 (2020). [DOI] [PMC free article] [PubMed] [Google Scholar]
- 29.Major J et al. Type I and III interferons disrupt lung epithelial repair during recovery from viral infection. Science 369, 712–717 (2020). [DOI] [PMC free article] [PubMed] [Google Scholar]
- 30.Lucas C et al. Longitudinal analyses reveal immunological misfiring in severe COVID-19. Nature 584, 463–469 (2020). [DOI] [PMC free article] [PubMed] [Google Scholar]
- 31.Lagunas-Rangel FA & Chavez-Valencia V High IL-6/IFN-gamma ratio could be associated with severe disease in COVID-19 patients. J Med Virol (2020). [DOI] [PMC free article] [PubMed] [Google Scholar]
- 32.Thijsen S et al. Elevated nucleoprotein-induced interferon-gamma release in COVID-19 patients detected in a SARS-CoV-2 enzyme-linked immunosorbent spot assay. J Infect 81, 452–482 (2020). [DOI] [PMC free article] [PubMed] [Google Scholar]
- 33.Leppek K, Das R & Barna M Functional 5’ UTR mRNA structures in eukaryotic translation regulation and how to find them. Nat Rev Mol Cell Biol 19, 158–174 (2018). [DOI] [PMC free article] [PubMed] [Google Scholar]
- 34.Zores F & Rebeaud ME COVID and the Renin-Angiotensin System: Are Hypertension or Its Treatments Deleterious? Front Cardiovasc Med 7, 71 (2020). [DOI] [PMC free article] [PubMed] [Google Scholar]
- 35.Wan Y, Shang J, Graham R, Baric RS & Li F Receptor Recognition by the Novel Coronavirus from Wuhan: an Analysis Based on Decade-Long Structural Studies of SARS Coronavirus. J Virol 94(2020). [DOI] [PMC free article] [PubMed] [Google Scholar]
- 36.Liu Q et al. miRNA-200c-3p is crucial in acute respiratory distress syndrome. Cell Discov 3, 17021 (2017). [DOI] [PMC free article] [PubMed] [Google Scholar]
- 37.Hirano T & Murakami M COVID-19: A New Virus, but a Familiar Receptor and Cytokine Release Syndrome. Immunity 52, 731–733 (2020). [DOI] [PMC free article] [PubMed] [Google Scholar]
- 38.Mehta V et al. Case Fatality Rate of Cancer Patients with COVID-19 in a New York Hospital System. Cancer Discov 10, 935–941 (2020). [DOI] [PMC free article] [PubMed] [Google Scholar]
- 39.Kuderer NM et al. Clinical impact of COVID-19 on patients with cancer (CCC19): a cohort study. Lancet 395, 1907–1918 (2020). [DOI] [PMC free article] [PubMed] [Google Scholar]
- 40.Prokunina-Olsson L et al. A variant upstream of IFNL3 (IL28B) creating a new interferon gene IFNL4 is associated with impaired clearance of hepatitis C virus. Nat Genet 45, 164–71 (2013). [DOI] [PMC free article] [PubMed] [Google Scholar]
- 41.Nikkila J et al. Analysis and visualization of gene expression data using self-organizing maps. Neural Netw 15, 953–66 (2002). [DOI] [PubMed] [Google Scholar]
- 42.Vesanto J & Alhoniemi E Clustering of the self-organizing map. IEEE Trans Neural Netw 11, 586–600 (2000). [DOI] [PubMed] [Google Scholar]
- 43.Shahmuradov IA & Solovyev VV Nsite, NsiteH and NsiteM computer tools for studying transcription regulatory elements. Bioinformatics 31, 3544–5 (2015). [DOI] [PMC free article] [PubMed] [Google Scholar]
Associated Data
This section collects any data citations, data availability statements, or supplementary materials included in this article.
Supplementary Materials
Data Availability Statement
The sequence for dACE2 was deposited to NCBI GenBank with accession number MT505392 The data used in the paper is presented in Supplementary Materials. Please address requests for any additional data or reagents to Ludmila Prokunina-Olsson (prokuninal@mail.nih.gov).