Abstract
The expression of nonagglutinating fimbriae (NAF) and mannose-resistant/Proteus-like (MR/P) pili in swarming colonies of Proteus mirabilis was investigated. Elongated swarmer cells do not express pili, and the relative number of bacteria expressing NAF during swarming and early consolidation phases was very low (<5%). Relative expression of NAF in a terrace increased to approximately 30% at 48 h. We also determined the expression of NAF and MR/P pili in two phenotypically distinguishable regions of each terrace. The expression of both NAF and MR/P pili was always higher in the region closer (proximal) to the middle of the colony than in the distal region of the terrace. The relative numbers of bacteria expressing NAF or MR/P pili in the proximal region were between 39.1 and 63% and between 5.9 and 7.7%, respectively. In the distal region, expression levels were between 20.8 and 27.3% and between 3.7 and 5.6%, respectively. A time course experiment testing NAF expression in both the proximal and distal regions of a terrace indicated that NAF expression in the proximal regions was always higher than in the distal regions and increased to a plateau 40 to 50 h after the start of the swarming phase for any given terrace. These results indicate that expression of NAF or MR/P pili in swarming colonies of P. mirabilis is highly organized, spatially and temporally. The significance of this controlled differentiation remains to be uncovered.
Bacteria, in their natural habitats, prefer to live in colonies (9). This observation also applies to pathogenic bacteria, which are often found in microcolonies on the surfaces of epithelial tissues (7). Colonies of bacteria grown on laboratory media can exhibit a high degree of organization that is characterized by phenotypically distinguishable regions, such as concentric circles, pie-shaped sectors, and fractal patterns (4, 23, 24).
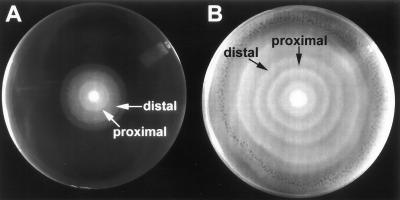
Some modes of colony development are redundant and can be observed across taxa. One such mode of colony development is swarming. Organisms in which swarming is observed include Proteus, Serratia, vibrios, bacilli, and clostridia (24). These bacteria can differentiate from short, vegetative “swimmer” cells to elongated, highly flagellated forms called swarmer cells (14). These swarmer cells are responsible for the multicellular spreading on surfaces that gives swarming colonies their characteristic pattern of concentric terraces (see Fig. 1).
FIG. 1.
Swarm colony of P. mirabilis 7570. Bacteria (105) were inoculated in the middle of the agar plate and allowed to grow for 20 h (A) and 48 h (B).
The formation of swarming colonies by Proteus mirabilis is particularly well documented (3, 5, 10, 22). The phenomena of swarming (migration) and consolidation (reversion to vegetative cells) result in a colony exhibiting characteristic terraces arranged in a circular geometry. According to Rauprich and coworkers (22), the process is made up of five distinct phases. These are the lag phase, the first swarming phase, the first consolidation phase, the second and following swarming phases, and the second and following consolidation phases. The limits of each terrace are defined by the intervals between the onset of migration in successive swarm phases.
The products of a large number of genes are believed to take part in the swarming process (1). However, little is known about the role played by pili in the establishment of swarming colonies. In an effort to better define the role of pili during swarming and consolidation, we have investigated the expression of nonagglutinating fimbriae (NAF) and mannose resistant/Proteus-like (MR/P) pili during the formation of swarming colonies of P. mirabilis.
MATERIALS AND METHODS
Bacterial strain and culture.
P. mirabilis 7570 has been isolated from a patient with struvite urolithiasis. P. mirabilis was routinely grown on Luria agar plates supplemented with 0.2% glucose. Swarming colonies of P. mirabilis were initiated by inoculating 105 bacteria in 1 μl in the middle of a petri dish containing 1.5% agar. The agar plates were then incubated at 37°C for the appropriate length of time. The length of the bacteria was determined with a Reichert phase-contrast microscope fitted with an eyepiece micrometer. Twenty bacteria were measured per determination.
Detection of NAF and MR/P pilus expression.
To measure the proportion of bacteria expressing a particular pilus in a given population, we have used the procedure of Nowicki et al. (19) with slight modifications. Briefly, bacteria from different regions of swarming colonies were harvested with a loop, resuspended in 0.5 ml of phosphate-buffered saline (PBS) in Eppendorf tubes, and centrifuged for 2 min at 12,000 × g. The pellet was resuspended in 0.1 ml of PBS. Ten microliters of this suspension was put on a microscope slide, air dried at room temperature, and fixed for 30 min with 95% methanol. Anti-NAF or anti-MR/P-pilus mouse monoclonal antibodies (26) were diluted 1:1 with a solution of 50% PBS–glycerol, and 4 μl of the diluent was added to the dried sample. The slides were then incubated at room temperature for 45 min followed by three washes with 50 μl of PBS. Seven microliters of fluorescein isothiocyanate-conjugated goat anti-mouse immunoglobulin G (IgG) and IgM antibodies (Caltag Laboratories, Burlingame, Calif.) was added to each slide. The slides were incubated in the dark at room temperature for 45 min followed by three washes with 50 μl of PBS. A drop of 50% PBS–glycerol was added to the sample, which was then covered with a glass coverslip. The slides were examined with an Olympus BX50 microscope (Olympus America Inc., Lake Success, N.Y.) equipped with a fluorescence illuminator. The number of bacteria expressing the pili and the total number of bacteria (typically 50 to 100) were counted in five different fields for each sample. The results are reported as the percentage of bacteria expressing pili [calculated as follows: (number of bacteria expressing pili/total number of bacteria) × 100].
Electron microscopy.
Samples for electron microscopy were prepared as follows. P. mirabilis was grown on agar as described above. Samples were taken from different regions of the swarm colonies with a sterile loop and suspended in water or PBS. A drop of the cell suspension was deposited on a Formvar carbon-coated grid and allowed to dry at room temperature. A drop of 1% uranyl acetate (in water) was deposited on the dried sample for 2 to 5 min, after which the excess liquid (if any) was blotted off. Samples were then analyzed with a Philips model E-M 300 electron microscope.
RESULTS
Swarming colonies of P. mirabilis were obtained by inoculating 105 bacteria in the center of an agar plate. A typical colony is shown in Fig. 1. In the 48-h colony, the terraces formed by the successive waves of swarming and consolidation can be clearly distinguished. We further observed two phenotypically distinguishable regions within each terrace, an opaque rim and a bright rim. The center of the colony is completely bright, and the first terrace starts with an opaque rim. Thus, the opaque rim corresponds to what we termed the proximal part of the terrace, relative to the colony center. The bright rim corresponds to the distal part. The proximal and distal regions are only faintly discernible at the end of the swarming period for a given terrace but become more evident as the terrace becomes older. It has been shown that internal waves are formed within the expanding swarmer cell population (22). These waves of swarmer cells originate from the previous terrace and successively propagate into the newly formed terrace. The waves are one cell thick and are piled up at the edge of the terrace in such a way that the bottom layer extends outward, the one above it extends less, and successive layers each extend less than the one below. Furthermore, islands of cells with different thicknesses are formed at the edge of the terrace. The brightness of the distal area most likely arises because of light scatter at the boundaries of these successive layers and islands of cells (22). The pitted appearance of the edge of the second terrace in Fig. 1A and of the outermost terrace in Fig. 1B is most likely due to these islands of cells.
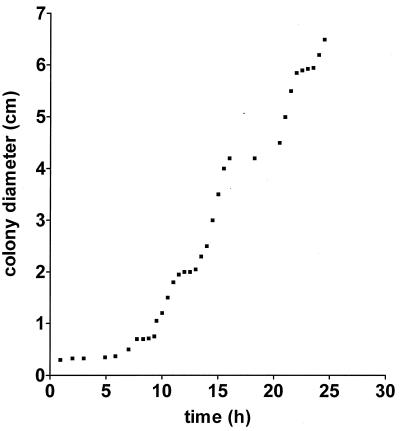
A typical colony growth curve is shown in Fig. 2. It exhibits the characteristic pattern which arises as a result of swarming and consolidation cycles. An initial lag phase of 5 h was observed in the growth of the colony; it was followed by the first swarming, which spanned 2 h. During this first swarming, the colony diameter expanded at a rate of approximately 33 μm/min. The duration of the first consolidation was approximately 1.5 h. The rate of colony expansion in the second and subsequent swarming phases was much higher, approximately 150 μm/min. An increase in the rate of colony expansion in the second and subsequent swarming phases has also been observed by Rauprich and coworkers (22). This cycle of swarming and consolidation was repeated five or six times under our growth conditions. After the last cycle, the colony occupied the entire surface of the agar. Esipov and Shapiro (12) have proposed a mathematical model to describe the kinetics of P. mirabilis swarm colony development. In the model that best describes their experimental data, they have assumed that swarmer cells have a fixed maximal age (θmax) and that the swarmer cells become septate upon reaching this age. Esipov and Shapiro’s numerical model allowed us to estimate θmax and other parameters characteristic of our experiment’s growth conditions. The period required to complete one swarming and consolidation phase was on average equal to approximately 5 h, based on our colony’s growth curve. This, according to the mathematical model, corresponds to a θmax of approximately 4.5 h. From this θmax, again by the mathematical model, the ratio of the consolidation period to the total period was found to be close to 0.6. This is in good agreement with our results, which indicate that the consolidation and swarming periods are roughly equal (≈2.5 h).
FIG. 2.
Growth curve of P. mirabilis swarm colony.
We used anti-NAF and anti-MR/P-pilus antibodies to probe the presence of both pili at the surfaces of bacterial cells. To achieve this, cells were smeared on a microscope slide and exposed to the antibody. A fluorescein isothiocyanate-labelled secondary antibody was used to detect bacteria expressing NAF or MR/P pili (see Materials and Methods). A photomicrograph of a typical field of view obtained by fluorescence microscopy with this technique is shown in Fig. 3. Cells expressing NAF appear bright and can be clearly visualized.
FIG. 3.
Immunofluorescence photomicrograph of NAF-expressing bacteria. Magnification, ×1,000.
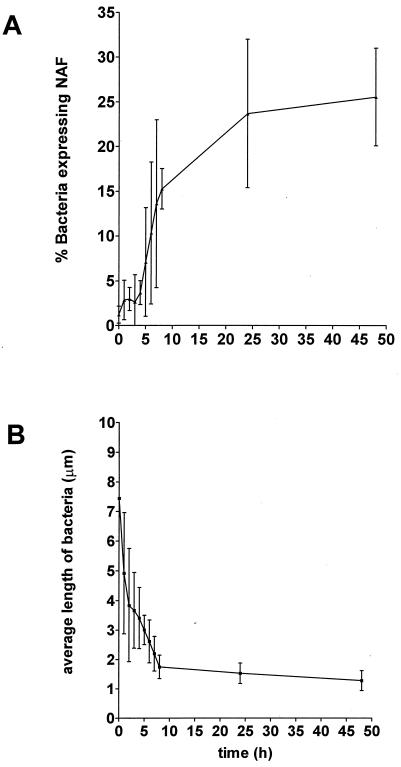
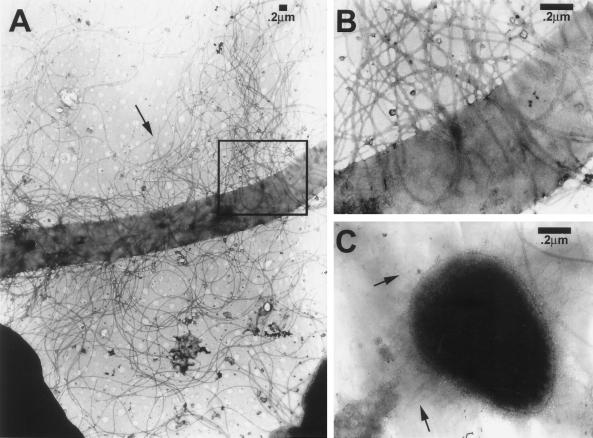
We probed the expression of NAF during the swarming and consolidation phases of a given terrace (we took the fourth terrace). To do this, a strip of agar corresponding to the width of the terrace was cut out at the outer edge of a colony. The strips from different plates were cut out at different times, starting at the beginning of the swarming and continuing up to 48 h. The bacteria on the strips were recovered, and the proportion of bacteria expressing NAF was measured (Fig. 4A). We also measured the average length of these bacteria (Fig. 4B). Clearly, the curves are the mirror image of one another, indicating that the septation of swarmer cells into swimmer cells is paralleled by an increase in the proportion of NAF-expressing bacteria. That is, swarmer cells do not express (or express very few) NAF. Similar results were obtained for MR/P pili. We further demonstrated, using electron microscopy, that swarmer cells do not express pili at all (Fig. 5). Interestingly, when the two curves of Fig. 4 were analyzed in more detail, they were found to exhibit variations in their rate of change (variations in their slopes) at times corresponding to the end or the beginning of the swarming and consolidation phases. Thus, an initial rapid decrease in average cell length that lasted approximately 2 h, or the equivalent of the swarming period, was observed. An equally rapid increase in the proportion of NAF-expressing cells was observed during the same period. This increase was followed by a lower rate of decrease in average cell length that also lasted approximately 2 h, or the equivalent of the consolidation period. During this period, there was no change in the proportion of bacteria expressing NAF. Then followed a more rapid decrease of the average cell length that lasted approximately 4 h. The proportion of NAF-expressing bacteria increased rapidly and substantially during this postconsolidation period. Finally, there was a very slow decrease in average cell length over several hours, which was paralleled by a significant reduction in the rate of increase of NAF-expressing bacteria. The correlation between the kinetics of the proportion of NAF-expressing bacteria and average bacterial size strongly suggests that NAF are expressed only on a subpopulation of cells of a specific size. The kinetics also indicate that most of the differentiation into NAF-expressing bacteria occurs after the consolidation phase, over a period of time several times that of a complete swarming-plus-consolidation period, the latter lasting approximately 4 h.
FIG. 4.
Changes in relative number of bacteria expressing NAF and bacterial cell length in the fourth terrace as a function of time.
FIG. 5.
Electron microscopy photographs of P. mirabilis. (A) Hyperflagellated swarmer cell. An arrow points to a flagellum (magnification, ×28,500). (B) Higher magnification of the boxed area from panel A. Note the complete absence of pili (magnification, ×119,700). (C) Swimmer cell exhibiting a very high number of pili, which are indicated by arrows (magnification, ×119,700).
We also probed the expression of NAF and MR/P pili in the proximal and distal regions of terraces. The proportion of bacteria expressing NAF was always higher in the proximal region (Table 1). MR/P pili followed a similar pattern of expression, although the relative number of bacteria expressing MR/P pili was very low.
TABLE 1.
Relative numbers of bacteria expressing NAF and MR/P pili in the proximal and distal regions of terraces in swarm colonies of P. mirabilis
| Terrace no. | NAF
|
MR/P pilia
|
||||
|---|---|---|---|---|---|---|
| % Expressionb
|
% Differencec | % Expressionb
|
% Differencec | |||
| Proximal | Distal | Proximal | Distal | |||
| 1 | 56.7 ± 6.2 | 27.3 ± 5.6 | 51.8 ± 15.3 | 7.7 ± 0.7 | 3.7 ± 1.6 | 51.9 ± 23.2 |
| 2 | 39.1 ± 2.6 | 20.8 ± 3.5 | 46.6 ± 11.6 | 7.5 ± 4.2 | 4.2 ± 0.6 | 44.0 ± 61.7 |
| 3 | 48.3 ± 7.1 | 31.3 ± 9.2 | 35.2 ± 24.5 | 5.9 ± 1.9 | 5.6 ± 3.5 | 5.1 ± 13.3 |
| 4 | 45.7 ± 7.6 | 22.5 ± 1.2 | 50.8 ± 18.8 | |||
| 5 | 63.0 ± 1.6 | 26d | 58.7 ± 2.5 | |||
| Mean | 50.6 ± 2.5 | 25.6 ± 2.3 | 49.4 ± 7.1 | 7.0 ± 1.55 | 4.5 ± 1.29 | 35.7 ± 29.8 |
Expression of MR/P pili in terraces 4 and 5 was below the detection limit of our assay.
Results are means ± standard deviations of at least three experiments.
Percent difference is calculated as follows: [(expression in proximal region − expression in distal region)/expression in proximal region] × 100.
In our experiments, the proximal and the distal regions of the fifth terrace were difficult to distinguish. Therefore, only in one case was it possible to obtain data for the distal region.
The average relative numbers of bacteria expressing NAF were approximately 50 and 25% in the proximal and distal regions, respectively. In the colony center, the phenotype of which is very similar to the distal, bright parts of terraces, the proportion of NAF-expressing bacteria was 27%. Thus, the bright phenotype can be correlated with a lower expression of NAF. All terraces exhibited similar levels of expression. Interestingly, MR/P pilus expression was also approximately two times higher in the proximal parts than in the distal parts of terraces 1 and 2. This may suggest that the expression of NAF and MR/P pilus genes are controlled by a common regulatory element. However, due to the very low relative number of bacteria expressing MR/P pili, the uncertainty of the measurements is relatively large. A relatively low number of bacteria expressing MR/P pili (between 0 and 5%), relative to the number expressing NAF (between 10 and 50%), was also observed under broth culture conditions (17).
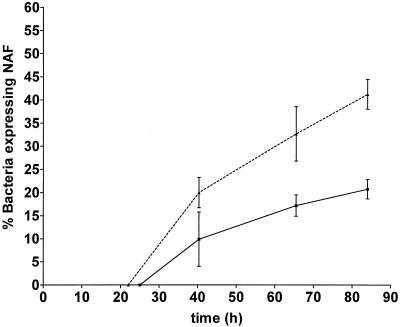
The kinetics of NAF expression in both the proximal and the distal regions, beginning at the onset of the consolidation phase (Fig. 6), indicate that the relative number of NAF-expressing bacteria is always higher in the proximal region. The rapid increase in the relative number of NAF-expressing bacteria observed for the whole terrace during the 10 to 20 h following consolidation (Fig. 4A) is reflected in the kinetics of NAF expression in both the proximal and distal regions.
FIG. 6.
Relative numbers of bacteria expressing NAF as a function of time in the proximal (dotted line) and distal (solid line) regions of terrace 4. Bacteria were harvested at the end of the swarm phase. Results are the means ± standard deviations of three experiments.
DISCUSSION
In the present paper, we have demonstrated that NAF and MR/P pili are differentially expressed in the terraces of swarming colonies of P. mirabilis. The proportion of bacteria expressing either pilus was higher in the proximal region of each terrace. In our experiments, pili were not expressed on hyperflagellated swarmer cells. A similar observation was made in a study on P. mirabilis by Hoeniger (14), in which it was shown that only a small fraction (less than 10%) of bacteria grown on solid agar expressed both pili and flagella at the same time. Our results suggest that pili are expressed at the surfaces of bacteria that are relatively small, which appear at specific times in the development of swarming colonies. Most likely, pili are expressed on bacteria that have reached a certain stage of differentiation in the overall differentiation-dedifferentiation cycle of P. mirabilis.
Not all of the bacteria in any particular region of a terrace express NAF or MR/P pili. This clearly indicates that the density of pilus-expressing bacteria is tightly controlled. The control of MR/P pilus expression has been elucidated, in part, at the molecular level and appears to be controlled by an invertase, MrpI, capable of inverting the orientation of the mrpA promoter (2). MrpI is analogous to FimB and FimE of Escherichia coli, which are also invertases regulating the expression of type 1 pilus structural genes (15, 16, 18). Interestingly, differential expression of type 1 pili in colonies of E. coli has also been observed (20). In E. coli, bacteria expressing type 1 pili were located along radii in circular colonies. It is well known that the FimE and FimB genes are under the control of the global regulatory factors Lrp (leucine regulatory protein) (6), IHF (integration host factor) (11), and the histone-like protein H-NS (21). Given the homology between MrpI and FimB/FimE and their similar functions in controlling gene expression, Lrp, IHF, and H-NS could also play roles in MrpI expression. In addition, Hay and coworkers (13) have demonstrated the involvement of Lrp in swarming by transposon mutagenesis and suggested a role for Lrp in flagellation and swarming. The inverse relationship between pilus expression and flagellation further supports the possible involvement of Lrp in the expression of pili. Identification of the factors affecting these global regulatory proteins and their localization within P. mirabilis colonies could further our understanding of the spatial distribution of pilus-expressing bacteria. Although the gene coding for NAF (also referred to as UCA) has been cloned (8), the regulation of its expression has not yet been elucidated at the molecular level.
It is not clear what role pili play in swarm colonies of P. mirabilis. Pili forming a network interconnecting the bacteria have been observed in colonies of Neisseria gonorrhoeae. This interconnection via pili has been proposed to enhance communication and the exchange of genetic material (25). Intracellular communication and activation of specific genes have been shown to occur when pili interact with specific receptors (27). Alternatively (or in addition), such a network of pili could play a structural role by contributing to the maintenance of specific three-dimensional organizations of bacteria at diverse stages of differentiation, much like the cellular organization of mammalian organs is supported by connective tissue. This three-dimensional connection of bacteria via pili could perhaps explain the bright (low proportion of pilus-expressing bacteria) and opaque (high proportion of pilus-expressing bacteria) phenotypes observed in our swarming colonies.
Since pili are often implicated in adhesion and flagella are used for locomotion, it is logical to propose an inverse correlation between the expression of pili and that of flagella. This would imply that the proportion of bacteria which express flagella is higher in the distal region of each terrace, since this region contains the swarmer bacteria that migrate into the adjacent terrace. In good agreement with this hypothesis, we have observed that a large proportion of bacteria from the distal region is mobile, whereas most, if not all, bacteria from the proximal region are immobile (data not shown).
This study constitutes the first exploration of the spatial organization of pili in swarming colonies of P. mirabilis. Elucidation of the molecular details of pilus expression may lead to a better understanding of the role of pili in pathogenesis. More generally, it is another step toward understanding, at the molecular level, the mechanisms controlling colony development.
REFERENCES
- 1.Allison C, Hughes C. Closely linked genetic loci required for swarm cell differentiation and multicellular migration of Proteus mirabilis. Mol Microbiol. 1991;5:1975–1982. doi: 10.1111/j.1365-2958.1991.tb00819.x. [DOI] [PubMed] [Google Scholar]
- 2.Bahrani F K, Mobley H L T. Proteus mirabilis MR/P fimbrial operon: genetic organization, nucleotide sequence, and conditions for expression. J Bacteriol. 1994;176:3412–3419. doi: 10.1128/jb.176.11.3412-3419.1994. [DOI] [PMC free article] [PubMed] [Google Scholar]
- 3.Belas R. Proteus mirabilis and other swarming bacteria. In: Shapiro J A, Dworkin M, editors. Bacteria as multicellular organisms. Oxford, England: Oxford University Press; 1996. pp. 183–219. [Google Scholar]
- 4.Ben-Jacob E. From snowflake formation to growth of bacterial colonies. II. Cooperative formation of complex colonial pattern. Contemp Phys. 1997;38:205–224. [Google Scholar]
- 5.Bisset K A. The zonation phenomenon and structure of the swarm colony in Proteus mirabilis. J Med Microbiol. 1973;9:429–433. doi: 10.1099/00222615-6-4-429. [DOI] [PubMed] [Google Scholar]
- 6.Blomfield I C, Calie P J, Eberhardt K J, McClain M S, Eisenstein B I. Lrp stimulates phase variation of type 1 fimbriation in Escherichia coli K-12. J Bacteriol. 1993;175:27–36. doi: 10.1128/jb.175.1.27-36.1993. [DOI] [PMC free article] [PubMed] [Google Scholar]
- 7.Cheng K-J, Irvin R T, Costerton J W. Autochthonous and pathogenic colonization of animal tissues by bacteria. Can J Microbiol. 1981;27:461–490. doi: 10.1139/m81-071. [DOI] [PubMed] [Google Scholar]
- 8.Cook S W, Mody N, Valle J, Hull R. Molecular cloning of Proteus mirabilis uroepithelial cell adherence (uca) genes. Infect Immun. 1995;63:2082–2086. doi: 10.1128/iai.63.5.2082-2086.1995. [DOI] [PMC free article] [PubMed] [Google Scholar]
- 9.Costerton J W, Cheng K J, Geesey G G, Ladd T I, Nickel J C, Dasgupta N, Marrie T J. Bacterial biofilms in nature and disease. Annu Rev Microbiol. 1987;41:435–464. doi: 10.1146/annurev.mi.41.100187.002251. [DOI] [PubMed] [Google Scholar]
- 10.Douglas C W, Bisset K A. Development of concentric zones in Proteus swarm colony. J Med Microbiol. 1976;9:497–500. doi: 10.1099/00222615-9-4-497. [DOI] [PubMed] [Google Scholar]
- 11.Eisenstein B I, Sweet D S, Vaughn V, Freidman D I. Integration host factor is required for the DNA inversion that controls phase variation in Escherichia coli. Proc Natl Acad Sci USA. 1987;84:6506–6510. doi: 10.1073/pnas.84.18.6506. [DOI] [PMC free article] [PubMed] [Google Scholar]
- 12.Esipov S E, Shapiro J A. Kinetic model of Proteus mirabilis swarm colony development. J Math Biol. 1998;36:249–268. [Google Scholar]
- 13.Hay N A, Tipper D J, Gygi D, Hughes C. A nonswarming mutant of Proteus mirabilis lacks the Lrp global transcriptional regulator. J Bacteriol. 1997;179:4741–4746. doi: 10.1128/jb.179.15.4741-4746.1997. [DOI] [PMC free article] [PubMed] [Google Scholar]
- 14.Hoeniger J F M. Development of flagella by Proteus mirabilis. J Gen Microbiol. 1965;40:29–42. [Google Scholar]
- 15.Klemm P, Jorgensen B J, van Die I, DeRee H, Bergmans H. The fim genes responsible for synthesis of type 1 fimbriae in Escherichia coli cloning and genetic organization. Mol Gen Genet. 1985;199:410–414. doi: 10.1007/BF00330751. [DOI] [PubMed] [Google Scholar]
- 16.Klemm P. Two regulatory fim genes, fimB and fimE, control the phase variation of type 1 fimbriae in Escherichia coli. EMBO J. 1986;5:1389–1393. doi: 10.1002/j.1460-2075.1986.tb04372.x. [DOI] [PMC free article] [PubMed] [Google Scholar]
- 17.Latta R K, Schur M J, Tolson D L, Altman E. The effect of growth conditions on in vitro adherence, invasion, and NAF expression by Proteus mirabilis 7570. Can J Microbiol. 1998;44:896–904. doi: 10.1139/cjm-44-9-896. [DOI] [PubMed] [Google Scholar]
- 18.McClain M S, Blomfield I C, Eisenstein B I. Roles of fimB and fimE in site-specific DNA inversion associated with phase variation of type 1 fimbriae in Escherichia coli. J Bacteriol. 1991;173:5308–5314. doi: 10.1128/jb.173.17.5308-5314.1991. [DOI] [PMC free article] [PubMed] [Google Scholar]
- 19.Nowicki B, Rhen M, Väisänen-Rhen V, Pere A, Korhonen T K. Immunofluorescence study of fimbrial phase variation in Escherichia coli KS71. J Bacteriol. 1984;160:691–695. doi: 10.1128/jb.160.2.691-695.1984. [DOI] [PMC free article] [PubMed] [Google Scholar]
- 20.Nowicki B, Rhen M, Väisänen-Rhen V, Pere A, Korhonen T K. Organization of fimbriate cells in colonies of Escherichia coli strain 3040. J Gen Microbiol. 1985;131:1263–1266. doi: 10.1099/00221287-131-5-1263. [DOI] [PubMed] [Google Scholar]
- 21.Olsen P B, Schembri M A, Gally D L, Klemm P. Differential temperature modulation by H-NS of the fimB and fimE recombinase genes which control the orientation of type 1 fimbrial phase switch. FEMS Microbiol Lett. 1998;162:17–23. doi: 10.1111/j.1574-6968.1998.tb12973.x. [DOI] [PubMed] [Google Scholar]
- 22.Rauprich O, Matsushita M, Weijer C J, Siegert F, Esipov S E, Shapiro J A. Periodic phenomena in Proteus mirabilis swarm colony development. J Bacteriol. 1996;178:6525–6538. doi: 10.1128/jb.178.22.6525-6538.1996. [DOI] [PMC free article] [PubMed] [Google Scholar]
- 23.Shapiro J A. Pattern and control in bacterial colony development. Sci Prog. 1992;76:399–424. [PubMed] [Google Scholar]
- 24.Shapiro J A. The significance of bacterial colony patterns. Bioessays. 1995;17:597–607. doi: 10.1002/bies.950170706. [DOI] [PubMed] [Google Scholar]
- 25.Todd W J, Wray G P, Hitchcock P J. Arrangement of pili in colonies of Neisseria gonorrhoeae. J Bacteriol. 1984;159:312–320. doi: 10.1128/jb.159.1.312-320.1984. [DOI] [PMC free article] [PubMed] [Google Scholar]
- 26.Tolson D L, Harrison B A, Latta R K, Lee K K, Altman E. The expression of nonagglutinating fimbriae and its role in Proteus mirabilis adherence to epithelial cells. Can J Microbiol. 1997;43:709–717. doi: 10.1139/m97-102. [DOI] [PubMed] [Google Scholar]
- 27.Zhang J P, Normak S. Induction of gene expression in Escherichia coli after pilus mediated adherence. Science. 1996;273:1234–1236. doi: 10.1126/science.273.5279.1234. [DOI] [PubMed] [Google Scholar]


