Abstract
Microglia are myeloid cells of the central nervous system that perform tasks essential for brain development, neural circuit homeostasis, and neural disease. Microglia react to inflammatory stimuli by upregulating inflammatory signaling through several different immune cell receptors such as the Toll-like receptor 4 (TLR4), which signals to several downstream effectors including transforming growth factor beta-activated kinase 1 (TAK1). Here, we show that TAK1 levels are regulated by CPEB1, a sequence-specific RNA binding protein that controls translation as well as RNA splicing and alternative poly(A) site selection in microglia. Lipopolysaccharide (LPS) binds the TLR4 receptor, which in CPEB1-deficient mice leads to elevated expression of ionized calcium binding adaptor molecule 1 (Iba1), a microglial protein that increases with inflammation, and increased levels of the cytokine IL6. This LPS-induced IL6 response is blocked by inhibitors of JNK, p38, ERK, NFκB, and TAK1. In contrast, phagocytosis, which is elevated in CPEB1-deficient microglia, is unaffected by LPS treatment or ERK inhibition, but is blocked by TAK1 inhibition. These data indicate that CPEB1 regulates microglial inflammatory responses and phagocytosis. RNA-seq indicates that these changes in inflammation and phagocytosis are accompanied by changes in RNA levels, splicing, and alternative poly(A) site selection. Thus, CPEB1 regulation of RNA expression plays a role in microglial function.
Keywords: CPEB1, microglia, inflammation, phagocytosis, alternative polyadenylation
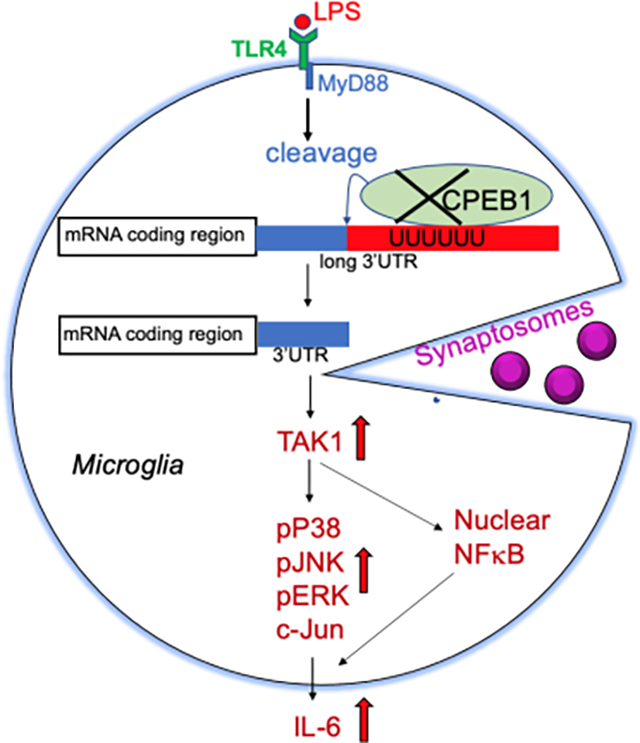
Graphical Abstract
ix. Main Points: The sequence-specific RNA binding protein CPEB1 regulates inflammation and phagocytosis in microglia. In the absence of CPEB1, alternative poly(A) site selection is disrupted, leading to mRNAs with aberrantly long or short 3’ UTRs. These results suggest that CPEB1 control of RNA expression mediates the function of microglia.
1. INTRODUCTION
Microglia are immune cells in the brain; they form the main line of defense against invading pathogens, play prominent roles in neuro-degenerative disorders such as Alzheimer’s and Parkinson’s diseases by scavenging dead cells, modify neuronal circuitry through synapse elimination, and influence the passage of molecules across the blood brain barrier (Hickman et al 2018; Frost and Schafer 2016; Wilton et al., 2019). Microglia are motile cells that manifest an activation response by extruding and contracting filopodia, becoming highly phagocytic, and secreting inflammatory response factors including cytokines and chemokines. In several of these activities, microglia resemble macrophages, phagocytic immune cells that reside in many tissues and can be stimulated by the bacterial cell wall component lipopolysaccharide (LPS) and other factors. This stimulation results in a cascade of signaling events that culminate in nuclear import of the transcription factor NF-κB that in turn activates a plethora of genes particularly those involved in inflammation (Li and Barres 2018). One proximal upstream LPS-activated factor is the Toll-like receptor 4 (TLR4), which signals to several downstream effector molecules including transforming growth factor beta-activated kinase 1 (TAK1), a mitogen-activated protein (MAP) kinase kinase kinase (Allendorf et al., 2020; Hoogland et al., 2015; Wang et al., 2014). TAK1 stimulation of p38 MAP kinase and other kinases leads to NF-κB nuclear import, which in turn leads to widespread increases in transcription. LPS stimulation of TAK1 also triggers the translation and stabilization of many mRNAs, which frequently require 3′ untranslated region (UTR)-binding proteins (Ivshina et al., 2015).
One such 3’ UTR-binding protein is CPEB1, which stimulates translation by promoting cytoplasmic poly(A) tail length in conjunction with several poly(A) polymerases and deadenylating enzymes (Barnard et al., 2004; Burns et al., 2011). However, CPEB1 also represses translation, and can mediate RNA degradation and localization (Huang et al., 2003; Shu et al., 2020; Ivshina et al., 2014). In addition, CPEB1 shuttles into the nucleus where it controls pre-mRNA splicing and alternative poly(A) site selection (APA) of specific mRNAs (Lin et al., 2010; Bava et al.,2013). In peritoneal macrophages, one main activity of CPEB1 is to repress TAK1 mRNA translation and thereby impede NF-KB nuclear import and prevent inflammatory response gene activation. In addition, CPEB1 represses the translation of several cytokine RNAs such as those encoding IL-6 and IL8 (Groppo and Richter 2011; Ivshina et al., 2015). Consequently, macrophages from CPEB1-deficient mice are hyper-responsive to LPS treatment: NF-κB is more strongly localized and retained in the nucleus relative to wild type (WT) cells and cytokine RNAs are expressed at extraordinarily high levels. CPEB1 knockout (KO) animals treated with LPS exhibit hypersensitivity to endotoxic shock, which is mitigated by a potent and specific small molecule inhibitor of TAK1 (Ivshina et al., 2015).
CPEB1 is widely expressed in the brain; in neurons, it resides at postsynaptic sites and regulates activity-dependent translation. CPEB1 modifies both N-methyl-D-aspartate receptor and metabotropic glutamate receptor-dependent forms of synaptic plasticity as well as cognitive function (Wu et al., 1998; Huang et al., 2002; Alarcon et al., 2004; Berger-Sweeney et al., 2006). In addition, poly(A) polymerases, deadenylating enzymes, and other factors that interact with CPEB1 also modify synaptic efficacy, indicating an essential role for the CPEB1 complex in regulating neuronal communication (Ivshina et al., 2015; Darnell and Richter 2012). Whether CPEB1 might influence these or other neural activities by regulating microglial function is unknown.
To assess this possibility, we examined microglial activity in CPEB1-deficient mice. We find that CPEB1 modifies the inflammatory immune response and phagocytosis in these cells. CPEB1 control of the immune response requires protein kinase signaling including the phosphorylation of MAP kinases, TAK1, p38, ERK, and JNK, and is stimulated by LPS treatment. CPEB1 regulation of phagocytosis, however, does not involve all of these signaling components, and is little stimulated by LPS. This indicates at least a partial divergence in the molecular landscape leading to these microglial activities that are under the control of CPEB1. RNA sequencing shows that immune response and phagocytosis genes are differentially regulated by CPEB1 in microglia. In addition, several RNAs involved in these processes are differentially spliced and display alternative poly(A) site selection. CPEB1 therefore plays a central role in microglia activity.
2. MATERIALS AND METHODS
2.1. Animals and LPS injections
All animal experiments have been approved by the UMass Medical School Institutional Animal Care and Use Committee (IACUC). CPEB1 KO (Tay and Richter 2001) or WT (both on C57BL/6 background) (~12 weeks of age, both genders ) male mice were injected intraperitoneally with 1 mg/kg of LPS or control PBS solution. Animals were sacrificed 24 hours post-injection and excised brain tissue was used for futher analysis or enrichment of microglia (see below).
2.2. Immunostaining of brain sections
Anesthetized mice were sequentially perfused with 0.1M phosphate buffer (PB) and 4% paraformaldehyde (PFA) in 0.1M PB. The brains were dissected and fixed for ~12 hrs in 4% PFA, immersed in 30% sucrose in PB, and embedded in optimal cutting temperature (OCT) compound in sucrose/PB. Brain regions were sectioned (coronal, 20μm), blocked, permeabilized at room temp for 1h, and blocked in 10% goat serum/PB containing 0.3% Triton-X 100. The sections were incubated overnight with Iba-1 antibody (Wako Chemicals, #019–19741, 1:500) followed by Alexa-fluorophore-labeled secondary antibody. The sections were mounted in solution containing Vectashield and DAPI. Imaging of samples took place blind to genotype and were acquired with the same settings. Data were analyzed with imageJ.
2.3. Western blot analysis
Total brain tissue was lysed in ice-cold radioimmunoprecipitation assay buffer (RIPA) dosed with a protease and phosphatase inhibitor cocktail (Thermo Fischer Scientific, USA) and protein concentrations were measured with a BCA-kit (Thermo Fischer Scientific, USA). Thirty μg of protein samples from at least three biological replicates were prepared for immunoblotting after quantification by Bradford assays and suspension in 1x Laemmli sample buffer, resolved by 4–15% gradient sodium dodecyl sulfate-polyacrylamide gel electrophoresis and analyzed by western/immunoblotting. Membranes were blocked with 5% non-fat dry milk in phosphate-buffered saline (PBS) containing 1% TWEEN-20 for 1 h at room temperature. Primary antibody was applied at 1:1000 dilution for 2 h at room temperature or overnight at 4°C followed by a 3 × 5 min wash in PBS containing 1% TWEEN-20 wash buffer. Horseradish peroxidase (HRP)-conjugated secondary antibody was applied at 1:5000 dilution for 1 h at room temperature and washed 3 × 5 min using wash buffer. The HRP signal was detected using an enhanced chemiluminescent (ECL) substrate. Following antibodies used in the immunoblotting were purchased from Cell Signaling: pERK1/2 (Pp44–42 MAPK), cat# 4370T; tERK (p44/42 MAPK), cat# 4695T; p-P38 MAPK, cat# 4511T; tP38 MAPK, cat # 8690T; tJNK, cat# 9252T; pJNK (T183/Y185), cat# 4668T; tTAK1, cat# 4505S; pTAK1 (Thr184/187), cat#4508; tubulin, cat# 2125S, anti-rabbit secondary antibodies, cat#7074S; NF-κB, cat#8242S; c-Jun, cat# 9165; β-actin cat#4967. Anti-Iba1 antibody cat#016-20001 was purchased from WAKO Chemicals, Japan. Densitometric quantification of western blot bands was performed using ImageJ following a described protocol (https://imagej.nih.gov/ij/docs/menus/analyze.html#gels), and normalized to the tubulin loading control.
2.4. Microglia enrichment
Brains were removed, mechanically disrupted by homogenization in HBSS buffer (Hanks Balanced Salt Solution), and filtered through a 100μm cell strainer to obtain a single-cell suspension; the cell debris was then pelleted. The suspended cells were centrifuged through 35% Percoll onto a 70% Percoll cushion. Two ml of interface was collected, diluted with phosphate buffered saline, and pelleted (Lee and Tansey, 2013). These cells were used for further assays.
2.5. Phagocytosis analysis
ThermoScientific Syn-PER Synaptic Protein Extraction Reagent was used to prepare synaptosomes according to the manufacturer’s protocol. The homogenate was centrifuged at 1200xg for 10 minutes to remove cell debris, and the supernatant was centrifuged at 15,000xg for 20 min. The pellets containing synaptosomes were gently resuspended and labeled with pHrodoRed (ThermoFisher) using the manufacturer’s protocol. For flow cytometry analysis, purified microglial cells were incubated for 30 min with pHrhodoRed-labeled synaptosomes in DMEM media with 10% FBS and the cell pellet was collected and washed with ice cold Hanks Balanced Salt Solution (HBSS) by 5 min centrifugation at 300g at 4°C. The cell pellets were resuspended in 500 μl of ice cold FACS buffer (0.5% BSA, 1mM EDTA, in 1x PBS, filter sterilzed) containing Cd11b (PE) or control IgG antibody (Biolegend) at a 1:200 dilution for 30 min on ice. The cells were then washed in ice cold FACS buffer for 5 min followed by centrifugation at 300xg. The cells were resuspended in 500 μl of ice cold FACS buffer, filtered through the mesh to remove clumps and proceeded to cell sorting followed by FlowJo analysis. The results were analyzed and geometrical means plotted in GraphPad Prism9 using ANOVA.
Microglial cells were purified as described above using Percoll gradients and plated on coverslips in DMEM containing 10% FBS. After a 2 hr incubation, cell culture media were replaced with fresh media containing pHRhodoRed labeled synaptosomes. The cells were incubated for 30 min, fixed with 4% formaldehyde followed by permeabilization with 0.5% Triton X-100, blocked, and stained with Iba-1 antibody (WAKO) and DAPI. The cells were imaged with a Zeiss LSM900 confocal microscope in LSM confocal mode. Images were captured with the 20X or 63X objective, 3 z-stacks at 1μm interval and with 4 tiles per image. Images were taken at 405nm for DAPI, 488nm for EGFP and 561nm for pHRhodoRed engulfed synaptosomes, switching track every line and averaging 2x. Images were analyzed with ImageJ with the ROI manager, followed by measuring in the different color channels. Results were analyzed and plotted in GraphPad Prism9 and statistically assessed by ANOVA.
2.6. ELISA assay
An IL6 Abcam ELISA kit (cat# ab100713) was used according the manusfacturer’s instructions. Mouse brain cortex was homogenized in 1 ml of RIPA buffer using a Dounce homogenizer and filtered through 100 μm nylon mesh. Fifty μl of brain lysate sample was diluted in 500 μl ELISA sample buffer; 50 μl of this was used for the ELISA assay. Enriched microglia cells from WT and CPEB1 KO mice were plated in 96 well cell culture dishes, some of which were treated with LPS, were incubated with vehicle (DMSO) or inhibitors of JNK (SP600125, AB120065, ABCAM; AS601245, AB145194, ABCAM), p38 (Dormapimod, AB142166, ABCAM; SB202190, AB120638, ABCAM), ERK (Selumetinib, AZD6244, S7101, Selleckchem), NFκB (JHH-23 and 5HPP-33, 5μM, EMDMillipore) or TAK1 (5Z-7-oxozeaenol, Sigma) for 30 minutes prior stimulation with LPS. Fifty μl of media were used for IL6 ELISA.
2.7. RNA extraction, library preparation, sequencing, and analysis
RNA was extracted from mouse brain cortex or isolated microglia with RNeasy Plus Mini Kit (cat#74134, Qiagen). All RNA Integrity Numbers (RINs) were >8 as assessed by a fragment analyzer and were used to generate poly(A)-dependent sequencing libraries. RNA-seq was conducted by Novagen (48–50 million reads, 150 PE sequencing). Fastq files were uploaded to the Dolphinnext platform (Yukselen et al., 2020) at the UMass Medial School Bioinformatics Core for mapping and additional analysis. The raw reads were quality-filtered with Trimmomatic (0.32) and the cleaned reads mapped to mouse rRNA by Bowtie2 (2.1.0) were filtered out. The reads were mapped to the Refseq mm10 genome and quantified by RSEM (1.2.11). Estimated counts on each gene were used for the differential gene expression analysis by DESeq2 (1.16.1). After the normalization by the median of ratios method, only the genes with minimal 5 counts average across all samples were kept for the DEG analysis.
Gene expression, alternative splicing (AS), and alternative polyadenylation (APA) were analyzed using rMATS (v4.0.2) (Shen et al., 2014) and APAlyzer (v1.0.0), respectively. Significant AS events are those with a delta percent spliced-in (PSI) > 5% and p-value < 0.05. Significant APA events are those with a relative abundance change > 5% and p-value < 0.05. Included are gene transcripts that had at least one read of the differentially AS or APA in both genotypes for the downstream functional enrichment analysis.
2.8. GO enrichment
EnrichGo from the clusterProfiler package (Yu et al., 2012) was used for GO term enrichment for differential gene expression (DE) as well as APA and AS events. To remove redundancy, each GO term was required to have at least 25% of genes that were not associated with another term with a more significant FDR adjusted p-value.
2.9. Quantification and Statistical analysis
For quantification and statistical analysis, all grouped data were presented as mean ± s.e.m. Student’s t-test or oneway ANOVA was used to determine statistical significance between groups. The Kolmogorov-Smirnov (K-S) test was used to compare the distributions in the volcano plots. When exact p values are not indicated, they are represented as follows: *, p < 0.05; **, p < 0.01; ***, p < 0.001; n.s., p > 0.05.
2.10. Data and Code Availability
Codes and scripts used for quantification analysis were written in Python or R and will be provided upon request to the Lead Contact. The Gene Expression Omnibus (GEO) accession number for the data reported in this paper is GSE195513.
3. RESULTS
3.1. Microglia inflammatory responses are dysregulated in the CPEB1 knockout cortex
Our experimental design to assess CPEB1 involvement in microglia inflammatory function entailed the intraperitoneal injection of LPS or phosphate buffered saline (PBS) into WT and global CPEB1 knockout (KO) mice (Tay and Richter 2001). Twenty-four hours post-injection, the brains were dissected and processed for immunostaining, western blotting, ELISA assays, phagocytosis assays, and RNA sequencing analysis (Figure 1a). Mouse brains immunostained for Iba1, a marker of microglia that increases during inflammation. Consistent with increased inflammatory responses in the CPEB1 KO mouse, Iba1 levels in the white matter layer of the cerebellum from KO mice injected with LPS were increased (Figure 1b). In the cortex, LPS injection resulted in elevated Iba1 levels in both WT and KO animals, but the levels of this protein were ~60% higher when CPEB1 was ablated (Figure 1c). Moreover, the microglia in the KO animals injected with LPS showed distinct morphological features such as extended filapodia, which inidcates elevated cellular motility and inflammatory reactive microglia. Thus, CPEB1 is an integral part of the microglia activation response to LPS stimulation.
FIGURE 1.
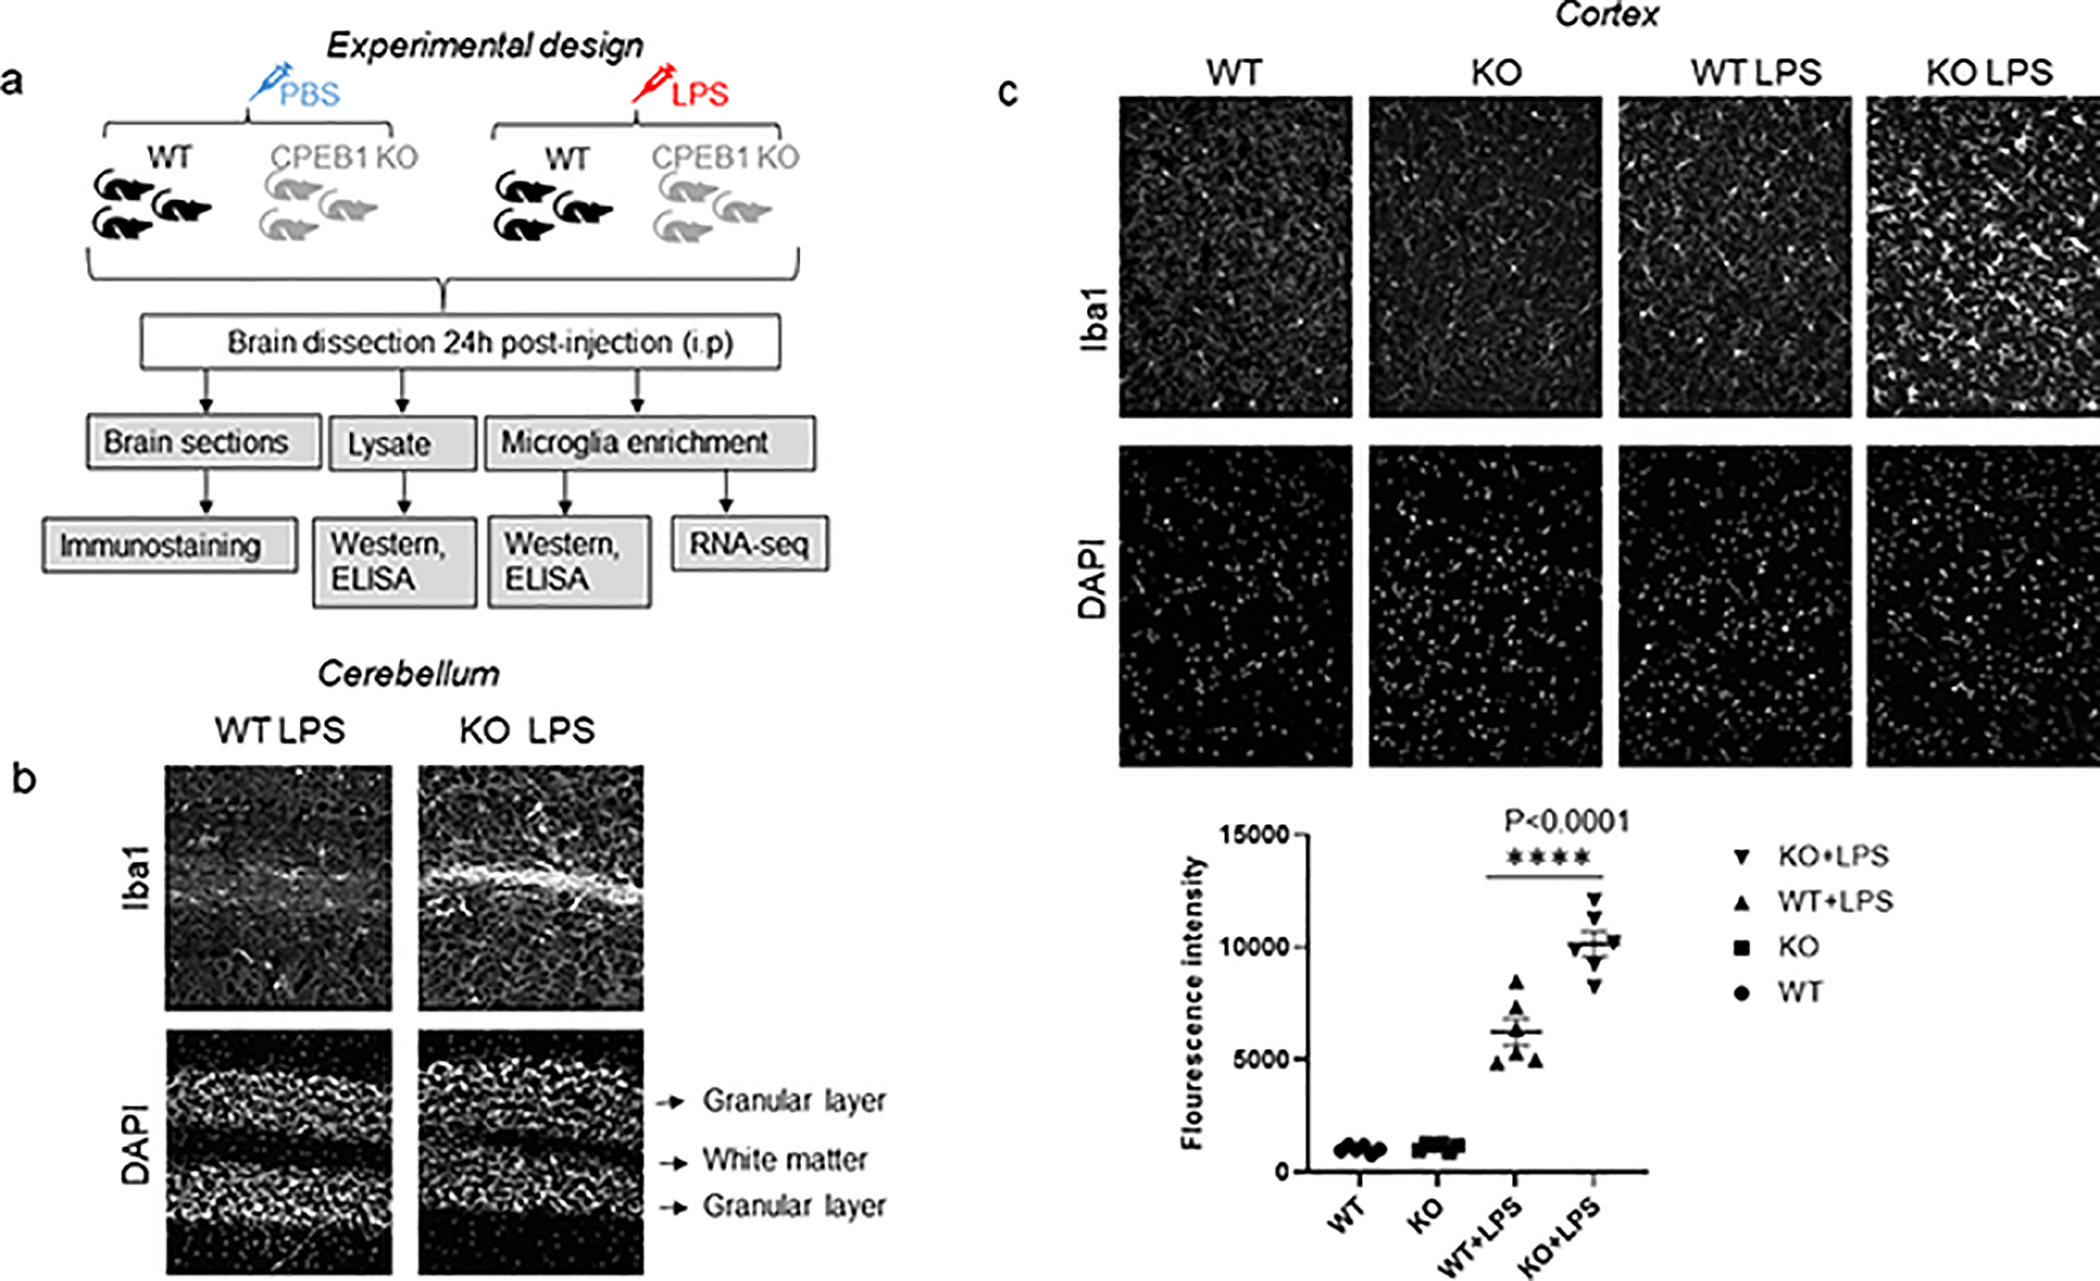
The activation of microglia is regulated by CEPB1. (a) The overall experimental design entails the injection of WT and global CPEB1 KO mice with PBS or LPS, followed by brain dissection and analysis by immunostaining, western blotting and ELISA assays, enrichment of microglia and additional western blotting, ELISA assays, and RNA-seq and analysis. (b) Imunostaining of WT and CPEB1 KO cerebellum for Iba1. (c) Imunostaining for Iba1 from cortex of WT and CPEB1 mice injected with PBS or LPS. Quantification of the immunostaing is at bottom (each symbol represents one animal, one-way ANOVA).
To identify components of the microglia inflammatory response machinery that are regulated by CPEB1, we considered signaling cascades that are stimulated by LPS (Figure 2a). LPS binds the integral membrane protein TLR4 (Toll-like receptor 4 receptor), which signals to MyD88 (myeloid differentiation primary response protein 88), an innate immune signal transduction adaptor molecule that promotes TAK1 phosphorylation. Phospho-TAK1 activates the NFκB pathway (includes phospho-IKK, phospho-IκB, and NFκB) and several MAPK kinase pathways such as phospho-p38, phospho-JNK and phospho-ERK. These pathways have considerable cross-talk between them. The downstream NFκB immune response leads to the transcriptional activation and expression of several inflammatory genes including the cytokine IL6. Figure 2b shows that although LPS stimulated IL6 in WT brain cortex, it promoted a larger ~2.5 fold increase in the CPEB1 KO brain cortex. Thus, CPEB1 could act in either or both of the NFκB or MAP kinase signaling pathways to repress IL6 production.
FIGURE 2.
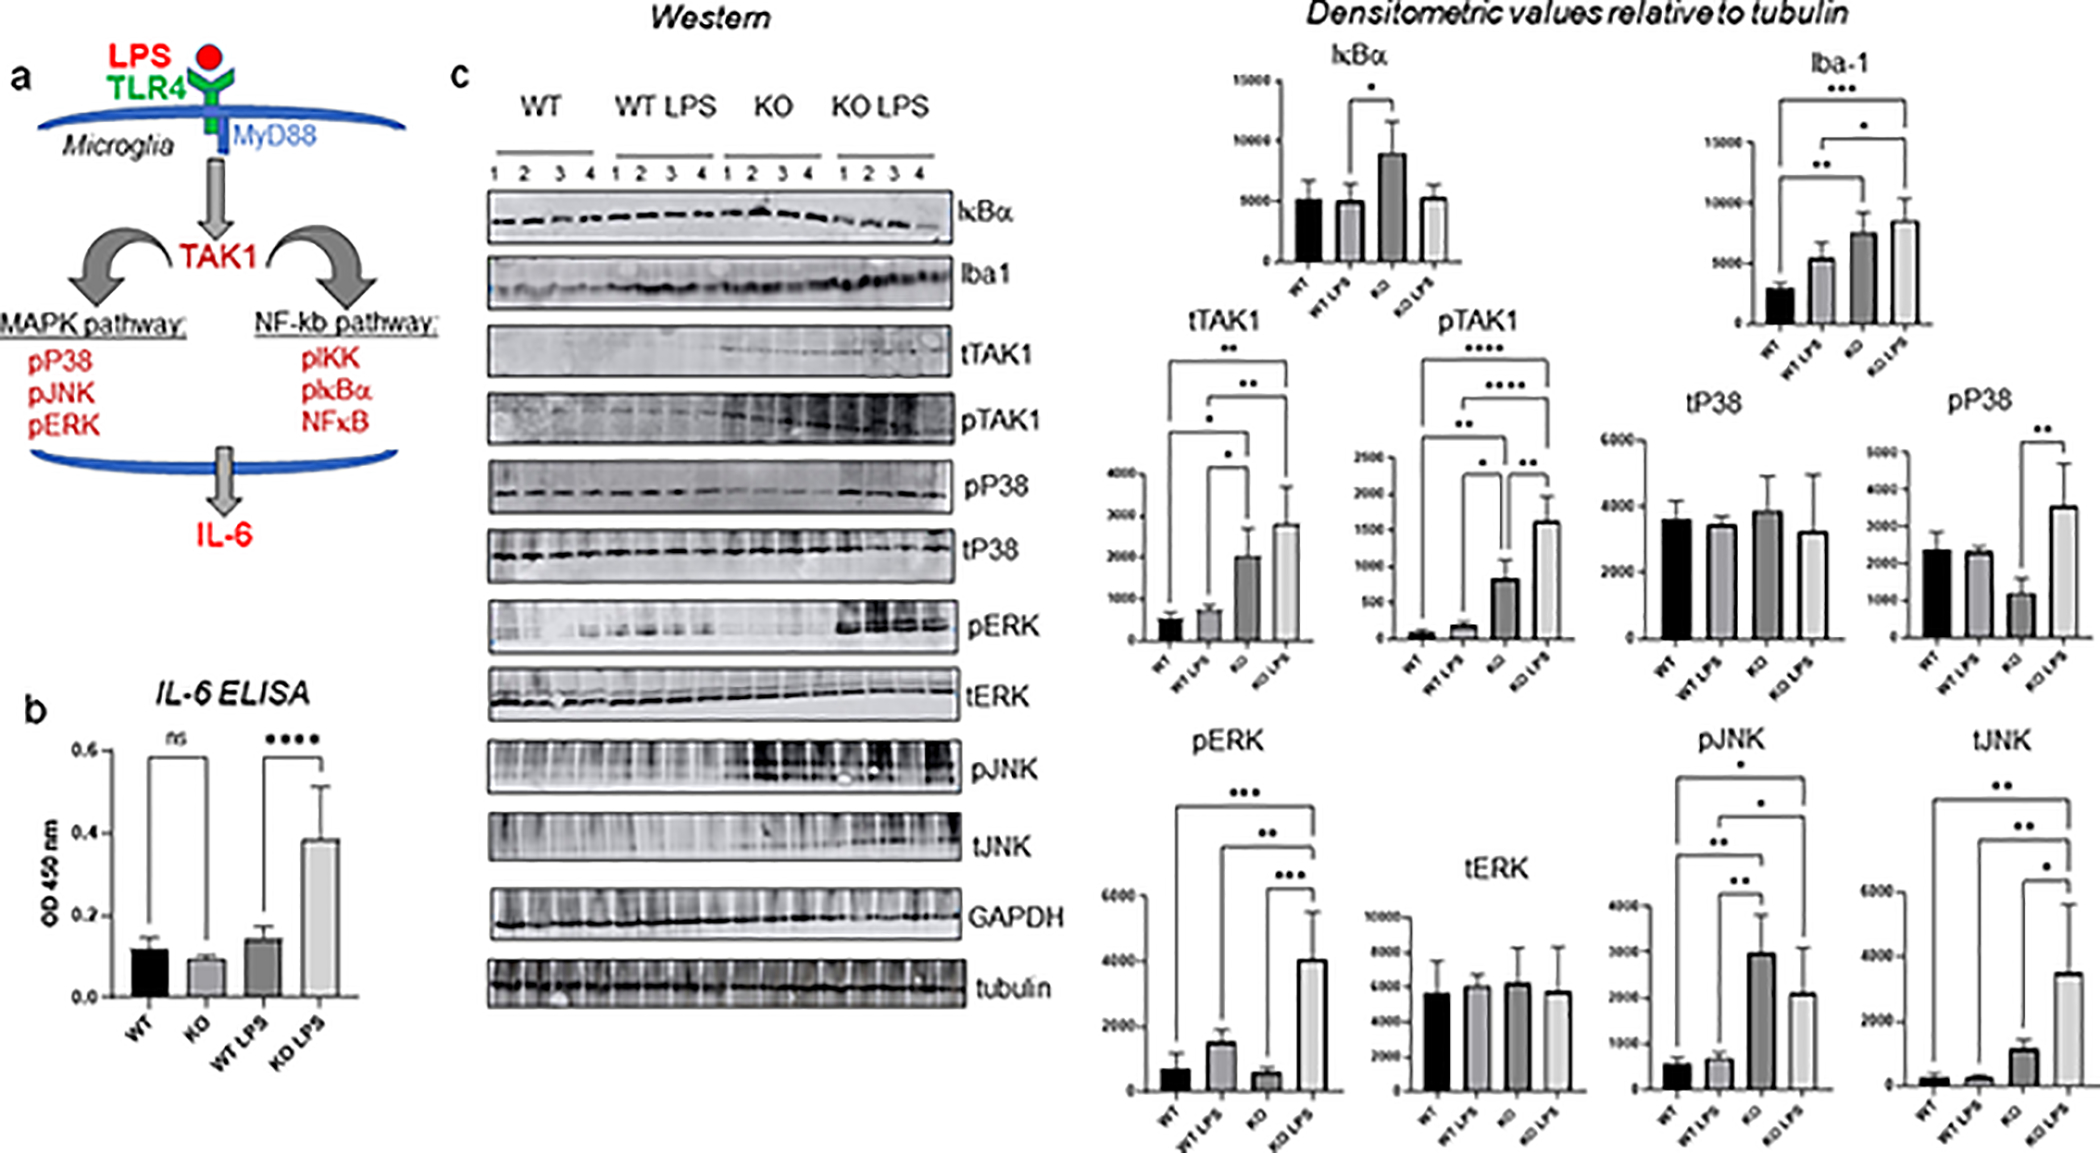
CPEB1 regulation of the signaling cascade leading to IL6 production. (a) illustration of LPS-induced signaling in microglia leading to IL6 production. (b) ELISA assays for IL6 in cortex from WT and CPEB1 KO mice injected with PBS or LPS (n=4, one-way ANOVA). (c) Western blots and quantification of signaling proteins and phospho-proteins in cortex from WT and CPEB1 KO mice injection with PBS or LPS (animal n=4, one-way ANOVA). *, p<0.05; **, p<0.01; ***, p<0.001; ****, p<0.0001.
Supplemental Fig S1 demonstrates that LPS/animal (5 mg/kg) elicited increases in p-JNK, p-ERK, and p38 in WT animals. However, because CPEB1 KO animals are more sensitive to toxic effects of LPS at higher amounts (Ivshina et al., 2015), we reduced the LPS concentration to 1 mg/kg/animal. To parse signaling pathways that could be affected by CPEB1, we performed a series of western blots of brain cortex protein from WT and CPEB1 KO mice, before or after injection with LPS (Figure 2c). Iba1 was elevated ~2.5 fold in KO cortex relative to WT (this was not clearly evident in cortex immunostaining in Figure 1). Although LPS induced an increase in Iba1 in WT cortex, a similar increase by LPS in the KO cortex was not detected, possibly indicating that this molecule had reached saturating levels. TAK1, which was barely detected in WT cortex irrespective of LPS injection, was elevated in CPEB1 KO cortex by ~4 fold, which is consistent with previous observations where CPEB1 represses TAK1 mRNA translation in peritoneal macrophages (Ivshina et al., 2015). LPS did not further stimulate TAK1 in the WT or KO cortex, again indicating it may have already reached saturation; It is also possible that the microglia may have been partially stimulated to induce an inflammatory reponse. The relative levels of phospho-TAK1 resembled total TAK1, although in the KO cortex, LPS induced enhanced phosphorylation. Total and phospho-p38 levels were mostly unchanged except for an LPS-stimulated elevation in KO cortex. In contrast, phospho-ERK was strongly up-regulated in KO cortex from LPS-injected animals while total ERK was unchanged. Finally, total and phospho-JNK were elevated in cortex from both PBS-injected and LPS-injected CPEB1 KO mice. Taken together, these data show that CPEB1 regulates both signaling cascades that emanate from the TLR4 receptor and TAK1. However, because these molecules are regulated at both the total and phosphorylation levels, it is unlikely that TAK1 regulation by CPEB1 only is sufficient for the many changes in cell signaling that we observe.
3.2. CPEB1 regulates the ERK signaling pathway to control IL6 production in isolated microglia
We prepared microglia populations from WT and CPEB1 KO animals, some of which had been injected with LPS, by filtration and Percoll gradient ultracentrifugation (Lee and Tansey, 2013). Based on Iba1 staining, the relative enrichment of these cells was ~91% (Figure 3a). To determine whether members of the ERK and or MAP kinase signaling pathways regulate IL6 production in a CPEB1 and/or LPS-dependent manner, microglia they were treated with inhibitors of JNK (#1 SP600125; #2 AS601245), p38 (#1 Dormapimod; #2 SB202190), ERK (#1 Selumetinib, AZD6244; #2 S7101), or TAK1 (5Z-7-oxozeaenol, Sigma O9890–1MG). Compared to vehicle (DMSO)-treated microglia, each inhibitor prevented IL6 levels from rising above that detected in microglia from PBS-injected WT mice (Figure 3b). These observations indicate that the ERK signaling pathway controls IL6 production in response to LPS treatment and in conjunction with CPEB1 irrespective of LPS stimulation. We also note that IL6 protein levels in isolated microglia mostly tracked similar changes in RNA levels. Figure 3c shows that LPS stimulated IL6 RNA levels in CPEB1 KO microglia >2 fold more relative to WT microglia.
FIGURE 3.
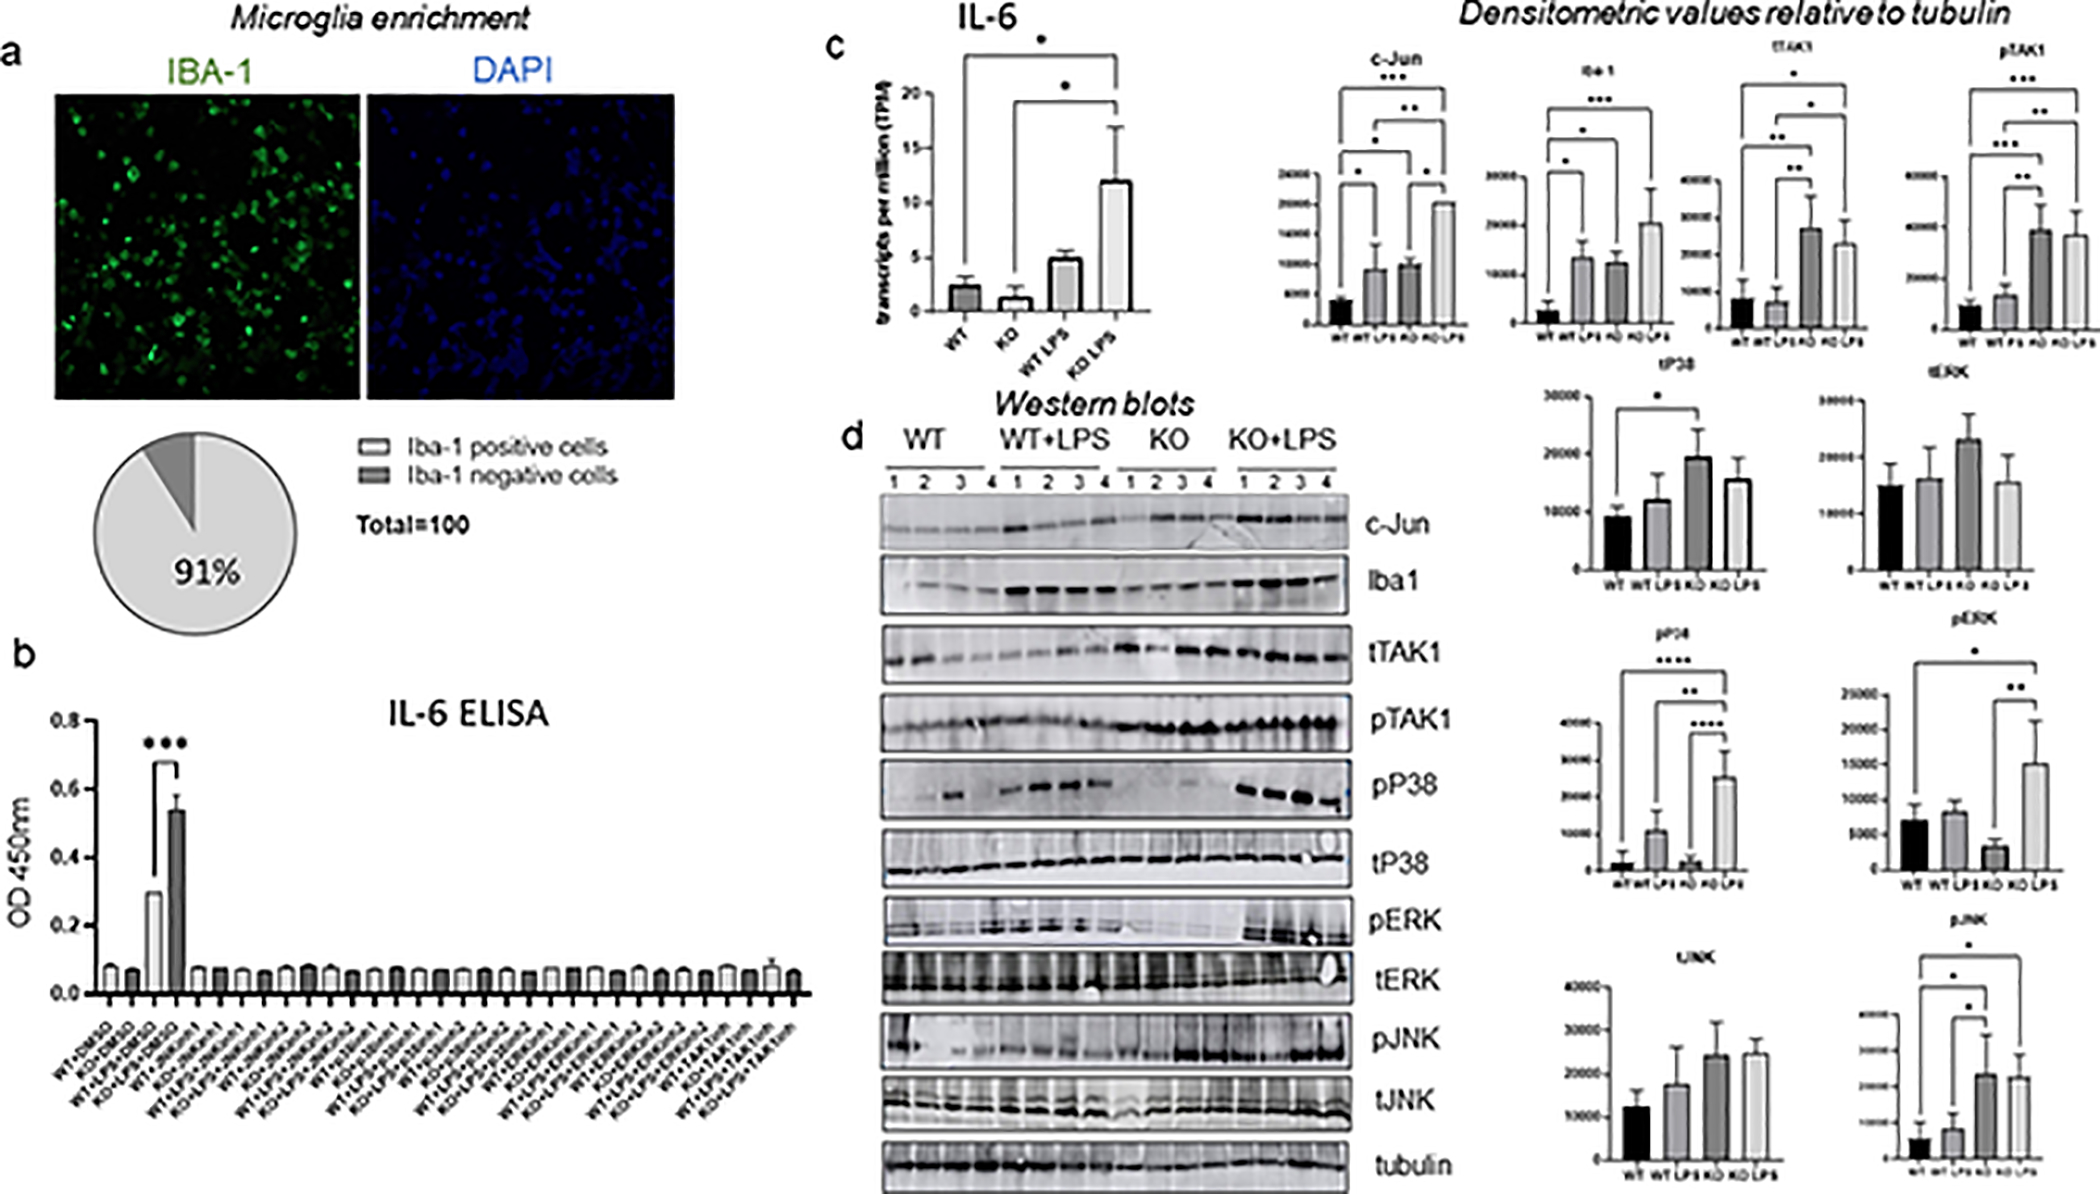
CPEB1 regulation of the signaling cascade leading to IL6 production in enriched microglia ex vivo. (a) Mouse microglia isolated by Percoll gradient centrifugation were immunostatined for the microglial marker Iba-1 as well as DAPI. Approximately 91% of cells were Iba-1 positive. (b) ELISA for IL6 in the culture medium of microglia isolated from WT and CPEB1 KO animals, some of which were injected with LPS. Some of the microglia were also incubated with inhibitors of JNK, p38, ERK, and TAK1. All inhibitors were added to the culture medium in 10% DMSO. DMSO also served as a vehicle control. (c) IL6 RNA levels from WT and CPEB1 KO mice, some of which were injected with LPS. (d) Western blots and quantification of signaling proteins and phospho-proteins in isolated microglia from WT and CPEB1 KO mice injection with PBS or LPS (n=4, one-way ANOVA). *, p<0.05; **, p<0.01; ***, p<0.001; ****, p<0.0001.
To determine which of the MAPK signaling components are altered in CPEB1-deficient microglia and in response to LPS treatment, lysates from isolated microglia populations were probed on a series of western blots. Similar to what we observed with total brain lysates, CPEB1 KO microglia had elevated levels of Iba1, TAK1, pJNK relative to WT microglia. Microglia from LPS-treated CPEB1 KO mice showed increased levels of pTAK1, pERK, pJNK, as well as c-Jun, a component of the the AP1 transcription factor complex, relative to microglia from LPS-treated WT mice (Figure 3d). These data demonstrate that CPEB1 regulates multiple signaling cascades in isolated microglia.
We also examined NFκB signaling in microglia. In WT cells, LPS stimulated nuclear localization of NFkB after 30 min; after 4 hrs, however, this factor again became cytoplasmic. However, in CPEB1 KO cells, LPS induced prolonged nuclear retention of NFκB even after 4 hrs (Fig 4a,b). We next used two inhibitors of NFκB, both of which prevented LPS-induced IL6 production as measued by ELISA (Fig 4c). Therefore, CPEB1 regulates NFκB activity.
FIGURE 4.
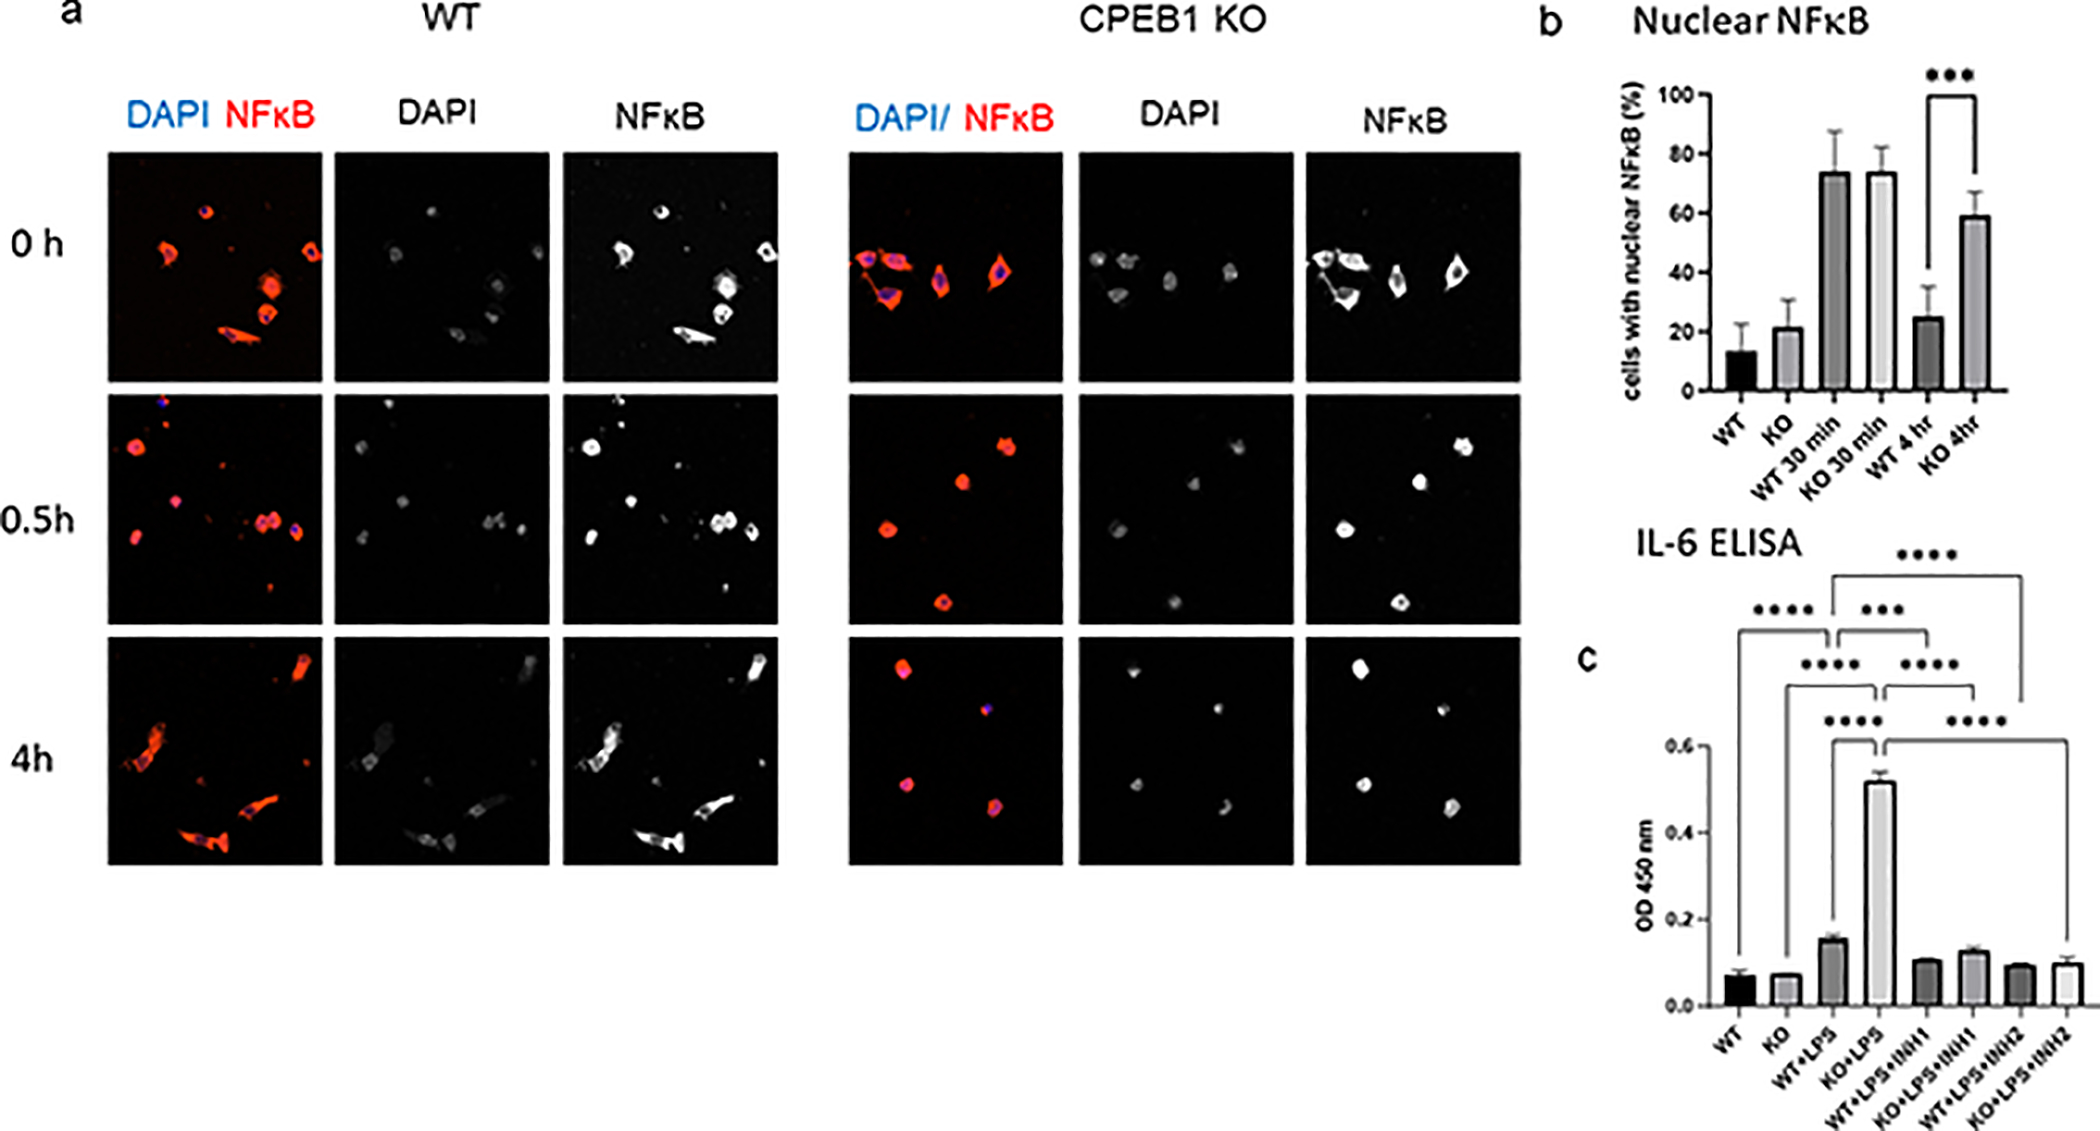
CPEB1 regulation of NFκB activity. (a) WT and CPEB1 KO microglia were treated with LPS and immuostatined for NFκB 0, 0.5., and 4 hours later. The cells were co-stained with DAPI. (b) quantification of cells with nuclear NFκB.. (c) WT and CPEB1 KO microglia were treated with LPS as well as two inhibitors of NFκB for 4 hours, which was followed by ELISA for IL-6. All assays performed in triplicate. ***p<0.001; ****p<0.0001.
3.3. CPEB1 regulation of phagocytosis
Inflammation promotes IL6 production and phagocytosis in microglia. To determine whether CPEB1 regulates phagocytosis, microglia from WT and CPEB1 KO mice, some of which were injected with LPS, were incubated with isolated synaptosomes labeled with pHrodoRed, a dye that shifts its excitation wavelength from 545 nm to 585 nm when localized to lysosomes (Figure 5a) (Byun and Chung, 2018). Consequently, we quantified the intensity of red fluorescence at 585 nm as an indicator of phagocytosis in two different assays. In the first assay, pHrodoRed-labeled synaptosomes were incubated with cultured WT and KO microglia for 30 min, some of which were isolated from animals injected with LPS 24 hours prior the microglia extraction. The cells were fixed on coverslips, immunostained for Iba-1 and subjected to determination of mean red intensity per cell. Figure 5b and 5c demonstrate that synaptic engulfment was ~55% greater in the KO microglia relative to WT. Microglia derived from LPS-injected mice, either WT or KO, exhibited a mildly heightened phagocytic response compared to non-injected animals, which contrasts to the observation that microglia from LPS-injected KO mice synthesize substantially elevated levels of IL6 (Figure 2b). In a similar vein, inhibition of ERK signaling had little effect on synaptic engulfment (Figure 5c) although it profoundly inhibited IL6 production (Figure 4b). In a second assay, microglia incubated with synaptosome-labeled pHrodoRed were further incubated with fluorescently-tagged antibody for CD11b, a surface marker for microglia. The cells were then processed by FACS to determine the geometric mean of the phrodoRed fluorescence intensity versus cell size of the CD11b/pHrodoRed positive cells (Figure S2). Figure 5d shows the geometic mean fluorescence intensity of microglia from WT and KO mice, some of which were injected with LPS and a TAK1 inhibitor. There was ~2 fold increase in synaptic engufment by CPEB1 KO microglia relative to WT, which was similar when the animals were injected with LPS. Injection of a TAK1 inhibitor substantially blocked the enhanced phagocytosis in CPEB1 KO animals including those injected with LPS. The observation that CPEB1 deficiency enhances phagocytosis but that LPS stimulation has little effect contrasts with IL6 production, which was dramatically stimulated by LPS injection. Because TAK1 inhibition blocks both IL6 production and phagocytosis but that ERK inhibition blocks only IL6 production in CPEB1-deficient microglia suggests there may be two CPEB1-regulated pathways that only partially overlap.
FIGURE 5.
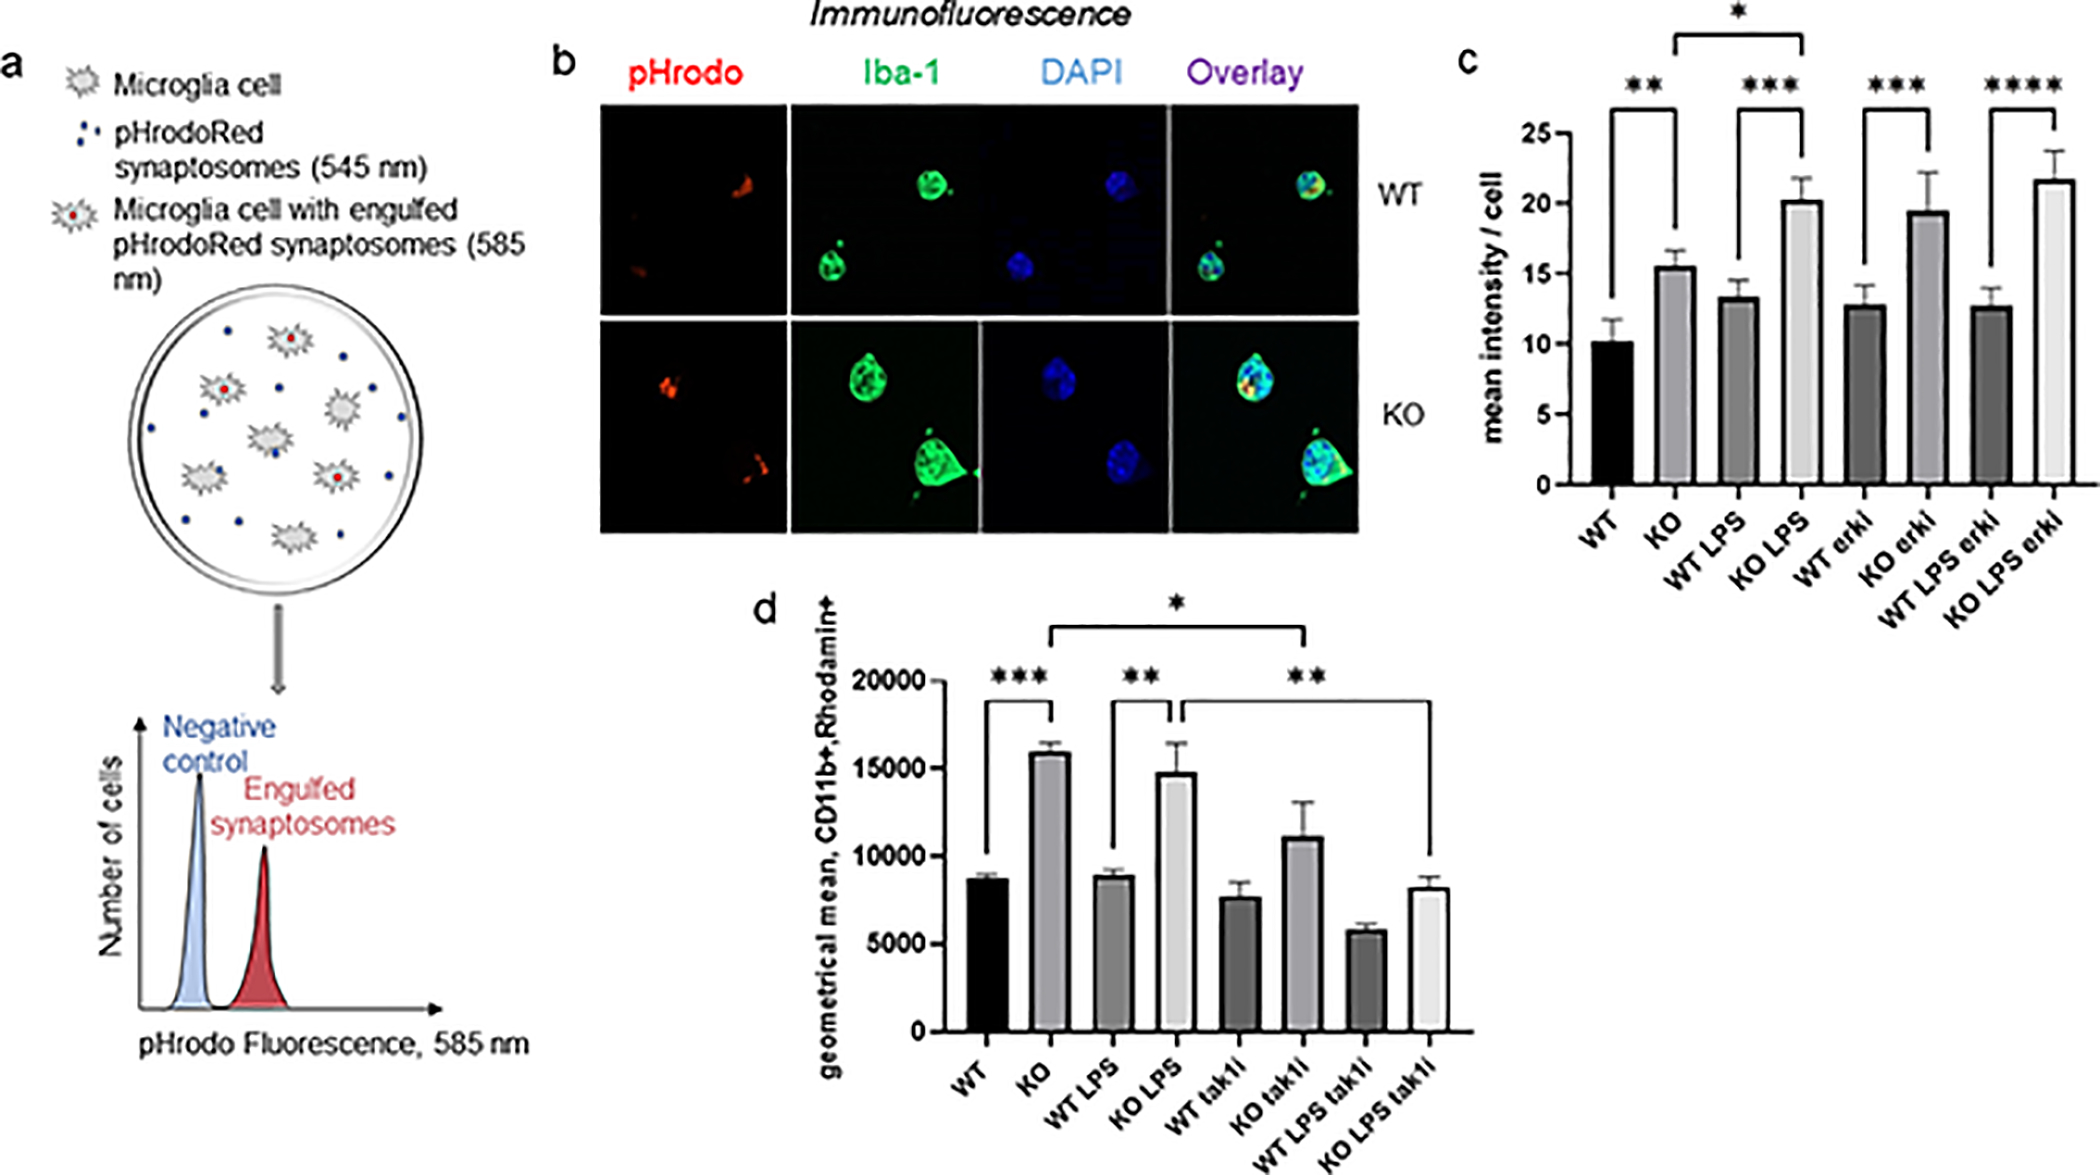
CPEB1 regulation of phagocytosis. (a) Schematic illustration for assessing phagocytosis using pHrodoRed-labeled synaptosomes. (b) Example of pHrodored-labeled syanptosomes engulfed in vitro by microglia immunostainted for Iba-1 and DAPI. (c) Quantification of mean fluorescence intensity per cell of pHrodoRed synaptosomes at 585 nm in microglia from WT and CPEB1 KO mice, some of which were injected with LPS. Some microglia were also incubated with the ERK inhibitor AZD6244 as well as with synaptosomes. (d) Geometric mean of CD11b positive microglia from WT and CPEB1 KO mice, some of which were injected with LPS and the TAK1 inhibitor 5Z-7-oxozeaenol. Engulfed of pHrodoRed-labeled synaptosomes was detected by 585 nm light. *, p<0.05; **, p<0.01; ***, p<0.001.
3.4. RNA regulation by CPEB1
To assess the molecular regulation of the immune response and phagocytosis by CPEB1, we performed RNA-seq on microglia isolated from WT and KO mice, some of which were injected with LPS (all experiments in biologic triplicate). The volcano plots in Figure 6a demonstrate that hundreds of RNAs were up- or down-regulated in microglia when comparing WT vs KO, WT+LPS vs KO+LPS, KO vs KO+LPS, and WT vs WT+LPS (log2F change; p<0.05, Wilcoxon test). GO term analysis of the most statistically significant categories comparing either WT vs KO (Figure 6b, Table S1) or WT+LPS vs KO+LPS (Figure 6c, Table S2) microglia were related to the inflammatory response. Surprisingly, most of these inflammatory-related RNAs were reduced in KO microglia relative to WT (Figure 6d). Violin plots of the 10 most significantly mis-regulated RNAs are shown in Figure 6e. The volcano plot in Figure 6f shows a number of inflammatory-related RNAs were up-regulated in KO+LPS relative to WT+LPS microglia. Violin plots of the 10 most significantly mis-regulated RNAs in these categories are shown in Figure 6g. RNAs encoding proteins involved in phagocytosis were also mis-regulated, but as with inflammatory RNAs, they were mostly down regulated in KO microglia relative to WT (Figure 7a, Table S3). In KO microglia, a few of the RNAs were up-regulated when mice were injected with LPS (Figure 7b). Violin plots of the most significantly mis-regulated RNAs involved in phagocysosis in KO vs. KO+LPS microglia are shown in Figure 7c. Taken together, our data show that there is widespread mis-regulation of RNA levels in CPEB1-deficient microglia irrespective of the treatment with LPS. Although mis-regulation of RNAs involved in inflammation is pervasive albeit less so for those involved in phagocytosis, they are mostly down-regulated when the biologic response was either unaffected (IL6 production) or elevated (phagocytosis). These paradoxical results could suggest a buffering or compensation mechanism where microglia attempt to maintain homeostasis with regard to inflammation and/or phagocytosis. In addition, the RNAs could be regulated in ways that, for example, alter stability, such changes in 3’UTR length (see below).
FIGURE 6.
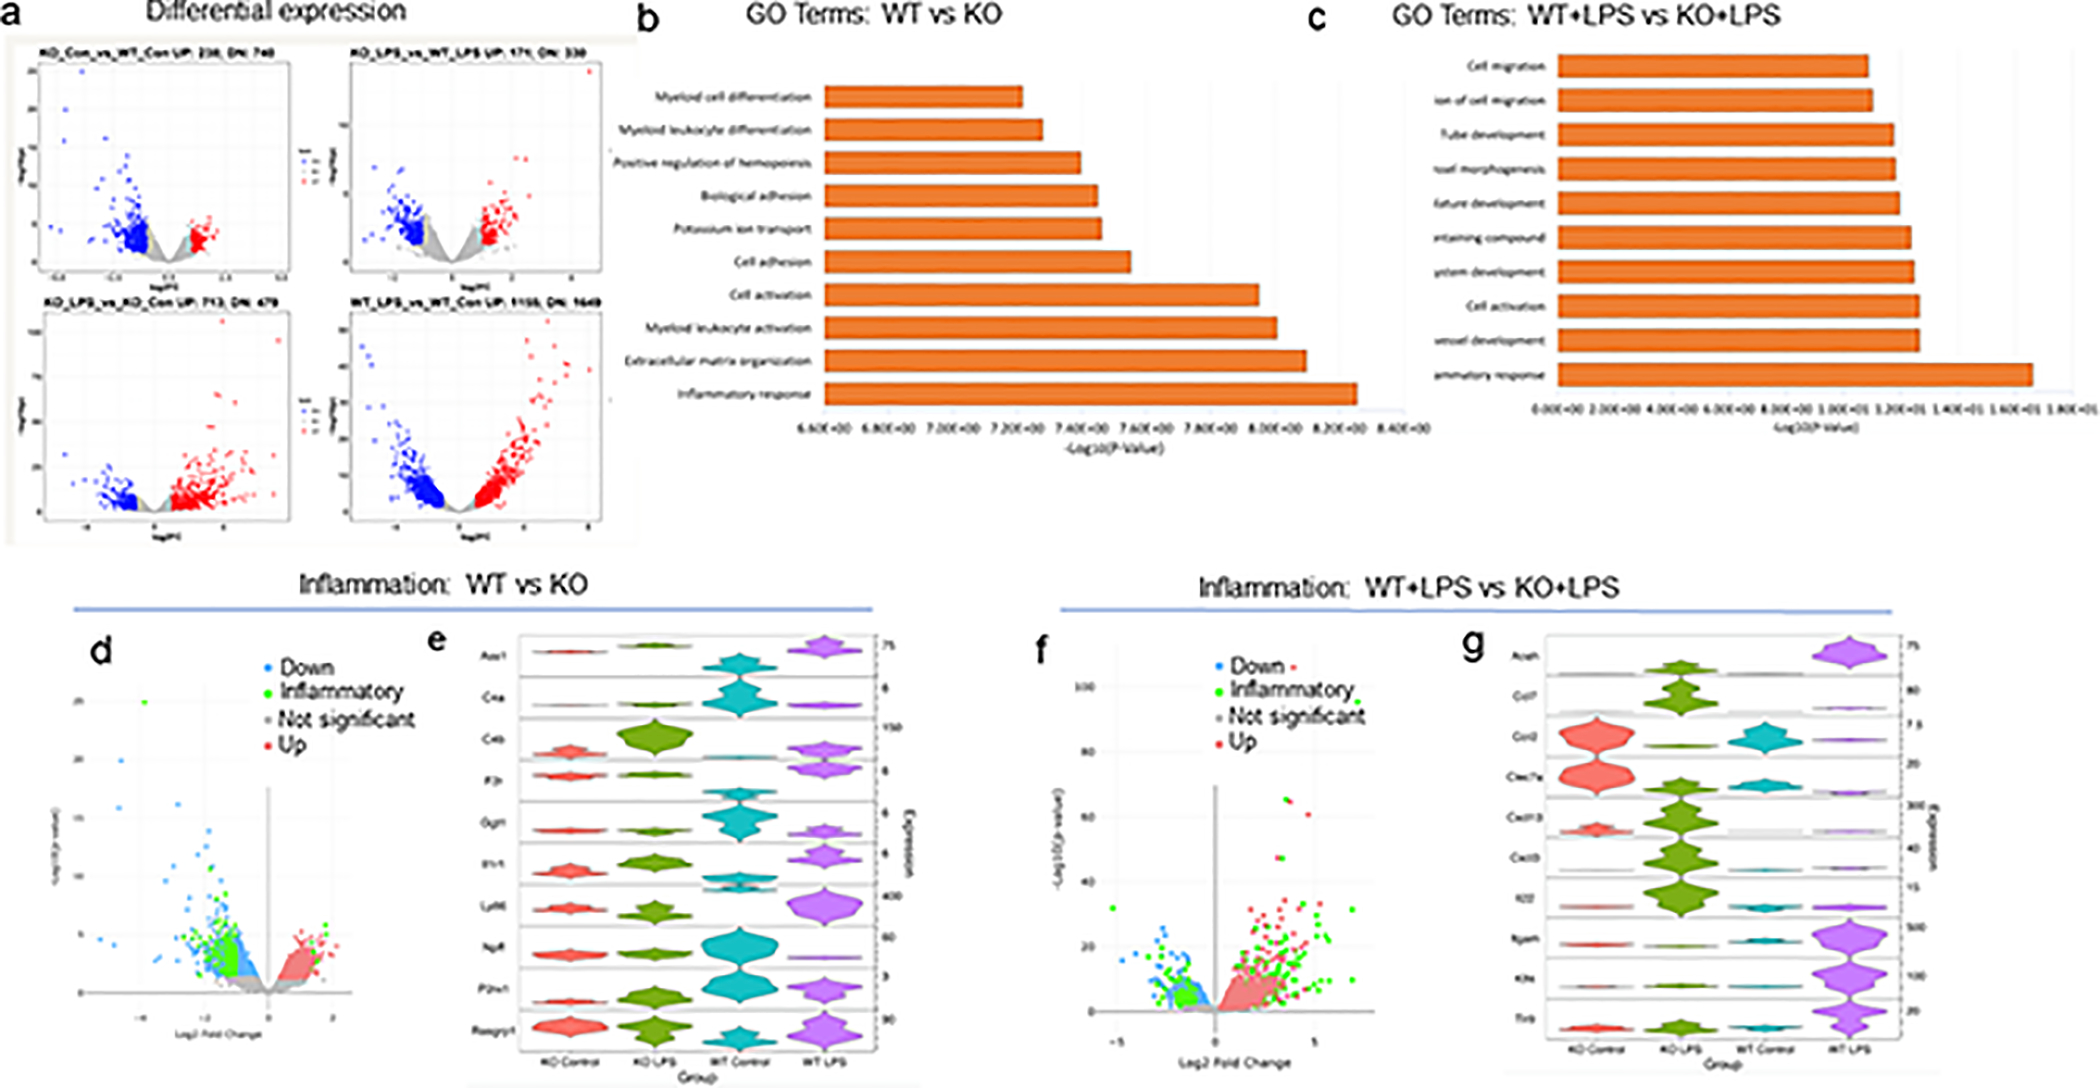
Analysis of RNA expression in CPEB1-deficient microglia. (a) Volcano plots showing differential expression when analyyzed pairwise between two conditions (KO vs WT; KO+LPS vs WT+LPS; KO+LPS vs KO; WT+LPS vs WT). The plots are log2FC vs -log10(p value). (b) GO term analysis of top 10 categories when comparing WT to KO. The most significant category is inflammatory response. (c) GO term analysis of top 10 categories when comparing WT+LPS to KO+LPS. The most significant category is inflammatory response. (d) Volcano plot of of differential expressed RNA comparing WT to KO microglia with emphasis on transcripts encoding inflammatory response proteins (green). (e) Violin plots of 10 RNAs that are the most altered, up or down, in WT vs KO microglia. The distribution of expression of RNAs is plotted for all 4 conditions (i.e., CPEB1 KO, CPEB1 KO+LPS, WT, WT+LPS). Significantly dys-regualted RNAs were determined by a fold change cutoff of 2 and a p-value cutoff of 0.05. The top 10 RNAs that pass this filter with changes both up and down are represented in the violin plot. Expression in transcripts per million (TPM). (f) Volcano plot of of differential expressed RNA comparing WT+LPS to KO+LPS microglia with emphasis on transcripts encoding inflammatory response proteins (green). (g) Violin plots of 10 RNAs that are the most altered, up or down, in WT+LPS vs KO+LPS microglia. All changes are p<0.05; expression in transcripts per million (TPM).
FIGURE 7.
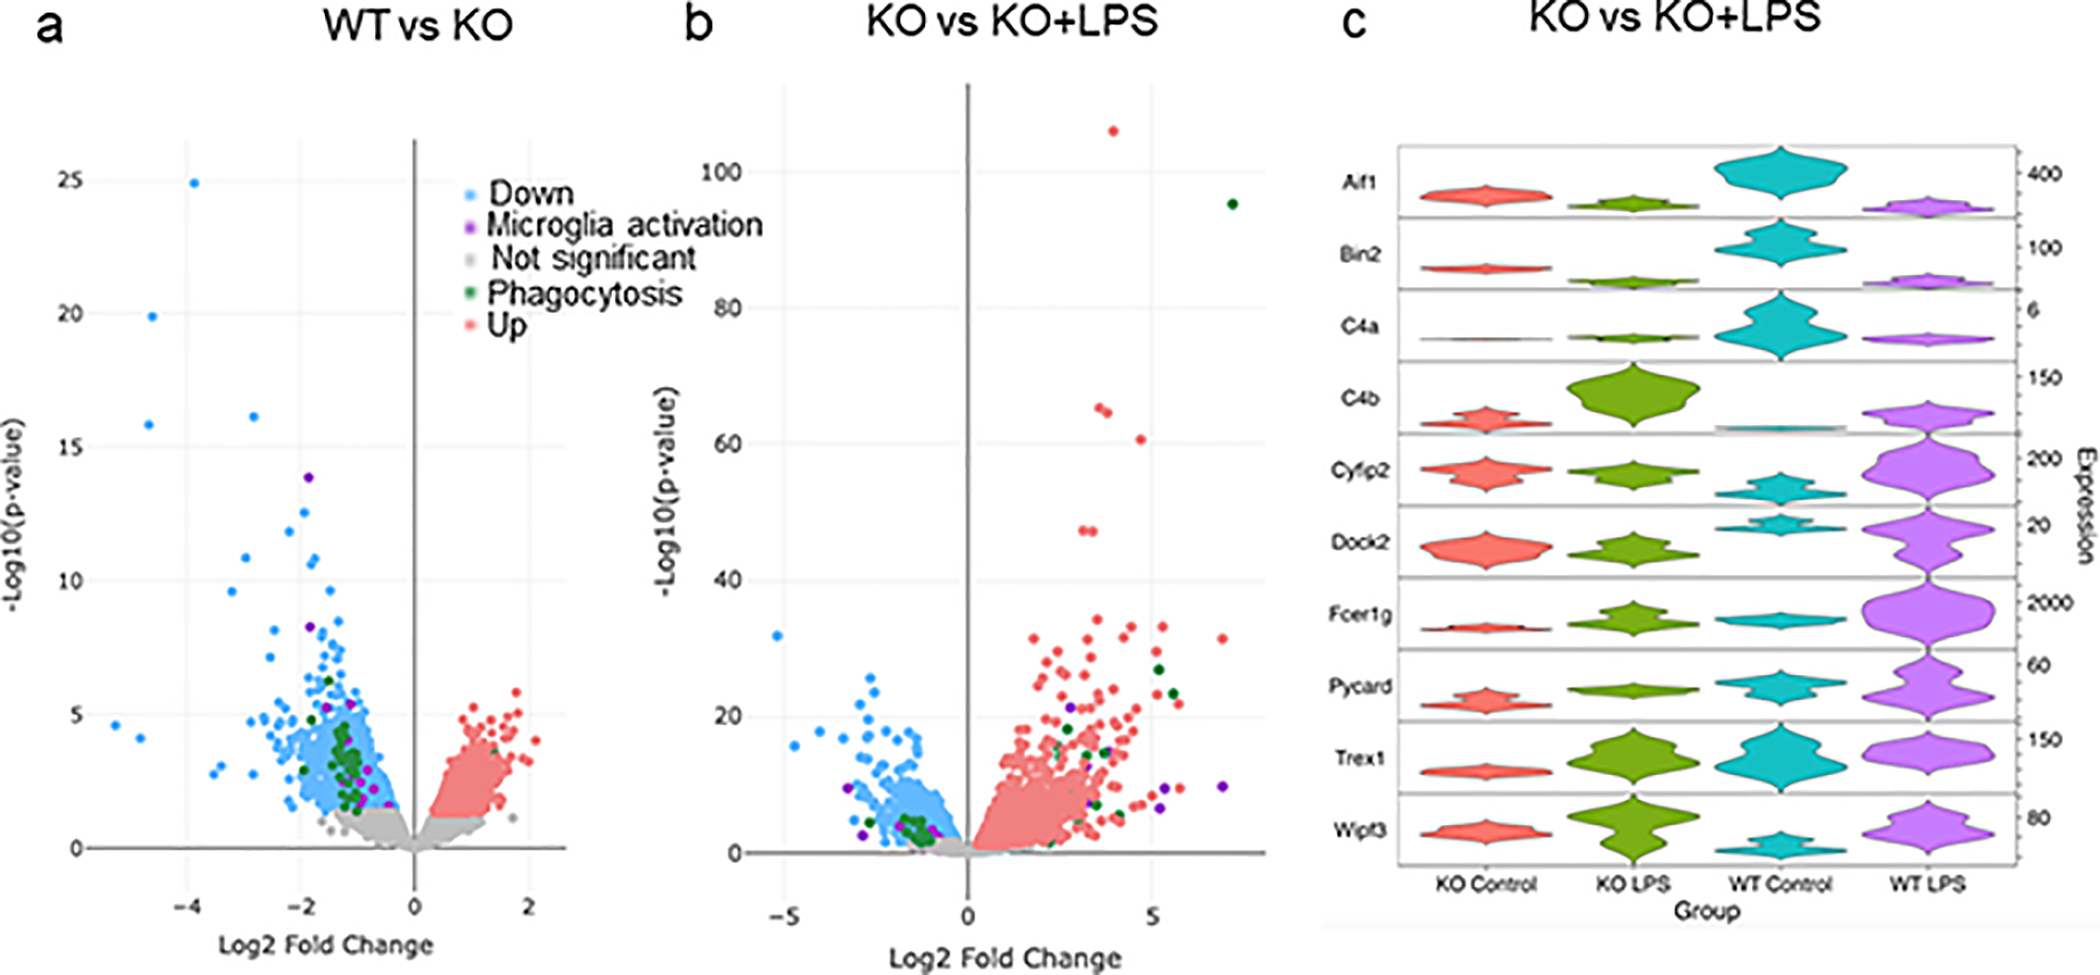
Differentail expression of RNAs encoding proteions involved in phagocytosis. (a) Volcano plot of differential expressed RNAs in WT vs KO microglia that are involved in microglia activation (purple) or phagocytosis (green). (b) Volcano plot of differential expressed RNAs in WT+LPS vs KO+LPS microglia that are involved in microglia activation (purple) or phagocytosis (green). (c) Violin plots of 10 most differentially expressed RNAs that encode proteins involved in phagocytosis (KO vs KO+LPS). All changes are p<0.05; expression in transcripts per million (TPM).
We considered whether RNA splicing might be mis-regulated in microglia as a consequence of CPEB1 depletion and/or LPS treatment, which in turn could affect inflammation or phagocytosis. Many hundreds of RNA were mis-spliced, primarily skipped exons and mutually exclusive exons, in CPEB1-deficient microglia relative to WT or KO treated with LPS. However, GO term analysis did not indicate that these events would be likely to mediate inflammation or phagocytosis (Figure S3).
Finally, we also examined alternative poly(A) site selection (APA), which has previously been shown to be regulated by CPEB1 (Lin et al., 2010; Bava et al., 2013). Recent evidence also indicates that APA is altered in microglia treated with LPS (Hwang et al., 2017; Jereb et al., 2018). APA is a process that results in lengthened or shortend 3’ UTRs, which in turn can regulate RNA localization, translation, and stability (Elkon et al., 2013; Jereb et al., 2018; Hwang et al., 2017). Figure 8a shows that in CPEB1-deficient microglia as well as those treated with LPS there is widespread lengthening and shortening of 3’ UTRs. A heat map of these APA changes shows that they may be grouped into 5 main clusters, each containing hundreds of RNAs (Figure 8b). The violin plots at the left of the panel show a comparison of each genotype (WT or CPEB1 KO) and treatment (i.e., +/− LPS) to each other with respect to long or short 3’UTRs. Figure 8c shows a summary of the comparisons of major 3’ UTR changes as a function of genotype and/or treatment of microglia. For example, when comparing KO to WT, clusters 1 (containing ERK signaliing components and actin bundling factors), 2 (synaptic signaling, cell morphogenesis), and 4 (protein localization factors) contain RNAs that were shortened whereas clusters 3 (mRNA translation and other RNA expression factors) and 5 (no GO terms that statistically significant) contain RNAs that were lengthened (Figure S4). Interestingly, while LPS had little effect on CPEB1-deficient APA outside of cluster 5, LPS had a large effect on WT APA in all clusters except cluster 5. The top 20 mRNAs with lengthened or shortened 3’UTRs are shown on the volcano plots in Figure S5. These results show that both CPEB1 deficiency and LPS alter APA in hundreds of RNAs, resulting in lengthening and shortening of 3’UTRs.
FIGURE 8.
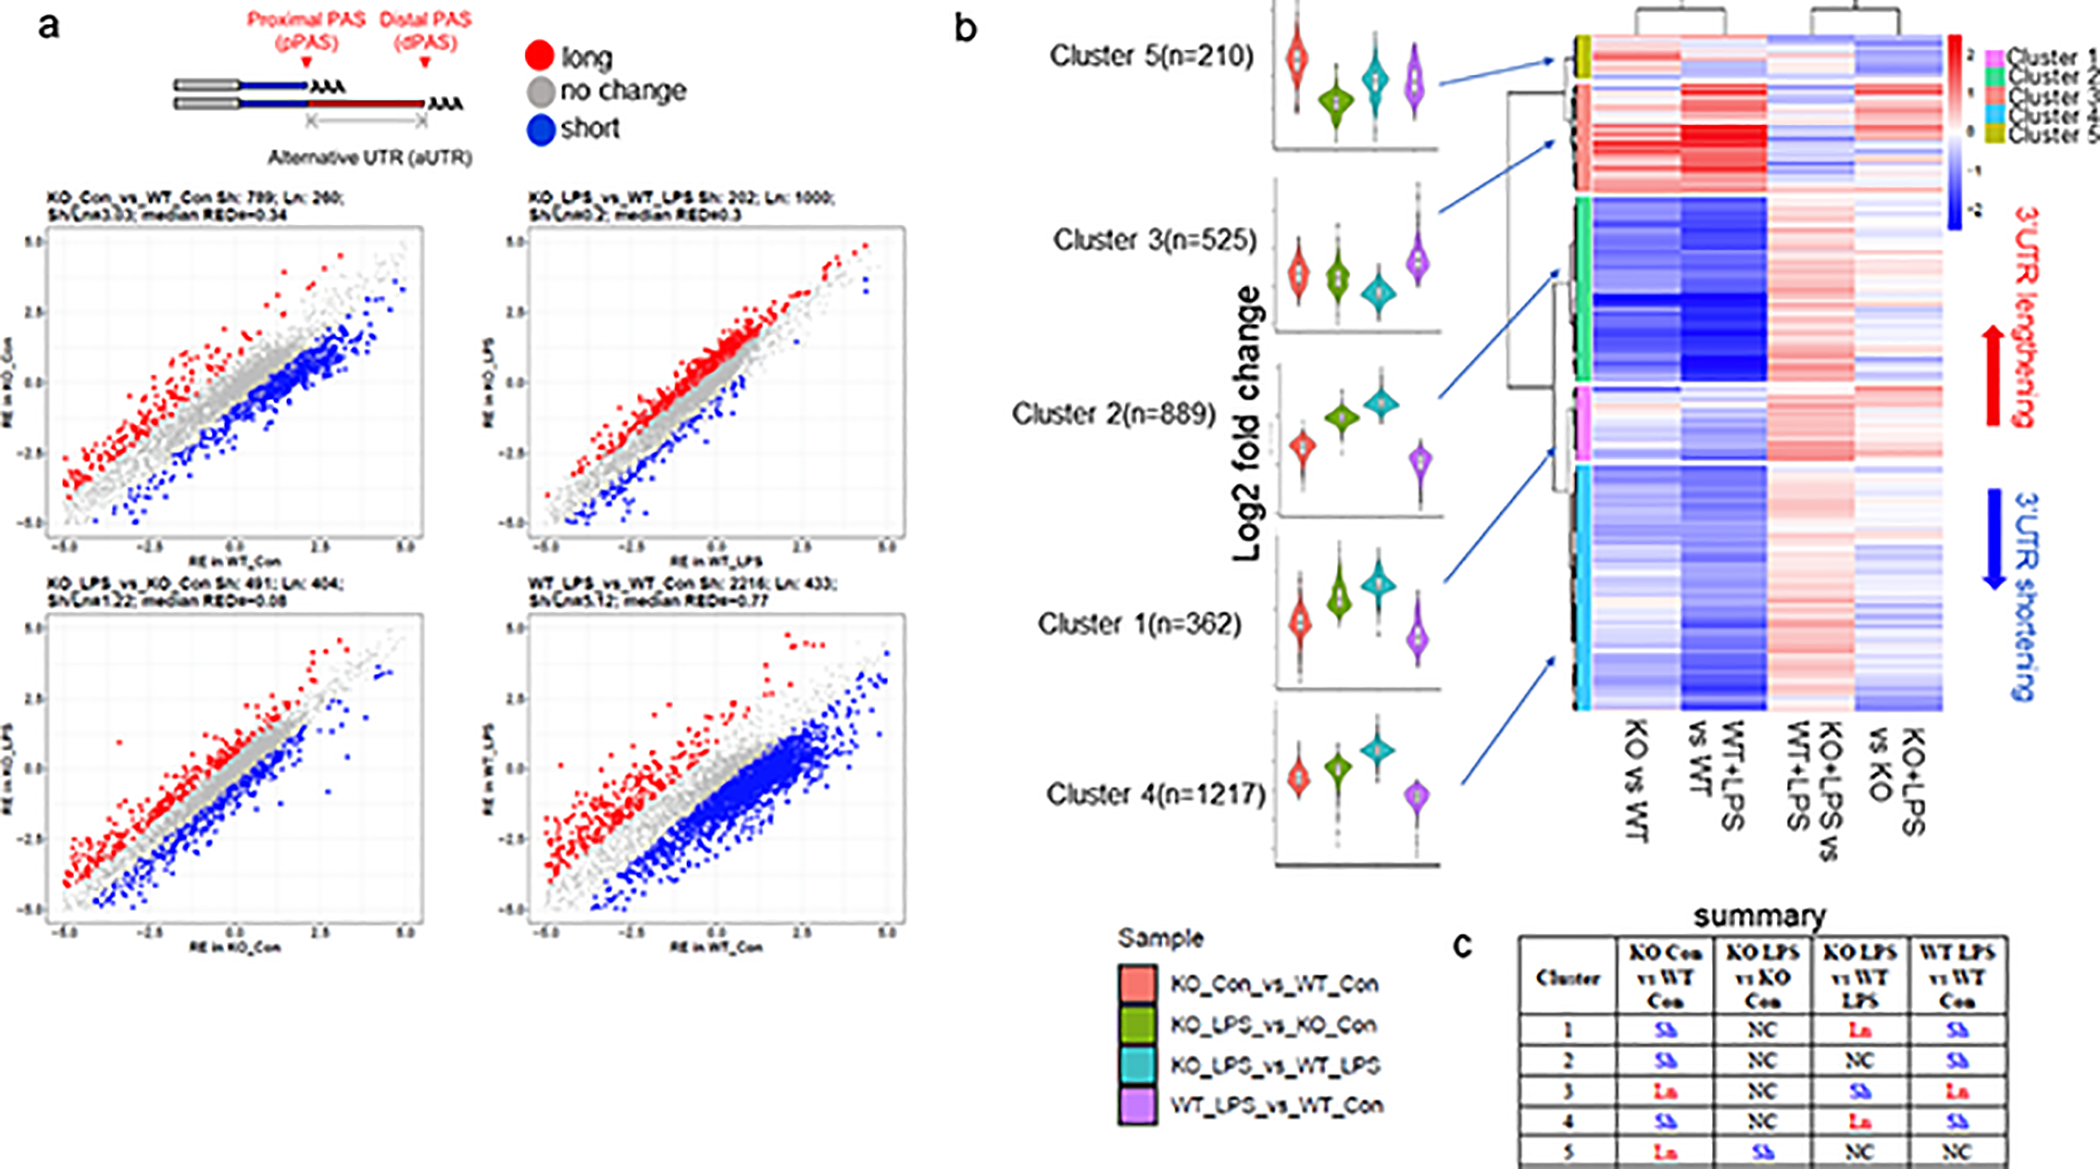
Alternative poly(A) site selection in CPEB1-deficient microglia. (a) At top is an illustration of proximal and distal poly(A) cleavage sites (PAS) leading to alterantive 3’ UTR length. At bottom is differential poly(A) site cealvage selection when comparing pairwise KO vs WT; KO+LPS vs WT+LPS; KO+LPS vs KO; WT+LPS vs WT). Long (red) or short (blue) 3’UTRs are indicated. (b) Cluster analysis of RNAs with long or short 3’ UTRs in the indicated pairwise comparisons (based on log2FC). The number of RNAs in each cluster is indicated. The color of the violin plots designate each pairwise comparison (sample). (c) Summary of short or long 3’UTRs in each cluster with the indicated pairwise comparison.
Because APA changes could be linked to and possibly be responsible for alterations in RNA stability, we compared this posttranscriptional modificaton with differential gene expression, which combine variences of both transcription and stability Figure S6 shows that there is modest overlap among RNAs that undergo APA lengthening or shortening with differential expression, either up or down. These comparisons were made with both WT and CPEB1 KO either untreated or injected with LPS. We therefore conclude that APA does not exert a major influence on RNA stability.
CPEB1 is a sequence-specific RNA binding protein that recognizes U-rich motifs present mRNA 3’ UTRs. These cytoplasmic polyadenylation elements (CPEs) as they were first called, have the general structure of UUUUUAU, but this can vary with the number of uridines and the occasional other nucleotide (Mendez and Richter 2001; Ivshina et al.,. 2015). We analyzed prevalent sequence motifs in RNAs undergoing APA as a function of CPEB1-deficiency or LPS, which might indicate putative binding sites of CPEB1 and suggest possible mechanism(s) of its activity. Figure 9a shows sequence motifs in RNAs from WT vs CPEB1 KO microglia that have long or short 3’UTRs. The motifs are designated as being in the constitutive (cUTR) UTR, which are present on all RNAs, or alternative UTRs (aUTRs) which correspond to the long UTRs. A remarkably prevalent motif present in the aUTRs that are shortened is UUUUUU, which is a likely CPEB1 binding site. Based on this element, we propose that CPEB1 inhibits RNA cleavage of the proximal APA site. In the absence of CPEB1, proximal site cleavage takes place, resulting in short 3’ UTRs (Figure 9b). Examination of sequence motifs in WT microglia treated with LPS reveals prevalent U-rich motifs are present in the long UTRs that undergo shortening with LPS treatment (Figure 9c). These elements again suggest binding sites for CPEB1 (or other U-rich RNA binding proteins). It may be that TLR4 signaling following LPS administration acts on CPEB1, perhaps by causing its destruction, dissociation from the RNA, or interference by another RNA binding protein. The result of this inhibition of CPEB1 function, however it occurs, results in shortened 3’UTRs (Figure 9da). Shortened 3’UTRs would have fewer interaction sites for miRNAs and RNA binding proteins than long 3’UTRs. As a consequence, RNAs with short 3’UTRs would likely be differentially translated, localized to subcellular regions, or have altered stability compared to RNAs with long 3’UTRs. Thus, alteration of 3’UTR length could impact the proteome in response to environmental changes such as inflammation.
FIGURE 9.
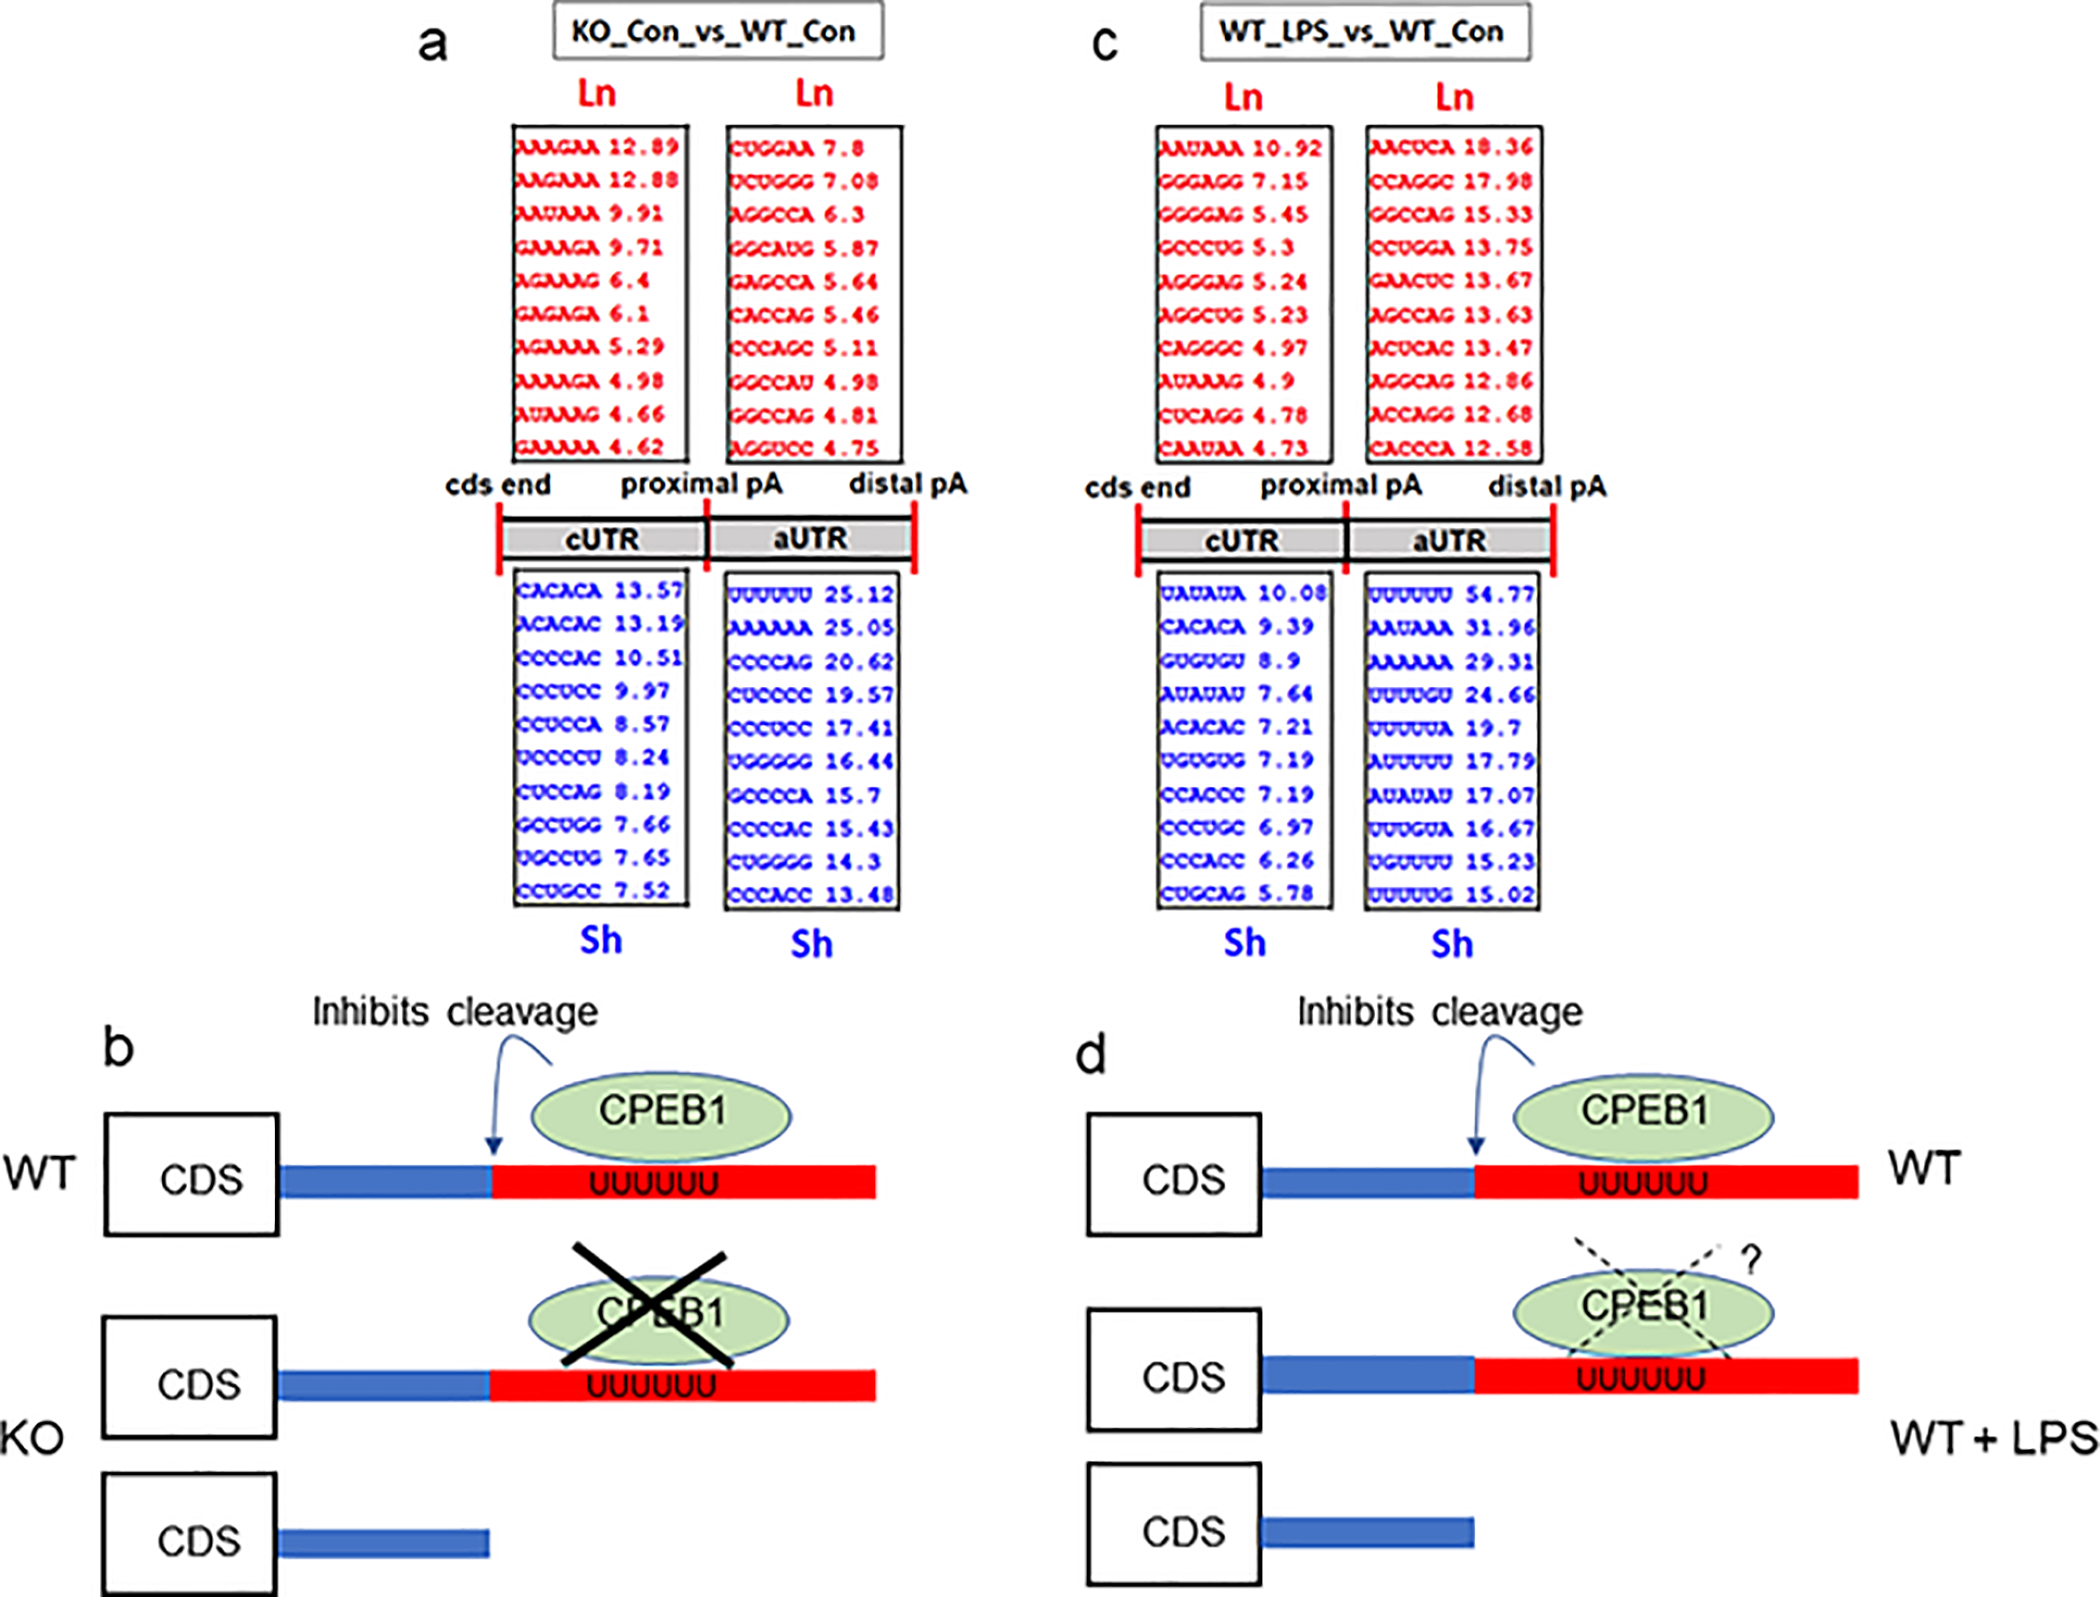
Motif analysis of RNAs with altered 3’ UTRs. (a) Most prevalent hexanucleotide motifs in RNAs that undergo lengthening or shortening in KO vs WT microglia and their relative positions in the UTR (i.e., in the short or constitutive portion, cUTR, on alternative UTR, aUTR). (b) The UUUUUU motif is a putative CPEB1 binding site. An hypothesis for the regulation of 3’UTR length in KO vs WT is that CPEB1 normal inhibits cleavage at the proximal poly(A) site, resulting in long UTRs in WT. In CPEB1 KO, the absence of CPEB1 allows for cleavage at the proximal poly(A) site, yielding RNAs with short 3’UTRs. (c) Most prevalent hexanucleotide motifs in RNAs that undergo lengthening or shortening in WT+LPS vs WT microglia and their relative positions in the UTR (i.e., in the short or constitutive portion, cUTR, on alternative UTR, aUTR). (d) The many U-rich motifs are putative CPEB1 binding sites. An hypothesis for the regulation of 3’UTR length in WT vs WT+LPS is that CPEB1 normal inhibits cleavage at the proximal poly(A) site, resulting in long UTRs in WT. In WT+LPS, CPEB1 may undrgo some distruction, dissociaotn form the RNA, or abrogation of its activity, which would allow for cleavage at the proximal poly(A) site, yielding RNAs with short 3’UTRs
4. DISCUSSION
This study demonstrates that CPEB1 is a key regulator of microglial inflammatory response and phagocytosis. Although microglia from CPEB1 KO mice are similar at baseline to those from WT animals, when the KO mice are injected with LPS, the microglia express elevated levels of Iba1 and higher levels of IL6, indicating an increased inflammatory response. Interestingly, microglia from KO mice engulf more synaptosomes in vitro, but this response, unlike with inflammation, is only modestly stimulated by LPS. It is possible that phagocytosis may be saturated in the KO microglia and cannot be stimulated further by LPS, at least not via the TLR4 receptor.
One molecule near the top of a hierarchical cascade leading to the inflammatory response is TAK1 (Goldman et al., 2013; Ivshina et al., 2015; Xu et al., 2018; Xu and Lei 2021). TAK1 mRNA has a CPEB1 binding site in its 3’UTR, co-immunoprecipitates with CPEB1 (assessed in peritoneal macrophages), and inhibits its translation (Figure 2a,c;Ivshina et al, 2015). CPEB1 depletion therefore elevates TAK1 synthesis, which in turn leads to multiple downstream signaling events culminating in NFκB nuclear import and transcription of multiple cytokine genes including IL6 (Xu and Lei 2021). However, CPEB1 regulation of this signaling cascade is more complex. For example, JNK and phospho-JNK as well as TAK1 are elevated in KO microglia relative to WT. Moreover, LPS treatment of CPEB1 KO mice elicits very stong phosphorylation of ERK, which also promotes the inflammatory response. These observations suggest that CPEB1 may normally inhibit ERK kinases and/or stimulate ERK phosphatases to limit inflammatory gene transcription under normal conditions.
CPEB1 regulation of phagocytosis is even more complex as this process requires a plethora of factors and processes ranging from transcription factors to cytoskeleton remodeling to endoplasmic reticulum/Golgi trafficking, lysosome activity and much more (Haney et al., 2018, Vorselen et al., 2021; Saftig and Klumperman 2009; Li et al., 2021). MAP kinase is one of several signaling molecules revealed by CRISPR screens to be involved in phagocytosis (Haney et al 2018), and it is one of the enzymes that regulates CPEB1 activity through phosphorylation (Mendez et al., 2000; Keady et al., 2007). It is therefore possible that MAP kinse and CPEB1 form a nexus for the regulation of phagocytosis.
RNA seq revealed that CPEB1 regulates the levels of many RNAs encoding proteins involved in the inflammatory response. However, it is surprising that most of these RNAs are down-regulated in the KO. For at least some of these transcripts, there may be a disconnect between RNA and protein levels (Jiang et al., 2020), which may be due to translational buffering. In this case, the number of ribosomes associated with RNA, which serve as a proxy for protein synthesis, may track in opposite directions of RNA (Liu et al., 2018). That is, proteostasis is maintained by increasing or decreasing the number of ribosomes that are down or up-regulated, respectively. LPS-treatment of KO animals could disrupt this proteostasis. Moreover, translation is often tightly coupled to RNA stability (Hanson and Coller 2018); perhaps up or down regulation of translation alters the levels of these RNAs via instability. However, not all transcripts are regulated in this manner; IL6 RNA and protein, for example, are both up-regulated in CPEB1-deficient microglia from LPS treated animals (Figure 3).
Some of the differentially expressed RNAs have been detected previously in stimulated microglia. For example, the RNA encoding ASS1 (arginine succinate synthase I), a urea cycle enzyme, is up-regulated in microglia treated with interferon-α (Li et al., 2018). The up-regulated complement factor C4a elicits synaptic loss and has been linked to schizophrenia (Yilmaz et al., 2021). One unexpected RNA is Ly896 (lymphocyte antigen antisense RNA 1), a lncRNA associated with insulin resistance and diabetes but that also is up-regulated in an experimental autoimmune encephalomyelitis mouse model (Hasan et al., 2016). Whether the regulation of these or RNAs regulate nflammation or phagocytosis directly requires further investigation.
Our studies demonstrate that CPEB1 and LPS promote widepread changes in alternative poly(A) site selection (APA) in microglia. This control of 3’UTR length is likely to be a nuclear function of CPEB1 as it shuttles between nucleus and cytoplasm (Ernoult-Lange et al., 2009; Lin et al., 2010; Bava et al., 2013). APA greatly expands the diversity of mRNA localization, translation, and RNA turnover than with a single 3’UTR length (Tian and Manley 2017), and exerts strong control on the inflammatory response (Blake and Lynch 2021). 3’UTR cleavage is a complex process involving numerous RNA binding and cleavage factors (Tian and Manley 2017; Oh et al., 2020) factors, one of which is U2AF65. On at least one RNA, CPEB1 regulates the association of this factor with RNA, thereby determining the site of 3’UTR cleavage (Bava et al., 2013). In microglia, our data show that the U-rich CPEB1 binding site is prevalent in 3’UTRs distal to the upstream (proximal) cleavage site (Figure 9a,c). The observation that in CPEB1 KO microglia many 3’UTRs with this sequence are shortened suggests that CPEB1 normally prevents cleavage at the proximal site, perhaps by interfering with the activity or binding U2AF65 or other proteins (Figure 9b).
When WT or CPEB1 KO mice are treated with LPS, microglia undergo more complex changes in 3’UTR cleavage, which is evident in the cluster analysis in Figure 8. Interestingly, although CPEB1 KO microglia display extensive alterations in 3’UTR cleavage, KO animals treated with LPS show substantially fewer changes, perhaps indicating a near-saturation of these processing events. WT animals treated with LPS display the greatest preponderance of APA, which has also been observed by Hwalarang et al (2017). The mechanism by which LPS-induced TLR4 signaling promotes 3’ UTR cleavage is unclear, but it may involve elevated levels of the critical RNA cleavage factor CstF-64 (Shell et al., 2005); whether CPEB1 alters CstF-64 in some manner is unknown. In any event, Figure 9c shows that in WT microglia, extremely prevalent U-rich sequences are present in distal 3’UTR regions for those mRNAs that under shortening upon LPS treatment. These sequences are putative CPEB1 binding sites, which might indicate that LPS treatment leads an abrogation of CPEB1 activity by inducing it’s destruction, dissociation from the mRNA, or other form of inhibtion to allow for cleavage at the proxmal poly(A) site (Figure 9d).
Supplementary Material
FIGURE S1 LPS activation of of signaling events in WT microglia. Western blots and quantification of several signaling molecues in microglia stimiulated with LPS (5 mg/kg) from 0 to 24 hours.
FIGURE S2 (s) Single cell population gating of microglia incubated with synaptosome-labeled pHrhodoRed using forward and side scatter characteristics. (b) APC anti-CD11b as a marker for microglia identification. Unstained cell controls (left) and isotype antibody stained cells to determine the negative population (middle). At right is a representative cell gating of CD11b-positive cells in a WT sample. (c) Gated contour plots of microglial cells analyzed for pHrodoRed-labeled synaptosome uptake by FSC-A (x-axis) vs pHrhodoRed (y-axis). At left is gating of CD11b and pHrhodoRed double-stained control. At right is representative cell gating of CD11b and pHrhodoRed double-positive cells in WT. (d) Geometric mean of three microglial samples each (i.e., triplicates consisting of 2 mice each), of the various groups that were assess by FACS of engulfment of pHrodoRed-labeled synaptosomes.
FIGURE S4 GO term analysis of clusters 1–4 containing RNAs with altered poly(A) cleavage sites (cf Fig 7).
FIGURE S3 Analysis of alternative splicing in CPEB1-deficient microglia. (a) Types of altrnative splcing events. (b) Analysis of exon skipping (SE) and mutually exclusive exons (MXE) in pairwise comparison of WT vs KO microglia. (c) Analysis of exon skipping and mutually exclusive exons in pairwise comparison of KO vs KO+LPS microglia. (d) Analysis of exon skipping and mutually exclusive exons in pairwise comparison of KO+LPS vs WT+LPS microglia. (e) Analysis of exon skipping and mutually exclusive exons in pairwise comparison of WT vs WT+LPS microglia. PSI, percent splicing in. All data are statistically significant (p<0.05). (f) GO term analysis of alternative splicing events.
FIGURE S6 Venn diagrams comparing RNAs that under APA lengthening or shortening with changes in differential expression, up or down. All conditions were analyzed: CPEB1 KO vs WT; CPEB1 K+LPS vs WT; CPEB1 KO+LPS vs WT+PS; WT+LPS vs WT.
FIGURE S5 Identification of the top 20 mRNAs with lengthened or shorten 3’UTRs in WT versus CPEB1 +/− LPS treatment.
v. Acknowledgments
We are grateful to Dr. Rachel Gerstein for help with fluorescence activated cell sorting and Dr. Ruijia Wang for help with bioinformatic analysis. Artwork was generated with BioRender.com. This work was supported by NIH grants R01GM046779 and R01GM135087 (to JDR), R03MH121871 (to MI), and R01MH113743 and R01NS117533 (to DPS).
Footnotes
CONFLICT ON INTEREST
The authors declare no competing financial interests
References
- Alarcon JM, Hodgman R, Theis M, Huang YS, Kandel ER, & Richter JD (2004). Selective modulation of some forms of schaffer collateral-CA1 synaptic plasticity in mice with a disruption of the CPEB-1 gene. Learn Mem. 11(3):318–327. doi: 10.1101/lm.72704. [DOI] [PMC free article] [PubMed] [Google Scholar]
- Allendorf DH, Franssen EH, & Brown GC (2020). Lipopolysaccharide activates microglia via neuraminidase 1 desialylation of Toll-like Receptor 4. J Neurochem. 155(4):403–416. doi: 10.1111/jnc.15024. [DOI] [PubMed] [Google Scholar]
- Barnard DC, Ryan K, Manley JL, & Richter JD (2004). Symplekin and xGLD-2 are required for CPEB-mediated cytoplasmic polyadenylation. Cell 119(5):641–651. doi: 10.1016/j.cell.2004.10.029. [DOI] [PubMed] [Google Scholar]
- Bava FA, Eliscovich C, Ferreira PG, Miñana B, Ben-Dov C, Guigó R, Valcárcel J, & Méndez R (2013). CPEB1 coordinates alternative 3’-UTR formation with translational regulation. Nature 495(7439):121–125. doi: 10.1038/nature11901. [DOI] [PubMed] [Google Scholar]
- Berger-Sweeney J, Zearfoss NR, & Richter JD (2006). Reduced extinction of hippocampal-dependent memories in CPEB knockout mice. Learn Mem. 13(1):4–7. doi: 10.1101/lm.73706. [DOI] [PubMed] [Google Scholar]
- Blake D, & Lynch KW (2021). The three as: Alternative splicing, alternative polyadenylation and their impact on apoptosis in immune function. Immunol Rev. 304(1):30–50. doi: 10.1111/imr.13018. [DOI] [PMC free article] [PubMed] [Google Scholar]
- Burns DM, D’Ambrogio A, Nottrott S, & Richter JD (2011). CPEB and two poly(A) polymerases control miR-122 stability and p53 mRNA translation. Nature 473(7345):105–108. doi: 10.1038/nature09908. [DOI] [PMC free article] [PubMed] [Google Scholar]
- Byun YG, & Chung WS (2018). A novel in vitro live-imaging assay of astrocyte-mediated phagocytosis using pH indicator-conjugated synaptosomes. J Vis Exp. 5(132):56647. doi: 10.3791/56647. [DOI] [PMC free article] [PubMed] [Google Scholar]
- Darnell JC, & Richter JD (2012). Cytoplasmic RNA-binding proteins and the control of complex brain function. Cold Spring Harb Perspect Biol. 4(8):a012344. doi: 10.1101/cshperspect.a012344. [DOI] [PMC free article] [PubMed] [Google Scholar]
- Elkon R, Ugalde AP, $ Agami R (2013). Alternative cleavage and polyadenylation: extent, regulation and function. Nat Rev Genet. 14(7):496–506. doi: 10.1038/nrg3482. [DOI] [PubMed] [Google Scholar]
- Ernoult-Lange M, Wilczynska A, Harper M, Aigueperse C, Dautry F, Kress M, & Weil D (2009). Nucleocytoplasmic traffic of CPEB1 and accumulation in Crm1 nucleolar bodies. Mol Biol Cell 20(1):176–187. doi: 10.1091/mbc.e08-09-0904. [DOI] [PMC free article] [PubMed] [Google Scholar]
- Frost JL, & Schafer DP (2016). Microglia: architects of the developing nervous system. Trends Cell Biol. 26(8):587–597. doi: 10.1016/j.tcb.2016.02.006. Epub [DOI] [PMC free article] [PubMed] [Google Scholar]
- Goldmann T, Wieghofer P, Müller PF, Wolf Y, Varol D, Yona S, Brendecke SM, Kierdorf K, Staszewski O, Datta M, Luedde T, Heikenwalder M, Jung S, & Prinz M (2013). A new type of microglia gene targeting shows TAK1 to be pivotal in CNS autoimmune inflammation. Nat Neurosci. 16(11):1618–1626. doi: 10.1038/nn.3531. [DOI] [PubMed] [Google Scholar]
- Groppo R, & Richter JD. (2011). CPEB control of NF-kappaB nuclear localization and interleukin-6 production mediates cellular senescence. Mol Cell Biol. 31(13):2707–2714. doi: 10.1128/MCB.05133-11. [DOI] [PMC free article] [PubMed] [Google Scholar]
- Haney MS, & Bohlen CJ, et al.(2018). Identification of phagocytosis regulators using magnetic genome-wide CRISPR screens. Nat Genet. 50(12):1716–1727. doi: 10.1038/s41588-018-0254-1. [DOI] [PMC free article] [PubMed] [Google Scholar]
- Hanson G, & Coller J (2018). Codon optimality, bias and usage in translation and mRNA decay. Nat Rev Mol Cell Biol. 19(1):20–30. doi: 10.1038/nrm.2017.91. [DOI] [PMC free article] [PubMed] [Google Scholar]
- Hasan M, Seo JE, Rahaman KA, Min H, Kim KH, Park JH, Sung C, Son J, Kang MJ, Jung BH, Park WS, & Kwon OS. (2017). Novel genes in brain tissues of EAE-induced normal and obese mice: Upregulation of metal ion-binding protein genes in obese-EAE mice. Neuroscience. 343:322–336. doi: 10.1016/j.neuroscience.2016.12.002 [DOI] [PubMed] [Google Scholar]
- Hickman S, Izzy S, Sen P, Morsett L, & El Khoury J(2018). Microglia in neurodegeneration. Nat Neurosci. 21(10):1359–1369. doi: 10.1038/s41593-018-0242-x [DOI] [PMC free article] [PubMed] [Google Scholar]
- Hoogland IC, Houbolt C, van Westerloo DJ, van Gool WA, & van de Beek DJ (2015). Systemic inflammation and microglial activation: systematic review of animal experiments. J. Neuroinflammation 12:114. doi: 10.1186/s12974-015-0332-6. [DOI] [PMC free article] [PubMed] [Google Scholar]
- Huang YS, Jung MY, Sarkissian M, & Richter JD (2002). N-methyl-D-aspartate receptor signaling results in Aurora kinase-catalyzed CPEB phosphorylation and alpha CaMKII mRNA polyadenylation at synapses. EMBO J. 21(9):2139–2148. [DOI] [PMC free article] [PubMed] [Google Scholar]
- Hwang HW, Saito Y, Park CY, Blachère NE, Tajima Y, Fak JJ, Zucker-Scharff I, & Darnell RB (2017). cTag-PAPERCLIP reveals alternative polyadenylation promotes cell-type specific protein diversity and shifts araf isoforms with microglia activation. Neuron 95(6):1334–1349. doi: 10.1016/j.celrep.2016.03.023. [DOI] [PMC free article] [PubMed] [Google Scholar]
- Ivshina M, Alexandrov IM, Vertii A, Doxsey S, & Richter JD (2015). CPEB regulation of TAK1 synthesis mediates cytokine production and the inflammatory immune response. Mol Cell Biol. 35(3):610–618. doi: 10.1128/MCB.00800-14. [DOI] [PMC free article] [PubMed] [Google Scholar]
- Ivshina M, Lasko P, & Richter JD (2014). Cytoplasmic polyadenylation element binding proteins in development, health, and disease. Annu Rev Cell Dev Biol. 30:393–415. doi: 10.1146/annurev-cellbio-101011-155831. [DOI] [PubMed] [Google Scholar]
- Jereb S, Hwang HW, Van Otterloo E, Govek EE, Fak JJ, Yuan Y, Hatten ME, & Darnell RB (2018). Differential 3’ processing of specific transcripts expands regulatory and protein diversity across neuronal cell types. Elife 7:e34042. doi: 10.7554/eLife.34042. [DOI] [PMC free article] [PubMed] [Google Scholar]
- Jiang L, Wang M, Lin S, Jian R, Li X, Chan J, Dong G, Fang H, Robinson AE; GTEx Consortium, & Snyder MP (2020). A quantitative proteome map of the human body. Cell 183(1):269–283. doi: 10.1016/j.cell.2020.08.036 [DOI] [PMC free article] [PubMed] [Google Scholar]
- Keady BT, Kuo P, Martínez SE, Yuan L, & Hake LE (2007). MAPK interacts with XGef and is required for CPEB activation during meiosis in Xenopus oocytes. J Cell Sci. 120(6):1093–1103. doi: 10.1242/jcs.03416. [DOI] [PubMed] [Google Scholar]
- Lee JK, & Tansey MG (2013). Microglia isolation from adult mouse brain. Methods Mol Biol. 1041:17–23. doi: 10.1007/978-1-62703-520-0_3. [DOI] [PMC free article] [PubMed] [Google Scholar]
- Li G, Sherchan P, Tang Z, & Tang J (2021). Autophagy & phagocytosis in neurological disorders and their possible cross-talk. Curr Neuropharmacol. 19(11):1912–1924. [DOI] [PMC free article] [PubMed] [Google Scholar]
- Li Q &, Barres BA (2018). Microglia and macrophages in brain homeostasis and disease. Nat Rev Immunol. 18(4):225–242. doi: 10.1038/nri.2017.125. [DOI] [PubMed] [Google Scholar]
- Li W, Viengkhou B, Denyer G, West PK, Campbell IL, & Hofer MJ (2018). Microglia have a more extensive and divergent response to interferon-α compared with astrocytes. Glia 66(10):2058–2078. doi: 10.1002/glia.23460. [DOI] [PubMed] [Google Scholar]
- Lin CL, Evans V, Shen S, Xing Y, & Richter JD (2010). The nuclear experience of CPEB: implications for RNA processing and translational control. RNA 16(2):338–348. doi: 10.1261/rna.1779810. [DOI] [PMC free article] [PubMed] [Google Scholar]
- Liu B, Li Y, Stackpole EE, Novak A, Gao Y, Zhao Y, Zhao X, & Richter JD (2018). Regulatory discrimination of mRNAs by FMRP controls mouse adult neural stem cell differentiation. Proc Natl Acad Sci U S A. 115(48):E11397–E11405. doi: 10.1073/pnas.1809588115 [DOI] [PMC free article] [PubMed] [Google Scholar]
- Mendez R, Hake LE, Andresson T, Littlepage LE, Ruderman JV, & Richter JD (2000). Phosphorylation of CPE binding factor by Eg2 regulates translation of c-mos mRNA. Nature 404(6775):302–307. doi: 10.1038/35005126 [DOI] [PubMed] [Google Scholar]
- Mendez R, & Richter JD (2001). Translational control by CPEB: a means to the end. Nat Rev Mol Cell Biol. 2(7):521–529. doi: 10.1038/35080081. [DOI] [PubMed] [Google Scholar]
- Oh JM, Venters CC, Di C, Pinto AM, Wan L, Younis I, Cai Z, Arai C, So BR, Duan J, & Dreyfuss G (2020). U1 snRNP regulates cancer cell migration and invasion in vitro. Nat Commun. 11(1):1. doi: 10.1038/s41467-019-13993-7. [DOI] [PMC free article] [PubMed] [Google Scholar]
- Saftig P, & Klumperman J. (2009). Lysosome biogenesis and lysosomal membrane proteins: trafficking meets function. Nat Rev Mol Cell Biol. 10(9):623–635. doi: 10.1038/nrm2745 [DOI] [PubMed] [Google Scholar]
- Shell SA, Hesse C, Morris SM Jr, & Milcarek C (2005). Elevated levels of the 64-kDa cleavage stimulatory factor (CstF-64) in lipopolysaccharide-stimulated macrophages influence gene expression and induce alternative poly(A) site selection. J Biol Chem. 280(48):39950–39961. doi: 10.1074/jbc.M508848200 [DOI] [PubMed] [Google Scholar]
- Shen S, Park JW, Lu ZX, Lin L, Henry MD, Wu YN, Zhou Q, & Xing Y (2014). rMATS: robust and flexible detection of differential alternative splicing from replicate RNA-Seq data. Proc Natl Acad Sci U S A. 111(51):E5593–5601. doi: 10.1073/pnas.1419161111. [DOI] [PMC free article] [PubMed] [Google Scholar]
- Shu H, Donnard E, Liu B, Jung S, Wang R, & Richter JD (2020). FMRP links optimal codons to mRNA stability in neurons. Proc Natl Acad Sci U S A. 117(48):30400–30411. doi: 10.1073/pnas.2009161117. [DOI] [PMC free article] [PubMed] [Google Scholar]
- Tay J,. & Richter JD (2001). Germ cell differentiation and synaptonemal complex formation are disrupted in CPEB knockout mice. Dev Cell. 1(2):201–213. doi: 10.1016/s1534-5807(01)00025-9. [DOI] [PubMed] [Google Scholar]
- Tian B, & Manley JL (2017). Alternative polyadenylation of mRNA precursors. Nat Rev Mol Cell Biol. 18(1):18–30. doi: 10.1038/nrm.2016.116. [DOI] [PMC free article] [PubMed] [Google Scholar]
- Vorselen D, Barger SR, Wang Y, Cai W, Theriot JA, Gauthier NC, & Krendel M (2021). Phagocytic ‘teeth’ and myosin-II ‘jaw’ power target constriction during phagocytosis. Elife 10:e68627. doi: 10.7554/eLife.68627. [DOI] [PMC free article] [PubMed] [Google Scholar]
- Wang X, Wang C, Wang J, Zhao S, Zhang K, Wang J, Zhang W, Wu C, & Yang J (2014). Pseudoginsenoside-F11 (PF11) exerts anti-neuroinflammatory effects on LPS-activated microglial cells by inhibiting TLR4-mediated TAK1/IKK/NF-kappaB, MAPKs and Akt signaling pathways. Neuropharmacology 79:642–656. doi: 10.1016/j.neuropharm.2014.01.022. [DOI] [PubMed] [Google Scholar]
- Wilton DK, Dissing-Olesen L, & Stevens B (2019). Neuron-glia signaling in synapse elimination. Annu Rev Neurosci. 42:107–127. doi: 10.1146/annurev-neuro-070918-050306. [DOI] [PubMed] [Google Scholar]
- Wu L, Wells D, Tay J, Mendis D, Abbott MA, Barnitt A, Quinlan E, Heynen A, Fallon JR, & Richter JD (1998). CPEB-mediated cytoplasmic polyadenylation and the regulation of experience-dependent translation of alpha-CaMKII mRNA at synapses. Neuron 21(5):1129–1139. doi: 10.1016/s0896-6273(00)80630-3. [DOI] [PubMed] [Google Scholar]
- Xu D, Jin T, Zhu H, Chen H, Ofengeim D, Zou C, Mifflin L, Pan L, Amin P, Li W, Shan B, Naito MG, Meng H, Li Y, Pan H, Aron L, Adiconis X, Levin JZ, Yankner BA, & Yuan J (2018). TBK1 suppresses RIPK1-driven apoptosis and inflammation during development and in aging. Cell 174(6):1477–1491. doi: 10.1016/j.cell.2018.07.041 [DOI] [PMC free article] [PubMed] [Google Scholar]
- Xu YR, & Lei CQ (2021). TAK1-TABs complex: a central signalosome in inflammatory responses. Front Immunol. 11:608976. doi: 10.3389/fimmu.2020.608976. [DOI] [PMC free article] [PubMed] [Google Scholar]
- Yilmaz M, Yalcin E, Presumey J, Aw E, Ma M, Whelan CW, Stevens B, McCarroll SA, & Carroll MC (2021). Overexpression of schizophrenia susceptibility factor human complement C4A promotes excessive synaptic loss and behavioral changes in mice. Nat Neurosci. 24(2):214–224. doi: 10.1038/s41593-020-00763-8 [DOI] [PMC free article] [PubMed] [Google Scholar]
- Yu G, Wang LG, Han Y, & He QY (2012). clusterProfiler: an R package for comparing biological themes among gene clusters. OMICS. 16(5):284–287. doi: 10.1089/omi.2011.0118 [DOI] [PMC free article] [PubMed] [Google Scholar]
- Yukselen O, Turkyilmaz O, Ozturk AR, Garber M, & Kucukural A (2020). DolphinNext: a distributed data processing platform for high throughput genomics. BMC Genomics 21(1):310. doi: 10.1186/s12864-020-6714-x. [DOI] [PMC free article] [PubMed] [Google Scholar]
Associated Data
This section collects any data citations, data availability statements, or supplementary materials included in this article.
Supplementary Materials
FIGURE S1 LPS activation of of signaling events in WT microglia. Western blots and quantification of several signaling molecues in microglia stimiulated with LPS (5 mg/kg) from 0 to 24 hours.
FIGURE S2 (s) Single cell population gating of microglia incubated with synaptosome-labeled pHrhodoRed using forward and side scatter characteristics. (b) APC anti-CD11b as a marker for microglia identification. Unstained cell controls (left) and isotype antibody stained cells to determine the negative population (middle). At right is a representative cell gating of CD11b-positive cells in a WT sample. (c) Gated contour plots of microglial cells analyzed for pHrodoRed-labeled synaptosome uptake by FSC-A (x-axis) vs pHrhodoRed (y-axis). At left is gating of CD11b and pHrhodoRed double-stained control. At right is representative cell gating of CD11b and pHrhodoRed double-positive cells in WT. (d) Geometric mean of three microglial samples each (i.e., triplicates consisting of 2 mice each), of the various groups that were assess by FACS of engulfment of pHrodoRed-labeled synaptosomes.
FIGURE S4 GO term analysis of clusters 1–4 containing RNAs with altered poly(A) cleavage sites (cf Fig 7).
FIGURE S3 Analysis of alternative splicing in CPEB1-deficient microglia. (a) Types of altrnative splcing events. (b) Analysis of exon skipping (SE) and mutually exclusive exons (MXE) in pairwise comparison of WT vs KO microglia. (c) Analysis of exon skipping and mutually exclusive exons in pairwise comparison of KO vs KO+LPS microglia. (d) Analysis of exon skipping and mutually exclusive exons in pairwise comparison of KO+LPS vs WT+LPS microglia. (e) Analysis of exon skipping and mutually exclusive exons in pairwise comparison of WT vs WT+LPS microglia. PSI, percent splicing in. All data are statistically significant (p<0.05). (f) GO term analysis of alternative splicing events.
FIGURE S6 Venn diagrams comparing RNAs that under APA lengthening or shortening with changes in differential expression, up or down. All conditions were analyzed: CPEB1 KO vs WT; CPEB1 K+LPS vs WT; CPEB1 KO+LPS vs WT+PS; WT+LPS vs WT.
FIGURE S5 Identification of the top 20 mRNAs with lengthened or shorten 3’UTRs in WT versus CPEB1 +/− LPS treatment.
Data Availability Statement
Codes and scripts used for quantification analysis were written in Python or R and will be provided upon request to the Lead Contact. The Gene Expression Omnibus (GEO) accession number for the data reported in this paper is GSE195513.


