

Abstract
Objective:
To determine if the quantitative MRI techniques T2 and T1ρ mapping are sensitive to ischemic injury to epiphyseal cartilage in vivo in a piglet model of Legg-Calvé-Perthes disease using a clinical 3T MRI scanner. We hypothesized that T2 and T1ρ relaxation times would be increased in the epiphyseal cartilage of operated vs. contralateral-control femoral heads one week following onset of ischemia.
Design:
Unilateral femoral head ischemia was surgically induced in eight piglets. Piglets were imaged one week post-operatively in vivo at 3T MRI using a magnetization-prepared 3D fast spin echo sequence for T2 and T1ρ mapping and a 3D gradient echo sequence for cartilage segmentation. Ischemia was confirmed in all piglets using gadolinium contrast-enhanced MRI. Median T2 and T1ρ relaxation times were measured in the epiphyseal cartilage of the ischemic and control femoral heads and compared using paired t-tests. Histological assessment was performed on a subset of five piglets.
Results:
T2 and T1ρ relaxation times were significantly increased in the epiphyseal cartilage of the operated vs. control femoral heads (ΔT2=11.9±3.7 ms, 95%CI=[8.8, 15.0] ms, p<0.0001; ΔT1ρ=12.8±4.1 ms, 95%CI=[9.4, 16.2] ms, p<0.0001). Histological assessment identified chondronecrosis in the hypertrophic and deep proliferative zones within ischemic epiphyseal cartilage.
Conclusions:
T2 and T1ρ mapping are sensitive to ischemic injury to the epiphyseal cartilage in vivo at clinical 3T MRI. These techniques may be clinically useful to assess injury and repair to the epiphyseal cartilage to better stage the extent of ischemic damage in Legg-Calvé-Perthes disease.
Keywords: epiphyseal cartilage, ischemia, necrosis, Legg-Calvé-Perthes disease, magnetic resonance imaging, relaxation time mapping
Introduction
Legg-Calvé-Perthes disease (LCPD) is a pediatric hip disorder characterized by ischemic injury to the growing femoral head that can lead to early-onset osteoarthritis1. The ischemic injury causes cessation of bone growth and osteonecrosis in the avascular phase of the disease, which is followed by a repair phase that includes spontaneous revascularization and bone resorption that make the femoral head susceptible to deformation and collapse1. The typical age that patients with LCPD present clinically is 4 to 6 years old, but can range from 2 to 14 years old1. Clinical management of LCPD focuses on maintaining or restoring congruency of the femoral head and acetabulum to avoid progression to osteoarthritis. However, outcomes of surgical interventions are only satisfactory in 25–69% of cases, and non-operative treatment also frequently leads to unsatisfactory outcomes2–5. Despite significant research effort to better understand the pathogenesis of LCPD and improve treatment outcomes for patients, the pathophysiology of the disease and optimal treatment strategies have not been clearly defined1, 6, 7.
The subarticular epiphyseal growth cartilage overlying the proximal femoral epiphysis (i.e., the bony aspect of the femoral head) plays a significant role in revascularization and restoration of growth of the femoral epiphysis following the initial ischemic insult8, 9. The epiphyseal cartilage is highly vascularized and is critical to endochondral ossification – the process by which the femoral epiphysis grows. Throughout development, the epiphyseal cartilage is gradually replaced by bone, ultimately leaving a thin layer of articular cartilage overlying a layer of calcified cartilage and the subchondral bone at maturity10. Thus, the epiphyseal cartilage is largely responsible for the ultimate shape and size of the articular surface of the femoral head11. In LCPD, the vascular supply to the epiphyseal cartilage is disrupted, leading to cessation of endochondral ossification and altered growth of the femoral head7. Signaling from hypoxic chondrocytes is thought to contribute to the development of new extraosseous vessels that penetrate the epiphyseal cartilage to revascularize the femoral head, initiating the repair phase of the disease12, 13.
Given the importance of the epiphyseal cartilage in the pathogenesis of LCPD, imaging techniques sensitive to ischemic injury to, and subsequent repair of, the epiphyseal cartilage would be helpful to stage LCPD and inform treatment decisions. However, current clinical imaging protocols for patients with LCPD, which primarily include radiographs, traditional T1-and T2-weighted magnetic resonance imaging (MRI), and subtraction contrast-enhanced MRI14, have limited ability to detect pathological changes in the epiphyseal cartilage. Thus, the epiphyseal cartilage is seldom considered in clinical practice14–17. New imaging methods for noninvasive and serial assessment of the extent of injury and subsequent repair to the femoral head in LCPD in children may translate into earlier identification and improved clinical management of cases, either through more informed assessment of the severity of injury or assessment of disease progression before or after treatment14, 16, 18.
It was recently shown, in an ex vivo 9.4T MRI study using a piglet model of LCPD, that T2 and T1ρ relaxation time mapping are sensitive in detecting ischemic injury to the epiphyseal cartilage of the femoral head19, 20. The piglet model of LCPD has been well-established and produces radiographic and histologic lesions that resemble those observed in human patients, providing a model for evaluation of new imaging techniques for detection of alterations to the bone and cartilage associated with LCPD21, 22. T2 and T1ρ relaxation times were significantly increased following ischemic injury in this model at 48 hours post-ischemia induction, with larger effects apparent at 4-weeks post-induction19, 20, which suggests significant early changes to the biochemical environment of the epiphyseal cartilage that may contribute to the subsequent progression of disease20. However, these initial ex vivo studies were not conducted at clinical field strength or under physiological conditions.
The purpose of the current study was to determine if quantitative T2 and T1ρ mapping are sensitive to ischemic injury to the epiphyseal cartilage in the piglet model of LCPD in vivo using a clinical 3T MRI scanner. We hypothesized that T2 and T1ρ relaxation times would be increased in the epiphyseal cartilage of ischemic vs. contralateral-control femoral heads one week following onset of ischemia. The one-week post-operative time point in the piglet model corresponds to the early, avascular stage of LCPD, which is a critical stage in patients to inform treatment decisions based in part on the severity and location of ischemic injury1. Histological assessments of freshly harvested femoral heads were performed in a subset of piglets to investigate cellular and extracellular matrix changes to the femoral head following ischemic injury to help define any changes observed on MRI. This study is an important step to inform potential clinical translation of the quantitative MRI techniques to image the epiphyseal cartilage in pediatric patients with LCPD.
Methods
Animals
This work was approved by the Institutional Animal Care and Use Committee at the University of Minnesota. Eight Yorkshire piglets (3 male, 5 female; weight range=8.3–14.5 kg) were sourced from a commercial provider (Manthei Hog Farm; Elk River, MN). Piglets were co-housed in pairs throughout the study. At six weeks of age, piglets underwent unilateral surgical induction of ischemia to the whole proximal femoral epiphysis by placement of a ligature around the femoral neck, coupled with transection of the ligamentum teres21, 22. The contralateral hip was unoperated. Piglets were then imaged in vivo at 3T MRI one week following surgery. For the surgical and MRI procedures, piglets were premedicated with intramuscular administration of either midazolam (1.0 mg/kg) and buprenorphine (10 μg/kg) or a combination of telazol (4.0 mg/kg) and xylazine (2.0 mg/kg). Anesthesia was induced using either both ketamine (5.0 mg/kg) and propofol (2.0–6.0 mg/kg) or propofol alone (2.0–6.0 mg/kg) administered intravenously. Anesthesia was maintained by insufflation of isoflurane (1.0–5.0%) vaporized in oxygen. For three days following surgery, piglets were given carprofen (2.0–3.0 mg/kg) once or twice daily orally for pain control. Eight piglets were chosen for this study based on a sample size estimate using prior ex vivo study findings19, 20. Specifically, assuming a paired difference in relaxation times between ischemic vs. control epiphyseal cartilage of 10.6±7.2 ms20, a sample size of at least seven pigs is needed to detect differences for a two-tailed paired t-test with significance level=0.05 and power=80%.
In Vivo 3T MRI
Piglets were imaged using a 3T MRI scanner (MAGNETOM Prisma; Siemens Healthcare; Erlangen, Germany) and vendor-provided flex receiver arrays. Imaging sequences included: (i) 3D T2 and T1ρ mapping using a magnetization-prepared fast spin echo sequence (SPACE: Sampling Perfection with Application optimized Contrasts using different flip angle Evolution); (ii) 3D gradient echo (GRE) imaging for cartilage segmentation; and (iii) subtraction contrast-enhanced MRI (CE-MRI) following intravenous administration of 0.2 mmol/kg gadolinium contrast material (ProHance; Bracco Diagnostics; Monroe Township, NJ) to confirm surgical induction of ischemia to the whole femoral epiphysis. Imaging parameters are listed in Table 1. Only two preparation times were acquired for the 3D T2 and T1ρ mapping sequences to limit acquisition time in a signal-to-noise-ratio-efficient manner23. The 3D GRE acquisition used a long echo time to provide high bone-to-cartilage contrast and susceptibility weighting for potential visualization of the vascular canals in the epiphyseal cartilage13. A 2D TSE sequence was used for CE-MRI to provide high signal-to-noise ratio to detect low-perfusion gadolinium enhancement (or lack thereof) in the bony femoral epiphysis. A subset of five piglets were euthanized immediately following the MRI exam with an intravenous injection of potassium chloride (75–150 mg/kg) or sodium pentobarbital (100 mg/kg) to allow for histological assessment of the femoral heads. The other three piglets were recovered for another study.
Table 1.
3T MRI imaging parameters.
| 3D T2 and T1ρ Mapping | Cartilage Segmentation | Contrast-Enhanced MRI | |
|---|---|---|---|
| Sequence | 3D SPACE | 3D GRE | 2D TSE |
| Field of View (mm) | 200×200×128 | 200×150×44 | 200×170 |
| Sampling Matrix | 384×384×128 | 512×384×112 | 448×380 |
| Resolution (mm) | 0.52×0.52×1.0 | 0.39×0.39×0.39 | 0.45×0.45 |
| Slices / Thickness (mm) | - | - | 20 / 2.0 |
| TR / TE (ms) | 2610 / 163 | 31 / 22.5 | 970 / 21 |
| Flip Angle (degrees) | Variable | 15 | 150 |
| Bandwidth (Hz/px) | 501 | 100 | 260 |
| Fat Sat | No | No | Yes |
| GRAPPA | R=2 | - | R=2 |
| Turbo Factor | 128 | - | 4 |
| T2 Prep Times (ms) | 0, 80 | - | - |
| T1ρ Prep Times (ms) | 0, 80 | - | - |
| Spin-Lock Frequency (Hz) | 350 | - | - |
| Scan Time | 14:21 (×2) | 17:26 | 3:10 (×2) |
Histology
Harvested ischemic and control femoral heads from the subset of five piglets were bisected in the coronal plane and fixed in 10% neutral buffered formalin. Tissues were decalcified using 10% ethylenediaminetetraacetic acid, and 3.0 mm thick slabs were routinely processed to produce 5.0-μm-thick sections, which were stained with hematoxylin and eosin (H&E). Additional sections were stained with safranin-O and picrosirius red. Special stains were performed on all sections in one batch to minimize batch-to-batch variation in stain intensity. Histological sections were assessed in a blinded fashion by a board-certified veterinary pathologist (ARA) with four years of experience in musculoskeletal pathology.
MRI Data Analysis
The 3D GRE images were used to segment the articular-epiphyseal cartilage complexes overlying the operated and control femoral heads, which (at this stage of development) are composed predominantly of epiphyseal cartilage underlying a thin layer of articular cartilage24. We first segmented all of the epiphyseal cartilage (Figure 1A), which was the basis for the primary analysis conducted in this study. To assess potential regional differences, we then subdivided the epiphyseal cartilage into: (i) deep and superficial layers, each consisting of half of the thickness of the epiphyseal cartilage (Figure 1B); and (ii) four quadrants that approximate the superior-anterior, superior-posterior, inferior-anterior, and inferior-posterior regions of the human femoral head (Figure 1C). The segmentations were performed in all three orthogonal planes of imaging using ITK-SNAP (www.itksnap.org)25. Quantitative 3D T2 and T1ρ relaxation time maps were then calculated using mono-exponential model fitting in MATLAB (v2019b; MathWorks; Natick, MA). The 3D T2 and T1ρ maps were spatially co-registered and scaled to the higher-resolution 3D GRE image, accounting for spatial alignment in all three orthogonal imaging planes, using 3D Slicer (www.slicer.org)26. The epiphyseal cartilage segmentations were then applied to the 3D T2 and T1ρ maps, and median relaxation time values for the operated and control femoral heads were calculated for each region of interest.
Figure 1.

Epiphyseal cartilage segmentations defined using the 3D gradient echo acquisition for analysis of the T2 and T1ρ relaxation times. (A) Segmentation of the entire epiphyseal cartilage, which is the basis for the primary analysis of this study. (B) Regional segmentations of the deep and superficial layers of the epiphyseal cartilage. (C) Regional segmentations of four quadrants of the epiphyseal cartilage, with regions defined according to their corresponding anatomical locations in the human femoral head.
Histological Data Analysis
Cell counting was performed on the five pairs of H&E images to determine whether there were differences in the total number of chondrocytes or the number of viable vs. necrotic chondrocytes in the epiphyseal cartilage of the ischemic vs. control femoral heads. Cells were counted using ImageJ (version 1.53a; imagej.nih.gov/ij)27 within three adjacent 20× fields extending from the osteochondral junction and including the hypertrophic zone and deep aspect of the proliferative zone of the epiphyseal growth cartilage by a board-certified veterinary pathologist (ARA) blinded to surgical state. The number of viable cells (distinct nucleus and cytoplasm), necrotic cells (condensed, eosinophilic morphology lacking a distinct nucleus), and total cells (viable+necrotic) were measured, and the mean cell counts were calculated across the three adjacent fields.
The five pairs of Safranin O-stained sections were semi-quantitatively assessed to determine whether proteoglycan content of the epiphyseal cartilage differed between the ischemic and control femoral heads based on Safranin O staining intensity. Three non-overlapping images magnified 20× were taken of the epiphyseal cartilage originating at the osteochondral junction under the same exposure and light settings using NIS Elements D (version 5.20.00) with a light microscope (ECLIPSE Ci; Nikon Instruments; Melville, NY). The photomicrographs were then analyzed in MATLAB using a previously reported algorithm to assess the degree of stain as a correlate of proteoglycan content28.
The five pairs of sections stained with picrosirius red were assessed for changes to collagen orientation using polarized light microscopy. Polarized light microscopy was performed using the light microscope with a polarized light filter.
Statistical analysis
Statistical analyses were performed using GraphPad Prism (version 9.2.0 for macOS; GraphPad Software; San Diego, CA). The median T2 and T1ρ relaxation times in the epiphyseal cartilage were compared between the operated and control femoral heads using two-tailed paired t-tests. Our primary analysis assessed T2 and T1ρ changes across the entire extent of the epiphyseal cartilage (Figure 1A), while our secondary analyses assessed whether there were regional differences between the deep vs. superficial layers (Figure 1B) or between quadrants (Figure 1C). To assess whether T2 and T1ρ responded similarly to ischemic injury in a given animal, Pearson correlations were determined for (i) the change in T2 vs. T1ρ between ischemic and control femoral heads (ΔT2 vs. ΔT1ρ), (ii) cell count vs. ΔT2 and ΔT1ρ, and (iii) and Safranin O red stain change vs. ΔT2 and ΔT1ρ. Quantitative comparisons of the histological data between the ischemic and control femoral heads were also performed using paired t-tests. For all tests, p<0.05 was considered statistically significant.
Results
In vivo MRI Findings
All operated femoral heads (n=8) were confirmed to have complete femoral epiphyseal ischemia based on the absence of contrast uptake on CE-MRI (Figure 2). Quantitatively, T2 and T1ρ relaxation times were significantly increased across the entire epiphyseal cartilage of the ischemic vs. control femoral heads (Table 2). T2 and T1ρ respectively increased on average 11.9±3.7 ms (95%CI=[8.8, 15.0]; p<0.0001) and 12.8±4.1 ms (95%CI=[9.4, 16.2]; p<0.0001). T2 and T1ρ were also significantly increased in the ischemic vs. control femoral heads for all evaluated subregions of the epiphyseal cartilage (Table 2). The differences in T2 and T1ρ between the ischemic vs. control femoral heads were greater in the deep vs. superficial layer and in the inferior vs. superior quadrants. Representative T2 and T1ρ maps of the epiphyseal cartilage for one piglet are shown in Figure 2A. The T2 and T1ρ maps show longer relaxation times (redder color) in the ischemic vs. control femoral head across the full thickness of the epiphyseal cartilage. The plot in Figure 2B shows that T2 and T1ρ were consistently increased in the ischemic vs. control femoral heads in all eight pairs of femoral heads. The changes in T2 and T1ρ between the ischemic and control femoral heads (ΔT2 and ΔT1ρ) for a given animal were strongly correlated (Figure 3), with Pearson’s r=0.84 (95%CI=[0.34, 0.97]; p=0.0087).
Figure 2.

(A) Subtraction contrast-enhanced MRI (CE-MRI) and 3D T2 and T1ρ maps (shown in the transverse plane) for a representative piglet imaged one-week after onset ischemia. The operated femoral head (shown at right) has no gadolinium contrast uptake on CE-MRI (yellow arrow), confirming ischemia to the whole femoral epiphysis. The T2 and T1ρ relaxation times in the epiphyseal cartilage, which are indicated by color and are overlaid on a high-resolution gradient echo image, are appreciably increased (redder in color) over the extent of the ischemic (shown at right) vs. contralateral-control femoral head (shown at left). The main magnetic field (B0) is oriented perpendicular to the shown imaging plane. (B) Median T2 (black circles) and T1ρ (red squares) relaxation times across the entire epiphyseal cartilage for all n=8 pairs of control and ischemic femoral heads. T2 and T1ρ consistently increased in the ischemic vs. control femoral head in all eight animals. The piglet shown in (A) is indicated by a dotted line.
Table 2.
Comparison of T2 and T1ρ relaxation times of the epiphyseal cartilage for n=8 pairs of control and ischemic femoral heads.
| Control (ms) | Ischemic (ms) | Paired Difference (ms) | 95% CI | p-Value | Effect Size (Cohen’s d) | Percent Increase | |
|---|---|---|---|---|---|---|---|
| All Cartilage | |||||||
| T2 | 66.2 ± 1.9 | 78.1 ± 4.0 | 11.9 ± 3.7 | [8.8, 15.0] | <0.0001 | 3.2 | 18.0 ± 5.7% |
| T1ρ | 77.7 ± 3.7 | 90.5 ± 3.9 | 12.8 ± 4.1 | [9.4, 16.2] | <0.0001 | 3.1 | 16.6 ± 5.8% |
| Deep Half | |||||||
| T2 | 62.1 ± 3.0 | 76.0 ± 5.5 | 13.9 ± 4.9 | [9.7, 18.0] | <0.0001 | 2.8 | 22.4 ± 8.0% |
| T1ρ | 76.3 ± 3.9 | 89.8 ± 4.7 | 13.5 ± 4.9 | [9.4, 17.6] | 0.0001 | 2.8 | 17.8 ± 6.7% |
| Superficial Half | |||||||
| T2 | 70.7 ± 3.4 | 80.5 ± 2.9 | 9.8 ± 5.4 | [5.3, 14.3] | 0.0013 | 1.8 | 14.2 ± 7.9% |
| T1ρ | 79.6 ± 5.8 | 91.5 ± 3.5 | 11.9 ± 6.2 | [6.7, 17.0] | 0.0010 | 1.9 | 15.4 ± 8.7% |
| Superior-Anterior Quadrant | |||||||
| T2 | 69.4 ± 2.2 | 77.7 ± 4.2 | 8.3 ± 3.5 | [5.4, 11.3] | 0.0003 | 2.4 | 12.0 ± 5.1% |
| T1ρ | 80.8 ± 4.6 | 90.7 ± 3.7 | 9.9 ± 3.6 | [6.9, 12.9] | 0.0001 | 2.8 | 12.4 ± 5.0% |
| Superior-Posterior Quadrant | |||||||
| T2 | 64.9 ± 1.9 | 76.2 ± 5.2 | 11.3 ± 4.7 | [7.4, 15.3] | 0.0003 | 2.4 | 17.4 ± 7.3% |
| T1ρ | 75.4 ± 3.3 | 87.5 ± 6.4 | 12.1 ± 5.0 | [8.0, 16.2] | 0.0002 | 2.4 | 16.0 ± 6.4% |
| Inferior-Anterior Quadrant | |||||||
| T2 | 69.6 ± 4.4 | 85.4 ± 5.3 | 15.8 ± 4.3 | [12.1, 19.4] | <0.0001 | 2.6 | 22.8 ± 6.5% |
| T1ρ | 83.5 ± 7.4 | 100.9 ± 5.7 | 17.4 ± 6.4 | [12.0, 22.7] | 0.0001 | 2.7 | 21.4 ± 9.0% |
| Inferior-Posterior Quadrant | |||||||
| T2 | 60.9 ± 2.0 | 75.0 ± 4.6 | 14.0 ± 5.5 | [9.5, 18.6] | 0.0002 | 2.6 | 23.2 ± 9.5% |
| T1ρ | 71.8 ± 5.0 | 85.8 ± 4.5 | 14.0 ± 7.0 | [8.1, 20.0] | 0.0008 | 2.0 | 20.1 ± 10.6% |
Values reported as mean ± standard deviation.
Figure 3.
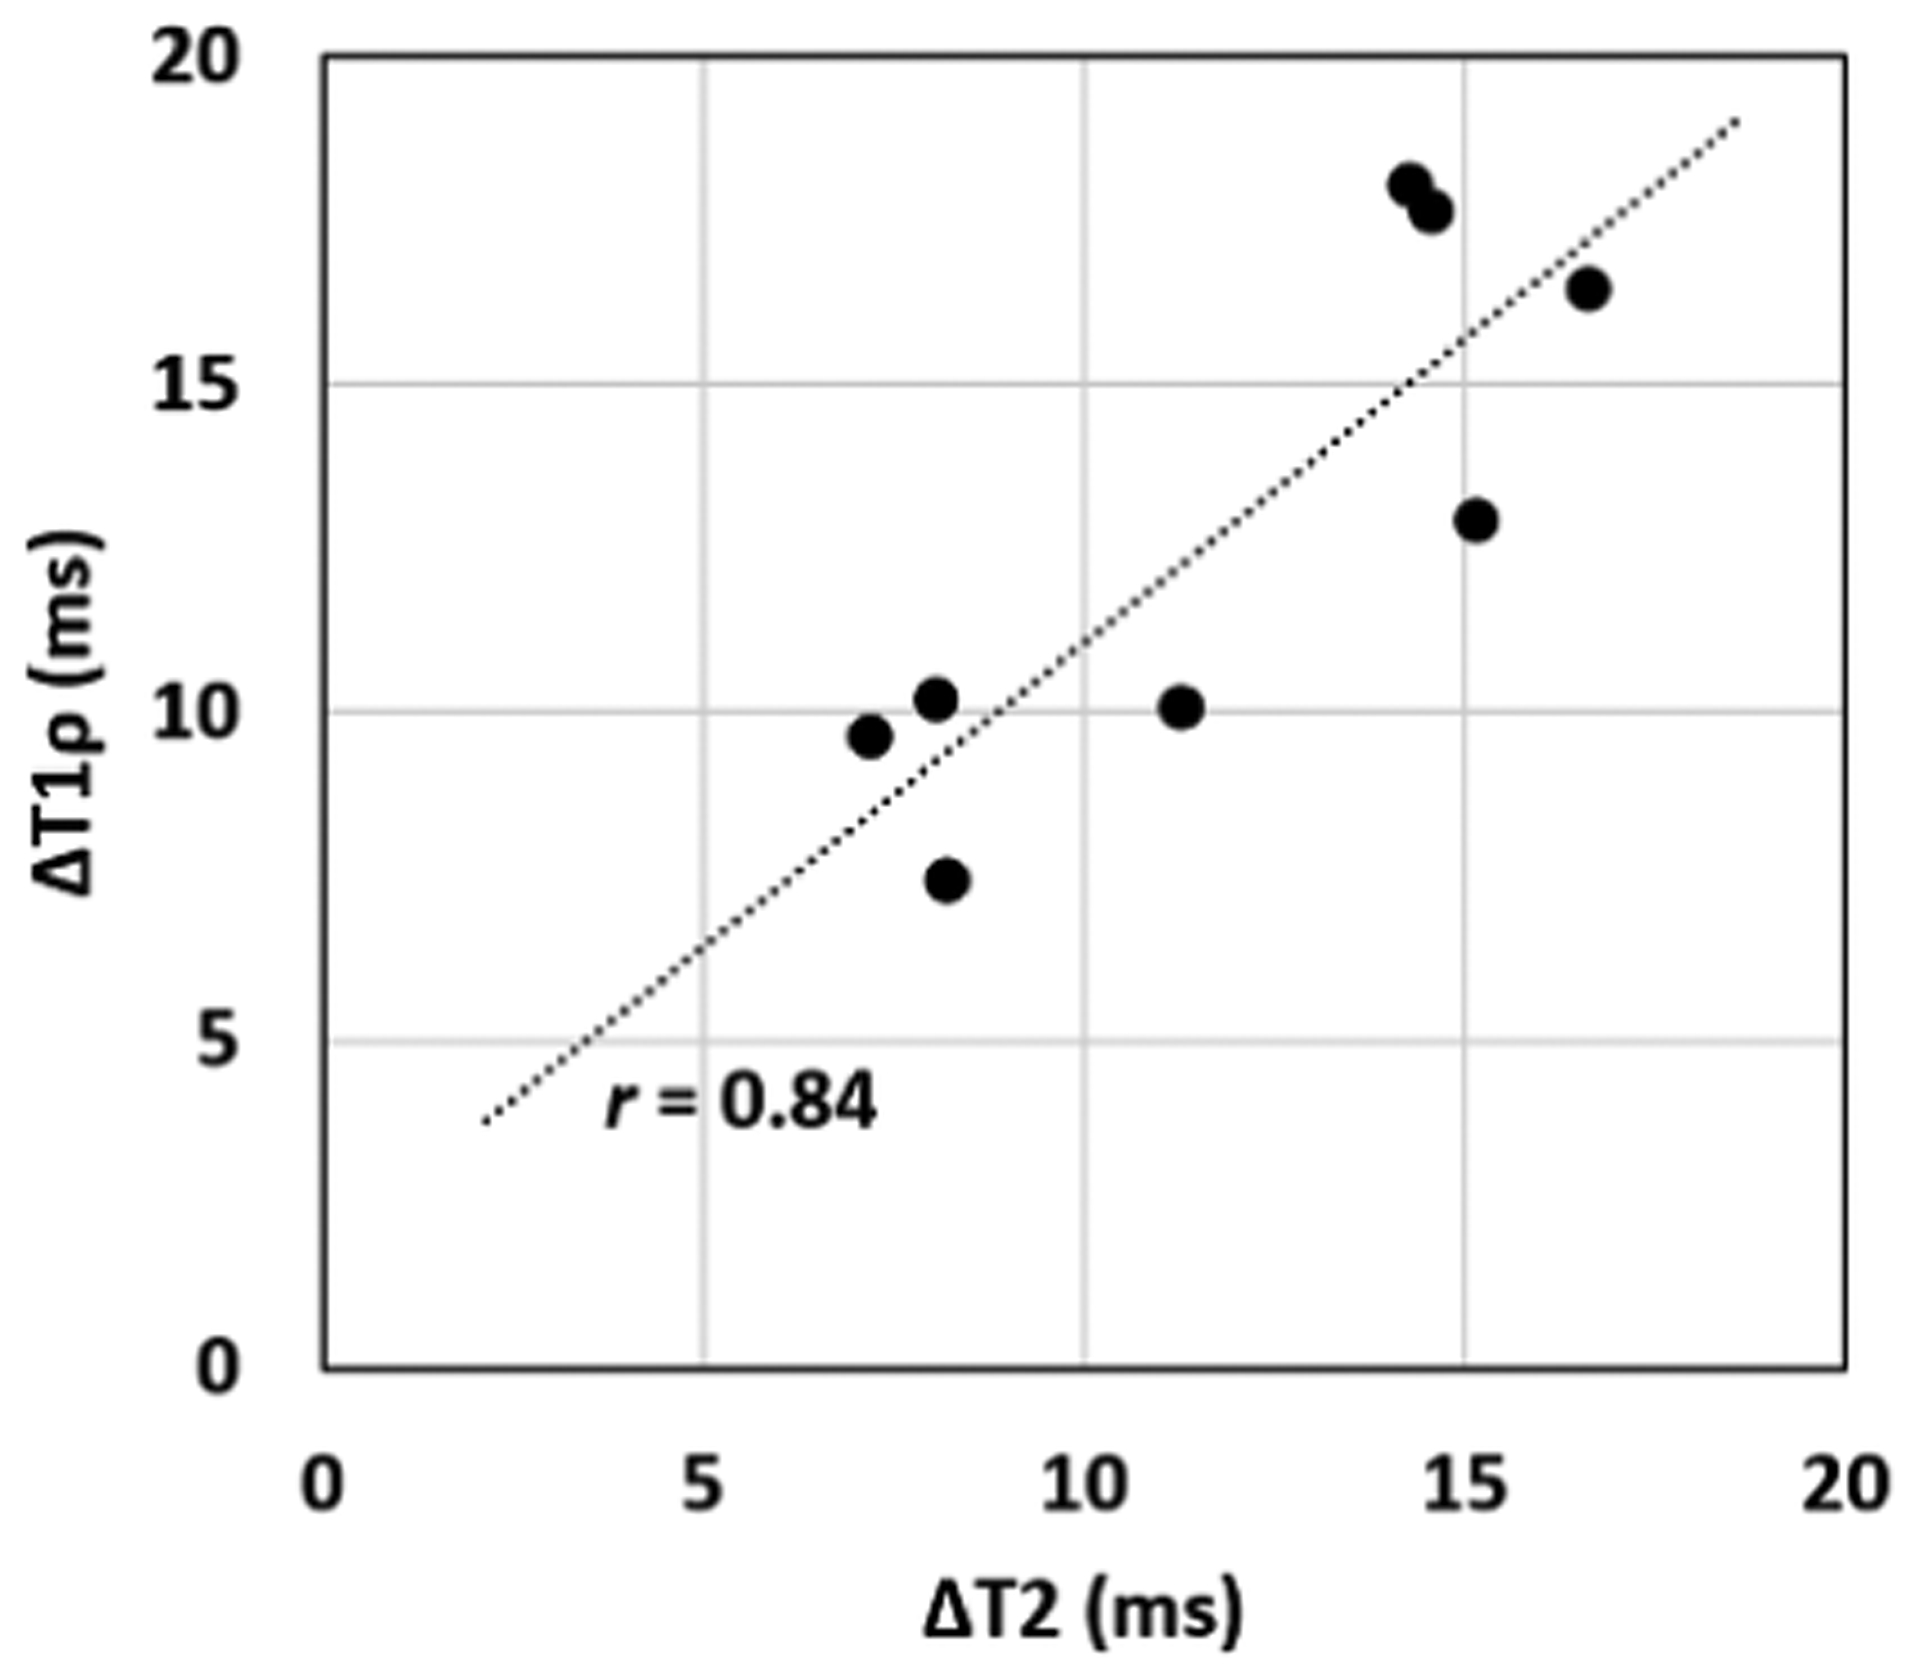
Correlation plot of the differences (Δ) in median T2 and T1ρ relaxation times for each of the eight pairs of operated and control femoral heads. The differences in T2 and T1ρ are strongly correlated (Pearson’s r=0.84; 95%CI=[0.34, 0.97]; p=0.0087).
Histological Findings
Histological evaluation of H&E-stained sections identified chondrocyte necrosis within the epiphyseal cartilage in all five of the ischemic femoral heads. Necrosis uniformly affected chondrocytes within the deep aspect of the zone of proliferation, the zone of hypertrophy, and the zone of calcification (Figure 4). Chondrocyte necrosis affected the deep epiphyseal cartilage within the examined coronal sections, while chondrocytes were viable in the upper portion of the proliferating and reserve zones and the overlying articular cartilage. Necrosis within the epiphyseal cartilage was not observed in any of the control femoral heads. Quantitative results are shown in Table 3. The total cell count was not significantly reduced in ischemic vs. control epiphyseal cartilage (difference=−36±47 cells; 95%CI=[−94.7, 22.6]; p=0.1631). The cell count in ischemic epiphyseal cartilage was not significantly correlated with ΔT2 (r=0.02; 95%CI=[−0.88, 0.88]; p=0.98) or ΔT1ρ (r=−0.22; 95% CI=[−0.92, 0.82]; p=0.72). The percentage of necrotic chondrocytes within the examined fields of the ischemic femoral heads was 58±16%.
Figure 4.

H&E photomicrographs of the epiphyseal cartilage for the same piglet shown in Figure 2. (A) Control femoral head with viable chondrocytes at all levels within the articular-epiphyseal cartilage complex, with distinct viable bone marrow contents within the epiphysis. * = epiphysis, black arrow indicates proximal femoral growth plate. 0.5× magnification; scale bars = 5 mm. (B) Ischemic femoral head with diffuse necrosis of the epiphysis, evident by the pallor of the bone marrow contents. (C, D) Higher magnification (10×) of the areas indicated by black boxes in the control femoral head (A) and ischemic femoral head (B). Chondrocytes are necrotic in the zone of hypertrophy within the articular-epiphyseal cartilage complex, with thinning of the mineralized cartilage trabeculae in the zone of calcification. Scale bars = 100 μm. (E, F) Higher magnification (40×) of the deep aspect of the control and ischemic epiphyseal cartilage. Black arrows indicate four of the many necrotic chondrocytes within the zone of hypertrophy of the epiphyseal cartilage, which are shrunken in size and diffusely eosinophilic. Scale bars = 50 μm.
Table 3.
Quantitative histology results for the epiphyseal cartilage of the ischemic and control femoral heads.
| Sample | Total Cell Count | Necrotic Cell Count | Safranin O Stain Intensity (au) | ||||||
|---|---|---|---|---|---|---|---|---|---|
| Control | Ischemic | Diff. | Control | Ischemic | Diff. | Control | Ischemic | Diff. | |
| 1 | 177 | 110 | −67 | 0 | 71 | 71 | 78.4 | 76.1 | −2.3 |
| 2 | 223 | 131 | −92 | 0 | 83 | 83 | 79.7 | 60.3 | −19.4 |
| 3 | 176 | 188 | 12 | 0 | 113 | 113 | 78.3 | 80.4 | 2.0 |
| 4 | 187 | 200 | 13 | 0 | 144 | 144 | 87.4 | 63.6 | −23.8 |
| 5 | 210 | 164 | −46 | 0 | 48 | 48 | 72.4 | 66.7 | −5.7 |
| Mean ± SD | 195±21 | 159±38 | −36±47 | 0 | 92±37 | 92±37 | 79.3±5.4 | 69.4±8.5 | −9.8±11.2 |
Differences (Diff.) are shown for the Ischemic minus Control values.
Safranin O staining for relative proteoglycan content identified evidence of decreased stain intensity within the epiphyseal cartilage of the ischemic vs. control femoral heads (Figure 5). Stain intensity decreased on average in the ischemic femoral heads but did not reach statistical significance (difference=−9.8±11.2 au; 95%CI=[−23.7, 4.1]; p=0.12). The differences in Safranin O stain intensities between control and ischemic epiphyseal cartilage were not correlated with ΔT2 (r=−0.28; 95%CI=[−0.80, 0.93]; p=0.64) or ΔT1ρ (r=0.13; 95%CI=[−0.85, 0.91]; p=0.84).
Figure 5.

Quantitative results and representative Safranin-O photomicrographs. (A) Safranin O stain intensity decreased in four piglets, with the largest decreases in two piglets. Control (B) and ischemic (C) Safranin O-stained sections with a loss of intensity of the staining of the cartilage matrix apparent in the ischemic epiphyseal cartilage. Images are from the piglet indicated with the dotted line in (A), which had one of the larger decreases in staining intensity of the five piglets examined histologically. 20× magnification.
Picrosirius red-stained sections to qualitatively assess variation in collagen orientation and organization of the epiphyseal cartilage did not reveal any apparent differences between the ischemic and control femoral heads.
Discussion
Our results support the sensitivity of T2 and T1ρ mapping in detecting ischemic injury to the epiphyseal cartilage in vivo at clinical 3T MRI field strength. We found that both T2 and T1ρ relaxation times significantly increased in the ischemic vs. control femoral heads one week following induction of ischemia to the femoral epiphysis. Furthermore, we found histological evidence of early ischemic changes to the epiphyseal cartilage, including chondrocyte necrosis and potential extracellular matrix changes, which may be contributors to the observed changes in T2 and T1ρ. Our findings suggest that T2 and T1ρ mapping may be clinically useful in the detection of epiphyseal cartilage injury in LCPD.
Our findings demonstrate involvement of the epiphyseal cartilage in early-stage ischemic injury to the femoral head. LCPD can cause several anatomical abnormalities, including loss of the spherical shape and alterations in the size of the femoral head5. Despite the important role the epiphyseal cartilage plays in the ultimate shape and size of the femoral head and ossification of the epiphysis, its response to injury and ability to heal following an ischemic insult are poorly understood11. Our quantitative MRI and histology results are consistent with previous work utilizing the piglet model that demonstrated hypoxic injury to the deep epiphyseal cartilage by 24 hours following ischemia29. Other prior studies in juvenile animals have also found that disruption of blood flow to the femoral head, as occurs in LCPD, causes necrosis of both the marrow elements and bone, along with necrosis of the chondrocytes within the deep portion of the epiphyseal cartilage12, 21, 30. Interestingly, we found that the alterations in T2 and T1ρ relaxation times extended beyond regions of chondrocyte necrosis, as evidenced by significant changes in the superficial layer of the epiphyseal cartilage. While, histologically, chondronecrosis was limited to the deepest 0.3 mm of the epiphyseal cartilage thickness, T2 and T1ρ were increased throughout the full cartilage thicknesses (about 2.0 to 3.0 mm). This is consistent with what was observed in the prior highly-resolved ex vivo 9.4T MRI studies19, 20. The larger increase in T2 and T1ρ found in the deep vs. superficial layer is consistent with the greater severity of injury seen histologically in this region. These findings suggest a more profound effect on the epiphyseal cartilage in response to induction of ischemia than is apparent histologically at this time point.
The T2 and T1ρ relaxation times responded similarly to ischemic injury to the epiphyseal cartilage, suggesting that their sensitivities are driven by a shared contrast mechanism at this stage. The percent increases in T2 and T1ρ observed in this study are comparable to those previously reported using the same piglet model with ex vivo 9.4T MRI: respectively 18.0±5.7% and 16.6±5.8% in this study (one week post-operatively) vs. 13±12% and 17±6% in the prior study (48 hours post-operatively)20. There are several possible explanations for the observed increases in T2 and T1ρ relaxation times, the most likely being changes in intracellular and/or extracellular water content related to absence of perfusion, chondrocyte necrosis (and associated cellular alterations such as cell swelling and oxidative damage), and/or changes to the extracellular matrix20, 31. Our histological analyses identified evidence of chondrocyte necrosis, but these changes were limited to the deep layers of the epiphyseal cartilage. We also found that there likely is a reduction in proteoglycan content based on decreases in Safranin O stain intensity in 4/5 samples, suggesting that there may be early changes to the extracellular matrix that may have a more global effect on the relaxation times. In studies of human articular cartilage, T2 and T1ρ have been shown to be complementary in assessing degeneration of the articular cartilage32, 33, with T1ρ being more sensitive than T2 to loss of proteoglycans34, 35. In contrast, in this study there was no apparent advantage of one technique over the other. We do not expect the relatively low, clinically-feasible T1ρ spin-locking frequency of 350 Hz to have reduced T1ρ sensitivity to the ischemic injury given a lack of difference in response observed across a range of frequencies (250 to 1250 Hz) in the prior ex vivo 9.4T MRI study20. We also do not expect magic angle effects to be a significant factor in our observed differences, since these effects are thought to be minor in the epiphyseal cartilage36 and would similarly affect both the ischemic and control femoral heads. Overall, our finding of prominent changes in T2 and T1ρ relaxation times without a clear histological correlate motivates further investigation into how the composition of the epiphyseal cartilage is altered following ischemic injury and its role in the pathogenesis of LCPD.
Quantitative MRI methods provide a unique opportunity to improve our understanding of musculoskeletal diseases, as demonstrated by their application to pediatric diseases including LCPD, osteochondritis dissecans, and juvenile arthritis37–41. In the research domain, 3D T2 and T1ρ mapping are regularly performed to assess the articular cartilage of the hip and knee, and technological advancements and standardization of these approaches are making them practical for clinical use40, 42, 43. A recent study applying quantitative T1ρ mapping in children with juvenile arthritis allowed for the identification of articular cartilage abnormalities that were not identified using conventional MRI sequences40. Given the high frequency of children with LCPD presenting early in the course of the disease when femoral head deformity is mild, the correlation of more subtle morphological changes such as epiphyseal cartilage necrosis and subsequent return to a normal state based on quantitative MRI may provide relevant prognostic indicators to guide clinicians in determining the timing and necessity for surgical intervention1, 2, 44. Previous studies of ischemic injury to the epiphyseal cartilage have depended on histology, immunohistochemistry, Western blots, and quantitative reverse transcription PCR to demonstrate the extent of hypoxia and cell death. The development of quantitative MRI methods sensitive to these injuries is key to extrapolating what has been observed in animal models to clinical applications in patients.
Further development and evaluation of T2 and T1ρ mapping techniques will facilitate clinical translation to patients with LCPD. T2 mapping can be rapidly acquired for the hip, making this a potential addition to existing clinical protocols45, 46. Advances in clinical 3T MRI have improved this technology for the application to pediatric patients by shortening the overall acquisition time and providing the opportunity to acquire acceptable quality images with fewer artifacts47, 48. While spatial resolution can be a limiting factor, the relative thickness of the epiphyseal cartilage in pediatric patients may allow more detailed evaluation than is currently possible for adult articular cartilage. Variations on the T2 and T1ρ mapping techniques may also be useful, including: adiabatic T1ρ and T2ρ mapping, which may be more readily applied for imaging the hip within radiofrequency hardware and heating constraints than continuous-wave T1ρ mapping and may be less sensitive to any magic angle effects49; additional preparation times for mono- or bi-exponential fitting of the relaxation times, which may provide insight into different tissue compartments50; and ultrashort echo time imaging, which may allow assessment of injury to the osteochondral junction51, 52. An important facet of clinical translation will be to develop an understanding of the normative changes in T2 and T1ρ relaxation times with age to accurately account for variation expected with growth and development46, 53. This includes potential regional variations in T2 and T1ρ across the epiphyseal cartilage, as evidenced by variation in the relaxation times between the four quadrant regions analyzed in this study. Other future directions motivated by our findings include: determination of the temporal response of relaxation times to progression of LCPD, including the later stages of neovascularization, reossification, and healing; and application of these methods to models of partial ischemia that may more accurately reflect the heterogenous clinical picture presented by patients with LCPD.
Our study has a number of limitations. First, a small sample of eight piglets was used. Despite this, our MRI results were consistent across all eight piglets, providing convincing evidence that T2 and T1ρ mapping are reliable measures of epiphyseal cartilage injury. Histologic evaluation was only available for five of the piglets, which limited statistical power to detect differences and necessitates further study to confirm the observed loss of Safranin-O stain intensity in some of the animals. Second, we only evaluated the piglets at one time point corresponding to early-stage ischemic injury. The fact that such a strong effect was observed just one week following the onset of ischemia suggests that these techniques may also provide insights at later time points, including after initiation of revascularization and repair. Third, the unoperated femoral head was used as a control. While this has been found to be a reasonable comparison, ideally changes to the epiphyseal cartilage would be studied longitudinally, for example before and after onset of ischemia. Lastly, the piglet model requires an arthrotomy, which may lead to greater damage to the joint and inflammation than would be seen in children in LCPD. Thus, while use of the piglet model enables a controlled experiment and histological investigation of the MRI findings, clinical translation of these techniques to patients with LCPD is needed to evaluate their clinical relevance.
In conclusion, T2 and T1ρ relaxation time mapping are sensitive in detecting ischemic injury to the epiphyseal cartilage in a piglet model of LCPD under physiologic in vivo conditions and using a clinical 3T MRI scanner. T2 and T1ρ mapping may be clinically useful to assess the degree of injury to the epiphyseal cartilage to better stage LCPD and inform the extent of ischemic alteration. These quantitative techniques may also help advance understanding of the role of epiphyseal cartilage in the pathogenesis of LCPD and evaluation of new therapies targeting the epiphyseal cartilage to promote revascularization and repair in animal models and patients.
Acknowledgements
We thank Kathleen Stuebner, Kelly Bergsrud, Andrea Chehadeh, Sara Pracht, and Amber Winter in the University of Minnesota Veterinary Clinical Investigation Center and Dee Koski in the Center for Magnetic Resonance Research for their assistance with the in vivo animal model studies. We also thank Katalin Kovacs and Paula Overn from the University of Minnesota Masonic Cancer Center Comparative Pathology Shared Resource Laboratory for their careful preparation of the histologic sections assessed in this study.
Role of the Funding Source
This project was supported by grants from several institutes at the National Institutes of Health, including the National Institute of Arthritis and Musculoskeletal and Skin Diseases (R56AR078315, K01AR070894, and T32AR050938), National Center for Advancing Translational Sciences (UL1TR002494), Office of the Director (K01OD021293 and T32OD010993), and National Institute of Biomedical Imaging and Bioengineering (P41EB027061). The study sponsors had no role in the study design, collection, analysis and interpretation of data, the writing of the manuscript, or the decision to submit the manuscript for publication. The content is solely the responsibility of the authors and does not necessarily represent the official views of the National Institutes of Health.
Footnotes
Publisher's Disclaimer: This is a PDF file of an unedited manuscript that has been accepted for publication. As a service to our customers we are providing this early version of the manuscript. The manuscript will undergo copyediting, typesetting, and review of the resulting proof before it is published in its final form. Please note that during the production process errors may be discovered which could affect the content, and all legal disclaimers that apply to the journal pertain.
Competing Interest Statement
The authors declare that they have no competing interests.
References
- [1].Kim HK. Pathophysiology and new strategies for the treatment of Legg-Calve-Perthes disease. J Bone Joint Surg Am 2012; 94(7):659–69. [DOI] [PubMed] [Google Scholar]
- [2].Herring JA, Kim HT, Browne R. Legg-Calve-Perthes disease. Part II: Prospective multicenter study of the effect of treatment on outcome. J Bone Joint Surg Am 2004; 862121–34. [PubMed] [Google Scholar]
- [3].Wiig O, Terjesen T, Svenningsen S. Prognostic factors and outcome of treatment in Perthes’ disease: a prospective study of 368 patients with five-year follow-up. J Bone Joint Surg Br 2008; 90(10):1364–71. [DOI] [PubMed] [Google Scholar]
- [4].Larson AN, Sucato DJ, Herring JA, Adolfsen SE, Kelly DM, Martus JE, et al. A prospective multicenter study of Legg-Calve-Perthes disease: functional and radiographic outcomes of nonoperative treatment at a mean follow-up of twenty years. J Bone Joint Surg Am 2012; 94(7):584–92. [DOI] [PubMed] [Google Scholar]
- [5].Leroux J, Abu Amara S, Lechevallier J. Legg-Calvé-Perthes disease. Orthopaedics & Traumatology: Surgery & Research 2018; 104(1):S107–S12. [DOI] [PubMed] [Google Scholar]
- [6].Kim HKW. Legg-Calve-Perthes Disease: etiology, pathogenesis, and biology. J Pediatr Orthop 2011; 31S141–S6. [DOI] [PubMed] [Google Scholar]
- [7].Jaimes C, Chauvin NA, Delgado J, Jaramillo D. MR imaging of normal epiphysis development and common epiphyseal disorders. RadioGraphics 2014; 34(2):449–72. [DOI] [PubMed] [Google Scholar]
- [8].Kim HK, Aruwajoye O, Stetler J, Stall A. Effects of non-weight-bearing on the immature femoral head following ischemic osteonecrosis: an experimental investigation in immature pigs. J Bone Joint Surg Am 2012; 94(24):2228–37. [DOI] [PubMed] [Google Scholar]
- [9].Aruwajoye OO, Monte F, Kim A, Kim HKW. A Comparison of Transphyseal Neck-Head Tunneling and Multiple Epiphyseal Drilling on Femoral Head Healing Following Ischemic Osteonecrosis: An Experimental Investigation in Immature Pigs. J Pediatr Orthop 2020; 40(4):168–75. [DOI] [PubMed] [Google Scholar]
- [10].Blumer MJF, Longato S, Fritsch H. Structure, formation and role of cartilage canals in the developing bone. Annals of Anatomy - Anatomischer Anzeiger 2008; 190(4):305–15. [DOI] [PubMed] [Google Scholar]
- [11].Hunziker EB, Kapfinger E, Geiss J. The structural architecture of adult mammalian articular cartilage evolves by a synchronized process of tissue resorption and neoformation during postnatal development. Osteoarthritis Cartilage 2007; 15(4):403–13. [DOI] [PubMed] [Google Scholar]
- [12].Kim HK, Bian H, Aya-ay J, Garces A, Morgan EF, Gilbert SR. Hypoxia and HIF-1alpha expression in the epiphyseal cartilage following ischemic injury to the immature femoral head. Bone 2009; 45(2):280–8. [DOI] [PubMed] [Google Scholar]
- [13].Johnson CP, Wang L, Tóth F, Aruwajoye O, Kirkham B, Carlson CS, et al. Quantitative susceptibility mapping detects neovascularization of the epiphyseal cartilage after ischemic injury in a piglet model of legg‐calvé‐perthes disease. Journal of Magnetic Resonance Imaging 2019; 50(1):106–13. [DOI] [PMC free article] [PubMed] [Google Scholar]
- [14].Laine JC, Martin BD, Novotny SA, Kelly DM. Role of advanced imaging in the diagnosis and management of active Legg-Calve-Perthes disease. Journal of the American Academy of Orthopaedic Surgeons 2018; 26(15):526–36. [DOI] [PubMed] [Google Scholar]
- [15].Pierce TP, Jauregui JJ, Cherian JJ, Elmallah RK, Mont MA. Imaging evaluation of patients with osteonecrosis of the femoral head. Curr Rev Musculoskelet Med 2015; 8(3):221–7. [DOI] [PMC free article] [PubMed] [Google Scholar]
- [16].Soares BP, Lequin MH, Huisman T. Safety of Contrast Material Use in Children. Magn Reson Imaging Clin N Am 2017; 25(4):779–85. [DOI] [PubMed] [Google Scholar]
- [17].Kim HK, Burgess J, Thoveson A, Gudmundsson P, Dempsey M, Jo CH. Assessment of Femoral Head Revascularization in Legg-Calve-Perthes Disease Using Serial Perfusion MRI. J Bone Joint Surg Am 2016; 98(22):1897–904. [DOI] [PubMed] [Google Scholar]
- [18].Kim HK, Wiesman KD, Kulkarni V, Burgess J, Chen E, Brabham C, et al. Perfusion MRI in Early Stage of Legg-Calve-Perthes Disease to Predict Lateral Pillar Involvement: A Preliminary Study. J Bone Joint Surg Am 2014; 96(14):1152–60. [DOI] [PubMed] [Google Scholar]
- [19].Johnson CP, Wang L, Toth F, Aruwajoye O, Carlson CS, Kim HKW, et al. Quantitative MRI Helps to Detect Hip Ischemia: Preclinical Model of Legg-Calve-Perthes Disease. Radiology 2018; 289(2):386–95. [DOI] [PMC free article] [PubMed] [Google Scholar]
- [20].Johnson CP, Toth F, Carlson CS, Armstrong AR, Zbyn S, Wu B, et al. T1ρ and T2 Mapping Detect Acute Ischemic Injury in a Piglet Model of Legg-Calve-Perthes Disease. J Orthop Res 2022; 40(2):484–94. [DOI] [PMC free article] [PubMed] [Google Scholar]
- [21].Kim HKW, Su P-H, Qiu Y-S. Histopathologic changes in growth-plate cartilage following ischemic necrosis of the capital femoral epiphysis. JBJS 2001; 83-A(5):688–97. [DOI] [PubMed] [Google Scholar]
- [22].Kim HKW, Su P-H. Development of flattening and apparent fragmentation following ischemic necrosis of the capital femoral epiphysis in a piglet model. Journal of Bone and Joint Surgery 2002; 84-A(8):1329–33. [DOI] [PubMed] [Google Scholar]
- [23].Johnson CP, Thedens DR, Magnotta VA. Precision-guided sampling schedules for efficient T1ρ mapping. Journal of Magnetic Resonance Imaging 2015; 41(1):242–50. [DOI] [PubMed] [Google Scholar]
- [24].Ekman S, Carlson CS. The Pathophysiology of Osteochondrosis. Veterinary Clinics of North America: Small Animal Practice 1998; 28(1):17–32. [DOI] [PubMed] [Google Scholar]
- [25].Yushkevich PA, Piven J, Hazlett HC, Smith RG, Ho S, Gee JC, et al. User-guided 3D active contour segmentation of anatomical structures: significantly improved efficiency and reliability. Neuroimage 2006; 31(3):1116–28. [DOI] [PubMed] [Google Scholar]
- [26].Fedorov A, Beichel R, Kalpathy-Cramer J, Finet J, Fillion-Robin JC, Pujol S, et al. 3D Slicer as an image computing platform for the Quantitative Imaging Network. Magn Reson Imaging 2012; 30(9):1323–41. [DOI] [PMC free article] [PubMed] [Google Scholar]
- [27].Schneider CA, Rasband WS, Eliceiri KW. NIH Image to ImageJ: 25 years of image analysis. Nat Methods 2012; 9(7):671–5. [DOI] [PMC free article] [PubMed] [Google Scholar]
- [28].Martin I, Obradovic B, Freed LE, Vunjak-Novakovic G. Method for quantitative analysis of glycosaminoglycan distribution in cultured natural and engineered cartilage. Ann Biomed Eng 1999; 27(5):656–62. [DOI] [PubMed] [Google Scholar]
- [29].Kim HK, Stephenson N, Garces A, Aya-ay J, Bian H. Effects of disruption of epiphyseal vasculature on the proximal femoral growth plate. J Bone Joint Surg Am 2009; 91(5):1149–58. [DOI] [PubMed] [Google Scholar]
- [30].Carlson CS, Meuten DJ, Richardson DC. Ischemic necrosis of cartilage in spontaneous and experimental lesions of osteochondrosis. Journal of Orthopaedic Research 1991; 9(3):317–29. [DOI] [PubMed] [Google Scholar]
- [31].Toth F, David FH, LaFond E, Wang L, Ellermann JM, Carlson CS. In vivo visualization using MRI T2 mapping of induced osteochondrosis and osteochondritis dissecans lesions in goats undergoing controlled exercise. J Orthop Res 2017; 35(4):868–75. [DOI] [PMC free article] [PubMed] [Google Scholar]
- [32].Mosher TJ, Dardzinski BJ. Cartilage MRI T2 relaxation time mapping: overview and applications. Semin Musculoskeletal Radiol 2004; 8(4):355–68. [DOI] [PubMed] [Google Scholar]
- [33].Trattnig S, Domayer S, Welsch GW, Mosher T, Eckstein F. MR imaging of cartilage and its repair in the knee - a review. European Radiology 2009; 19(7):1582–94. [DOI] [PubMed] [Google Scholar]
- [34].Keenan KE, Besier TF, Pauly JM, Han E, Rosenberg J, Smith RL, et al. Prediction of glycosaminoglycan content in human cartilage by age, T1ρ and T2 MRI. Osteoarthritis and Cartilage 2011; 19(2):171–9. [DOI] [PMC free article] [PubMed] [Google Scholar]
- [35].Wang L, Nissi MJ, Toth F, Shaver J, Johnson CP, Zhang J, et al. Multiparametric MRI of Epiphyseal Cartilage Necrosis (Osteochondrosis) with Histological Validation in a Goat Model. PLoS One 2015; 10(10):e0140400. [DOI] [PMC free article] [PubMed] [Google Scholar]
- [36].Varich LG, Laor T, Jaramillo D. Normal maturation of the distal femoral epiphyseal cartilage: age-related changes at MR imaging. Radiology 2000; 214(3):705–9. [DOI] [PubMed] [Google Scholar]
- [37].Zbojniewicz AM, Stringer KF, Laor T, Wall EJ. Juvenile Osteochondritis Dissecans: Correlation Between Histopathology and MRI. AJR Am J Roentgenol 2015; 205(1):W114–23. [DOI] [PubMed] [Google Scholar]
- [38].Kolb A, Robinson S, Stelzeneder D, Schreiner M, Chiari C, Windhager R, et al. Vessel architecture in human knee cartilage in children: an in vivo susceptibility-weighted imaging study at 7 T. Eur Radiol 2018; 28(8):3384–92. [DOI] [PMC free article] [PubMed] [Google Scholar]
- [39].Malattia C, Tolend M, Mazzoni M, Panwar J, Zlotnik M, Otobo T, et al. Current status of MR imaging of juvenile idiopathic arthritis. Best Pract Res Clin Rheumatol 2020; 34(6):101629. [DOI] [PubMed] [Google Scholar]
- [40].Barendregt AM, Mazzoli V, van den Berg JM, Kuijpers TW, Maas M, Nederveen AJ, et al. T1rho-mapping for assessing knee joint cartilage in children with juvenile idiopathic arthritis - feasibility and repeatability. Pediatr Radiol 2020; 50(3):371–9. [DOI] [PMC free article] [PubMed] [Google Scholar]
- [41].Zbyn S, Santiago C, Johnson CP, Ludwig KD, Zhang L, Marette S, et al. Compositional Evaluation of Lesion and Parent Bone in Patients with Juvenile Osteochondritis Dissecans of the Knee using T 2 * Mapping. J Orthop Res 2021. [DOI] [PMC free article] [PubMed] [Google Scholar]
- [42].Kijowski R, Blankenbaker DG, Munoz Del Rio A, Baer GS, Graf BK. Evaluation of the Articular Cartilage of the Knee Joint: Value of Adding a T2 Mapping Sequence to a Routine MR Imaging Protocol. Radiology 2013; 267(2):503–13. [DOI] [PubMed] [Google Scholar]
- [43].Chalian M, Li X, Guermazi A, Obuchowski NA, Carrino JA, Oei EH, et al. The QIBA Profile for MRI-based Compositional Imaging of Knee Cartilage. Radiology 2021204587. [DOI] [PMC free article] [PubMed] [Google Scholar]
- [44].Joseph B, Nair NS, NR KL, Mulpuri K, Varghese G. Optimal timing for containment surgery in Perthes Disease. J Pediatr Orthop 2003; 23601–6. [DOI] [PubMed] [Google Scholar]
- [45].Ho-Fung VM, Jaramillo D. Cartilage imaging in children: current indications, magnetic resonance imaging techniques, and imaging findings. Radiol Clin North Am 2013; 51(4):689–702. [DOI] [PubMed] [Google Scholar]
- [46].Kim HK, Shiraj S, Anton CG, Horn PS, Dardzinski BJ. Age and Sex Dependency of Cartilage T2 Relaxation Time Mapping in MRI of Children and Adolescents. American Journal of Roentgenology 2014; 202(3):626–32. [DOI] [PubMed] [Google Scholar]
- [47].Chavhan GB, Babyn PS, Singh M, Vidarsson L, Shroff M. MR Imaging at 3.0 T in Children: Technical Differences, Safety Issues, and Initial Experience. RadioGraphics 2009; 29(5):1451–66. [DOI] [PubMed] [Google Scholar]
- [48].Chauvin NA. Pediatric Cartilage Imaging. Semin Roentgenol 2021; 56(3):266–76. [DOI] [PubMed] [Google Scholar]
- [49].Hänninen N, Rautiainen J, Rieppo L, Saarakkala S, Nissi MJ. Orientation anisotropy of quantitative MRI relaxation parameters in ordered tissue. Scientific Reports 2017; 7(1). [DOI] [PMC free article] [PubMed] [Google Scholar]
- [50].Reiter DA, Magin RL, Li W, Trujillo JJ, Pilar Velasco M, Spencer RG. Anomalous T2 relaxation in normal and degraded cartilage. Magnetic Resonance in Medicine 2016; 76(3):953–62. [DOI] [PMC free article] [PubMed] [Google Scholar]
- [51].Lombardi AF, Jang H, Wei Z, Jerban S, Wallace M, Masuda K, et al. High‐contrast osteochondral junction imaging using a 3D dual adiabatic inversion recovery‐prepared ultrashort echo time cones sequence. NMR in Biomedicine 2021. [DOI] [PMC free article] [PubMed] [Google Scholar]
- [52].Nykänen O, Leskinen HPP, Finnilä MAJ, Karhula SS, Turunen MJ, Töyräs J, et al. Bright ultrashort echo time SWIFT MRI signal at the osteochondral junction is not located in the calcified cartilage. Journal of Orthopaedic Research 2020; 38(12):2649–56. [DOI] [PubMed] [Google Scholar]
- [53].Nguyen JC, Allen H, Liu F, Woo KM, Zhou Z, Kijowski R. Maturation-Related Changes in T2 Relaxation Times of Cartilage and Meniscus of the Pediatric Knee Joint at 3 T. American Journal of Roentgenology 2018; 211(6):1369–75. [DOI] [PMC free article] [PubMed] [Google Scholar]