

Summary
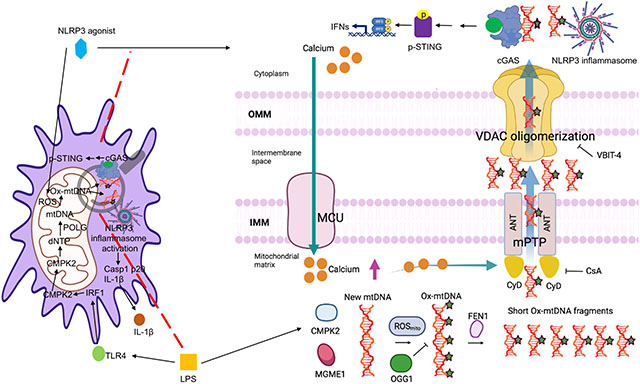
Mitochondrial DNA (mtDNA) escaping stressed mitochondria provokes inflammation via cGAS-STING pathway activation and when oxidized (Ox-mtDNA), it binds cytosolic NLRP3, thereby triggering inflammasome activation. However, it is unknown how and in which form Ox-mtDNA exits stressed mitochondria in non-apoptotic macrophages. We found that diverse NLRP3 inflammasome activators rapidly stimulated uniporter mediated calcium uptake to open mitochondrial permeability transition pores (mPTP) and trigger VDAC oligomerization. This occurred independently of mtDNA or reactive oxygen species, which induce Ox-mtDNA generation. Within mitochondria, Ox-mtDNA was either repaired by DNA glycosylase OGG1, or cleaved by the endonuclease FEN1 to 500–650 bp fragments that exited mitochondria via mPTP- and VDAC-dependent channels to initiate cytosolic NLRP3 inflammasome activation. Ox-mtDNA fragments also activated cGAS-STING signaling and gave rise to pro-inflammatory extracellular DNA. Understanding this process will advance development of potential treatments for chronic inflammatory diseases, exemplified by FEN1 inhibitors that suppressed interleukin-1β (IL-1β) production and mtDNA release in mice.
Keywords: cGAS-STING, FEN1, mitochondria, mPTP, mtDNA, NLRP3 inflammasome, OGG1, Ox-mtDNA, VDAC
Graphical Abstract
eTOC/“In Brief”
Ox-mtDNA enables NLRP3 inflammasome activation, but how Ox-mtDNA reaches the cytoplasm is unclear. In this issue of Immunity, Xian et al. show that Ox-mtDNA cleaved by FEN1 escapes mitochondria via mPTP and VDAC channels to activate NLRP3 inflammasome and STING.
Introduction
Inflammation encompasses a series of protective reactions mounted by the evolutionarily conserved innate immune system that benefit the host by eliminating pathogens and restoring cellular and organismal homeostasis (Karin and Clevers, 2016; Kotas and Medzhitov, 2015). But when not properly terminated, inflammation ceases to be beneficial and becomes pathogenic. In response to chemically and physically diverse triggers of cell injury, nucleotide-binding domain and leucine-rich repeat protein-3 (NLRP3) inflammasome, a key sensor and effector of tissue damage, is activated resulting in caspase-1 (Casp1)-mediated proteolytic interleukin-1β (IL-1β) and interleukin-18 (IL-18) processing and secretion (Gross et al., 2011). The NLRP3 inflammasome is a large cytosolic complex formed by the sensor NLRP3, the ASC (adaptor apoptosis-associated speck-like protein containing a caspase activation and recruitment domain (CARD)) scaffold, the protein kinase NIMA related kinase 7 (NEK7) and the effector pro-Casp1. After sterile injury, NLRP3 exposes its pyrin domain (PYD) to bind ASC, which uses its CARD to recruit pro-Casp1, trigger its self-cleavage and release its active p20 fragment that converts pro-IL-1β and pro-IL-18 to their mature and proinflammatory forms (Gross et al., 2011; Lu et al., 2014). Recent studies have shed further light on this process, revealing that inactive NLRP3 forms a double ring cage held together by leucine rich repeat (LRR) interactions that shield the PYD and prevent premature activation (Andreeva et al., 2021). Yet, the precise pathway leading to NLRP3 inflammasome assembly and activation after cell injury remains nebulous. Importantly, persistent NLRP3 signaling underlies many chronic diseases and metabolic pathologies, including obesity, type 2 diabetes, atherosclerosis, inflammatory bowel diseases, gout, and periodic fevers, as well as neurodegenerative disorders, including Parkinson’s and Alzheimer’s diseases (AD) (Halle et al., 2008; Heneka et al., 2015; Lamkanfi and Dixit, 2012; Mangan et al., 2018). Thus, improved understanding of the NLRP3 inflammasome activation pathway may advance treatment development for diverse diseases.
NLRP3 inflammasome activation follows a “two-step” route: priming and activation. Priming is initiated by Toll-like receptors (TLRs), which sense pathogen (PAMPs) or danger (DAMPs) associated molecular patterns and trigger nuclear factor kappa-light-chain-enhancer of activated B cells (NF-κB)-induced NLRP3 and pro-IL-1β transcription. Activation entails NLRP3 inflammasome assembly, Casp1 activation and IL-1β maturation. Heretofore, it has been unclear how diverse stimuli, referred to as NLRP3 activators, which include adenosine triphosphate (ATP), pore-forming toxins and different microcrystals (Broz and Dixit, 2016; Latz et al., 2013), trigger the abrupt priming-to-activation transition. Mitochondria are key coordinators of this process (Gurung et al., 2015; Nakahira et al., 2011; Shimada et al., 2012; Zhong et al., 2019; Zhong et al., 2018; Zhong et al., 2016; Zhou et al., 2011). Moreover we previously found that in addition to NF-κB activation, TLR engagement results in interferon regulatory factor-1 (IRF1)-dependent induction of cytidine monophosphate kinase 2 (CMPK2), a rate-limiting mitochondrial nucleotide kinase needed for initiation of mtDNA synthesis (Xian et al., 2021; Zhong et al., 2018). Before its compaction into nucleoids, newly-synthesized mtDNA is exposed to reactive oxygen species (ROS), produced upon loss of mitochondrial membrane potential triggered by along with calcium influx and potassium efflux (Gurung et al., 2015; Zhong et al., 2016). This results in generation of Ox-mtDNA that is released to the cytosol where it binds NLRP3 to trigger NLRP3 inflammasome assembly (Shimada et al., 2012; Xian et al., 2021; Zhong et al., 2018). However, the mechanisms accounting for Ox-mtDNA processing and exit from stressed, but still intact, mitochondria remained unknown (Murphy, 2018). Another target for cytosolic mtDNA is the DNA-sensing enzyme cyclic GMP-AMP (cGAMP) synthase (cGAS), which leads to activation of stimulator of interferon genes (STING) and production of type I interferons (IFN), which further amplify the inflammatory response (Ablasser and Chen, 2019; Barber, 2015; Chen et al., 2016). Although NLRP3 shows clear preference for 8-oxoguanine (8-oxoG) containing DNA (Zhong et al., 2018), cGAS senses any kind of dsDNA. While extramitochondrial mtDNA has been shown to activate cGAS-STING (Riley and Tait, 2020; Wu et al., 2021), this response has not been shown to be triggered by external stimuli, especially not NLRP3 inflammasome activators or “agonists”. We now reveal how Ox-mtDNA is processed to smaller fragments that enter the cytosol to trigger NLRP3 inflammasome assembly and activation, as well as STING phosphorylation, which mediates subsequent IFN production by non-apoptotic macrophages (Chen et al., 2016; Liu et al., 2015). The same pathway also accounts for release of circulating cell-free (ccf) mtDNA, a systemic inflammatory mediator (Oka et al., 2012; Zhong et al., 2019).
Results
Base excision repair inhibits NLRP3 inflammasome activation and sterile inflammation
Ox-mtDNA promotes atherosclerosis, a disease in which 8-oxoG DNA-glycosylase 1 (OGG1), a base excision repair (BER) enzyme that removes 8-oxoG from damaged DNA, declines over time while NLRP3 inflammasome activity is augmented (Tumurkhuu et al., 2016). Genetic OGG1 deficiency increases risk of AD, whose pathogenesis is amplified by NLRP3 inflammasome activation (Heneka et al., 2015; Heneka et al., 2013), and high amounts of 8-oxoG containing DNA and reduced OGG1 activity are detected (Mao et al., 2007). In mice, OGG1 deficiency increases susceptibility to obesity and metabolic dysfunction (Sampath et al., 2012) and enhances type I IFN production and cutaneous manifestations in pristane induced lupus (Tumurkhuu et al., 2020). Although OGG1 is best-known for its nuclear function, it also localizes to mitochondria to maintain mtDNA integrity (de Souza-Pinto et al., 2001). We wondered whether OGG1’s anti-inflammatory effects are mitochondrially exerted and due to blunted NLRP3 inflammasome activation. Indeed, mitochondrially-targeted OGG1 transgenic (mt-Ogg1Tg) mice (Wang et al., 2011) were resistant to alum-induced NLRP3 inflammasome and IL-1β-dependent peritonitis (Figures S1A and S1B). Alum-challenged mt-Ogg1Tg mice exhibited reduced IL-1β and neutrophil and monocyte infiltration relative to wildtype (WT) counterparts, with little change in tumor necrosis factor (TNF). The NLRP3 inflammasome also instigates acute respiratory distress syndrome (ARDS), in which the lung parenchyma and resident immune cells generate IL-1β and IL-18 to drive pulmonary inflammation (Grailer et al., 2014; Xian et al., 2021). Notably, mt-Ogg1Tg mice were resistant to LPS-induced ARDS, displaying reduced pulmonary vascular endothelium damage, interstitial edema, macrophage and neutrophil infiltration alveolar wall thickening and collagen deposition (Figures 1A and 1B). Fittingly, mt-Ogg1Tg mice had less IL-1β in bronchoalveolar lavage fluid (BALF) but no change in TNF secretion (Figure 1C).
Figure 1. Base excision repair inhibits Ox-mtDNA production and attenuates NLRP3 inflammasome activation.
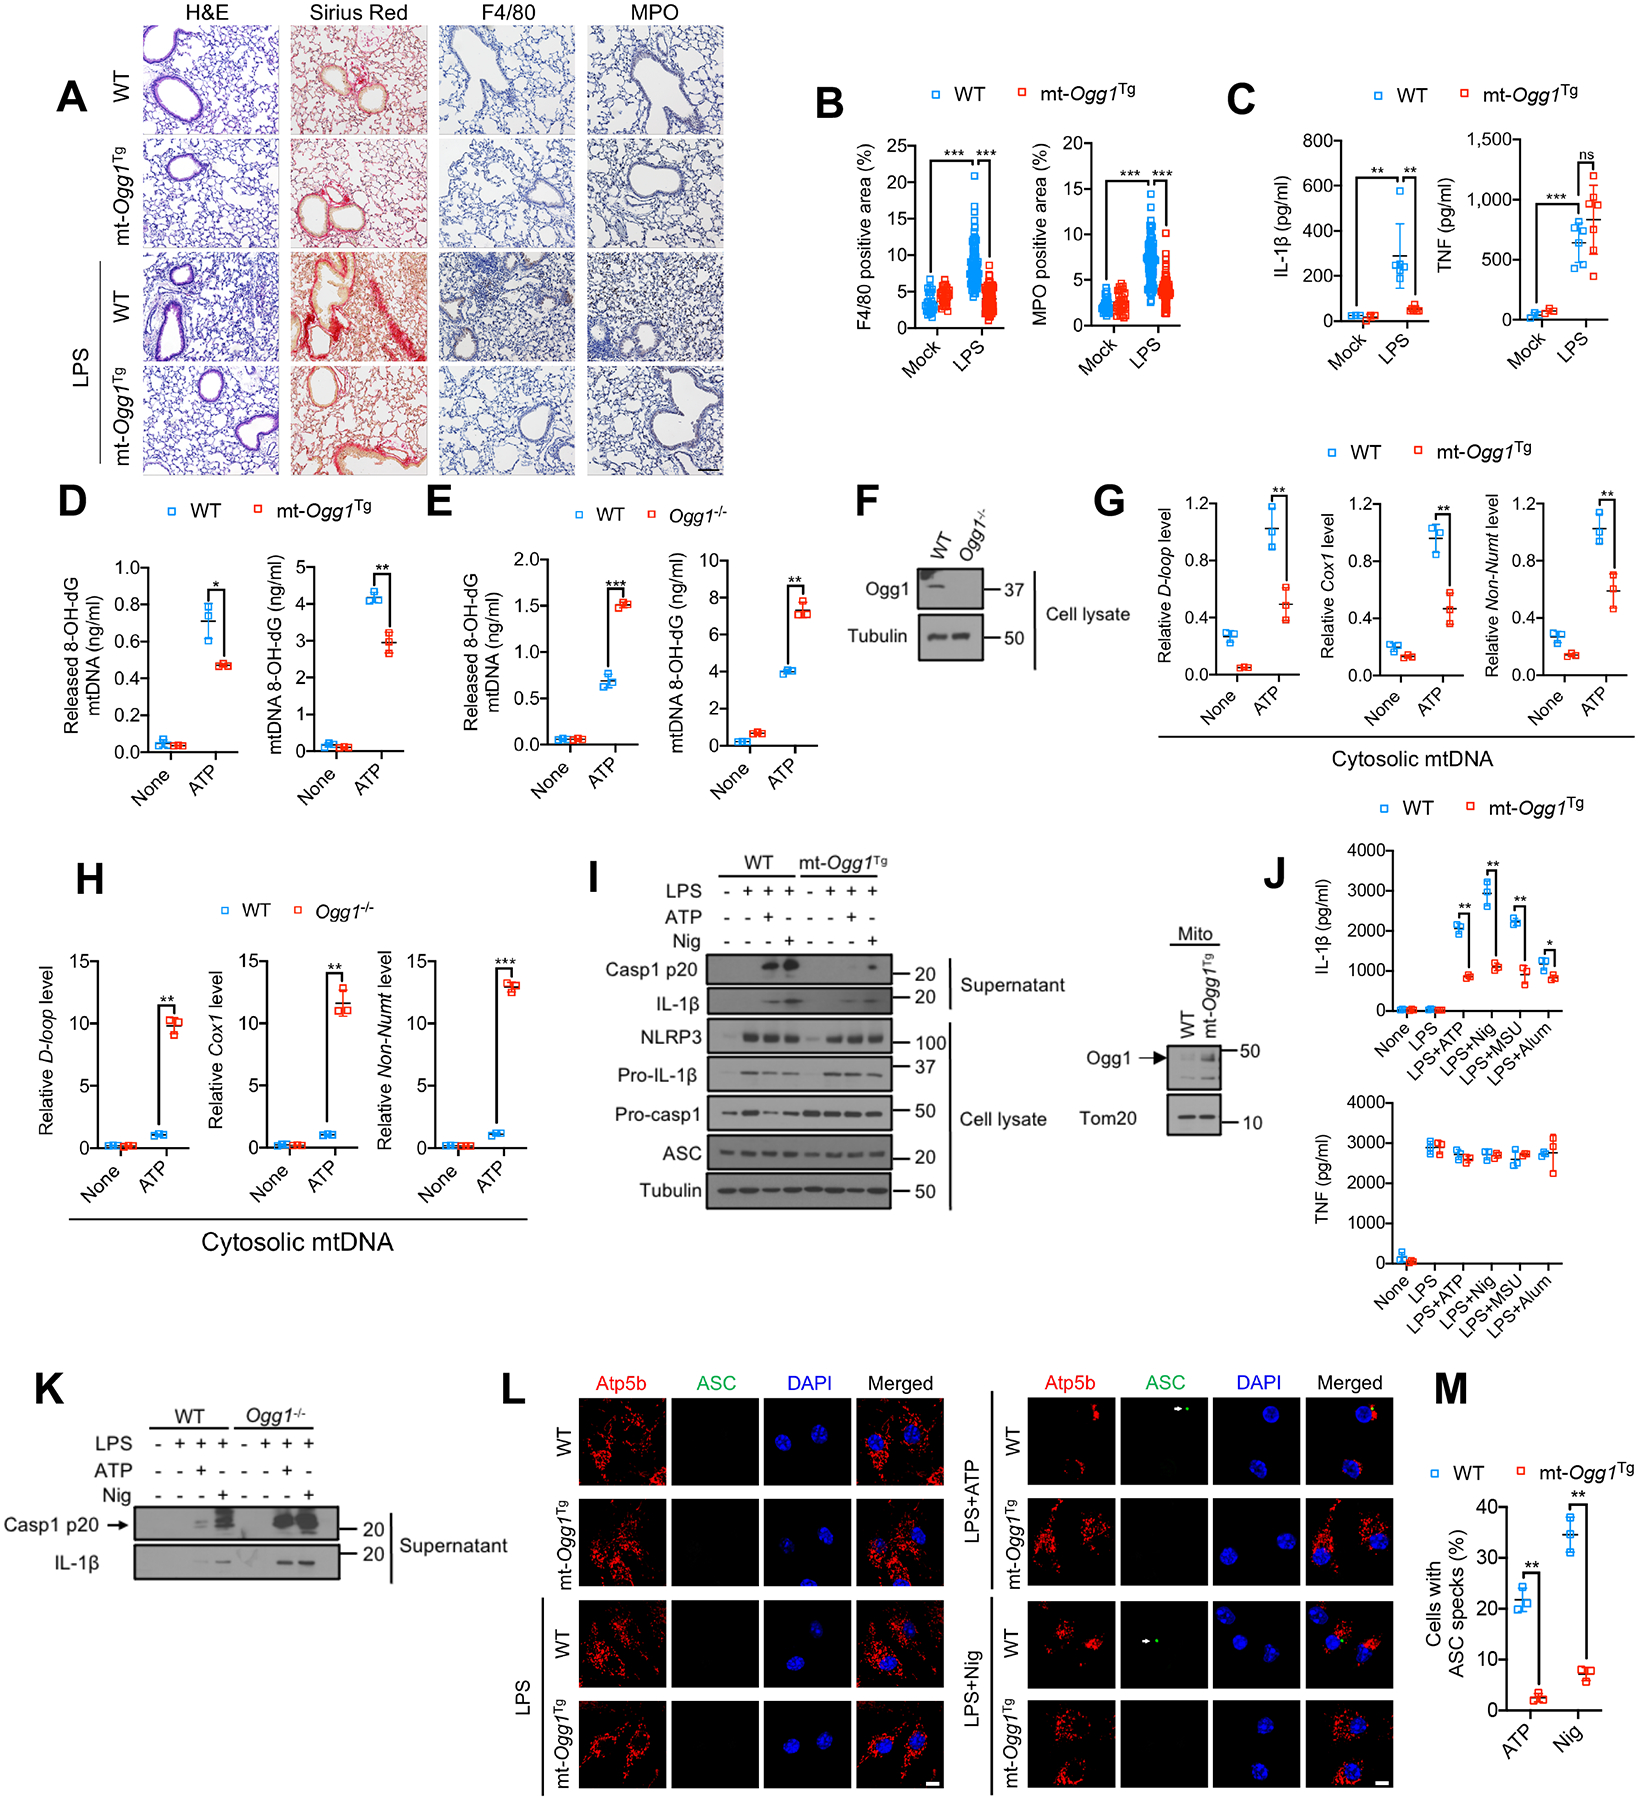
(A) H&E, Sirius red, F4/80 and myeloperoxidase (MPO) antibody staining of lung tissue from mice challenged with 5 mg/kg LPS 24 h prior to tissue collection. n=3 for mock treatment and n=6–7 mice for LPS treatment. 10–12 images per mouse were analyzed. Scale bar, 100 μm.
(B) Area (in %) occupied by F4/80 or MPO positive cells in lung sections from (A). Data are means ± s.d.
(C) IL-1β and TNF concentrations in BALF from (A) measured by ELISA. Data are means ± s.d.
(D and E) 8-OH-dG content of mtDNA from cytosol (left) or mitochondria (right) of LPS (200 ng/mL, 4 h)-primed WT and mt-OggTg (D) or WT and Ogg1−/− (E) BMDM stimulated −/+ ATP (4 mM, 1 h).
(F) Immunoblot (IB) analysis of lysates of WT and Ogg1−/− BMDM.
(G and H) Relative cytosolic mtDNA amounts in LPS-primed WT and mt-OggTg (G) or WT and Ogg1−/− (H) BMDM stimulated −/+ ATP. The relative ratios of D-loop mtDNA, Cox1 mtDNA, or non-NUMT mtDNA are shown.
(I) IB analysis of Casp1 p20 and mature IL-1β in supernatants and NLRP3, Pro-IL-1β, Pro-Casp1, and ASC in lysates of LPS-primed WT or mt-Ogg1Tg BMDM stimulated −/+ ATP (4 mM, 1 h) or nigericin (Nig) (10 μM, 1h) (left). Mitochondrial OGG1 IB in WT and mt-Ogg1Tg BMDM (right) is shown.
(J) IL-1β and TNF secretion by LPS-primed WT or mt-Ogg1Tg BMDM challenged with different NLRP3 activators (ATP, 4 mM for 1 h, nigericin, 10 μM for 1h, MSU, 600 μg/mL for 6 h and alum, 500 μg/mL for 6 h).
(K) IB of Casp1 p20 and mature IL-1β in supernatants of LPS-primed WT and Ogg1−/− BMDM stimulated −/+ ATP (4 mM) or nigericin (10 μM) for 1h.
(L) Representative fluorescent microscopy images of WT or mt-Ogg1Tg BMDM co-stained for Atp5b and ASC before or after LPS priming followed by ATP (4 mM) or nigericin (10 μM) stimulation for 1h. DAPI stains nuclei. Arrows indicate ASC specks. Scale bar, 5 μm.
(M) Percentages of cells shown in (L) with ASC specks. n=150 cells per group from 3 independent experiments.
IBs are one representative out of 3 independent experiments. Results in (D, E, G, H, J and M) are mean ± s.d. (n=3). *p<0.05; **p<0.01; ***p<0.001. ns, not significant. Two-sided unpaired t-test.
See also Figure S1.
To understand how mtOGG1 inhibits IL-1β-driven inflammation, we employed bone marrow derived macrophages (BMDM). ATP-challenged mt-Ogg1Tg BMDM had less 8-oxoG-containing Ox-mtDNA in cytoplasm and mitochondria than WT counterparts (Figure 1D), whereas ATP-challenged Ogg1−/−-macrophages had more Ox-mtDNA in both compartments (Figures 1E, 1F, S1C and S1D). Cytosolic mtDNA was also lower in mt-Ogg1Tg (Figure 1G), and higher in Ogg1−/− (Figures 1H and S1E) macrophages that were ATP challenged. mtOGG1 overexpression or lack thereof had no effect on the LPS-stimulated mtDNA increase (Figures S1F–S1H), implying that mtOGG1 interferes with mtDNA oxidation, but not synthesis. Importantly, mtOGG1 inhibited Casp1 activation and pro-IL-1β processing in LPS-primed BMDM stimulated with ATP, nigericin, monosodium urate (MSU), or alum (Figures 1I, 1J and S1I), whereas Ogg1 ablation had the opposite effect (Figures 1K, S1J and S1K). OGG1 had no effect on TNF secretion or pro-IL-1β and NLRP3 inflammasome component expression (Figures 1I, 1J and S1L). ASC speck formation, reflecting inflammasome assembly (Dick et al., 2016), was also inhibited in mt-Ogg1Tg BMDM (Figures 1L and 1M). These results reinforce the notion that Ox-mtDNA promotes NLRP3 inflammasome activation and is a target for the anti-inflammatory activity of mtOGG1. Although mtOGG1 inhibited and shOGG1 enhanced cytochrome C release and apoptotic activation of Casp3 and Casp9 (Figures S1M–T), consistent with the notion that mtDNA damage triggers cardiomyocyte apoptosis which is attenuated by mtOGG1 (Ricci et al., 2008), NLRP3 inflammasome activators did not trigger apoptosis and apoptosis inducers did not activate NLRP3 inflammasome (see below).
mPTP opening and VDAC oligomerization enable Ox-mtDNA leakage
To activate NLRP3 inflammasome, Ox-mtDNA must exit mitochondria through an unknown pore and reach the cytosol (Murphy, 2018). We examined the role of voltage-dependent anion channel (VDAC), recently reported to mediate mtDNA leakage in mitochondrial endonuclease g deficient (Endog−/−)-fibroblasts, which exhibit constitutive oxidative stress and VDAC oligomerization (Kim et al., 2019). In LPS-primed BMDM, VDAC oligomerization was induced by ATP challenge, indicating channel opening, and blocked by VBIT-4, a VDAC1 oligomerization inhibitor (Figure 2A). VDAC resides in the outer mitochondrial membrane (OMM), but for mtDNA to exit via VDAC, it must pass through the inner mitochondrial membrane (IMM), where the poorly defined mitochondrial permeability transition pore (mPTP) is located (Perez-Trevino et al., 2020). Although the link between mPTP and VDAC remains contentious, mPTP was also suggested to be involved in mtDNA release and subsequent cGAS-STING activation in fibroblasts overexpressing TDP-43, a protein associated with amyotrophic lateral sclerosis (Yu et al., 2020). Importantly, ATP challenge induced mPTP opening, suggested by markedly decreased calcein fluorescence (Figure 2B). The mPTP inhibitor cyclosporine A (CsA) that binds cyclophilin D (CyD), which mediates Ca2+-stimulated mPTP opening (Broekemeier et al., 1989), blocked the decrease in calcein fluorescence and increased it above baseline (Figure 2B), suggesting low basal mPTP opening. However, the VDAC oligomerization inhibitor VBIT-4 had little effect on calcein fluorescence. We therefore postulated that mPTP opening precedes VDAC oligomerization and enables Ox-mtDNA leakage to the cytosol. Although mtDNA oxidation was suggested to trigger its leakage (Kim et al., 2019; Perez-Trevino et al., 2020), mtOGG1 overexpression or ablation had no effect on VDAC oligomerization (Figure S2A) or mPTP opening (Figures S2B and S2C), suggesting that mitochondrial chanel opening is not coupled to mtDNA oxidation (see more below). Indeed, inhibition of mPTP opening with CsA reduced the cytosolic pools of Ox-mtDNA by 60± 6% and mtDNA by 30–40%, and VDAC oligomerization inhibition with VBIT-4 reduced cytosolic Ox-mtDNA by 81± 4% and mtDNA by 50–60%, even in Ogg1-silenced BMDM (Figures 2C and 2D). These results may explain how CsA inhibits NLRP3 inflammasome activation (Elliott and Sutterwala, 2015). In contrast to a previous report (Kim et al., 2019), mtDNA depletion with ethidium bromide (EtBr) did not block VDAC oligomerization (Figures 2E, S2D and S2E). Thus, VDAC oligomerization and opening do not require mtDNA.
Figure 2. mPTP opening and VDAC oligomerization enable mtDNA cytosolic release and NLRP3 inflammasome activation.
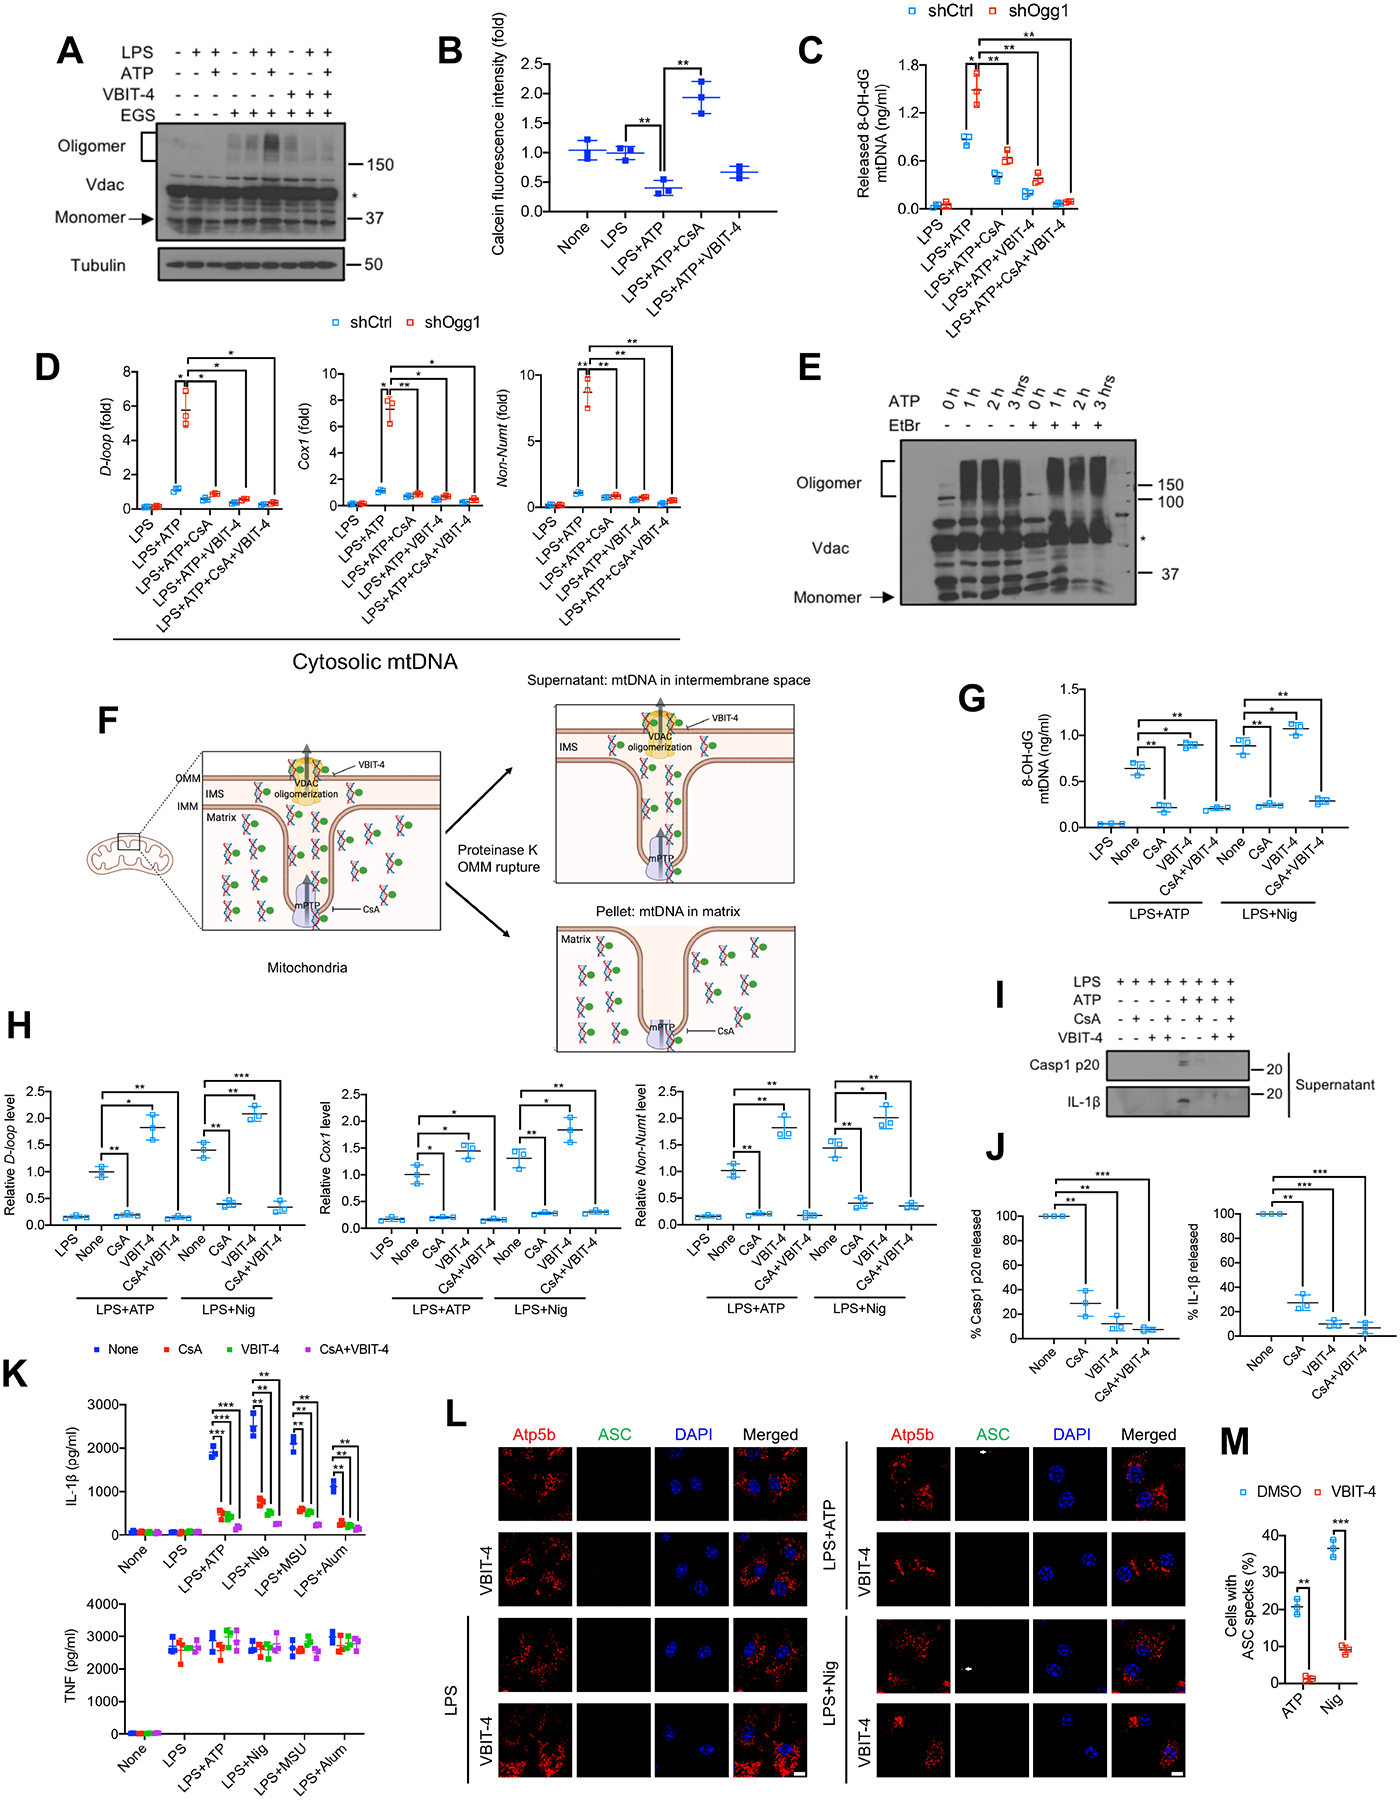
(A) VDAC oligomerization in BMDM that were pretreated −/+ VBIT-4 (10 μM, 16 h), primed −/+ LPS (200 ng/mL, 4 h) and stimulated −/+ ATP (4 mM, 1 h) was determined by IB analysis of cell lysates incubated with the cross-linking agent EGS (200 μM, 40 min, 30°C) to stabilize VDAC oligomers. Asterisk indicates nonspecific band.
(B) Relative calcein fluorescence in BMDM pretreated −/+ CsA (1 μM, 16 h) or VBIT-4 (10 μM, 16 h), followed by priming −/+ LPS (200 ng/mL, 4 h) and stimulation −/+ ATP (4 mM, 1 h). The calcein-quenching assay measures mPTP opening.
(C and D) Relative amounts of Ox-mtDNA (C) or total mtDNA (D) in cytosols of LPS-primed shCtrl- or shOgg1-transduced BMDM, pretreated −/+ CsA and VBIT-4 and stimulated with ATP as in (B).
(E) VDAC oligomerization in BMDM treated −/+ EtBr (450 ng/mL, 4 days) to deplete mtDNA, and subsequently incubated −/+ ATP (4 mM) for 1, 2 or 3 h was analyzed as in (A). Asterisk indicates nonspecific band.
(F) Experimental scheme for measuring Ox-mtDNA in the intermembrane space (IMS) based on OMM rupture with proteinase K.
(G and H) Relative amounts of Ox-mtDNA (G) or total mtDNA (H) in supernatants (IMS fraction) of proteinase K digested mitochondria isolated from BMDM treated as indicated.
(I) IB analysis of Casp1 p20 and mature IL-1β in supernatants of LPS-primed BMDM, pretreated −/+ CsA (1 μM, 16 h) and VBIT-4 (10 μM, 16 h) and challenged with ATP (4 mM, 1h).
(J) Relative Casp1 p20 and IL-1β in supernatants of BMDM treated as in (I).
(K) IL-1β and TNF secretion by BMDM primed −/+ LPS (200 ng/mL, 4 h), pretreated−/+ CsA (1 μM, 16 h) and VBIT-4 (10 μM, 16 h) and challenged with different NLRP3 activators.
(L) Representative fluorescent microscopy images of BMDM, pretreated −/+ VBIT-4 (10 μM, 16 h), primed −/+ LPS (200 ng/mL, 4 h), stimulated −/+ ATP (4 mM, 1 h) or nigericin (10 μM, 1 h) and co-stained for Atp5b and ASC. Arrows indicate ASC specks. Scale bar, 5 μm.
(M) Percentages of cells from (L) with ASC specks. n=150 cells per group from 3 independent experiments.
IBs show one representative out of 3 independent experiments. Results in (B-D, G, H, J, K, and M) are mean ± s.d. (n=3). *p<0.05; **p<0.01; ***p<0.001. ns, not significant. Two-sided unpaired t-test.
See also Figure S2.
To dissect the roles of VDAC oligomerization and mPTP in mtDNA escape, we investigated whether Ox-mtDNA and mtDNA were trapped in the mitochondrial intermembrane space (IMS) of VBIT-4 treated BMDM. Due to differential proteinase K sensitivity (Xiao et al., 2015), OMM proteins (VDAC and Tom20) were degraded when purified BMDM mitochondria were incubated with 20 μg/mL proteinase K for 30 min, while IMM proteins (Tim23 and COX1/MT-CO1) were not (Figure S2F), implying that the OMM was ruptured and the IMM remained intact. Using this method (Figure 2F), we measured relative Ox-mtDNA and mtDNA amounts in the IMS. The amounts of Ox-mtDNA (Figure 2G) and different regions of the mtDNA genome (Figure 2H) within the IMS were greatly reduced after blocking mPTP opening with CsA but were elevated after inhibition of VDAC oligomerization with VBIT-4. Importantly, the CsA effect was dominant to that of VBIT-4, indicating that Ox-mtDNA first exited the IMM via an mPTP-dependent pore and then reached the cytoplasm through VDAC channels. Both CsA and VBIT-4 inhibited NLRP3 inflammasome activation in WT and Ogg1−/−- BMDM, without affecting NLRP3, pro-IL-1β, pro-casp1 and ASC expression or TNF secretion (Figures 2I–2K, S2G and S2H). Vdac1 or Vdac3 silencing also prevented Casp1 activation and mature IL-1β secretion (Figure S2I), and ASC speck formation was inhibited by VBIT-4 (Figures 2L and 2M). CsA and VBIT-4 reduced mtDNA oxidation by 33 ± 7.5% and 45 ± 5.0%, respectively (Figure S2J), presumably due to a modest decline in mtROS production (Figure S2K). These results and those of the proteinase K experiment suggest that despite the decline in mtROS, CsA and VBIT-4 mainly interfere with mtDNA cytosolic escape. Moreover, BMDM incubated with CsA, or VBIT-4 abrogated mitochondrial depolarization upon NLRP3 activator challenge (Figure S2L), suggesting that mPTP and VDAC opening equilibrate proton gradients and lead to uncoupling which enhances mtROS production.
Ca2+ overload initiates mPTP opening and subsequent VDAC oligomerization
BMDM exposure to nigericin, MSU and alum, even without LPS priming, also triggered VDAC oligomerization (Figures 3A and 3B) and mPTP opening (Figure 3C), suggesting these are common events preceding NLRP3 inflammasome activation. To identify the trigger for mPTP opening, we examined [Ca2+]m influx, because both calcium overload and ROS were suggested to drive mPTP opening (Bernardi et al., 2006). Rhod-2 (a dye that fluoresces in response to mitochondrial Ca2+ binding) fluorescence in BMDM stimulated with different NLRP3 activators, with or without LPS priming, was strongly elevated (Figures 3D and S3A). A rapid [Ca2+]m spike was detected within 30–50 sec of NLRP3 agonist challenge (Figure 3E), which may be the earliest mitochondrial response to NLRP3 inflammasome activators. mtOGG1 overexpression or deficiency had no impact on [Ca2+]m uptake amplitude (Figures S3B and S3C). Notably, inhibition of mPTP opening with CsA suppressed VDAC oligomerization (Figure 3F), indicating that mPTP opening triggerred VDAC oligomerization. No cytochrome C release was observed during NLRP3 inflammasome activation and etoposide, which induced cytochrome C release, did not trigger ASC speck formation (Figure S3D), suggesting mPTP-VDAC opening is apoptosis-independent. This fits well with the notion that apoptosis is linked to formation of OMM-resident BAX and BAK oligomerization macropores, which cause mPTP-independent IMM herniation to release mtDNA for cGAS-STING activation (McArthur et al., 2018; Riley et al., 2018; Wu et al., 2021). To examine mtROS involvement in NLRP3 agonist-induced channel opening and consequent Ox-mtDNA release, we employed the mtROS generators DMNQ and mitoParaquat. Although producing as much mtROS as ATP (Figure S3E), neither compound induced mPTP opening (Figure S3F), VDAC oligomerization (Figure S3G) and consequent Ox-mtDNA (Figure S3H) and mtDNA (Figure S3I) cytosolic release. While mtDNA oxidation was augmented (Figure S3H), neither mtROS generator activated NLRP3 inflammasome (Figure S3J).
Figure 3. [Ca2+]m uptake initiates mPTP opening and VDAC oligomerization to release Ox-mtDNA.
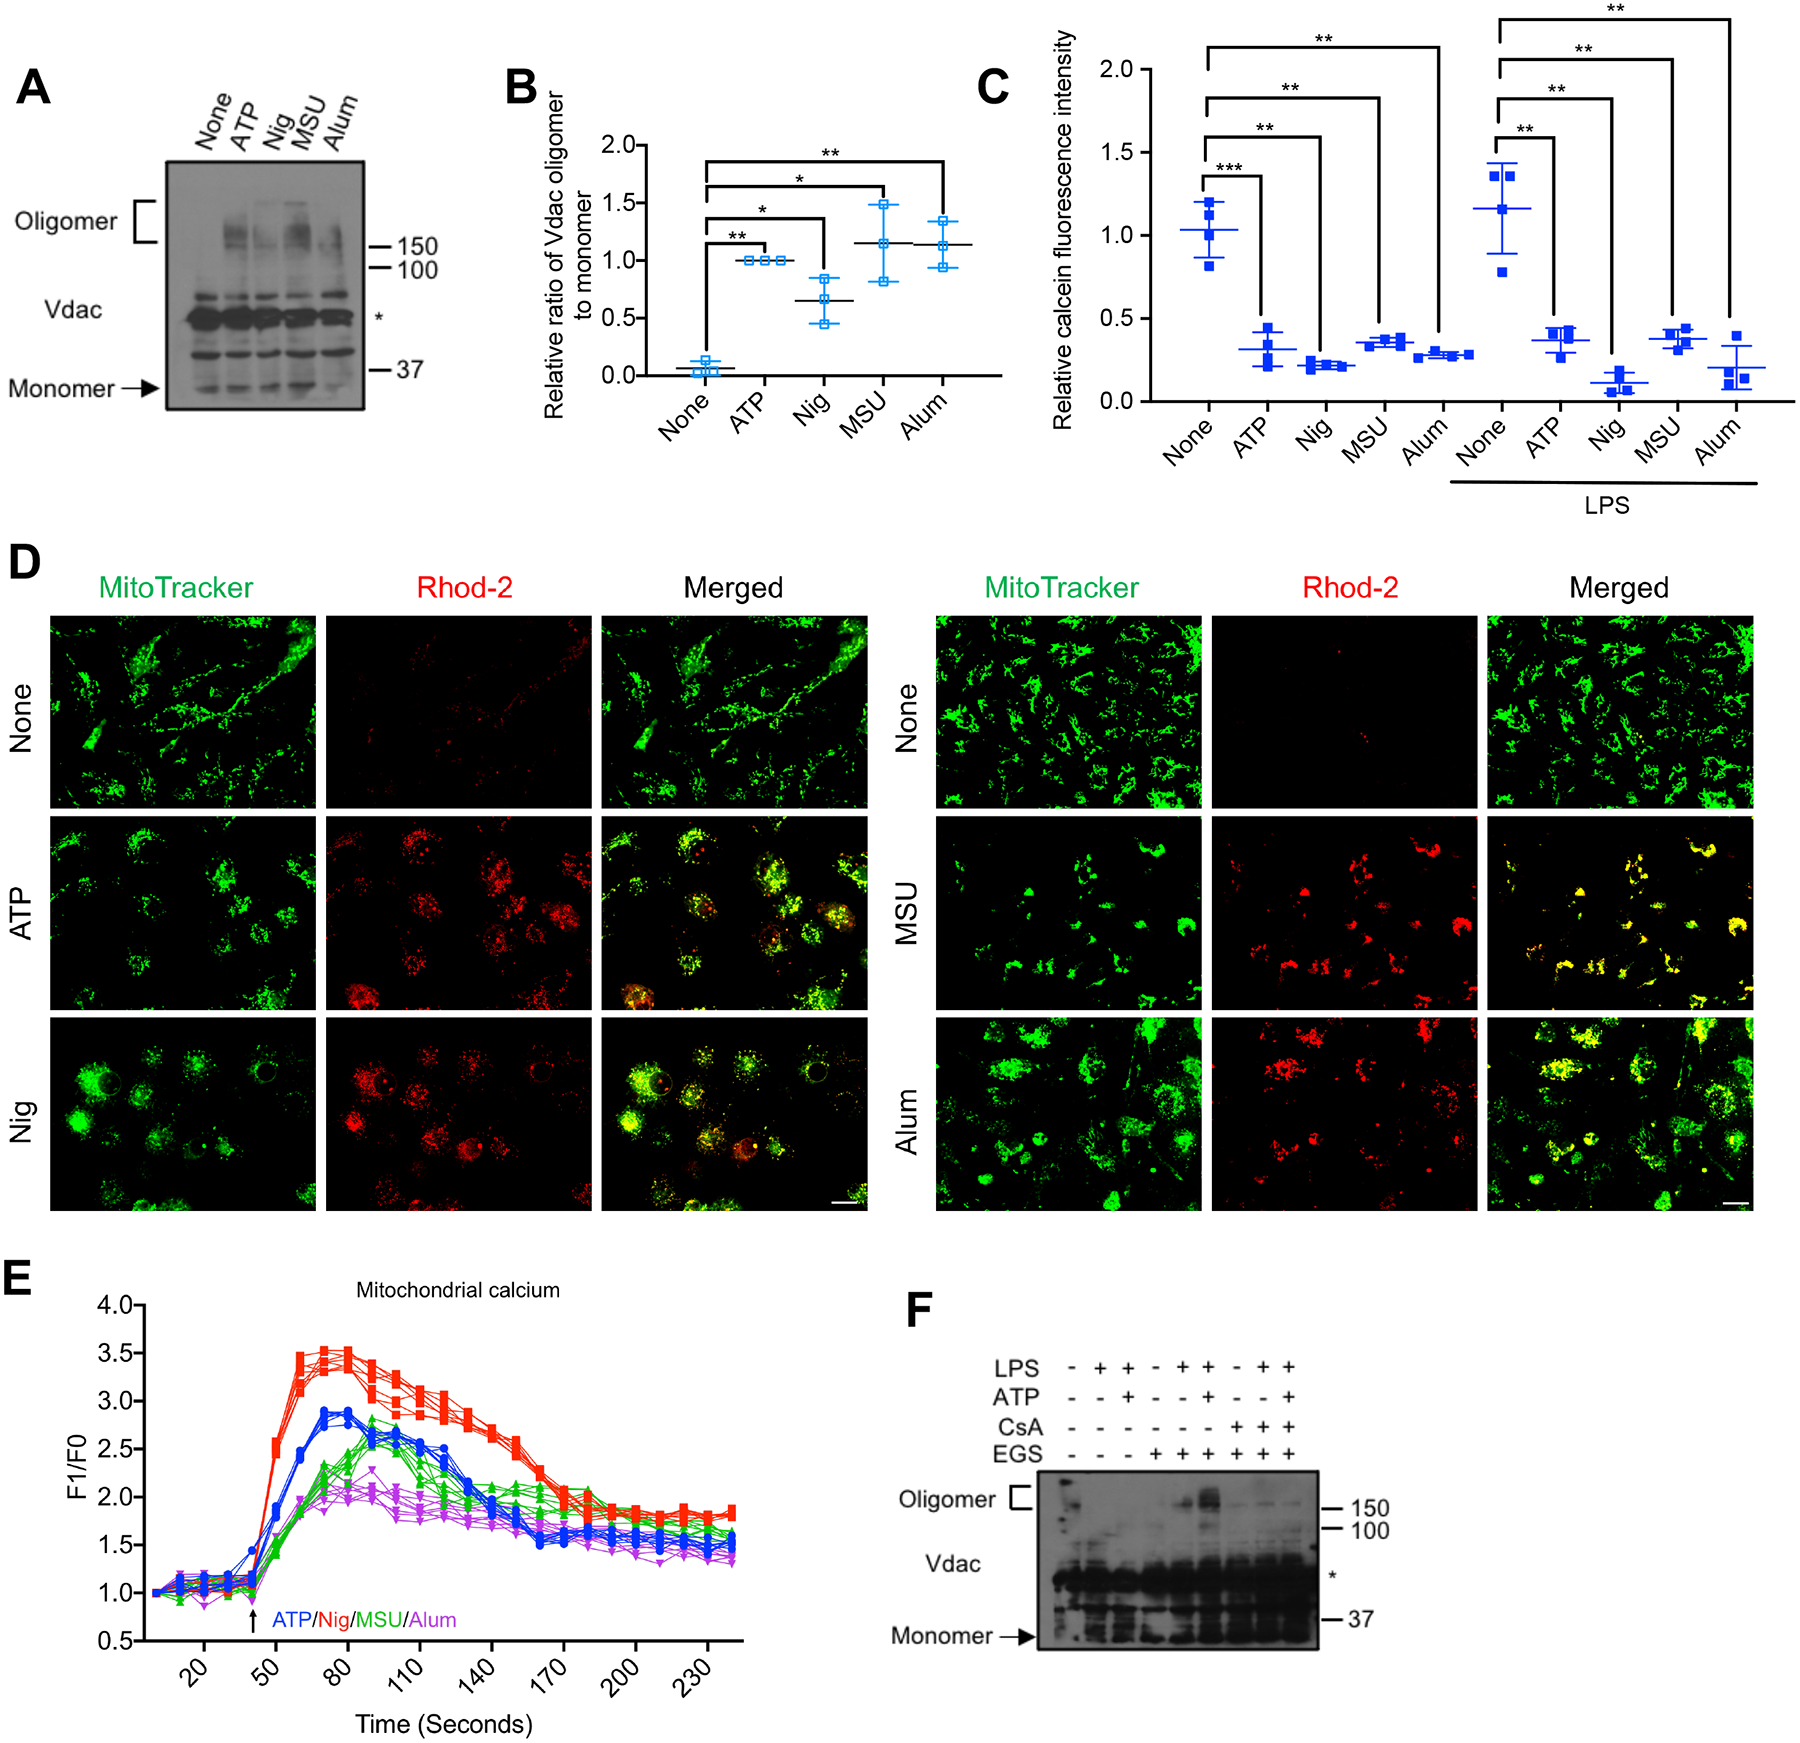
(A) VDAC oligomerization in BMDM stimulated with different NLRP3 activators was analyzed as in Figure 2A. Asterisk indicates nonspecific band.
(B) Relative VDAC oligomerization in cells from (A) (n=3).
(C) Relative calcein fluorescence in BMDM −/+ LPS (200 ng/mL, 4 h) priming and challenged with different NLRP3 agonists, using the calcein-quenching assay to measure mPTP opening as in Figure 2B (n=4).
(D) Representative fluorescent microscopy images of BMDM double-labeled with MitoTracker Green and Rhod-2 to detect [Ca2+]m, followed by ATP, nigericin, MSU or alum stimulation. Scale bar, 10 μm.
(E) Normalized Rhod-2 fluorescence traces of BMDM challenged with ATP (blue), nigericin (red), MSU (green) or alum (purple) at 40 seconds (n=8).
(F) VDAC oligomerization in BMDM pretreated −/+ CsA (1 μM, 16 h), followed by priming −/+ LPS and stimulation −/+ ATP was analyzed as in Figure 2A.
IBs are one representative out of 3. Results in (B, C, and E) are mean ± s.d.. *p<0.05; **p<0.01; ***p<0.001. Two-sided unpaired t-test.
See also Figure S3.
MCU mediates mitochondrial Ca2+ uptake to trigger mPTP-VDAC channel opening
Ca2+ from the endoplasmic reticulum (ER), the major intracellular Ca2+ store, can be transferred via inositol 1,4,5-trisphosphate receptor (IP3R) to mitochondria (Rizzuto et al., 1998). Whereas the OMM is permeable to ions and small solutes, Ca2+ entry via the ion impermeable IMM is mediated by the mitochondrial calcium uniporter (MCU) complex (Baughman et al., 2011). To validate [Ca2+]m uptake as the trigger of mPTP opening, we used xestospongin C (XeC), an IP3R antagonist and ruthenium red (RuR), a MCU inhibitor. Whereas RuR disrupted the ATP- or nigericin-induced [Ca2+]m pulse (Figure 4A), XeC had no effect, although it decreased cytosolic Ca2+ (Figure S4A). Importantly, RuR blocked mPTP opening (Figure 4B) and VDAC oligomerization (Figures 4C and S4B), reducing cytosolic Ox-mtDNA (Figure 4D) and cytoplasmic mtDNA release (Figure 4E). RuR did not inhibit LPS-stimulated mtDNA synthesis (Figure S4C), but it suppressed Casp1 activation and mature IL-1β secretion (Figures 4F, 4G and S4D), with no effect on NLRP3 inflammasome component expression (Figure 4H) or TNF secretion (Figure 4G).
Figure 4. MCU mediates mitochondrial Ca2+ uptake to trigger mPTP-VDAC channel opening and Ox-mtDNA cytosolic release.
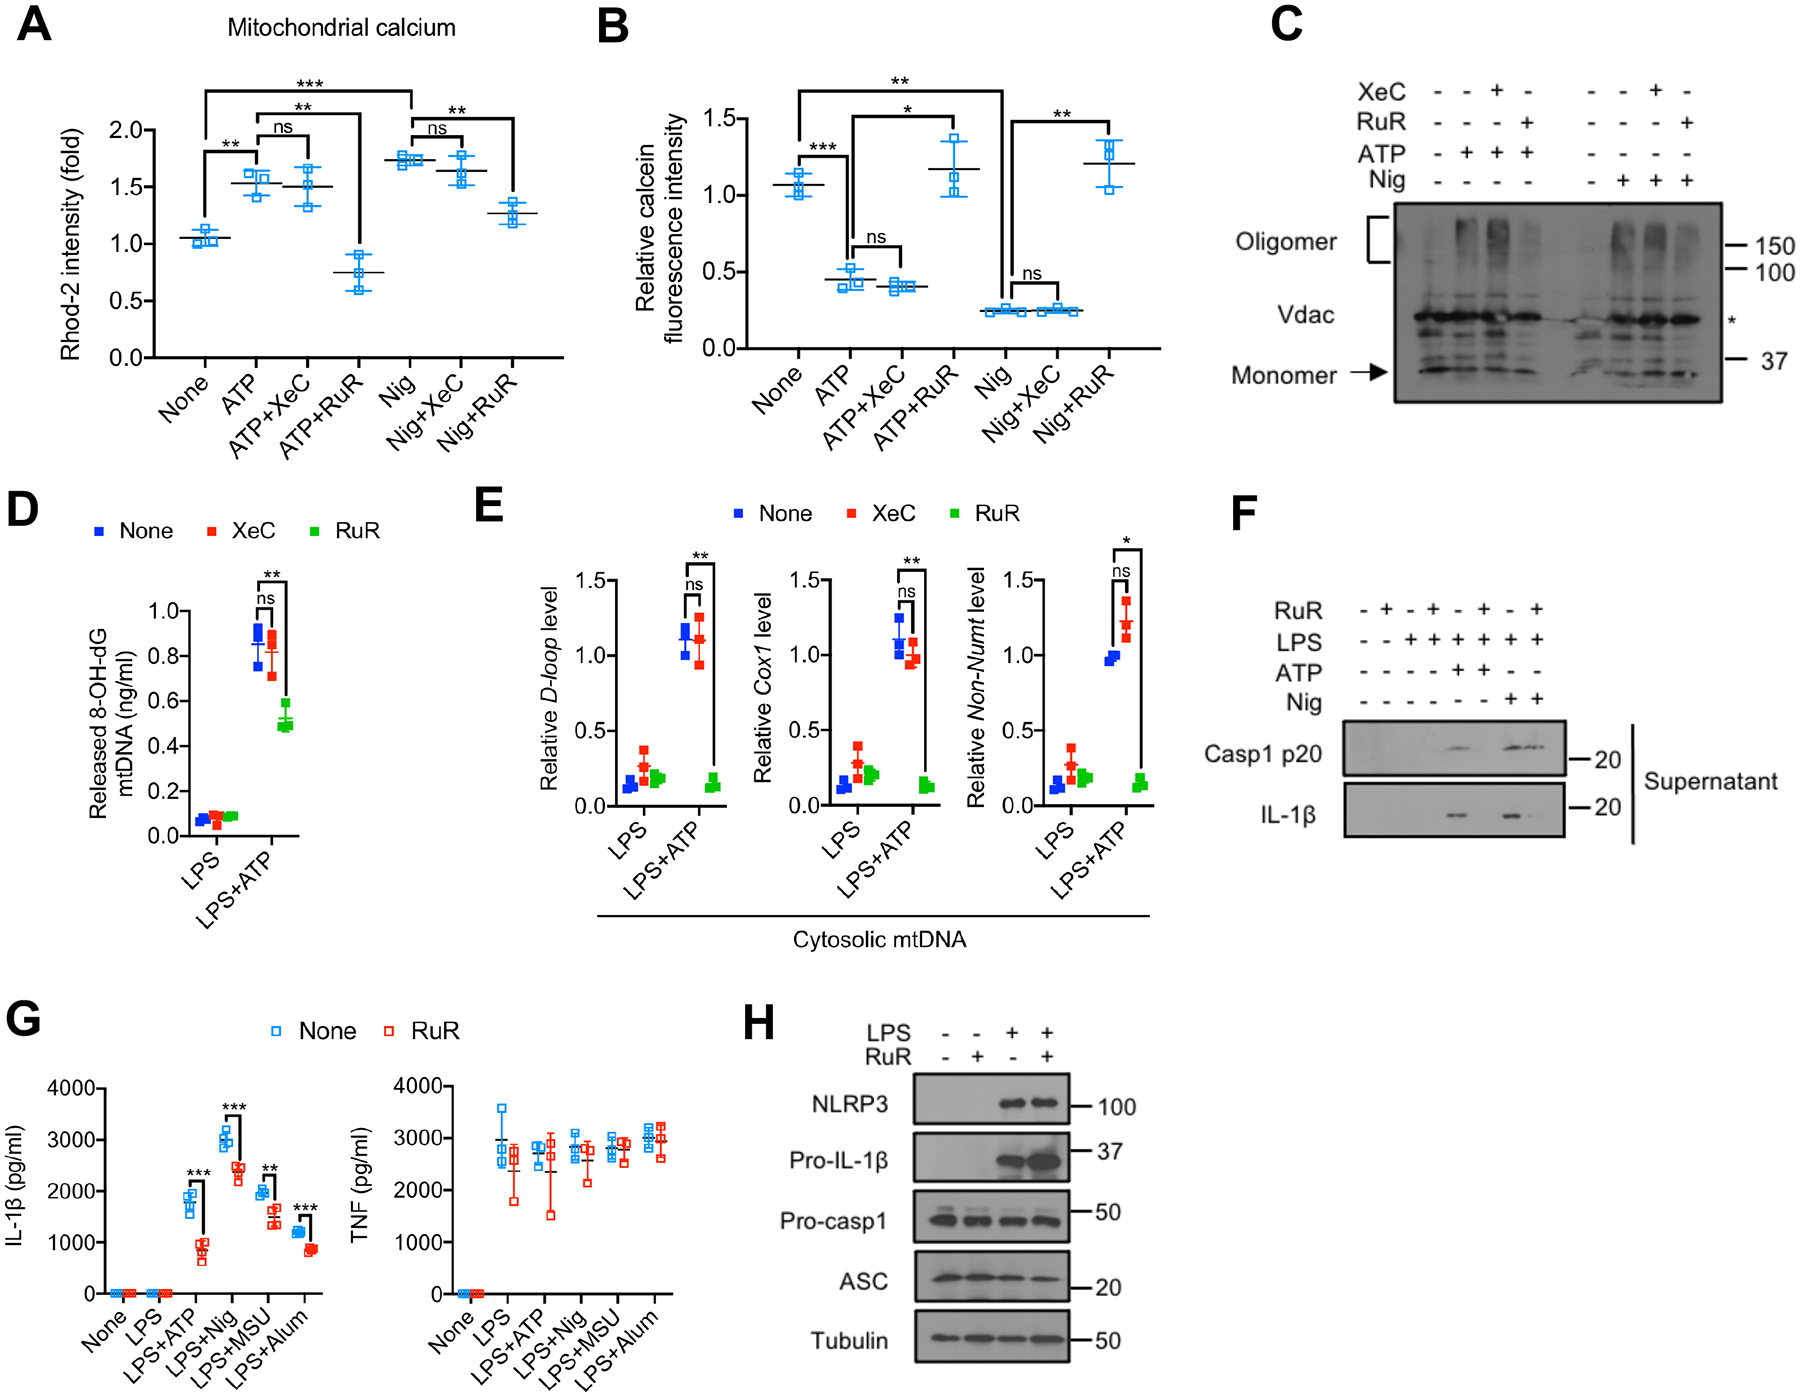
(A) Relative Rhod-2 fluorescence in LPS-primed BMDM pretreated −/+ the IP3R inhibitor xestospongin C (XeC) (5 μM, 16 h) or the MCU inhibitor ruthenium red (RuR) (10 μM, 16 h), followed by ATP (4 mM, 1 h) or nigericin (10 μM, 1 h) challenge (n=3).
(B) Relative calcein fluorescence in BMDM treated as in (A) (n=3).
(C) VDAC oligomerization in BMDM treated as in (A).
(D and E) Amounts of Ox-mtDNA (D) or relative total mtDNA (E) in cytosols of LPS-primed BMDM pretreated −/+ XeC (5 μM, 16 h) or RuR (10 μM, 16 h) and stimulated with ATP (4 mM, 1 h) (n=3).
(F) IB analysis of Casp1 p20 and IL-1β in supernatants of BMDM−/+ RuR pretreatment, primed −/+ LPS, and stimulated with ATP or nigericin as in (A).
(G) IL-1β and TNF secretion by BMDM pretreated−/+ RuR (10 μM, 16 h), primed or not with LPS (200 ng/mL, 4 h) and challenged with different NLRP3 activators (n=3).
(H) IB analysis of NLRP3, pro-IL-1β, pro-Casp1, ASC, and tubulin in lysates of BMDM pretreated −/+ RuR (10 μM, 16 h), before and after LPS priming (200 ng/mL, 4 h). IBs are one representative out of 3. Results in (A, B, D, E and G) are mean ± s.d.. *p<0.05; **p<0.01; ***p<0.001. ns, not significant. Two-sided unpaired t-test.
See also Figure S4.
FEN1-mediated mtDNA fragmentation precedes cytosolic escape and licenses NLRP3 inflammasome activation
mtDNA is ~16.3 kb in length and compacted by TFAM into a matrix-attached nucleoid that cannot pass through either mPTP or VDAC pores (Garcia and Chavez, 2007; Wu et al., 2021; Zhong et al., 2019). Although it has been proposed that entire nucleoids are extruded into the cytosol to activate cGAS-STING (White et al., 2014; Zhong et al., 2019), other studies using isolated mitochondria or liposomes have shown that only mtDNA fragments <700 bp are released upon mPTP opening (Garcia and Chavez, 2007). To address this issue, we extracted DNA from mitochondria and cytosol of LPS-primed BMDM challenged with either nigericin or ATP and separated it by gel electrophoresis. LPS priming increased the amount of mtDNA, which was partially degraded after nigericin or ATP exposure (Figure 5A). Although the majority of mtDNA remaining within mitochondria was >5 kb, nigericin and ATP treatments led to appearance of cytoplasmic DNA at 500–650 bp in length (Figure 5A). This DNA was mitochondrially derived because it was absent in EtBr-treated BMDM (Figures S5A and S5B). Nuclear DNA degradation was not observed, further implying that NLRP3 activators do not trigger apoptosis. We PCR amplified 591 bp or 5698 bp mtDNA stretches from the mitochondrial and cytosolic DNA pools of LPS-primed BMDM challenged with different NLRP3 activators. Although LPS increased the amounts of both DNA stretches in the mitochondrial pool, only the shorter DNA could be amplified from the cytosol and only after exposure to NLRP3 activators (Figure 5B). PCR amplification revealed that amounts of the entire mitochondrial genome (16299 bp) were higher after LPS priming, but lower after NLRP3 agonist challenge (Figure S5C).
Figure 5. FEN1-mediated mtDNA fragmentation is required for Ox-mtDNA cytosolic release and NLRP3 inflammasome activation.
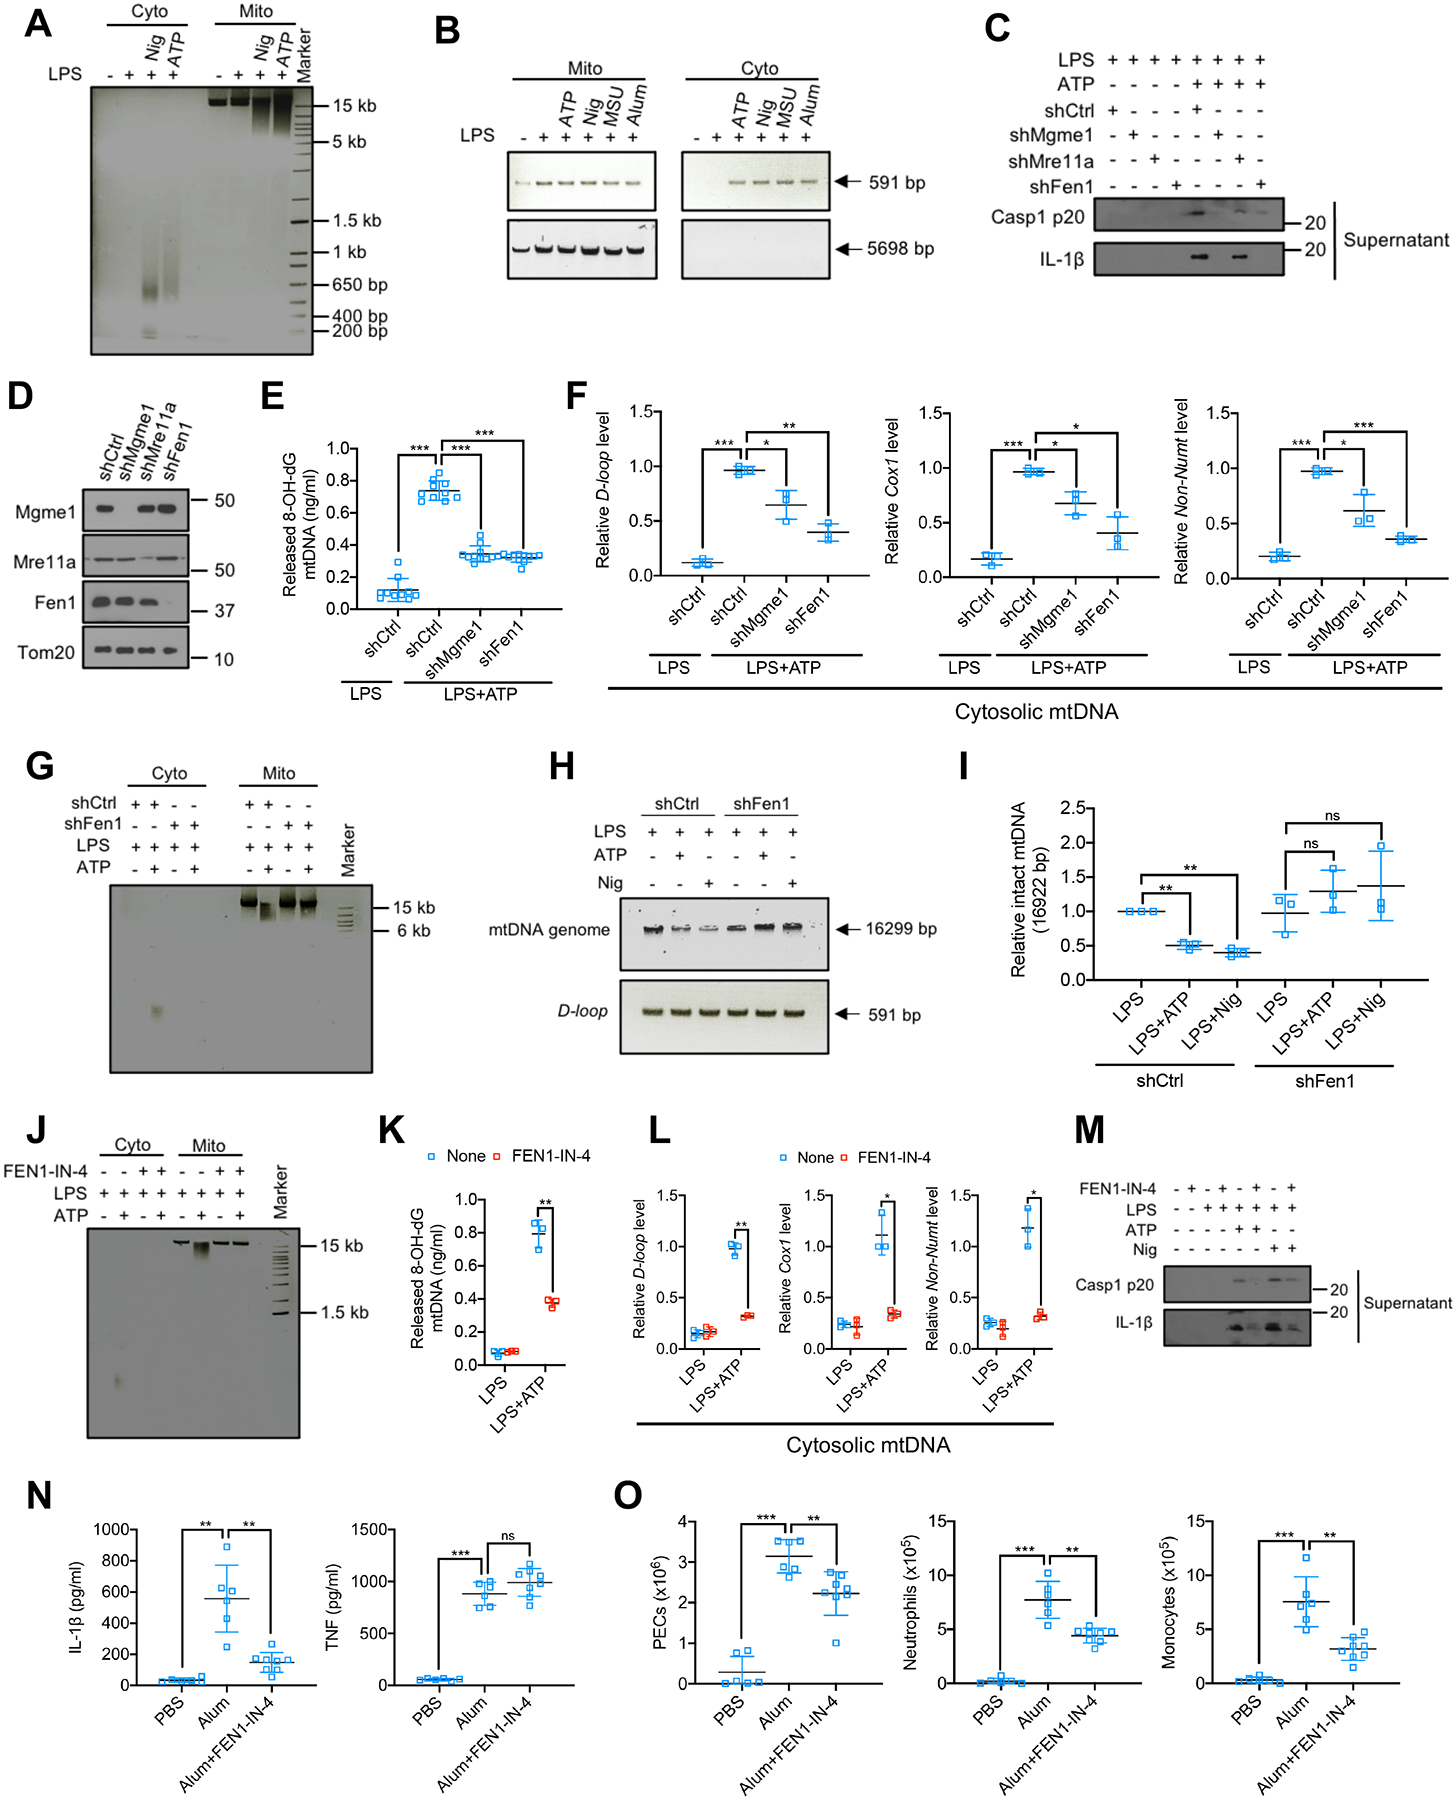
(A) Agarose gel electrophoresis of cytosolic (Cyto) and mitochondrial (Mito) DNA from BMDM −/+ LPS priming (200 ng/mL), −/+ nigericin (Nig) (10 μM) or ATP (4 mM) stimulation for 1 h.
(B) Agarose gel electrophoresis of cytosolic and mitochondrial mtDNA PCR amplification products (591 bp and 5698 bp) form BMDM −/+ LPS priming that were challenged with different NLRP3 activators (n=3).
(C) IB analysis of Casp1 p20 and IL-1β in culture supernatants of LPS (200 ng/mL, 4 h)-primed BMDM that were transduced with shCtrl, shMgme1, shMre11a, or shFen1 and stimulated −/+ ATP (4 mM, 1 h).
(D) IB analysis of MGME1, MRE11A, FEN1 and Tom20 in mitochondria isolated from BMDM transduced with shCtrl, shMgme1, shMre11a, or shFen1.
(E and F) Cytosolic Ox-mtDNA (n=10) (E) or relative mtDNA amount (n=3) (F) in BMDM that were transduced with shCtrl, shMgme1 and shFen1 treated as in (C).
(G) Analysis of Cyto and Mito DNA from LPS-primed shCtrl- or shFen1-transduced BMDM stimulated −/+ ATP as in (C).
(H) mtDNA PCR amplification products (entire genome, 16299 bp, or D-loop region, 591 bp) from LPS-primed BMDM stimulated −/+ ATP or nigericin as in (A).
(I) Relative amounts of whole mtDNA genome in the BMDM analyzed in (H).
(J) Analysis of Cyto or Mito DNA from BMDM that were pretreated with FEN1-IN-4 (10 μM, 16 h), LPS-primed and stimulated −/+ ATP.
(K and L) Amounts of Ox-mtDNA (K) or relative total mtDNA (L) in the cytosol of BMDM treated as in (J) (n=3).
(M) IB analysis of Casp1 p20 and mature IL-1β in culture supernatants of BMDM pretreated −/+ FEN1-IN-4, primed with LPS and challenged with ATP or nigericin.
(N) Peritoneal IL-1β and TNF in mice treated with FEN1-IN-4 (40 mg/kg) 16 h prior to i.p. injections of alum (1 mg) or PBS, whose peritoneal exudates were analyzed 4 h later. Data are mean ± s.d. (n=6 PBS- and alum-injected groups; n=8 in alum+FEN1-IN-4-treated group).
(O) Alum-induced peritoneal exudate cells (PEC), neutrophils (CD11b+Ly6G+F4/80−) and monocytes (CD11b+Ly6C+Ly6G−) in mice pretreated with FEN1-IN-4 at 40 mg/kg 16 h prior to i.p. injections of alum or PBS for 16 h. (n=6 PBS- and alum-treated groups; n=8 alum+FEN1-IN-4-treated group).
The EtBr-stained agarose gels in (A, B, G, H and J) are representative of 3 independent experiments. IBs are one representative out of 3. Results in (E, F, I, K, L, N and O) are mean ± s.d.. *p<0.05; **p<0.01; ***p<0.001. ns, not significant. Two-sided unpaired t-test.
See also Figure S5.
Searching for mitochondrial nucleases accounting for mtDNA cleavage, we found that silencing of mitochondrial genome maintenance exonuclease 1 (Mgme1) or flap structure-specific endonuclease 1 (Fen1), but not meiotic recombination 11 homolog A (Mre11a), all of which participate in mtDNA metabolism (Fontana and Gahlon, 2020), attenuated NLRP3 inflammasome activation (Figures 5C, 5D and S5D). Accordingly, Mgme1 or Fen1 silencing inhibited cytosolic Ox-mtDNA and mtDNA release (Figures 5E and 5F). Whereas silencing of Mgme1, a component of the mitochondrial replisome (Matic et al., 2018), reduced mtDNA amounts in LPS-primed cells, Fen1 silencing did not (Figure S5E). Importantly, Fen1 silencing inhibited mtDNA fragmentation and cytosolic release (Figure 5G), and attenuated mtDNA integrity loss in ATP or nigericin challenged BMDM (Figures 5H and 5I). The FEN1 inhibitor FEN1-IN-4 (Exell et al., 2016), also abrogated mtDNA fragmentation and cytosolic Ox-mtDNA and mtDNA release (Figures 5J–L), resulting in dose-dependent inhibition of Casp1 activation and IL-1β, but not TNF, secretion (Figures 5M and S5F–S5H). FEN1-IN-4 did not affect LPS-stimulated mtDNA synthesis (Figure S5I) and like Fen1 shRNA, had no effect on Ox-mtDNA generation or mtROS production (Figures S5J and S5K). Moreover, FEN1 did not affect mPTP opening (Figure S5L) or VDAC oligomerization (Figures S5M and S5N), suggesting that mtDNA cleavage and pore opening are not coupled. Notably, FEN1-IN-4 inhibited alum-induced NLRP3 inflammasome-dependent IL-1β production in vivo and reduced neutrophil and monocyte infiltration, without an effect on TNF secretion (Figures 5N and 5O).
mt-OGG1 and FEN1-IN-4 restrain extracellular mtDNA release and paracrine inflammation
Ccf mtDNA present in body fluids, including plasma and serum (Duvvuri and Lood, 2019; Lam et al., 2004; Zhang et al., 2010; Zhong et al., 2000), contributes to arthritis, AD, heart failure, nonalcoholic steatohepatitis (NASH), and atherosclerosis (Desler et al., 2018; Oka et al., 2012; Tumurkhuu et al., 2016; Yu et al., 2019; Zhong et al., 2019). BALF of LPS-challenged mice undergoing ARDS contained elevated ccf-mtDNA amounts that were reduced in mt-Ogg1Tg mice (Figure 6A). Cell-free peritoneal exudates isolated 4 hrs after alum challenge also contained more ccf-mtDNA than exudates from PBS-injected mice, and this was reduced in mt-Ogg1Tg mice (Figure 6B). To detect oxidative lesions in ccf-mtDNA, we employed formamidopyrimidine DNA glycosylase (Fpg), a bacterial 8-oxoG glycosylase and also an apurinic and apyrimidinic (AP) lyase, to cleave oxidized purines and remove the AP site, leaving a 1 base gap which blocks PCR amplification (Croteau and Bohr, 1997; Vartanian et al., 2017). Alum-induced ccf-mtDNA contained oxidative lesions and that was reduced by mt-OGG1 (Figure 6C). Importantly, FEN1-IN-4 inhibited ccf-mtDNA and Ox-mtDNA secretion into peritoneal exudates isolated 4 and 16 hrs post-challenge (Figures 6D, 6E, S6A and S6B), demonstrating that FEN1-mediated mtDNA fragmentation is needed for ccf-mtDNA generation.
Figure 6. mt-OGG1 and FEN1-IN-4 restrain cell-free Ox-mtDNA secretion.
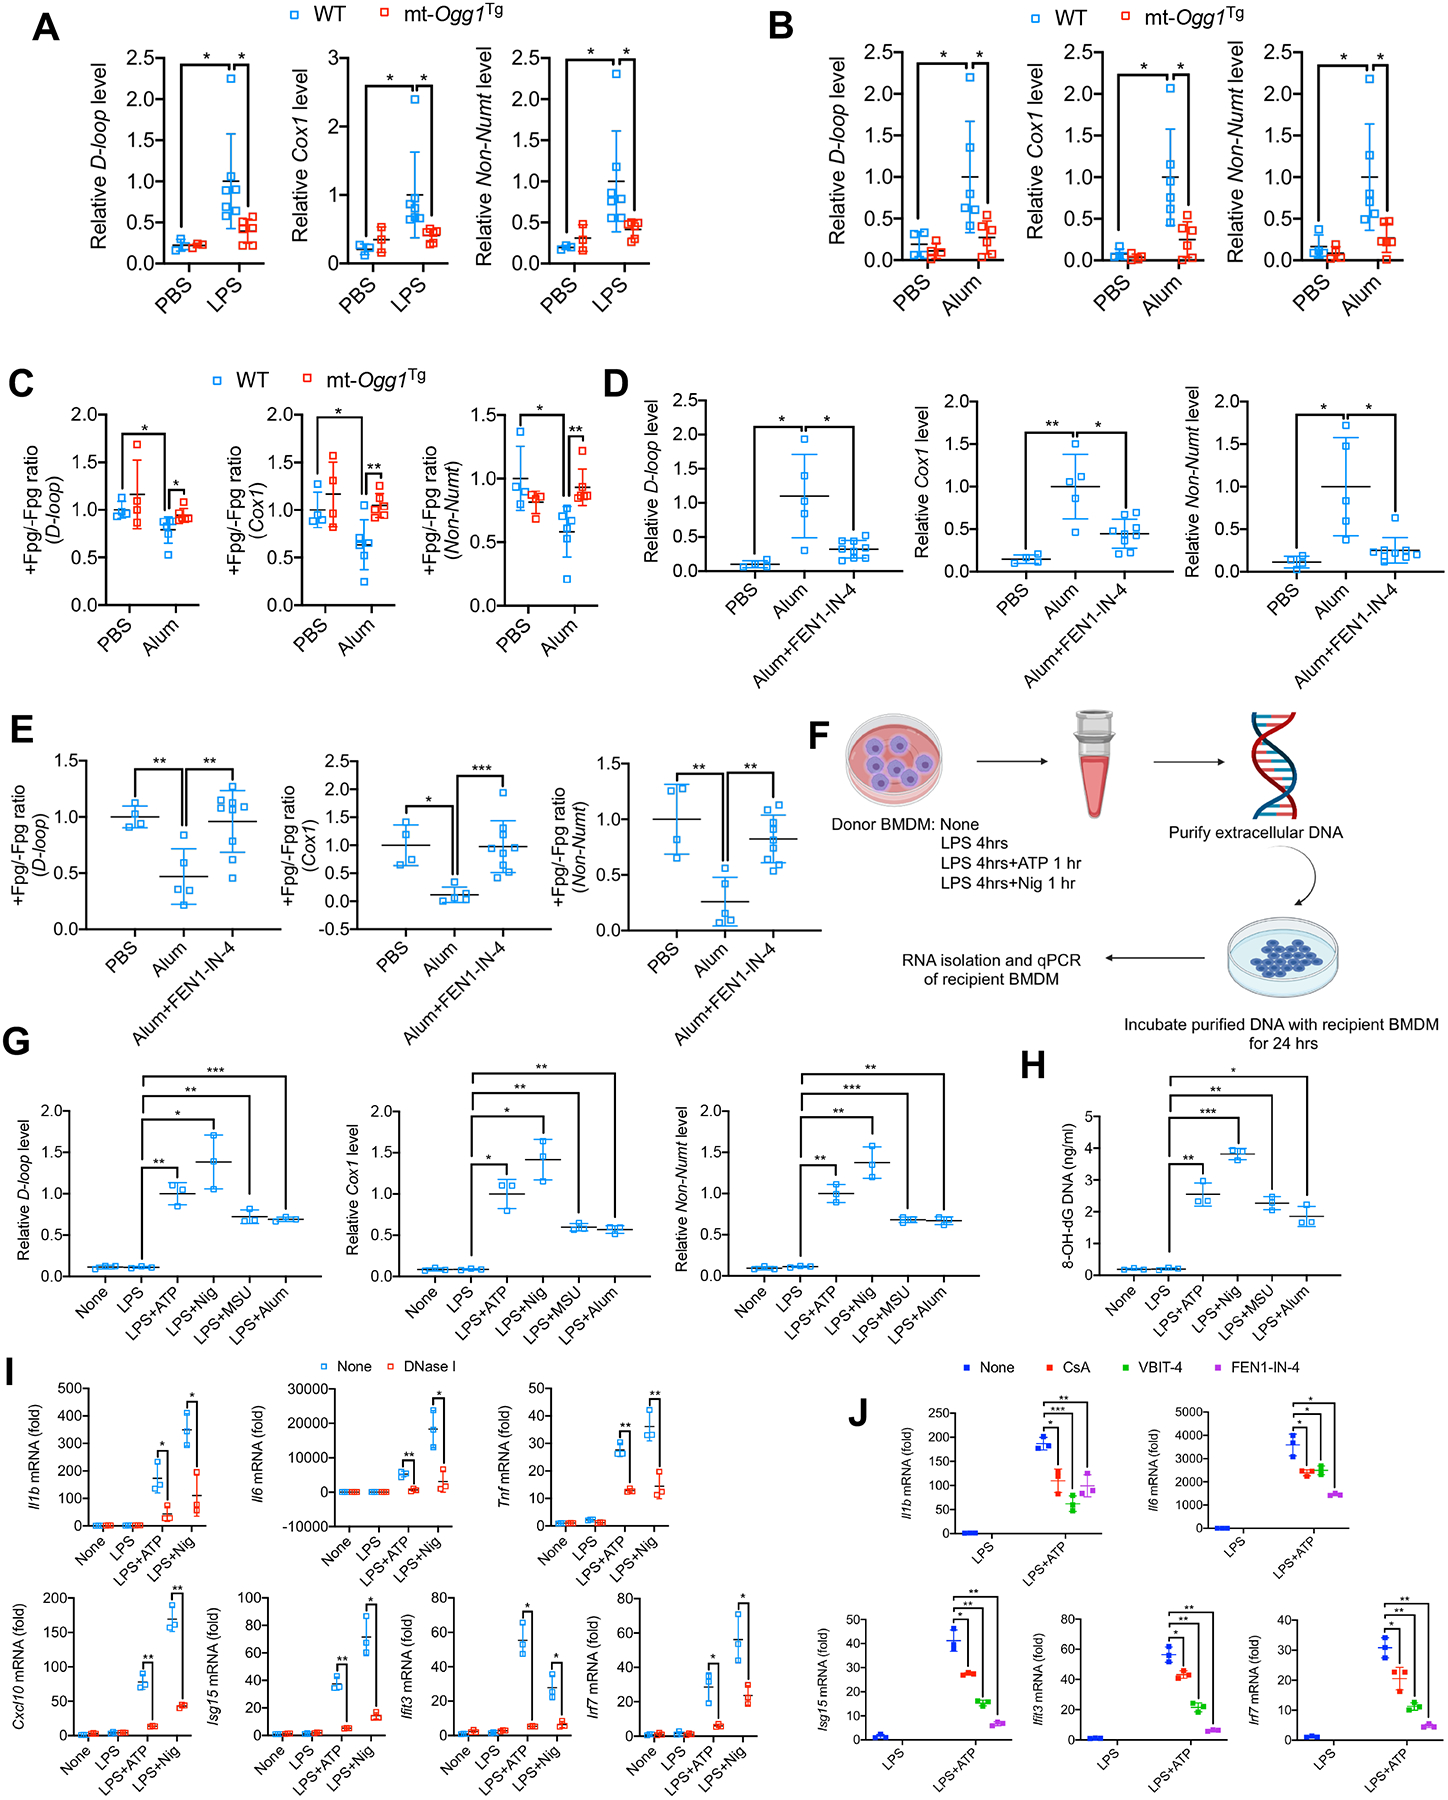
(A) Relative ccf-mtDNA amounts in BALF from Figure 1A (n=3 for PBS-treated groups; n=6–7 for LPS-treated groups).
(B) Relative ccf-mtDNA amounts in peritoneal exudate from Figure S1A (n=4 for PBS-treated groups; n=6 for alum-treated groups).
(C) Relative ratio of Fpg-treated (+) to nontreated (−) ccf-mtDNA from (B), indicating the fraction of cell-free non-Ox-mtDNA (Fpg-resistant) relative to total secreted mtDNA.
(D and E) Relative amounts of ccf-mtDNA (D) and cell-free non-Ox-mtDNA (Fpg-resistant) (E) in peritoneal exudates treated as in Figure 5N. (n=4–5 for PBS- and alum-treated groups; n=9 for alum+FEN1-IN-4-treated group).
(F) Experimental scheme for measuring the signaling activity of secreted ccf-mtDNA.
(G and H) Relative amounts of secreted mtDNA (G) or Ox-mtDNA (H) from LPS-primed BMDM challenged with different NLRP3 activators (n=3).
(I) Q-PCR quantitation of Il1b, Il6, Tnf, Cxcl10, Isg15, Ifit3 and Irf7 mRNAs in recipient BMDM incubated for 24 h with DNA (−/+ DNase I digestion) secreted by LPS-primed donor BMDM challenged with ATP or nigericin (n=3).
(J) Q-PCR quantitation of Il1b, Il6, Isg15, Ifit3 and Irf7 mRNAs in recipient BMDM incubated for 24 h with DNA secreted by donor BMDM treated as in Figure S6H (n=3).
Results are mean ± s.d.. *p<0.05; **p<0.01; ***p<0.001. Two-sided unpaired t-test.
See also Figure S6.
To examine the immunogenic effect of secreted mtDNA, we isolated cell-free Ox-mtDNA released by BMDM challenged with NLRP3 activators (Figures 6F–H). Of note, gasdermin D deficient BMDM (Gsdmd−/−) released much less Ox-mtDNA but generated as much Ox-mtDNA as WT BMDM (Figures S6C–E). When applied to naïve macrophages, cell-free mtDNA induced NF-κB-dependent cytokine mRNAs, Il1b, Il6 and Tnf, and IFN-stimulated genes (ISGs), Cxcl10, Isg15, Ifit3 and Irf7 in a DNase I sensitive manner (Figure 6I). EtBr pretreatment greatly reduced cell-free mtDNA amounts and immunostimulatory activity (Figures S6F and S6G), validating its mitochondrial origin. CsA, VBIT-4 and FEN1-IN-4 also inhibited cell-free mtDNA release (Figure S6H) and immunostimulatory activity (Figure 6J). To understand how extracellular mtDNA enters macrophages, we used Pitstop2, an inhibitor of clathrin-mediated endocytosis (von Kleist et al., 2011) and found it to diminish cytokine mRNA induction by extracellular mtDNA (Figure S6I).
The mitochondrial NLRP3 inflammasome activation pathway leads to STING activation
cGAS or STING ablation also blunted cytokine and ISG mRNA induction by extracellular mtDNA (Figures S7A and S7B). Importantly, cytosolic release of Ox-mtDNA in LPS-primed BMDM stimulated with ATP or nigericin induced rapid formation of Ser365 phosphorylated STING puncta, which are essential for interferon regulatory factor-3 (IRF3) binding and activation (Chen et al., 2016; Liu et al., 2015). That was diminished by mtOGG1 expression and CsA, VBIT-4 and FEN1-IN-4 treatments (Figures 7A, 7B, S7C and S7D). ATP-induced STING Ser365 phosphorylation was also detected by immunoblot analysis and was strictly dependent on mtDNA as it was undetectable in EtBr-treated BMDM (Figures 7C and 7D). Nigericin also led to immunoblot detectable STING Ser365 phosphorylation and the response to it and ATP were abolished in mt-Ogg1Tg BMDM (Figures S7E and S7F). Consistent with a report that inflammasome activation triggers Casp1-mediated cleavage of cGAS and thereby inhibits DNA virus induced cGAS-STING signaling (Wang et al., 2017), we observed that Nlrp3−/− BMDM, in which Casp1 is not activated, exhibited enhanced ATP-induced STING Ser365 phosphorylation, that was completely blocked by CsA, VBIT-4 or FEN1-IN-4 (Figures 7E and 7F), highlighting that Ox-mtDNA cleaved by FEN1 and released via mPTP-VDAC channels, licenses both NLRP3 inflammasome and cGAS-STING activation in cytosol.
Figure 7. Induction of mtDNA release by NLRP3 Inflammasome activators leads to STING Ser365 phosphorylation.
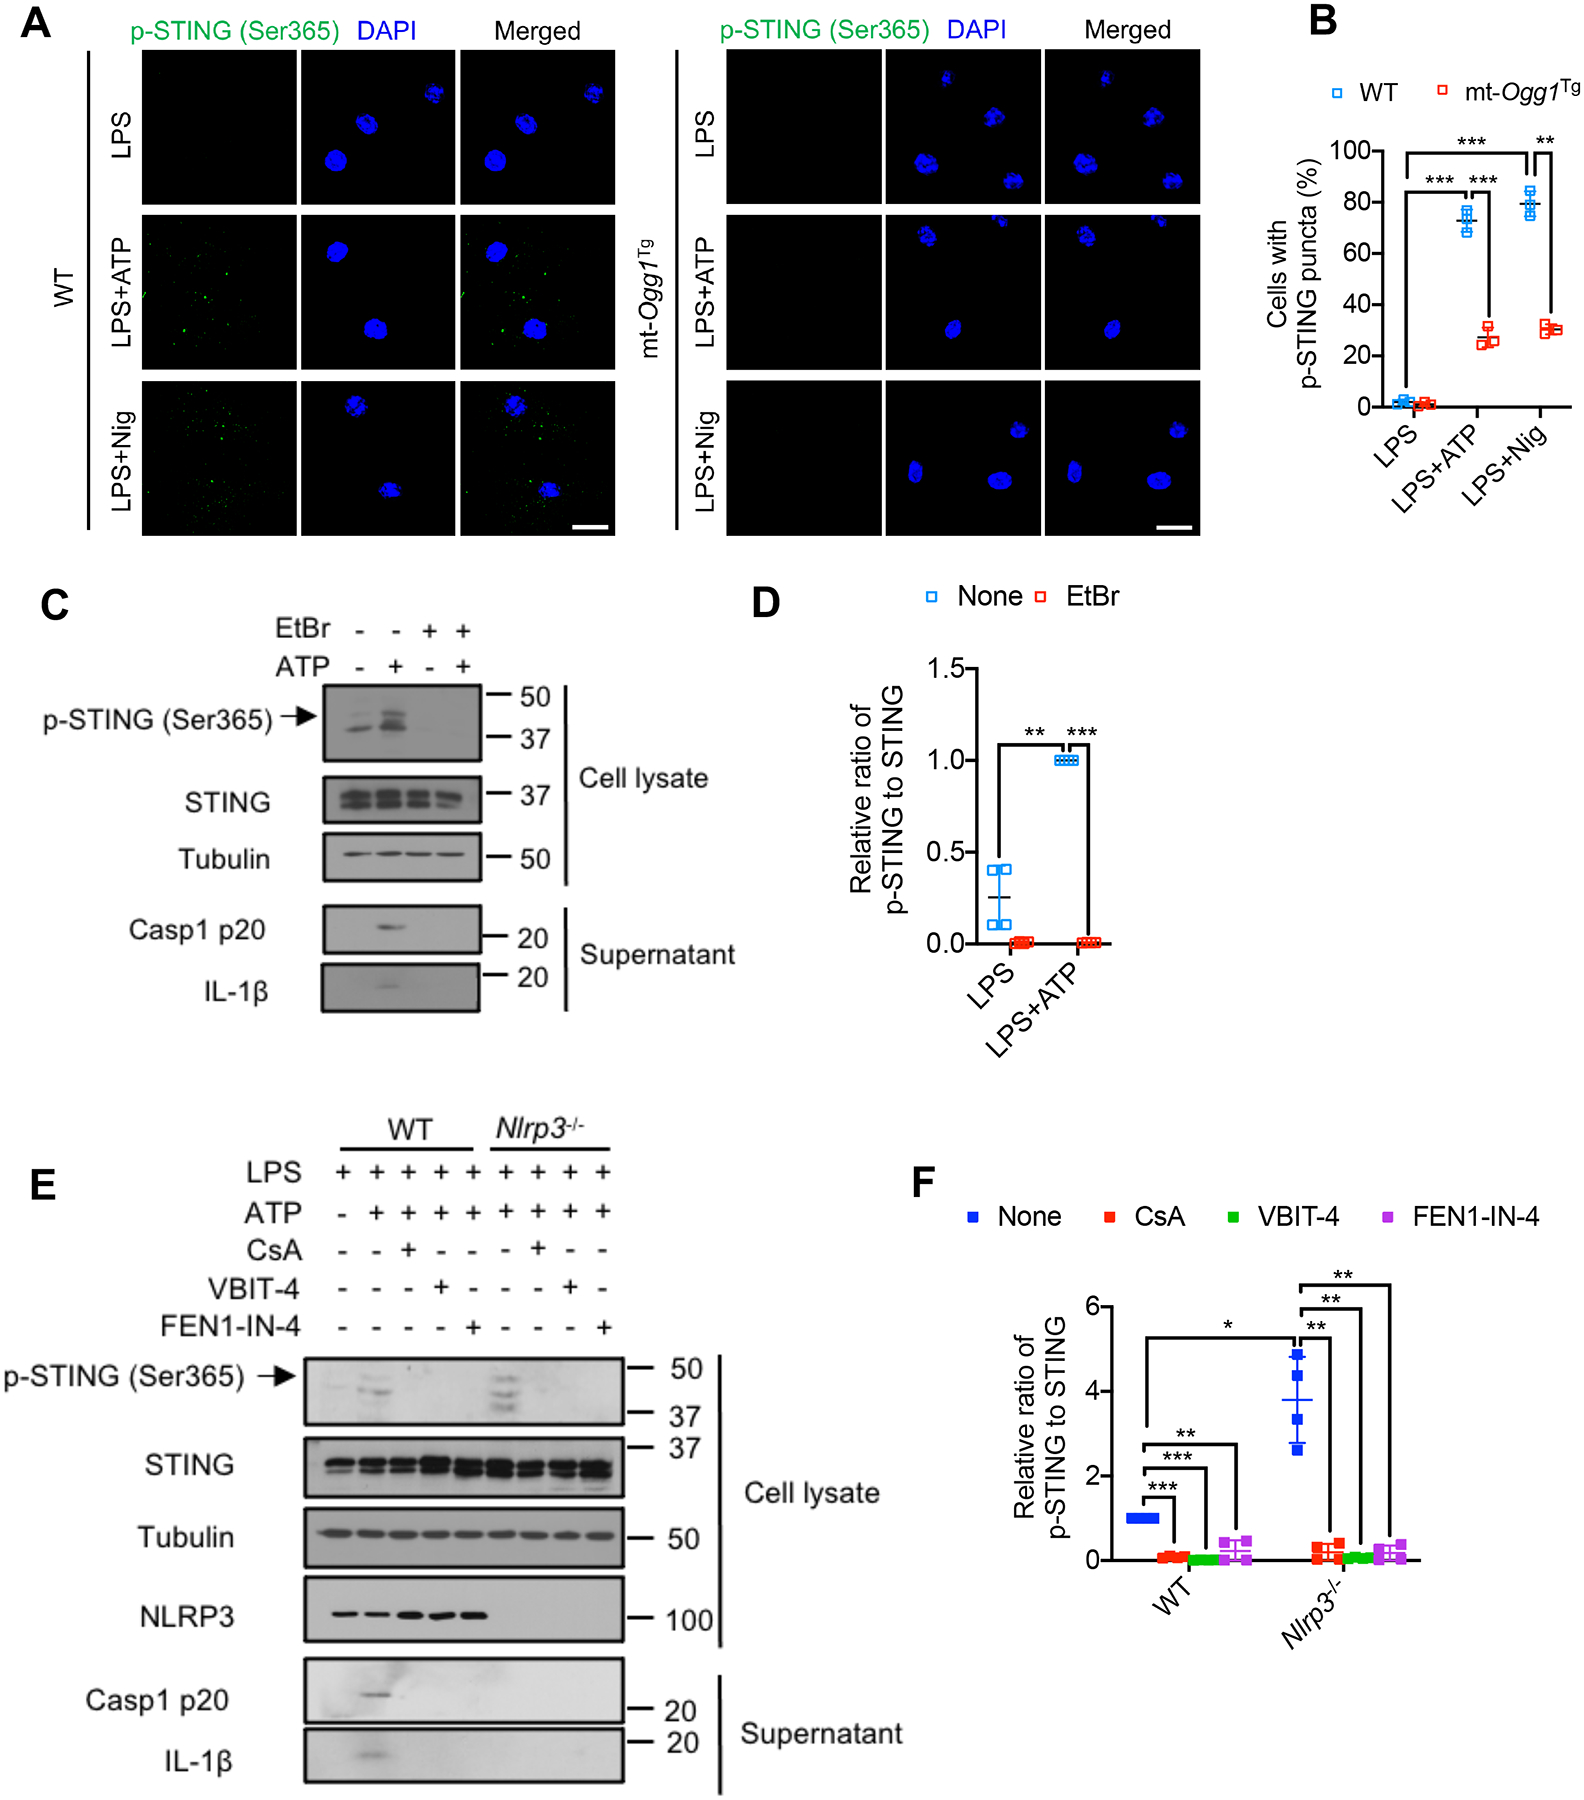
(A) Representative fluorescent microscopy images of LPS (200 ng/mL, 4 h)-primed WT or mt-Ogg1Tg BMDM stained for phospho-STING (Ser365) before or after ATP (4 mM) or nigericin (10 μM) stimulation for 1 h. DAPI stains nuclei. Scale bar, 5 μm.
(B) Percentages of cells from (A) with p-STING (Ser365) puncta. n=150 cells per group from 3 independent experiments.
(C) IB analysis of STING Ser365 phosphorylation in lysates and Casp1 p20 and mature IL-1β in supernatants of BMDM pretreated −/+ EtBr (450 ng/mL, 4 days) to deplete mtDNA, followed by LPS priming and −/+ ATP stimulation as in (A).
(D) Relative p-STING (Ser365) to total STING amounts from cells in (C).
(E) IB analysis of STING Ser365 phosphorylation and NLRP3 in lysates and Casp1 p20 and mature IL-1β in supernatants of LPS-primed WT and Nlrp3−/− BMDM that were pretreated −/+ CsA (1 μM, 16 hrs), VBIT-4 (10 μM, 16 hrs) or FEN1-IN-4 (10 μM, 16 hrs) and stimulated −/+ ATP as in (A).
(F) Relative p-STING (Ser365) to total STING amounts from cells in (E).
IBs are one representative out of 3. Results in (B, D and F) are mean ± s.d.. *p<0.05; **p<0.01; ***p<0.001. Two-sided unpaired t-test.
See also Figure S7.
Discussion
In addition to their key role in cell survival and death, mitochondria have emerged as central regulators of inflammation (Gurung et al., 2015; Riley and Tait, 2020; Wu et al., 2021; Zhong et al., 2019). Mitochondria and NLRP3 inflammasome intersect at multiple facets and in different diseases (Broz and Dixit, 2016; Grailer et al., 2014; Gurung et al., 2015; Lamkanfi and Dixit, 2012; Latz et al., 2013). Our results further establish mitochondria as primary targets for diverse NLRP3 activators, including ATP, a ligand for the purinergic receptor P2X7, nigericin, an antibiotic and an H+-K+ antiporter, and the membrane damaging microcrystals MSU and alum (Elliott and Sutterwala, 2015). Importantly, mitochondria play a key role in “two-step” NLRP3 inflammasome activation, as CMPK2-dependent mtDNA synthesis during “priming” couples with mtROS generation during “activation” to produce Ox-mtDNA, that enters the cytosol to trigger NLRP3 inflammasome activation (Zhong et al., 2018). Cytosolic mtDNA, containing non-oxidized and oxidized bases, also activates the cGAS-STING pathway, which unlike NLRP3, has no preference for oxidized DNA, having evolved to provide protection from all types of foreign DNA (Ablasser and Chen, 2019; Chen et al., 2016; Wu et al., 2021). However, how Ox-mtDNA reaches the cytoplasm to bind NLRP3 and whether NRLP3 activators also activate cGAS-STING signaling was heretofore unknown. In fact, it was reported that stressed mitochondria release their entire DNA content to activate cGAS-STING signaling with no need for extracellular stimuli (Kim et al., 2019; West et al., 2015; West and Shadel, 2017; Wu et al., 2021) and that activated Casp1 cleaves cGAS and dampens cGAS-STING-mediated IFN production (Wang et al., 2017). We now show that Ox-mtDNA generation precedes NLRP3 inflammasome assembly and explain how Ox-mtDNA escapes mitochondria to license NLRP3 inflammasome as well as cGAS-STING activation. Our results demonstrate that mtDNA oxidation has two distinct functions, as it triggers mtDNA fragmentation and generates a specific NLRP3 ligand (Shimada et al., 2012; Zhong et al., 2018). Indeed, the cytosolic pool of mtDNA consists of sub-genomic fragments whose generation was heretofore not understood and the role of mitochondrial BER in regulating the crosstalk between the NLRP3 inflammasome and cGAS-STING pathways was enigmatic. Our studies solve these puzzles and chart a unified pathway through which NLRP3 activators generate Ox-mtDNA, which gets fragmented, released into the cytosol, and induces NLRP3 inflammasome assembly and STING phosphorylation. The earliest molecular event in this pathway is rapid MCU-dependent [Ca2+]m uptake, occurring within 30–60 sec. post-stimulation. [Ca2+]m triggers mPTP opening in the IMM to induce VDAC oligomerization in the OMM. Concurrently, NLRP3 activators trigger mtROS production, which is further enhanced by mitochondrial depolarization due to mPTP and VDAC opening and leads to oxidation of mtDNA, a prerequisite for its fragmentation. Ox-mtDNA generated via this pathway is either repaired by the BER enzyme OGG1, which attenuates NLRP3 inflammasome and cGAS-STING activation, or is cleaved by FEN1 to generate small DNA fragments (<650 bp) that are released to the cytoplasm via mPTP-dependent VDAC channels. These findings are consistent with a previous study showing that inclusion of VDAC1 in liposomes increases mtDNA passage across the lipid membrane and suggesting that the mtDNA region that is preferentially released is the D-loop region (Kim et al., 2019). In the cytoplasm, Ox-mtDNA fragments interact with NLRP3 to trigger inflammasome assembly and Casp1 activation, and also lead to STING phosphorylation at Ser365, which is required for IRF3 binding and activation of the IFN response (Chen et al., 2016; Liu et al., 2015; Tanaka and Chen, 2012). Exactly how FEN1, which removes flap structures and RNA primers generated during DNA replication and repair and collaborates with the degradosome to drive apoptotic DNA fragmentation (Parrish et al., 2003; Zheng et al., 2011), cleaves Ox-mtDNA is not clear. It is plausible that FEN1 acts on unique structures generated by DNA oxidation or during Ox-mtDNA repair, suggesting that release of mtDNA fragments from stressed mitochondria requires oxidation even when no obvious external stimuli are implicated. Interference with any of the critical steps described above attenuates IL-1β and ccf-mtDNA release, as well as STING phosphorylation, providing additional targets for anti-inflammatory drugs that can inhibit all three pathways.
Our results also show that VDAC oligomerization is a signal-responsive event that depends on mPTP opening, which contrary to previous reports (Bernardi et al., 2006; Perez-Trevino et al., 2020), is not affected by mtDNA oxidation per se. Oxidative stress and mtDNA were also suggested to trigger VDAC oligomerization (Kim et al., 2019). However, we find that mtROS do not induce VDAC oligomerization, which is not affected by mtDNA depletion, supporting the notion that poorly-defined mPTP components (Karch and Molkentin, 2014) rather than Ox-mtDNA fragments, trigger VDAC oligomerization. Our work may also explain the origin of ccf-mtDNA in numerous inflammatory conditions including AD, NASH, heart failure, atherosclerosis, diabetes, lupus, and rheumatoid arteritis (Duvvuri and Lood, 2019; Zhong et al., 2019). Both mt-OGG1 expression and FEN1 inhibition substantially suppressed ccf-mtDNA appearance in BALF and Ox-mtDNA in peritoneal exudates. Once in the cytoplasm, Ox-mtDNA is secreted along with IL-1β and IL-18 via Gasdermin D pores and subsequently up-taken by bystander cells via clathrin-mediated endocytosis to activate cGAS-STING. Although active Casp1 cleaves cGAS and blocks the response to viral DNA infection (Wang et al., 2017), the balance between NLRP3 inflammasome activation and cGAS-STING signaling is likely to be cell type dependent and modulated by NLRP3 expression. As demonstrated above, cells that express low NLRP3 amounts undergo more robust cGAS-STING activation, whose final outcome in LPS-primed macrophages is overshadowed by the TLR4 induced IFN response (Liu et al., 2015). Nonetheless, the pathway of Ox-mtDNA fragmentation and cytosolic release described above can result in production of three different classes of systemic inflammatory mediators by suitably activated myeloid cells: IL-1β and IL-18, IFNs and ccf-mtDNA.
Limitations of the study
A primary limitation of our detailed mechanism is the lack of kinetic data to illustrate the order of events including mtDNA oxidation, its repair by OGG1 or cleavage by FEN1 in mitochondria, opening of mPTP- and VDAC-dependent channels, Ox-mtDNA escape via the pores, its binding with NLRP3 or cGAS, consequential activation of inflammasome or cGAS-STING pathway and extracellular release of pro-inflammatory mtDNA. Rigorous validation of the sequential actions by using live imaging at single-cell level with different biomarkers is needed. Moreover, our results are of reliance on macrophages but the extent of mtDNA metabolism control of inflammation in other innate immune cell types such as neutrophils and dendritic cells, and whether the nature of their cell identity shapes their adaptations to PAMPs and DAMPs remain to be explored. Beyond mouse models to elaborate acute inflammatory responses, a concern remains regarding the translatability of our findings to human patients. Pathological diseases propagated by ccf-mtDNA, coupled with systematic inflammation also remain to be investigated.
STAR★Methods
Lead Contact
Further information and requests for resources and reagents should be directed to and will befulfilled by the lead contact, Dr. Michael Karin (karinoffice@ucsd.edu).
Materials availability
Materials generated in this study are available upon request from lead contact, Dr. Michael Karin (karinoffice@ucsd.edu).
Data and code availability
All data supporting the findings of this study are available within the paper and its supplementary materials. This study did not generate any unique datasets or code.
Experimental model and subject details
Animal studies
8-week-old male C57BL/6 mice were purchased from Charles River Laboratories or bred at UCSD. mt-Ogg1Tg mice in the C57BL/6 background (Wang et al., 2011) were kindly provided by Dr. Lyudmila Rachek, University of South Alabama and Dr. Lars Eide, University of Oslo and Oslo University Hospital. Nlrp3−/− mice in the C57BL/6 background were kindly provided by Dr. Hal M. Hoffman (UCSD). All mice were bred and maintained at UCSD and handled in accordance with Institutional Animal Care and Use Committee and NIH guidelines.
LPS-induced ARDS
8–12-week-old male WT and mt-Ogg1Tg mice were allocated randomly and subjected to LPS-induced ARDS as described (Xian et al., 2021). Briefly, 5 mg/kg LPS or vehicle was i.p. injected and the mice were euthanized 24 h later. At the experimental endpoint, the lungs were inflated with cold PBS, excised and fixed in 10% formalin for histological evaluation.
Alum-induced peritonitis
8–12-week-old male C57BL/6 mice and WT or mt-Ogg1Tg mice were allocated randomly and i.p. injected with alum (1 mg dissolved in 0.2 mL sterile PBS) or PBS. Peritoneal lavage was collected 4 h post-injection to measure cytokine amounts by ELISA. Another batch of mice allocated randomly were i.p. injected with alum (300 ug) or PBS and after 16 h mice were euthanized, and peritoneal cavities were washed with 6 mL cold sterile PBS. Neutrophils (CD11b+Ly6G+F4/80−) and monocytes (CD11b+Ly6C+Ly6G−) present in peritoneal lavage fluid were quantified by flow cytometry. For blocking Fc-mediated interactions, mouse cells were pre-incubated with 0.5–1 μg of purified anti-mouse CD16/CD32 per 100 μL. Isolated cells were stained with labelled antibodies in PBS with 2% FCS and 2 mM EDTA or cell staining buffer (Biolegend). Dead cells were excluded based on staining with propidium iodide (PI). Absolute numbers of immune cell subtypes in the peritoneum were calculated by multiplying total peritoneal cell numbers by percentages of immune cell subtypes amongst total cells. Cells were analyzed on a Beckman Coulter Cyan ADP flow cytometer.
To measure ccf-mtDNA content in BALF or peritoneal cavity, the collected BALF or peritoneal lavage was centrifuged for 10 minutes at 1200 rpm to remove cells and cellular debris. DNA were isolated from 400 μL of the supernatant using the QIAmp 96 DNA Blood Kit according to the manufacturer’s instruction for blood and body-fluid protocol. The isolated DNA was then eluted in 300 μL and quantified using spectrophotometric analysis at 260/280 nm with Nanodrop and analyzed by qPCR.
Cell Lines and Primary Culture
Macrophage culture and stimulation
Femurs and tibias from C57BL/6, mt-Ogg1Tg (bred at UCSD) and Ogg1−/− (provided by Dr. Harini Sampath) mice above 8 weeks of age (regardless of gender) were used to generate bone-marrow-derived macrophages (BMDM). Bone marrow cells were cultured in high glucose DMEM supplemented with 10% FBS, 20% L929-cell conditioned medium, and 100 U/mL penicillin-streptomycin for 7–10 days at 37°C with 5% CO2 (Hornung et al., 2008). NLRP3 inflammasome activation was induced after 4 h priming with ultrapure LPS (200 ng/mL) by challenge with the NLRP3 activators ATP (4 mM) or nigericin (10 μM) for 1 h, and monosodium ureate (MSU) crystals (600 μg/mL) or alum (500 μg/mL) for 6 h. XeC (5 μM), RuR (10 μM), CsA (1 μM), VBIT-4 (10 μM), FEN1-IN-4 (10 μM unless otherwise indicated), DMNQ (20 μM) were added 16 h, while MitoParaquat (5 μM) was added 1 h, before LPS or NLRP3 activators challenge. Etoposide was used at 10 μg/mL for 16 h to induce apoptosis in BMDM.
Supernatants and cell lysates were collected for ELISA and immunoblot (IB) analyses.
Method details
shRNA lentiviral knockdown
Gene silencing was performed by lentiviral transduction of primary BMDM as described (Xian et al., 2021). Sequences of specific shRNAs used in this study were obtained from the MISSION shRNA Library (Sigma). Lentiviral particles generated using VSV-G, pLV-CMVΔ8.9 plasmids and specific shRNAs in HEK293T cells were used to knockdown Ogg1, Mgme1, Mre11a, Fen1, Vdac1 or Vdac3. Supernatants were collected 48 h after transfection, filtrated through a 0.45 micron pore filter and added to primary BMDM. To increase infection efficiency, 8 μg/mL of polybrene were added. The virus containing medium was washed after 6 h and the cells were cultured with fresh medium. Infected cells were expanded and selected with puromycin at 72 h post-transduction.
Protein immunoblotting
Whole cell lysates were prepared in RIPA buffer (25 mM Tris-HCl pH 7.6, 150 mM NaCl, 1% NP-40, 1% sodium deoxycholate, 0.1% SDS) containing a protease inhibitor cocktail and a phosphatase inhibitor cocktail. Protein concentrations were determined using BCA Protein Assay Kit. Equal amounts of protein were separated by SDS–PAGE and transferred onto PVDF membranes, blocked in 5% BSA in 1X TBST for 1 h and incubated with primary antibodies overnight. Secondary antibodies were added for 1 h and detection was performed using Clarity Western ECL Substrate.
ELISA (Enzyme-linked immunosorbent assay)
Paired antibodies (capture and detection) and standard recombinant mouse IL-1β and TNF were used to determine mouse cytokine concentrations according to manufacturer’s instructions.
Immunofluorescence and confocal microscopy
BMDM were fixed in 4% paraformaldehyde (PFA), permeabilized in 0.2% Triton X-100, and blocked in 1x PBS supplemented with 3% BSA. Primary antibodies were incubated in blocking buffer at 4°C overnight. Secondary Alexa antibodies were added for 1 h. Nuclei were counterstained with DAPI. Samples were imaged through a Leica SP5 confocal microscope.
[Ca2+]m was measured in BMDM loaded with 5 μM Rhod-2, AM and 10 nM MitoTracker™ Green for 30 minutes at 37°C with 5% CO2. After washing, BMDM were kept in the incubator for additional 30 minutes before confocal imaging (Nikon CSU-X1 Spinning Disk). Dynamic [Ca2+]m images were captured at 10 seconds intervals for 4 minutes, with the addition of NLRP3 agonist at 40 seconds.
Histological evaluation and immunohistochemistry
Lungs were fixed in 10% formalin for 24 h and embedded in paraffin, sectioned and stained with hematoxylin and eosin (H&E) to evaluate gross morphology and lung damage and inflammation, and with Sirius red to determine collagen buildup. Lung sections were incubated with antibodies specific for F4/80 (macrophage marker) and myeloperoxidase (MPO, neutrophil marker). Stained areas were quantified with ImageJ software.
RNA isolation and quantitative real-time PCR (qPCR)
RNA was extracted using AllPrep DNA/RNA Mini kit, and cDNA was synthesized using SuperScript™ VILO™ cDNA Synthesis Kit. mRNA expression was determined by QPCR in a CFX96 thermal cycler (Biorad) as described (Xian et al., 2021). Data are presented in arbitrary units and calculated by the 2ˆ(−ΔΔCT) method. Primer sequences were obtained from the NIH qPrimerDepot (http://mouseprimerdepot.nci.nih.gov) and provided by Integrated DNA technologies.
Mitochondrial function
Mitochondrial membrane potential was measured using TMRM according to manufacturer’s instructions. Briefly, BMDM were primed or not with LPS for 4 h, and further stimulated with ATP or nigericin for 60 minutes. Cells were incubated with 200 nM TMRM for 30 minuntes at 37°C. After washing twice, fluorescence intensity was determined per manufacturer’s instructions using a FilterMax F5 multimode plate reader (Molecular Devices). Mitochondrial reactive oxygen species (mtROS) were measured using MitoSOX (Invitrogen) as described (Xian et al., 2021). BMDM treated as indicated were loaded with 4 μM MitoSOX for 20 minutes. After washing with PBS twice, cells were resuspended in PBS and counted. Equal numbers of cells from different treatment groups were then plated onto 96-well plates for fluorescence reading. To quantify [Ca2+]m by 5 μM Rhod-2 or intracellular Ca2+ intensity by 1 μM Fluo-4, BMDM treated as indicated were loaded with the respective dyes according to manufacturer’s instructions for 30 minutes. After washing twice, fluorescence intensity was determined using a FilterMax F5 multimode plate reader (Molecular Devices). To analyze mPTP opening by calcein-quenching assay, BMDM treated as indicated were loaded with calcein at 2 μM and CoCl2 at 160 μM for 30 minutes at 37°C according to manufacturer’s instructions. After washing twice, fluorescence intensity was determined per with a FilterMax F5 multimode plate reader (Molecular Devices).
Measurement of total mtDNA
Macrophages were primed with LPS for 4 h and total DNA was isolated using AllPrep DNA/RNA Mini Kit according to manufacturer’s instructions. mtDNA was quantified by qPCR using primers specific for the mitochondrial D-loop region, cytochrome c oxidase (Cox1) or a specific region of mtDNA that is not inserted into nuclear DNA (non-NUMT). Nuclear DNA encoding telomerase reverse transcriptase (Tert), 18S ribosomal RNA and β2 microglobulin (B2m) was used for normalization.
Cellular fractionation and measurement of cytosolic mtDNA
BMDM were stimulated as indicated. Cellular fractionation was carried out as previously described (Xian and Liou, 2019; Xian et al., 2019). Briefly, BMDM were washed with PBS and harvested, 10% of which were saved for DNA extraction of whole cells. The remaining BMDM resuspended with pre-chilled mitochondrial extraction buffer 1 (220 mM mannitol, 70 mM sucrose, 20 mM HEPES-KOH, pH 7.5, 1 mM EDTA and 2 mg/mL bovine serum albumin) supplemented with a protease inhibitor cocktail and a phosphatase inhibitor cocktail were passed through a 25-G syringe (BD Biosciences) 20 times on ice. The homogenized cells were centrifuged at 1000 × g for 15 minuntes at 4 °C. The supernatant was further centrifuged at 10,000 × g for 10 minutes at 4 °C to pellet the mitochondria from supernatant cytosolic fraction. qPCR was performed after DNA purification with AllPrep DNA/RNA Mini Kit according to manufacturer’s instructions, from both whole cell extracts and cytosolic fractions using mtDNA primers (D-loop, Cox1, non-NUMT), or after DNA purification from whole cell extracts using nuclear DNA primers (Tert, 18S, B2m). The Ct values obtained for mtDNA abundance in whole cell extracts served as normalization controls for the mtDNA values obtained from the cytosolic fractions. For the measurement of Ox-mtDNA, purified mtDNA was extracted from the cytosolic or mitochondrial fractions as indicated. The 8-OH-dG content was then quantified using 8-hydroxy 2-deoxyguanosine ELISA Kit, per manufacturer’s instructions.
Preparation of extracellular mtDNA and stimulation of naïve macrophages by cell-free mtDNA
Extracellular DNA of donor macrophages (1500,000 cells per group) was isolated using QIAamp Circulating Nucleic Acid Kit according to manufacturer’s instructions and then eluted in 300 μL distilled H2O and quantified using spectrophotometric analysis at 260/280 nm with Nanodrop. DNA amounts purified among the different treatment groups vary. The DNA amount secreted from LPS-primed donor BMDM is low, approximately at 0.1 μg. The amount of DNA released by LPS-primed donor BMDM challenged with ATP is about 1.3 μg, while the amount of DNA released by LPS-primed donor BMDM challenged with nigericin is around 2 μg. The amount of DNA secreted by LPS-primed donor BMDM challenged with MSU or alum is about 0.7 μg. We used 5% of the prepared DNA for qPCR measurement of extracellular mtDNA and the remaining 95% were added to the recipient BMDM for analyzing the paracrine immunostimulatory effects.
PCR
DNA was isolated using AllPrep DNA/RNA Mini Kit according to manufacturer’s instructions and amplified using Phusion Green Hot Start II High-Fidelity PCR Master Mix, containing 100 nM of each primer.
16299 bp PCR was carried out using 200 ng DNA extracted from mitochondria as the template. 5698 bp PCR was carried out using 5 ng DNA extracted from mitochondria or 50–200 ng DNA extracted from cytoplasm as the template. D-loop 591 bp PCR was performed using 5 ng DNA as the template. The following PCR conditions were used. Hot start at 98 °C for 3 minutes, melting temperature of 98 °C for 10 seconds, annealing temperature of 60 °C (for 5698 bp and 591 bp) or 53 °C (for 16299 bp) for 30 seconds and extension temperature of 72 °C for 30 seconds (591 bp), 3 minutes (5698 bp) or 8 mintues 30 seconds (16299 bp), with 20 (591 bp), 35 (5698 bp) or 40 (16299 bp) cycles, followed by 72 °C for 20 minutes and kept at 4°. Amplified products were analyzed on 0.8%–1.2% agarose gels stained with ethidium bromide.
To analyze DNA fragmentation and extrusion in mitochondrial and cytosolic fractions, BMDM (15000,000 cells per group) were stimulated as indicated and fractionalized as above. To extract the nuclear fractions, BMDM lysed in 400 μL buffer 2 (50 mM HEPES, 150 mM NaCl, and 100 μg/mL digitonin) were rotated at 4 °C for 10 minutes. Cell homogenates were centrifuged at 4000 × g for 2 minutes at 4 °C and pellets were washed twice with cold PBS and obtained as nuclear fraction. Cytosolic, mitochondrial or nuclear DNAs were purified using AllPrep DNA/RNA Mini Kit according to manufacturer’s instructions and analyzed on 1% agarose gels stained with ethidium bromide.
To determine mtDNA oxidative damage using Fpg-sensitive qPCR analysis (Fpg removes oxidized purines from DNA and creates single-strand breaks, therefore blocks PCR amplification at these sites. Differences in qPCR cycles between Fpg-treated and untreated DNA are thereby a specific indicator of the presence of oxidative base damage), one aliquot of purified ccf-DNA (250 ng) was incubated with 8 units of Fpg in 1 × NEBuffer 1 and 100 μg/mL BSA in a volume of 50 μL at 37 °C for 1 h. Fpg was then inactivated by heating at 60 °C for 5 minutes. 10 ng DNA was subsequently used for the qPCR assay to detect Fpg-sensitive cleavage sites. Data are presented as the ratio of Fpg-insensitive DNA, calculated as the quotient of signal intensities in Fpg-treated relative to untreated DNA (Pastukh et al., 2016).
VDAC cross-linking assay
BMDM treated as indicated were washed and collected in PBS, incubated for 40 min at 30°C with the cross-linking reagent EGS (200 μM). Samples were subjected to SDS-PAGE and IB analyzed with anti-VDAC antibody.
Quantification and statistical analysis
Data are shown as mean ± s.d.. Statistical significance was determined using two-tailed unpaired Student’s t test. P values lower than 0.05 were considered statistically significant.
Supplementary Material
Key resources table
| REAGENT or RESOURCE | SOURCE | IDENTIFIER |
|---|---|---|
| Antibodies | ||
| IL-1β | Cell Signaling | Cat#12426; N/A |
| ASC | Cell Signaling | Cat#67824; N/A |
| VDAC | Cell Signaling | Cat#4161; RRID:AB_10557420 |
| Tom20 | Cell Signaling | Cat#42406; RRID:AB_2687663 |
| COX1/MT-CO1 | Cell Signaling | Cat#62101; N/A |
| Phospho-STING (Ser365) | Cell Signaling | Cat#62912; RRID:AB_2799635 |
| cGAS | Cell Signaling | Cat#31659; RRID: AB_2799008 |
| Cleaved Caspase-9 (Asp353) | Cell Signaling | Cat#9509; RRID: AB_2073476 |
| Cleaved Caspase-3 (Asp175) | Cell Signaling | Cat#9661; RRID: AB_2341188 |
| Cytochrome c (6H2.B4) | Cell Signaling | Cat#12963; RRID: AB_2637072 |
| Brilliant violet 510™ anti-mouse CD45 | BioLegend | Cat#103137; RRID:AB_2561392 |
| Anti-rabbit IgG, HRP-linked Antibody | Cell Signaling | Cat#7074; RRID:AB_2099233 |
| Anti-mouse IgG, HRP-linked Antibody | Cell Signaling | Cat#7076; RRID:AB_330924 |
| MGME1 | Proteintech | Cat#23178-1-AP; RRID:AB_2879223 |
| OGG1 | Santa Cruz Biotechnology | Cat#376935; N/A |
| FEN1 | Santa Cruz Biotechnology | Cat#28355; RRID:AB_627587 |
| MRE11A | Santa Cruz Biotechnology | Cat#135992; RRID:AB_2145244 |
| TIM23 | Santa Cruz Biotechnology | Cat#514463; N/A |
| Tubulin | Sigma-Aldrich | Cat#T9026; N/A |
| Caspase-1 | Adipogen | Cat#AG-20B-0042-C100; N/A |
| ASC | Adipogen | Cat#AG-25b-0006-C100; N/A |
| NLRP3 | Adipogen | Cat#AG-20B-0014-C100; N/A |
| F4/80 | Invitrogen | Cat#MF48000; RRID:AB_1500089 |
| Myeloperoxidase | Abcam | Cat#ab9535; RRID:AB_307322 |
| Anti-ATP Synthase, beta chain, clone 4.3E8.D1 antibody | Millipore | Cat#MAB3494; RRID:AB_177597 |
| Mouse IL-1 beta /IL-1F2 Antibody | R&D Systems | Ca#MAB401; RRID:AB_2124620 |
| Mouse IL-1beta /IL-1F2 Biotinylated Antibody | R&D Systems | Ca#BAF401; RRID: AB_356450 |
| Anti-Mouse/Rat TNF alpha antibody | eBioscience | Cat#14-7423; RRID:AB_468492 |
| Anti-Mouse/Rat TNF alpha Biotin antibody | eBioscience | Cat#13-7341; RRID:AB_466951 |
| FITC anti-mouse CD11b | eBioscience | Cat#11-0112-82; RRID:AB_464935 |
| PE-Cy7 anti-mouse Gr-1 | eBioscience | Cat#25-5931-82; RRID:AB_469663 |
| eFluor 450 anti-mouse Ly-6C | eBioscience | Cat#48-5932-80; RRID:AB_10805518 |
| PE anti-mouse F4/80 | eBioscience | Cat#12-4801-82; RRID:AB_465923 |
| CD16/CD32 | eBioscience | Cat#14-0161-86; RRID:AB_467135 |
| Donkey anti-rabbit IgG (H+L) secondary antibody, Alexa Fluor 488 | Invitrogen | Cat#A-21206; RRID:AB_2535792 |
| Donkey anti-rabbit IgG (H+L) secondary antibody, Alexa Fluor 594 | Invitrogen | Cat#A-21207; RRID:AB_141637 |
| Donkey anti-mouse IgG (H+L) secondary antibody, Alexa Fluor 488 | Invitrogen | Cat#A-21202; RRID:AB_141607 |
| Donkey anti-mouse IgG (H+L) secondary antibody, Alexa Fluor 594 | Invitrogen | Cat#A-21203; RRID:AB_141633 |
| Donkey anti-rat IgG (H+L) secondary antibody, Alexa Fluor 594 | Invitrogen | Cat#A-21209; RRID:AB_2535795 |
| Chemicals, Peptides, and Recombinant Proteins | ||
| Recombinant Mouse IL-1β | R&D Systems | Cat#401-ML |
| Recombinant Mouse TNFα | eBioscience | Cat#14-8321 |
| Ultrapure LPS, E. coli 0111:B4 | Invivogen | Cat#tlrl-3pelps |
| Lipopolysaccharides from Escherichia coli O26:B6 | Sigma-Aldrich | Cat#L2654 |
| Adenosine 5′-triphosphate disodium salt solution | Sigma-Aldrich | Cat#A6559 |
| Cyclosporine A (CsA) | Sigma-Aldrich | Cat#C3662 |
| Phosphatase Inhibitor Cocktail 2 | Sigma-Aldrich | Cat#P5726 |
| Triton X-100 | Sigma-Aldrich | Cat#T8787 |
| Dimethyl Sulfoxide (DMSO) | Sigma-Aldrich | Cat#D2650-100 |
| Polybrene | Sigma-Aldrich | Cat#TR-1003 |
| Direct Red 80 | Sigma-Aldrich | Cat#365548 |
| Picric acid solution | Sigma-Aldrich | Cat#5860-16 |
| Ethidium bromide | Sigma-Aldrich | Cat#E7637 |
| FluorSave™ | Millipore | Cat#345789 |
| Ruthenium red (RuR) | EMD Millipore | Cat#557450 |
| FEN1-IN-4 | Selleckchem | Cat#S3397 |
| MitoParaquat | Selleckchem | Cat#S8978 |
| DMNQ | Selleckchem | Cat#S6563 |
| Xestospongin C (XeC) | Cayman | Cat#64950. |
| VBIT-4 | MedChemExpress | Cat#HY-129122 |
| Etoposide | MedChemExpress | Cat#HY-13629 |
| Pitstop2 | MedChemExpress | Cat#HY-115604 |
| Staurosporine | MedChemExpress | Cat#HY-15141 |
| Camptothecin | MedChemExpress | Cat# HY-16560 |
| Nigericin | Invivogen | Cat#tlrl-nig |
| Monosodium urate (MSU) | Enzo Life Science | Cat#ALX-400-047-M002 |
| Imject™ Alum Adjuvant | Thermo Scientific | Cat#77161 |
| Ethylene glycol bis (succinimidyl succinate) (EGS) | Thermo Scientific | Cat#21565 |
| Phusion Green Hot Start II High-Fidelity PCR Master Mix | Thermo Scientific | Cat#F566S |
| DNase I | Thermo Scientific™ | EN0521 |
| DAPI (4’6-Diamidino-2-Phenylindole, Dihydrochloride) | Invitrogen | Cat#D1306 |
| Tetramethylrhodamine, Methyl Ester, Perchlorate (TMRM) | Invitrogen | Cat#T668 |
| MitoSOX™ Red mitochondrial superoxide indicator | Invitrogen | Cat#M36008 |
| Rhod-2, AM | Invitrogen | Cat#R1244 |
| Fluo-4, AM | Invitrogen | Cat#F14201 |
| MitoTracker™ Green FM | Invitrogen | Cat#M7514. |
| Complete™, Mini Protease Inhibitor Cocktail | Roche | Cat#11836153001 |
| EDTA | Versene solution | Cat#9314 |
| Clarity Western ECL Substrate | Biorad | Cat#1705061 |
| Bovine Serum Albumin | Gemini | Cat#700-100 |
| Protein Assay Dye reagent concentrate | Biorad | Cat#5000006 |
| Hematoxyline 560 | Leica | Cat#3801570 |
| Alcoholic Eosine Y 515 | Leica | Cat#3801615 |
| Picric acid solution | Ricca | Cat#5860-16 |
| Fpg enzyme | New England BioLabs Inc. | Cat#M0240S |
| Critical Commercial Assays | ||
| MitoProbe™ Transition Pore Assay Kit | Invitrogen | Cat#M34153. |
| AllPrep DNA/RNA Mini kit | Qiagen | Cat#80204 |
| QIAamp DNA Blood Mini Kit | Qiagen | Cat#51106 |
| RNeasy Plus Mini kit | Qiagen | Cat#74134 |
| QIAamp Circulating Nucleic Acid Kit | Qiagen | Cat#55114 |
| SuperScript™ VILO™ cDNA Synthesis Kit | Invitrogen | Cat#11754050 |
| SsoAdvancedTM Universal SYBR Green Supermix | Biorad | Cat#172-5274 |
| Power SYBR® Green RNA-to-Ct™ 1-Step Kit | Applied Biosystems | Cat#4391178 |
| Lipofectamine™ 3000 Transfection Reagent | Invitrogen | Cat#L3000001 |
| LDH-Glo™ Cytotoxicity Assay | Promega | Cat#J2380 |
| 8-hydroxy 2 deoxyguanosine ELISA Kit | Abcam | Cat#ab201734 |
| Experimental Models: Cell Lines | ||
| HEK293T | ATCC | ATCC® CRL-3216™; RRID:CVCL_0063 |
| L929 | ATCC | ATCC® CCL-1 ™; RRID:CVCL_0462 |
| Experimental Models: Organisms/Strains | ||
| Mouse: C57BL/6N (in vitro) | In house breeding | N/A |
| Mouse: C57BL/6N (in vivo) | Charles River Laboratories | N/A |
| Mouse: mt-Ogg1Tg | In house breeding | N/A |
| Mouse: Nlrp3−/− | In house breeding | N/A |
| Mouse: Gsdmd−/− | Dr. Hal M. Hoffman | N/A |
| Mouse: cGAS−/− | Dr. Wei Ying | N/A |
| Mouse: Sting−/− | Dr. Dennis Carson | N/A |
| Mouse: Ogg1−/− | Dr. Harini Sampath | N/A |
| Oligonucleotides | ||
| Primers for mouse D-loop Forward: AATCTACCATCCTCCGTGAAACC Reverse: TCAGTTTAGCTACCCCCAAGTTTAA |
Integrated DNA Technologies | N/A |
| Primers for mouse 18S Forward: TAGAGGGACAAGTGGCGTTC Reverse: CGCTGAGCCAGTCAGTGT |
Integrated DNA Technologies | N/A |
| Primers for mouse Tert Forward: CTAGCTCATGTGTCAAGACCCTCTT Reverse: GCCAGCACGTTTCTCTCGTT |
Integrated DNA Technologies | N/A |
| Primers for mouse Cox1 Forward: GCCCCAGATATAGCATTCCC Reverse: GTTCATCCTGTTCCTGCTCC |
Integrated DNA Technologies | N/A |
| Primers for mouse Non-Numt Forward: CTAGAAACCCCGAAACCAAA Reverse: CCAGCTATCACCAAGCTCGT |
Integrated DNA Technologies | N/A |
| Primers for mouse B2m Forward: ATGGGAAGCCGAACATACTG Reverse: CAGTCTCAGTGGG GGTGAAT |
Integrated DNA Technologies | N/A |
| Primers for mouse Hprt1 Forward: CTGGTGAAAAGGACCTCTCG Reverse: TGAAGTACTCATTATAGTCAAGGGCA |
Integrated DNA Technologies | N/A |
| Primers for mouse Il1b Forward: AGTTGACGGACCCCAAAAG Reverse: AGCTGGATGCTCTCATCAGG |
Integrated DNA Technologies | N/A |
| Primers for mouse Il6 Forward: CCAGGTAGCTATGGTACTCCA Reverse: GCTACCAAACTGGCTATAATC |
Integrated DNA Technologies | N/A |
| Primers for mouse Tnf Forward: CCCTCACACTCAGATCATCTT Reverse: GCTACGACGTGGGCTACAG |
Integrated DNA Technologies | N/A |
| Primers for mouse Cxcl10 Forward: ATCATCCCTGCGAGCCTATCCT Reverse: GACCTTTTTTGGCTAAACGCTTTC |
Integrated DNA Technologies | N/A |
| Primers for mouse Isg15 Forward: CATCCTGGTGAGGAACGAAAGG Reverse: CTCAGCCAGAACTGGTCTTCGT |
Integrated DNA Technologies | N/A |
| Primers for mouse Ifit3 Forward: GCTCAGGCTTACGTTGACAAGG Reverse: CTTTAGGCGTGTCCATCCTTCC |
Integrated DNA Technologies | N/A |
| Primers for mouse Irf7 Forward: CCTCTGCTTTCTAGTGATGCCG Reverse: CGTAAACACGGTCTTGCTCCTG |
Integrated DNA Technologies | N/A |
| Primers for mouse D-loop 591 bp Forward: GTGTTATCTGACATACACCATACAG Reverse: TGGGAACTACTAGAATTGATCAGGA |
Integrated DNA Technologies | N/A |
| Primers for mouse mt-DNA 5698 bp Forward: ATGATTTATCTCAACCCTAGCAG Reverse: GTAGTGGGACTTCTAGAGGGTTAAGT |
Integrated DNA Technologies | N/A |
| Primers for mouse mt-DNA 16299 bp Forward: ACTGAAAATGCTTAGATGGATAATTGTA Reverse: GTATGATTAGAGTTTTGGTTCACGGAACA |
Integrated DNA Technologies | N/A |
| Recombinant DNA | ||
| VSV-G | (Zhong et al., 2016c) | N/A |
| pLV-CMVΔ8.9 | (Zhong et al., 2016c) | N/A |
| shOgg1 #1: 5’-CCGGCAAGTCAGAAAGACTTAACATCTCGAGATGTTAAGTCTTTCTGACTTGTTTTTG - 3’ | Sigma shRNA Mission librarySigma shRNA Mission library | N/AN/A |
| shOgg1 #2: 5’-CCGGGATGTCCATGTATGGCAGATTCTCGAGAATCTGCCATACATGGACATCTTTTTG - 3’ | Sigma shRNA Mission library | N/A |
| shMgme1: 5’-CCGGGCCCAGTCTTTGAATTGAGATCTCGAGATCTCAATTCAAAGACTGGGCTTTTTTG - 3’ | Sigma shRNA Mission library | N/A |
| shMre11a: 5’- CCGGCGCCATATTGATGCTCTGGAACTCG AGTTCCAGAGCATCAATATGGCGTTTTTG - 3’ |
Sigma shRNA Mission library | N/A |
| shFen1: 5’-CCGGGAATGACATCAAGAGCTACTTCTCGAGAAGTAGCTCTTGATGTCATTCTTTTTG - 3’ | Sigma shRNA Mission library | N/A |
| shVdac1: 5’-CCGGGAGTTGATAAATACCACGTTACTCGAGTAACGTGGTATTTATCAACTCTTTTTG - 3’ | Sigma shRNA Mission library | N/A |
| shVdac3: 5’-CCGGTGACTCTTGATACCATATTTGCTCGAGCAAATATGGTATCAAGAGTCATTTTTG - 3’ | Sigma shRNA Mission library | N/A |
| Software and Algorithms | ||
| Prism 8.0 | GraphPad Software | N/A |
| Image J | Image J | N/A |
| Other | ||
| DMEM | Gibco | Cat#11995-065 |
| Fetal Bovine Serum (FBS) | Gibco | Cat#10437-028 (lot. 1913181) |
| Penicillin-streptomycin | Gibco | Cat#15140-122 |
Highlights.
Ca2+ uptake via MCU triggers IMM mPTP opening to induce OMM VDAC oligomerization
Ox-mtDNA is repaired by OGG1 or cleaved by FEN1 to fragments that exit mitochondria
Cytosolic Ox-mtDNA activates NLRP3 inflammasome, cGAS-STING and escapes cells
mtOGG1 and FEN1 inhibitor suppress acute peritonitis and reduce circulating mtDNA
Acknowledgements
We thank eBioscience, Cell Signaling Technologies, Santa Cruz Technologies, Thermo Fisher, Promega and MedChemExpress for gifts of reagents, and the UCSD TTSR supported by an NCI Cancer Center Support Grant (CCSG P30CA23100). We are grateful to Dr. Lyudmila Rachek, University of South Alabama and Dr. Lars Eide, University of Oslo and Oslo University Hospital for the mt-Ogg1Tg and Ogg1−/− mice and Dr. Dennis Carson and Dr. Tomoko Hayashi, UCSD for the Sting−/− mouse bones. We thank the UCSD Nikon Imaging Center and especially Dr. Eric Griffis for assistance with [Ca2+]m imaging. The graphic images were prepared from BioRender.com. E.S.-L. was supported by NIAMS (K01AR077111) and the resource-based center for the study of the joint microenvironment in rheumatology UCSD (P30AR073761). Research was supported by NIH grants R37 AI043477 and U54 CA260591 to M.K., who is an American Cancer Research Society Professor and holds the Ben and Wanda Hildyard Chair for Mitochondrial and Metabolic Diseases, NIH DK100640 to H.S. and NIH R01 grant AR069876 to G.S.S., who holds the Audrey Geisel Chair in Biomedical Science.
Declaration of interests
M.K. is a founder of Elgia Pharmaceuticals and member of its SAB and received research support from Gossamer Bio, Jansen Pharmaceuticals and Merck. UCSD is in the process of applying for a patent covering the generation and use of novel anti-inflammatory therapy for ARDS listing H.X., E.S.-L., and M.K. as inventors. All other authors declare no competing interests.
Footnotes
Publisher's Disclaimer: This is a PDF file of an unedited manuscript that has been accepted for publication. As a service to our customers we are providing this early version of the manuscript. The manuscript will undergo copyediting, typesetting, and review of the resulting proof before it is published in its final form. Please note that during the production process errors may be discovered which could affect the content, and all legal disclaimers that apply to the journal pertain.
References
- Ablasser A, and Chen ZJ (2019). cGAS in action: Expanding roles in immunity and inflammation. Science 363. [DOI] [PubMed] [Google Scholar]
- Andreeva L, David L, Rawson S, Shen C, Pasricha T, Pelegrin P, and Wu H (2021). NLRP3 cages revealed by full-length mouse NLRP3 structure control pathway activation. Cell 184, 6299–6312 e6222. [DOI] [PMC free article] [PubMed] [Google Scholar]
- Barber GN (2015). STING: infection, inflammation and cancer. Nat Rev Immunol 15, 760–770. [DOI] [PMC free article] [PubMed] [Google Scholar]
- Baughman JM, Perocchi F, Girgis HS, Plovanich M, Belcher-Timme CA, Sancak Y, Bao XR, Strittmatter L, Goldberger O, Bogorad RL, et al. (2011). Integrative genomics identifies MCU as an essential component of the mitochondrial calcium uniporter. Nature 476, 341–345. [DOI] [PMC free article] [PubMed] [Google Scholar]
- Bernardi P, Krauskopf A, Basso E, Petronilli V, Blachly-Dyson E, Di Lisa F, and Forte MA (2006). The mitochondrial permeability transition from in vitro artifact to disease target. FEBS J 273, 2077–2099. [DOI] [PubMed] [Google Scholar]
- Broekemeier KM, Dempsey ME, and Pfeiffer DR (1989). Cyclosporin A is a potent inhibitor of the inner membrane permeability transition in liver mitochondria. J Biol Chem 264, 7826–7830. [PubMed] [Google Scholar]
- Broz P, and Dixit VM (2016). Inflammasomes: mechanism of assembly, regulation and signalling. Nat Rev Immunol 16, 407–420. [DOI] [PubMed] [Google Scholar]
- Chen Q, Sun L, and Chen ZJ (2016). Regulation and function of the cGAS-STING pathway of cytosolic DNA sensing. Nat Immunol 17, 1142–1149. [DOI] [PubMed] [Google Scholar]
- Croteau DL, and Bohr VA (1997). Repair of oxidative damage to nuclear and mitochondrial DNA in mammalian cells. J Biol Chem 272, 25409–25412. [DOI] [PubMed] [Google Scholar]
- de Souza-Pinto NC, Hogue BA, and Bohr VA (2001). DNA repair and aging in mouse liver: 8-oxodG glycosylase activity increase in mitochondrial but not in nuclear extracts. Free Radic Biol Med 30, 916–923. [DOI] [PubMed] [Google Scholar]
- Desler C, Lillenes MS, Tonjum T, and Rasmussen LJ (2018). The Role of Mitochondrial Dysfunction in the Progression of Alzheimer’s Disease. Curr Med Chem 25, 5578–5587. [DOI] [PMC free article] [PubMed] [Google Scholar]
- Dick MS, Sborgi L, Ruhl S, Hiller S, and Broz P (2016). ASC filament formation serves as a signal amplification mechanism for inflammasomes. Nat Commun 7, 11929. [DOI] [PMC free article] [PubMed] [Google Scholar]
- Duvvuri B, and Lood C (2019). Cell-Free DNA as a Biomarker in Autoimmune Rheumatic Diseases. Front Immunol 10, 502. [DOI] [PMC free article] [PubMed] [Google Scholar]
- Elliott EI, and Sutterwala FS (2015). Initiation and perpetuation of NLRP3 inflammasome activation and assembly. Immunol Rev 265, 35–52. [DOI] [PMC free article] [PubMed] [Google Scholar]
- Exell JC, Thompson MJ, Finger LD, Shaw SJ, Debreczeni J, Ward TA, McWhirter C, Sioberg CL, Martinez Molina D, Abbott WM, et al. (2016). Cellularly active N-hydroxyurea FEN1 inhibitors block substrate entry to the active site. Nat Chem Biol 12, 815–821. [DOI] [PMC free article] [PubMed] [Google Scholar]
- Fontana GA, and Gahlon HL (2020). Mechanisms of replication and repair in mitochondrial DNA deletion formation. Nucleic Acids Res 48, 11244–11258. [DOI] [PMC free article] [PubMed] [Google Scholar]
- Garcia N, and Chavez E (2007). Mitochondrial DNA fragments released through the permeability transition pore correspond to specific gene size. Life Sci 81, 1160–1166. [DOI] [PubMed] [Google Scholar]
- Grailer JJ, Canning BA, Kalbitz M, Haggadone MD, Dhond RM, Andjelkovic AV, Zetoune FS, and Ward PA (2014). Critical role for the NLRP3 inflammasome during acute lung injury. J Immunol 192, 5974–5983. [DOI] [PMC free article] [PubMed] [Google Scholar]
- Gross O, Thomas CJ, Guarda G, and Tschopp J (2011). The inflammasome: an integrated view. Immunol Rev 243, 136–151. [DOI] [PubMed] [Google Scholar]
- Gurung P, Lukens JR, and Kanneganti TD (2015). Mitochondria: diversity in the regulation of the NLRP3 inflammasome. Trends Mol Med 21, 193–201. [DOI] [PMC free article] [PubMed] [Google Scholar]
- Halle A, Hornung V, Petzold GC, Stewart CR, Monks BG, Reinheckel T, Fitzgerald KA, Latz E, Moore KJ, and Golenbock DT (2008). The NALP3 inflammasome is involved in the innate immune response to amyloid-beta. Nat Immunol 9, 857–865. [DOI] [PMC free article] [PubMed] [Google Scholar]
- Heneka MT, Golenbock DT, and Latz E (2015). Innate immunity in Alzheimer’s disease. Nat Immunol 16, 229–236. [DOI] [PubMed] [Google Scholar]
- Heneka MT, Kummer MP, Stutz A, Delekate A, Schwartz S, Vieira-Saecker A, Griep A, Axt D, Remus A, Tzeng TC, et al. (2013). NLRP3 is activated in Alzheimer’s disease and contributes to pathology in APP/PS1 mice. Nature 493, 674–678. [DOI] [PMC free article] [PubMed] [Google Scholar]
- Hornung V, Bauernfeind F, Halle A, Samstad EO, Kono H, Rock KL, Fitzgerald KA, and Latz E (2008). Silica crystals and aluminum salts activate the NALP3 inflammasome through phagosomal destabilization. Nat Immunol 9, 847–856. [DOI] [PMC free article] [PubMed] [Google Scholar]
- Karch J, and Molkentin JD (2014). Identifying the components of the elusive mitochondrial permeability transition pore. Proc Natl Acad Sci U S A 111, 10396–10397. [DOI] [PMC free article] [PubMed] [Google Scholar]
- Karin M, and Clevers H (2016). Reparative inflammation takes charge of tissue regeneration. Nature 529, 307–315. [DOI] [PMC free article] [PubMed] [Google Scholar]
- Kim J, Gupta R, Blanco LP, Yang S, Shteinfer-Kuzmine A, Wang K, Zhu J, Yoon HE, Wang X, Kerkhofs M, et al. (2019). VDAC oligomers form mitochondrial pores to release mtDNA fragments and promote lupus-like disease. Science 366, 1531–1536. [DOI] [PMC free article] [PubMed] [Google Scholar]
- Kotas ME, and Medzhitov R (2015). Homeostasis, inflammation, and disease susceptibility. Cell 160, 816–827. [DOI] [PMC free article] [PubMed] [Google Scholar]
- Lam NY, Rainer TH, Chiu RW, Joynt GM, and Lo YM (2004). Plasma mitochondrial DNA concentrations after trauma. Clin Chem 50, 213–216. [DOI] [PubMed] [Google Scholar]
- Lamkanfi M, and Dixit VM (2012). Inflammasomes and their roles in health and disease. Annu Rev Cell Dev Biol 28, 137–161. [DOI] [PubMed] [Google Scholar]
- Latz E, Xiao TS, and Stutz A (2013). Activation and regulation of the inflammasomes. Nat Rev Immunol 13, 397–411. [DOI] [PMC free article] [PubMed] [Google Scholar]
- Liu S, Cai X, Wu J, Cong Q, Chen X, Li T, Du F, Ren J, Wu YT, Grishin NV, et al. (2015). Phosphorylation of innate immune adaptor proteins MAVS, STING, and TRIF induces IRF3 activation. Science 347, aaa2630. [DOI] [PubMed] [Google Scholar]
- Lu A, Magupalli VG, Ruan J, Yin Q, Atianand MK, Vos MR, Schroder GF, Fitzgerald KA, Wu H, and Egelman EH (2014). Unified polymerization mechanism for the assembly of ASC-dependent inflammasomes. Cell 156, 1193–1206. [DOI] [PMC free article] [PubMed] [Google Scholar]
- Mangan MSJ, Olhava EJ, Roush WR, Seidel HM, Glick GD, and Latz E (2018). Targeting the NLRP3 inflammasome in inflammatory diseases. Nat Rev Drug Discov 17, 688. [DOI] [PubMed] [Google Scholar]
- Mao G, Pan X, Zhu BB, Zhang Y, Yuan F, Huang J, Lovell MA, Lee MP, Markesbery WR, Li GM, et al. (2007). Identification and characterization of OGG1 mutations in patients with Alzheimer’s disease. Nucleic Acids Res 35, 2759–2766. [DOI] [PMC free article] [PubMed] [Google Scholar]
- Matic S, Jiang M, Nicholls TJ, Uhler JP, Dirksen-Schwanenland C, Polosa PL, Simard ML, Li X, Atanassov I, Rackham O, et al. (2018). Mice lacking the mitochondrial exonuclease MGME1 accumulate mtDNA deletions without developing progeria. Nat Commun 9, 1202. [DOI] [PMC free article] [PubMed] [Google Scholar]
- McArthur K, Whitehead LW, Heddleston JM, Li L, Padman BS, Oorschot V, Geoghegan ND, Chappaz S, Davidson S, San Chin H, et al. (2018). BAK/BAX macropores facilitate mitochondrial herniation and mtDNA efflux during apoptosis. Science 359. [DOI] [PubMed] [Google Scholar]
- Murphy MP (2018). Newly made mitochondrial DNA drives inflammation. Nature 560, 176–177. [DOI] [PubMed] [Google Scholar]
- Nakahira K, Haspel JA, Rathinam VA, Lee SJ, Dolinay T, Lam HC, Englert JA, Rabinovitch M, Cernadas M, Kim HP, et al. (2011). Autophagy proteins regulate innate immune responses by inhibiting the release of mitochondrial DNA mediated by the NALP3 inflammasome. Nat Immunol 12, 222–230. [DOI] [PMC free article] [PubMed] [Google Scholar]
- Oka T, Hikoso S, Yamaguchi O, Taneike M, Takeda T, Tamai T, Oyabu J, Murakawa T, Nakayama H, Nishida K, et al. (2012). Mitochondrial DNA that escapes from autophagy causes inflammation and heart failure. Nature 485, 251–255. [DOI] [PMC free article] [PubMed] [Google Scholar]
- Parrish JZ, Yang C, Shen B, and Xue D (2003). CRN-1, a Caenorhabditis elegans FEN-1 homologue, cooperates with CPS-6/EndoG to promote apoptotic DNA degradation. EMBO J 22, 3451–3460. [DOI] [PMC free article] [PubMed] [Google Scholar]
- Pastukh VM, Gorodnya OM, Gillespie MN, and Ruchko MV (2016). Regulation of mitochondrial genome replication by hypoxia: The role of DNA oxidation in D-loop region. Free Radic Biol Med 96, 78–88. [DOI] [PMC free article] [PubMed] [Google Scholar]
- Perez-Trevino P, Velasquez M, and Garcia N (2020). Mechanisms of mitochondrial DNA escape and its relationship with different metabolic diseases. Biochim Biophys Acta Mol Basis Dis 1866, 165761. [DOI] [PubMed] [Google Scholar]
- Ricci C, Pastukh V, Leonard J, Turrens J, Wilson G, Schaffer D, and Schaffer SW (2008). Mitochondrial DNA damage triggers mitochondrial-superoxide generation and apoptosis. Am J Physiol Cell Physiol 294, C413–422. [DOI] [PubMed] [Google Scholar]
- Riley JS, Quarato G, Cloix C, Lopez J, O’Prey J, Pearson M, Chapman J, Sesaki H, Carlin LM, Passos JF, et al. (2018). Mitochondrial inner membrane permeabilisation enables mtDNA release during apoptosis. EMBO J 37. [DOI] [PMC free article] [PubMed] [Google Scholar]
- Riley JS, and Tait SW (2020). Mitochondrial DNA in inflammation and immunity. EMBO Rep 21, e49799. [DOI] [PMC free article] [PubMed] [Google Scholar]
- Rizzuto R, Pinton P, Carrington W, Fay FS, Fogarty KE, Lifshitz LM, Tuft RA, and Pozzan T (1998). Close contacts with the endoplasmic reticulum as determinants of mitochondrial Ca2+ responses. Science 280, 1763–1766. [DOI] [PubMed] [Google Scholar]
- Sampath H, Vartanian V, Rollins MR, Sakumi K, Nakabeppu Y, and Lloyd RS (2012). 8-Oxoguanine DNA glycosylase (OGG1) deficiency increases susceptibility to obesity and metabolic dysfunction. PLoS One 7, e51697. [DOI] [PMC free article] [PubMed] [Google Scholar]
- Shimada K, Crother TR, Karlin J, Dagvadorj J, Chiba N, Chen S, Ramanujan VK, Wolf AJ, Vergnes L, Ojcius DM, et al. (2012). Oxidized mitochondrial DNA activates the NLRP3 inflammasome during apoptosis. Immunity 36, 401–414. [DOI] [PMC free article] [PubMed] [Google Scholar]
- Tanaka Y, and Chen ZJ (2012). STING specifies IRF3 phosphorylation by TBK1 in the cytosolic DNA signaling pathway. Sci Signal 5, ra20. [DOI] [PMC free article] [PubMed] [Google Scholar]
- Tumurkhuu G, Chen S, Montano EN, Ercan Laguna D, De Los Santos G, Yu JM, Lane M, Yamashita M, Markman JL, Blanco LP, et al. (2020). Oxidative DNA Damage Accelerates Skin Inflammation in Pristane-Induced Lupus Model. Front Immunol 11, 554725. [DOI] [PMC free article] [PubMed] [Google Scholar]
- Tumurkhuu G, Shimada K, Dagvadorj J, Crother TR, Zhang W, Luthringer D, Gottlieb RA, Chen S, and Arditi M (2016). Ogg1-Dependent DNA Repair Regulates NLRP3 Inflammasome and Prevents Atherosclerosis. Circ Res 119, e76–90. [DOI] [PMC free article] [PubMed] [Google Scholar]
- Vartanian V, Tumova J, Dobrzyn P, Dobrzyn A, Nakabeppu Y, Lloyd RS, and Sampath H (2017). 8-oxoguanine DNA glycosylase (OGG1) deficiency elicits coordinated changes in lipid and mitochondrial metabolism in muscle. PLoS One 12, e0181687. [DOI] [PMC free article] [PubMed] [Google Scholar]
- von Kleist L, Stahlschmidt W, Bulut H, Gromova K, Puchkov D, Robertson MJ, MacGregor KA, Tomilin N, Pechstein A, Chau N, et al. (2011). Role of the clathrin terminal domain in regulating coated pit dynamics revealed by small molecule inhibition. Cell 146, 471–484. [DOI] [PubMed] [Google Scholar]
- Wang W, Esbensen Y, Kunke D, Suganthan R, Rachek L, Bjoras M, and Eide L (2011). Mitochondrial DNA damage level determines neural stem cell differentiation fate. J Neurosci 31, 9746–9751. [DOI] [PMC free article] [PubMed] [Google Scholar]
- Wang Y, Ning X, Gao P, Wu S, Sha M, Lv M, Zhou X, Gao J, Fang R, Meng G, et al. (2017). Inflammasome Activation Triggers Caspase-1-Mediated Cleavage of cGAS to Regulate Responses to DNA Virus Infection. Immunity 46, 393–404. [DOI] [PubMed] [Google Scholar]
- West AP, Khoury-Hanold W, Staron M, Tal MC, Pineda CM, Lang SM, Bestwick M, Duguay BA, Raimundo N, MacDuff DA, et al. (2015). Mitochondrial DNA stress primes the antiviral innate immune response. Nature 520, 553–557. [DOI] [PMC free article] [PubMed] [Google Scholar]
- West AP, and Shadel GS (2017). Mitochondrial DNA in innate immune responses and inflammatory pathology. Nat Rev Immunol 17, 363–375. [DOI] [PMC free article] [PubMed] [Google Scholar]
- White MJ, McArthur K, Metcalf D, Lane RM, Cambier JC, Herold MJ, van Delft MF, Bedoui S, Lessene G, Ritchie ME, et al. (2014). Apoptotic caspases suppress mtDNA-induced STING-mediated type I IFN production. Cell 159, 1549–1562. [DOI] [PMC free article] [PubMed] [Google Scholar]
- Wu Z, Sainz AG, and Shadel GS (2021). Mitochondrial DNA: cellular genotoxic stress sentinel. Trends Biochem Sci 46, 812–821. [DOI] [PMC free article] [PubMed] [Google Scholar]
- Xian H, and Liou YC (2019). Loss of MIEF1/MiD51 confers susceptibility to BAX-mediated cell death and PINK1-PRKN-dependent mitophagy. Autophagy 15, 2107–2125. [DOI] [PMC free article] [PubMed] [Google Scholar]
- Xian H, Liu Y, Rundberg Nilsson A, Gatchalian R, Crother TR, Tourtellotte WG, Zhang Y, Aleman-Muench GR, Lewis G, Chen W, et al. (2021). Metformin inhibition of mitochondrial ATP and DNA synthesis abrogates NLRP3 inflammasome activation and pulmonary inflammation. Immunity 54, 1463–1477 e1411. [DOI] [PMC free article] [PubMed] [Google Scholar]
- Xian H, Yang Q, Xiao L, Shen HM, and Liou YC (2019). STX17 dynamically regulated by Fis1 induces mitophagy via hierarchical macroautophagic mechanism. Nat Commun 10, 2059. [DOI] [PMC free article] [PubMed] [Google Scholar]
- Xiao L, Xian H, Lee KY, Xiao B, Wang H, Yu F, Shen HM, and Liou YC (2015). Death-associated Protein 3 Regulates Mitochondrial-encoded Protein Synthesis and Mitochondrial Dynamics. J Biol Chem 290, 24961–24974. [DOI] [PMC free article] [PubMed] [Google Scholar]
- Yu CH, Davidson S, Harapas CR, Hilton JB, Mlodzianoski MJ, Laohamonthonkul P, Louis C, Low RRJ, Moecking J, De Nardo D, et al. (2020). TDP-43 Triggers Mitochondrial DNA Release via mPTP to Activate cGAS/STING in ALS. Cell 183, 636–649 e618. [DOI] [PMC free article] [PubMed] [Google Scholar]
- Yu Y, Liu Y, An W, Song J, Zhang Y, and Zhao X (2019). STING-mediated inflammation in Kupffer cells contributes to progression of nonalcoholic steatohepatitis. J Clin Invest 129, 546–555. [DOI] [PMC free article] [PubMed] [Google Scholar]
- Zhang Q, Raoof M, Chen Y, Sumi Y, Sursal T, Junger W, Brohi K, Itagaki K, and Hauser CJ (2010). Circulating mitochondrial DAMPs cause inflammatory responses to injury. Nature 464, 104–107. [DOI] [PMC free article] [PubMed] [Google Scholar]
- Zheng L, Jia J, Finger LD, Guo Z, Zer C, and Shen B (2011). Functional regulation of FEN1 nuclease and its link to cancer. Nucleic Acids Res 39, 781–794. [DOI] [PMC free article] [PubMed] [Google Scholar]
- Zhong F, Liang S, and Zhong Z (2019). Emerging Role of Mitochondrial DNA as a Major Driver of Inflammation and Disease Progression. Trends Immunol 40, 1120–1133. [DOI] [PubMed] [Google Scholar]
- Zhong S, Ng MC, Lo YM, Chan JC, and Johnson PJ (2000). Presence of mitochondrial tRNA(Leu(UUR)) A to G 3243 mutation in DNA extracted from serum and plasma of patients with type 2 diabetes mellitus. J Clin Pathol 53, 466–469. [DOI] [PMC free article] [PubMed] [Google Scholar]
- Zhong Z, Liang S, Sanchez-Lopez E, He F, Shalapour S, Lin XJ, Wong J, Ding S, Seki E, Schnabl B, et al. (2018). New mitochondrial DNA synthesis enables NLRP3 inflammasome activation. Nature 560, 198–203. [DOI] [PMC free article] [PubMed] [Google Scholar]
- Zhong Z, Umemura A, Sanchez-Lopez E, Liang S, Shalapour S, Wong J, He F, Boassa D, Perkins G, Ali SR, et al. (2016). NF-kappaB Restricts Inflammasome Activation via Elimination of Damaged Mitochondria. Cell 164, 896–910. [DOI] [PMC free article] [PubMed] [Google Scholar]
- Zhou R, Yazdi AS, Menu P, and Tschopp J (2011). A role for mitochondria in NLRP3 inflammasome activation. Nature 469, 221–225. [DOI] [PubMed] [Google Scholar]
Associated Data
This section collects any data citations, data availability statements, or supplementary materials included in this article.
Supplementary Materials
Data Availability Statement
All data supporting the findings of this study are available within the paper and its supplementary materials. This study did not generate any unique datasets or code.