

Abstract
Parvalbumin-expressing (PV+) interneurons of the nucleus accumbens (NAc) play an essential role in the addictive-like behaviors induced by psychostimulant exposure. To identify molecular mechanisms of PV+ neuron plasticity, we isolated interneuron nuclei from the NAc of male and female mice following acute or repeated exposure to amphetamine (AMPH) and sequenced for cell type-specific RNA expression and chromatin accessibility. AMPH regulated the transcription of hundreds of genes in PV+ interneurons, and this program was largely distinct from that regulated in other NAc GABAergic neurons. Chromatin accessibility at enhancers predicted cell-type specific gene regulation, identifying transcriptional mechanisms of differential AMPH responses. Finally, we assessed expression of PV-enriched, AMPH-regulated genes in an Mecp2 mutant mouse strain that shows heightened behavioral sensitivity to psychostimulants to explore the functional importance of this transcriptional program. Together these data provide novel insight into the cell-type specific programs of transcriptional plasticity in NAc neurons that underlie addictive-like behaviors.
Introduction:
Drugs of abuse, including the psychostimulants amphetamine (AMPH) and cocaine, lead to addiction by driving progressive and lasting adaptations in the function of neurons within the mesolimbic dopamine reward circuit1. Psychostimulant-induced changes in gene transcription play an essential role in this process by persistently altering the functional connectivity of neurons in reward circuits2. Transcriptional responses can be accompanied by regulation of the epigenome, including dynamic modifications of histone proteins and direct modifications to genomic DNA3, 4,5. Because chromatin architecture is highly cell-type specific, elucidating the relationship between chromatin regulation and gene transcription requires isolation and differential analysis of specific cell types from heterogeneous brain regions.
The cellular and molecular consequences of psychostimulant-exposure have been well-documented in spiny projection neurons (SPNs) of the nucleus accumbens (NAc), which are the most numerous NAc neurons and provide the main output from NAc. Despite comprising only a few percent of all NAc neurons, interneurons can exert dominant roles over SPN output include in the context of addiction6–8. We showed that AMPH-induced phosphorylation of the methyl-DNA binding protein MeCP2 is selectively induced in PV+ interneurons of the NAc and that transgenic mice bearing a phosphorylation site mutation (Ser421Ala) knocked into Mecp2 are behaviorally supersensitive to psychostimulants9–11. However transcriptional mechanisms of NAc interneuron plasticity are only beginning to be elucidated.
Parvalbumin-expressing (PV+) GABAergic interneurons are especially potent regulators of feed-forward inhibition in local striatal circuits, and experimental manipulations have implicated these neurons in long-lasting NAc circuit adaptations that promote addictive-like behaviors12, 13. PV+ interneurons fire robustly in response to psychostimulant exposure in vivo, and withdrawal from cocaine exposure further increases their excitability14, 15. Excitatory inputs from basolateral amygdala to NAc PV+ interneurons are enhanced following cocaine self-administration, resulting in increased feedforward inhibition of NAc SPNs and more efficient encoding of operant behavior16. Blocking neurotransmitter release from NAc PV+ interneurons prevents the expression of locomotor sensitization and conditioned place preference induced by repeated AMPH17 via global disinhibition of both D1 and D2 SPNs in the NAc, suggesting that these interneurons may regulate the expression of addictive-like behaviors by modulating the SPN ensembles that encode reward-related behavior17, 18.
Here, to study both chromatin and gene expression regulation in NAc interneurons following AMPH exposure, we used the Isolation of Nuclei Tagged in Specific Cell Types (INTACT) transgenic mouse model19 to purify nuclei from PV+ or SST+ NAc interneurons. We identified hundreds of AMPH-regulated genes in both populations and used differential patterns of chromatin accessibility to discover mechanisms of cell-type specific regulation. These studies significantly expand understanding of the plasticity mechanisms that underlie the function of NAc interneurons in the response to psychostimulant drugs of abuse.
Methods
Animals:
We performed all procedures under an approved protocol from the Duke University Institutional Animal Care and Use Committee. Unless explicitly stated, all experiments used adult (P60-210) male and/or female mice that were heterozygous for transgenes. Mouse strains: Pvalb-IRES-Cre (B6.129P2-Pvalbtm1(cre)Arbr/J, RRID:IMSR JAX:017320); Sst-IRES-Cre (Ssttm2.1(cre)Zjh/J, RRID:IMSR_JAX:013044); INTACT (B6;129-Gt(ROSA)26Sortm5(CAG-Sun1/sfGFP)Nat/J, RRID:IMSR_JAX:021039, LSL-Sun1-GFP); RiboTag (B6J.129(Cg)-Rpl22tm1.1Psam/SjJ, RRID:IMSR_JAX:029977); Pvalb-2A-Cre (B6.Cg-Pvalbtm1.1(cre)Aibs/J, RRID:IMSR_JAX:012358); MeCP2 Ser421Ala KI (Mecp2tm1.1Meg, RRID:MGI:5302547)10. For breeding and transgene validation, see Supplementary Methods. On day one, after habituation, mice received a mock injection and were returned to the open field. Locomotor activity was monitored as horizontal distance traveled (cm). To study acute responses, on day 2, mice received saline (as a vehicle control) or 3mg/kg AMPH (i.p.) and returned immediately to the open field for 35min (rapid nucRNA-seq timepoint, snRNA-seq), 60min (ATAC-seq), or 3hr (delayed RNA-seq timepoint). To study chronic responses, mice received saline or 3mg/kg AMPH (i.p.) on days 2-8 and were harvested 24hr after the final treatment. Locomotor activity was recorded for 90min then mice were rapidly decapitated. For bulk nucRNA-seq the NAc was dissected, flash frozen in 2-methyl-butane, and stored at −80°C until nuclear isolation. Tissue for ATAC-seq or snRNA-seq was processed fresh and moved immediately to nuclear isolation.
INTACT nuclear isolation:
We used a variation of the published INTACT protocol19. NAc samples were defrosted and dounced in homogenization buffer (HB), nuclei were gradient purified, and GFP+ nuclei were immunoprecipitated as described (Supplementary Methods). 10μL of nuclei from the unbound fraction (UF) were counted on a hemocytometer and 5000 UF nuclei were removed for use in downstream applications as a reference sample to the number of GFP+ nuclei immunoprecipitated (IP; 3000-5000/mouse).
nucRNA-seq and Analysis:
RNA isolation was performed using the RNaqeuous Micro kit (Thermo Fisher). RNA was eluted in 15μL, and 4μL was used for qRT-PCR gene enrichment validation. All samples were processed for libraries using the Ovation SoLo RNA-Seq kit (NuGEN Technologies), and PCR amplification cycles were determined separately for each sample (Supplementary Methods). Normalization and differential expression analyses were carried out using the DESeq2 Bioconductor packagev1.18.1 while accounting for condition group, PCR-bottlenecking effects, and batch (details in Supplementary Methods). GO Analysis was conducted using the Database for Annotation, Visualization and Integrated Discovery (DAVID) using DE genes as the target set and all genes in the mouse genome as a background set to enrich for GO Biological Processes. To assess the concordance of differential expression profiles between two experiment or treatment groups, we used a two-sided Rank-Rank Hypergeometric overlap test20 with the RRHOv1.32.0 R package.
ATAC-seq and Analysis:
Omni-ATAC-seq was performed as previously described21 with an adjusted Tn5 volume (0.5μL/sample) to avoid over transposition in a low number of input nuclei. Briefly, 5000 UF nuclei or the entire bead-bound IP fraction was resuspended in cold RSB buffer prior to the beginning of Omni-ATAC. Libraries were made as described with the added inclusion of a 1:1 volume library cleanup with Ampure XP beads. Sequencing data were analyzed by DESeq2 (Supplementary Methods).
Fluorescence activated nuclear sorting and single nucleus sequencing (FANS-snRNA-seq):
Fresh NAc from Pvalb-IRES-Cre/INTACT mice (n=3 Saline, n=4 AMPH) were isolated, pooled by treatment and homogenized. Nuclei were isolated by gradient centrifugation, then re-suspended, washed in HB, and incubated with DAPI and MULTI-seq lipid-modified oligos (LMOs) at a ratio of 10:1 relative to molecular (lipid) anchor to barcode for nuclei from either the saline or AMPH condition22. PV+ nuclei were isolated using Fluorescent-Activated Cell Sorting (FACS) gating on double positivity for DAPI/GFP and sorted directly into a plate for 10X Genomics snRNA-seq. Analysis was performed in R (Supplementary Methods). Final data included 1456 nuclei with an average genes per cell of 2827 and average counts per cell of 6370. For all differential expression comparisons, we used Wilcoxon Rank Sum test.
Transcription factor motif analysis:
Regions around AMPH-induced, differentially expressed (DE) genes were queried for transcription factor binding motifs in a cell-type specific manner. Differentially accessible (DA) peaks from ATAC-seq analysis within the 3hr/delayed DE gene promoter and non-promoter (distal regions within 50kb and intragenic) regions were identified as the query sets using bedtools. Each peak (FDR<0.05) was expanded from the center to create 500bp regions as inputs for motif enrichment analysis, which was carried out in Homerv4.10.4 separately for promoter regions and non-promoter regions (Supplementary Methods).
RiboTag purification of cell-type specific translating RNA and Analysis:
RiboTag purification of translating RNAs was performed with minor variations from the published protocol23(Supplementary Methods). SMART-Seq™v4 Ultra™ Low Input RNA Kit (Takara Bio) was used to convert RNA to cDNA, which was then amplified and sequenced using an Illumina Hi-Seq 2500. Samples were aligned to Gencode Primary Genome Assembly GRCm38vM21 of the mouse genome with the respective Gencode Basic Gene Annotation (gencode.vM21.annotation.gtf). Differential expression analysis was performed using cuffdiffv2.2.1.
Statistical analyses:
Unless otherwise stated, graphs show mean±SEM. Data were tested for normality using the Shapiro-Wilk test. For multiple-comparisons, rmANOVA was performed (GraphPad PRISM) with Bonferroni-corrected pairwise tests post hoc. p <0.05, FDR<0.05 for cell-type-specific genes, FDR<0.1 for AMPH/Genotype regulated nuclear or ribosomal RNAseq, and FDR<0.05 for ATAC-seq data were considered significant.
Data Availability:
RNA and ATAC sequencing data have been deposited at GEO (GSE181421). All primary data are stored on a secure server at Duke University and are available from the corresponding author.
Code Availability:
Full coding implementation of all analysis tools can be found in complete alignment/analysis pipelines available at https://github.com/WestLabDuke/Psychostimulant-NAcInterneuron.
Results
Isolation of NAc interneuron nuclei enables cell type-specific sequencing
To isolate NAc interneurons for gene expression and chromatin accessibility, we genetically tagged the nuclei of neuronal cell-types using INTACT transgenic mice19 (Fig. 1A–C). When INTACT mice were crossed with Pvalb-IRES-Cre or Sst-IRES-Cre mouse lines, the nuclear Sun1-GFP transgene colocalized with PV protein (Fig. 1D) or Sst RNA (Fig. 1E). Immunoisolated GFP+ NAc nuclei (IP) showed enrichment for known cell-type markers compared to the unbound fraction (UF) by qPCR (Fig S1A,B), demonstrating isolation of NAc interneurons in the IPs. Single cell sequencing data from NAc suggest that the UF is comprised of a 60/40 mix of neurons and nonneuronal cells (e.g., oligodendrocytes, astrocytes, microglia and endothelial cells)24.
Figure 1: INTACT-mediated isolation of PV+ and SST+ GABAergic interneuron nuclei from mouse NAc.

A) Schematic of the INTACT Cre-inducible Sun1-GFP transgene system. For each strain, the protocol yields two fractions: Sun1-GFP+ nuclei (green) immunoprecipitated from the specific cells expressing the Cre transgene (IP) and an unbound fraction (UF) that contains a mixture of nuclei from all other cell types present in the homogenate. RNA and chromatin from each fraction was used for nuclear RNA sequencing (nucRNA-seq) and the detection of Tn5-transposase accessible regions (ATAC-seq), respectively. B) Diagram of the NAc region bilaterally dissected from individual animals for nuclear isolation. C) Representative images of DAPI-stained nuclei and Sun1GFP-fluorescence in the NAc homogenate (merge), and on beads after immunoprecipitation (IP). D-E) Immunohistochemical overlap of Sun-GFP with Parvalbumin (PV) immunostaining (D), or Sst FISH signal (E), in coronal brain sections through the NAc of the indicated INTACT transgenic mice. Scale bars, 10μm. F-I) NucRNA-seq RNA expression data from IP and UF fractions of the indicated dual transgenic mice. Pvalb-Cre IP, green; Pvalb-Cre UF, purple; Sst-Cre IP, red; Sst-Cre UF blue; F, H) Validation in nucRNA-seq data of enrichment for cell-type marker genes Pvalb (F) and Sst (H) in the IP fraction of the indicated mice shown via TPM, Transcripts per Kilobase Million (TPM), Error bars indicate SEM. G, I) Volcano plots of cell-type enriched genes in Pvalb-Cre (G) and Sst-Cre (I) IP each compared to UF of the same strain in timepoint-combined control-treated mice. Black dots, not significant; colored dots, *FDR<0.05. Pvalb-Cre n=9, Sst-Cre n=7 individual animals. J, K) Representative nucRNA-seq tracks for cell-type marker genes. Y-axis shows Reads per Million base pairs mapped (RPM) and is constant between matched samples for each gene. Arrows on gene indicate transcript directionality.
Most NAc neurons are GABAergic, with SPNs representing the predominant (~90%) neuronal type24, 25. By contrast, each class of GABAergic interneuron comprises only a few percent of all neurons6. To identify genes that are enriched in NAc PV+ and SST+ interneurons, we performed RNA-seq on INTACT purified PV+ or SST+ nuclei from single mice (n=9 Pvalb-Cre, n=7 Sst-Cre) and identified differentially expressed genes relative to the UF from each pulldown. Although nuclei contain only a subset of total cellular RNA, prior studies have shown that nuclear RNA-seq (nucRNA-seq) gives a quantitatively accurate assessment of gene expression that is robustly preserved upon dissociation of adult brain tissue26.
We identified 3145 genes including Pvalb (Fig. 1F) that were enriched in NAc PV+ interneurons nuclei relative to the UF of Pvalb-IRES-Cre mice, and 3108 genes that were de-enriched in the PV+ IP (Fig. 1G; Table S1). We identified 2273 genes including Sst (Fig. 1H) that were enriched in the SST+ IP nuclei relative to the Sst-IRES-Cre UF, and 2522 genes that were de-enriched in the SST+ IP (Fig. 1I; Table S1). We conducted a global comparison of the transcriptional programs between SST+ neurons, PV+ neurons and the SPN-enriched UF using rank-rank hypergeometric overlap test (RRHO)20. RRHO is a rank-based method to measure the statistical concordance of differential gene expression between two datasets (Fig. S1C–E). Among the IP-enriched genes, we found known markers of interneuron function27, 28, whereas the SPN marker Ppp1r1b, which encodes the signaling protein DARPP-32, was significantly lower in the IP nuclei relative to the UF, consistent with the expectation that SPNs are found in the UF (Fig. 1J,K).
AMPH induces a rapid program of transcription that overlaps between NAc neuron types
Neuronal activation induces multiple waves of stimulus-regulated gene transcription that can be separated by their timing and underlying mechanisms. Rapid and delayed primary response genes (PRGs) are driven by the post-translational modification of constitutively expressed transcription factors. The delayed program of secondary response genes (SRGs) is mediated by transcription factors (TFs) synthesized in the primary wave29. To identify rapid PRGs induced by AMPH exposure in NAc GABAergic interneurons, we purified PV+ or SST+ interneurons from the NAc of mice 35min following an injection of either saline or 3mg/kg AMPH (Fig. 2A). As expected, acute AMPH administration induced significant increases in open-field locomotor activity (Fig. 2B). nucRNA-seq confirmed enrichment of PV+ and SST+ cell-type specific markers in the IPs relative to the UFs (Fig. 2C) and significant AMPH-dependent induction of the rapid PRG Fos in nuclei of PV+ neurons, SST+ neurons, and SPNs of the combined UF from both IPs (Fig. 2D).
Figure 2: AMPH induces an overlapping program of rapid PRGs in distinct populations of NAc GABAergic neurons.

A) Experimental timeline. Mice received saline (Sal) or amphetamine (AMPH, 3mg/kg, i.p.) after 60 min habituation to the open field. Brains were harvested 35 min later for nucRNA-seq. B) Summed locomotor activity in the open field 60 min before (Pre) and 35 min after (Post) i.p. injection of saline (Sal) or 3mg/kg AMPH. Pvalb-Cre n=5/treatment; Sst-Cre n=3/treatment; combined UF n=8/treatment, Error bars indicate SEM. Two-way rmANOVA, Pvalb-Cre F (1, 11) = 93.18, p<0.0001, Bonferroni post-hoc AMPH Pre vs Post p<0.0001; Sst-Cre F (1, 9) = 24.91, p=0.0007), Bonferroni post-hoc AMPH Pre vs Post p=.0025. C) Validation of enrichment for cell-type specific marker transcripts (Pvalb or Sst) in nuclei recovered from each condition. TPM for each gene from Table S2 in the IP is shown normalized to UF TPM, Error bars indicate SEM. D) Quantification of NucRNA for the rapid PRG Fos in nuclei recovered from each condition from Table S2. *FDR<0.1, TPM normalized to Sal condition for each isolation, Error bars indicate SEM. E-G) Volcano plots of AMPH-regulated RNA at 35min post-injection in Pvalb IP (E, green), UF fractions (F, purple), or Sst IP (G, red). Black dots, AMPH vs Sal not significant; colored dots *FDR<0.1. Darker colors indicate genes induced by AMPH, lighter colors indicate genes repressed by AMPH. H) Representative NucRNA-seq tracks of PRGs Fosl2 in each population of nuclei 35 min after AMPH administration. Y-axis shows Bins per Million base pairs mapped (BPM) and is constant between matched samples. I) RRHO plot visualizing the strength of concordance of genes regulated by 35min AMPH in SST+ neurons (x-axis) and PV+ neurons (y-axis). The lower left quadrant shows concordance between AMPH-induced genes in each cell population. J) Examples of common and cell-type specific rapid AMPH induced genes. K) Venn diagram of genes significantly induced 35 min following AMPH in each population of nuclei, considering the full set of genes concordant between PV and SST neurons in the RRHO analysis.
At this rapid time point, we detected a relatively small number of differentially expressed genes in any of the cell types (Fig. 2E–G, Table S2). In all three populations we observed induction of a common set of rapid PRG TFs including members of the Fos and Nr4a families (Fig. 2H), consistent with prior studies showing Early Response Transcription Factors (ERTFs) are induced across all cell types30. We used RRHO analysis as a global measure to capture the statistically concordant rapid transcriptional program between PV+ and SST+ neurons (Fig. 2I). Beyond this concordance, we also detected rapidly induced genes that were divergent between the NAc GABAergic cell types we profiled, including gene products with known functions in plasticity (Fig. 2J–K, Table S2)31–33. In PV+ neurons, these include the ubiquitin ligase Cul334, the nucleocytoplasmic transport protein Ranbp235, and the topoisomerase Top2b36. These data confirm that we can discover novel molecular programs of neuronal plasticity by comparing AMPH-regulated genes among distinct GABAergic cell types in the NAc.
AMPH induces cell-type specific delatyed gene programs in NAc interneurons
To identify the delayed PRGs and SRGs regulated by AMPH, we used INTACT to purify PV+ or SST+ interneurons from the NAc of mice 3hrs following an injection of either saline or AMPH (Fig. 3A). AMPH again induced locomotor activity in the open field (Fig. 3B), and we confirmed the enrichment of interneuron markers Pvalb and Sst in the IP fractions (Fig. 3C). We verified AMPH-dependent induction in the UF of Bdnf, an established delayed PRG,29 and confirmed the absence of Bdnf in the PV+ and SST+ nuclei harvested after AMPH exposure, as Bdnf is not inducible in GABAergic interneurons37 (Fig. 3D).
Figure 3: Cell-type specific programs of gene expression regulated 3 hrs after AMPH administration in different populations of NAc GABAergic neurons.

A) Experimental timeline. Mice received an injection of saline (Sal) or amphetamine (AMPH, 3mg/kg, i.p.) after 60 min habituation in the open field. Brains were harvested 180 min (3 hr) later for nucRNA-seq. B) Locomotor activity 60 min before (pre) and 180 min after (post) i.p. injection of saline (pink) or 3mg/kg AMPH (green, Pvalb-Cre; red, Sst-Cre). Pvalb-Cre n=4/treatment condition; Sst-Cre n=4/treatment condition; Two-way rmANOVA, Pvalb-Cre F (1, 10) = 33.43, p=0.0002, Bonferroni post-hoc AMPH Pre vs Post p<0.0001; Sst-Cre F (1, 10) = 17.77, p=0.0018), Bonferroni post-hoc AMPH Pre vs Post p=0.0008, Error bars indicate SEM. C) Validation of enrichment for cell-type specific marker transcript expression in nuclei recovered from each condition. TPM normalized to UF for each isolation. Pvalb-Cre IP n=4/condition; Sst-Cre IP n=4/condition; Combined UF n=8/condition, Error bars indicate SEM. D) Example Tracks of RNA for the delayed primary-response gene Bdnf in nuclei from each of the conditions. Y-axis shows Bins per Million base pairs mapped (BPM) and is constant between matched samples. Pvalb-Cre IP n=4/treatment condition; Sst-Cre IP n=4/treatment condition; Combined UF n=8/treatment condition; *FDR<0.1. Y-axis proportionally adjusted for differential depth in SST Sal/AMPH resulting from PE sequencing. E-G) Volcano plots of AMPH-regulated gene expression at 180 min post-injection in Pvalb-Cre IP (E, green) Sst-Cre IP (G, red) or the combined UF fractions (F, purple). Black dots, Sal vs AMPH not significant; colored dots, FDR<0.1. Darker colors indicate genes induced by AMPH; lighter colors indicate genes repressed by AMPH at 3 Hr post-administration. Pvalb-Cre IP n=4/treatment condition; Sst-Cre IP n=4/treatment condition; Combined UF n=8/treatment condition. H) RRHO plot visualizing the strength of concordance of gene expression induced in SST+ neurons (x-axis) and PV+ neurons (y-axis) 3hr after AMPH. The data are graphed on the same p-value scale as in Fig. 2I. I) Venn diagram showing overlap of genes induced 3 Hr following AMPH in each population of nuclei. J) Representative nucRNA-seq track for example cell-type specific AMPH-induced gene Acan. Y-axis shows Bins per Million base pairs mapped (BPM) and is constant between matched samples. K-M) Cell-type specific induction of Cntnap4 by AMPH in Pvalb+ neurons of the NAc. K) nucRNA-seq quantification of Cntnap4 TPM in Pvalb-Cre IP n=4/treatment condition; Pvalb-Cre UF n=4/treatment condition; *FDR<0.1 for +/− AMPH treatment. L) smFISH for Cntnap4 and Pvalb in NAc. Scale bar = 10μm. M) Quantification of Cntnap4 smFISH in Pvalb+ and Pvalb- nuclei; Two-way ANOVA, F (1, 332) = 9.093, p=0.0028, Bonferroni post-hoc Pvalb+ Sal vs AMPH p=.0017.
We identified 143 AMPH-induced genes in NAc PV+ interneurons, 450 in SST+ interneurons, and 98 in the combined UF (Fig. 3E–G; Table S3). In contrast to the overlapping programs of rapid PRGs, the delayed gene programs were almost completely distinct (Fig. 3H, I). Gene Ontology (GO) analysis of the AMPH-regulated genes showed gene categories related to multiple signal transduction pathways in all three cell populations, suggesting, as we expected, that all cell types were experiencing intracellular adaptations to acute AMPH (Fig. S2A–F). However, we saw upregulation selectively in PV+ neurons of genes in categories that affect synapse structure and function and excitability (Fig. S2A). The downregulated pathways in PV+ neurons were predominantly related to general metabolic and biosynthetic pathways (Fig. S2D).
The category of cell adhesion was significantly enriched in both PV+ and SST+ AMPH-induced genes, including some genes already known to influence properties of interneuron synapses. For example, Acan encodes the perineuronal net (PNN) protein Aggrecan (Fig. 3J). Knockout of Aggrecan disrupts PNNs and switches PV+ neurons to a high plasticity state in vivo38, and some prior studies have suggested roles for PNNs in neural plasticity induced by drugs of abuse39. Cntnap4 (Fig. 3K–M) is a member of the neurexin superfamily that promotes presynaptic release of GABA from PV+ interneurons. Knockout of Cntnap4 augments dopamine release in the NAc and dampens inhibition from PV+ interneurons40.
Although the delayed AMPH-dependent genes are largely cell-type specific, we observed that most of the inducible genes were expressed by more than one NAc cell-type under basal conditions. Acan is basally enriched in both PV+ and SST+ interneurons compared with the UF, but selectively induced by AMPH only in PV+ neurons (Fig. 3J). Cntnap4 is basally expressed in all three cell-types, but only significantly induced by AMPH in PV+ neurons (Fig. 3K). We validated this observation with quantitative FISH, confirming that both Ppp1r1b+ SPNs and Pvalb+ interneurons within the NAc express Cntnap4 (Fig. 3L) but only Pvalb+ interneurons show a significant increase in Cntnap4 signal following AMPH when compared to surrounding Pvalb-, Cntnap4+ cells. (Fig. 3M).
Stable chromatin accessibility landscapes in NAc cells following AMPH exposure
Because enhancer usage can be highly cell-type specific even for genes with broad expression patterns41, we examined chromatin accessibility in NAc interneurons to determine possible epigenetic mechanisms of cell-type specific transcriptional regulation. To characterize chromatin accessibility for TF binding genome-wide, we used the Assay for Transposase-Accessible Chromatin (ATAC-seq) on neuronal nuclei purified by INTACT. In AMPH-naïve mice, PV+ and SST+ interneurons have a unique and replicable chromatin accessibility landscape that distinguishes them from each other and from the GABAergic SPNs that predominate in the UF (Fig. 4A–C). When compared to their respective UF, we find >60,000 differentially accessible regions of chromatin uniquely accessible in PV+ and SST+ interneurons genome wide. (Table S4). Conversely, we find 46,348 regions that are uniquely accessible in the combined, SPN-enriched UF. More modestly, we find ~5000 unique differentially accessible regions between immunoprecipitated PV+ and SST+ interneurons. Consistent with prior studies42, 43, only a small fraction (<10%) of the differentially accessible sites were found at gene promoters, whereas the vast majority occur at inter- and intragenic sites likely to function as distal transcriptional enhancers (Fig. 4D).
Figure 4: Cell-type specific and post-AMPH chromatin accessibility in NAc neurons.
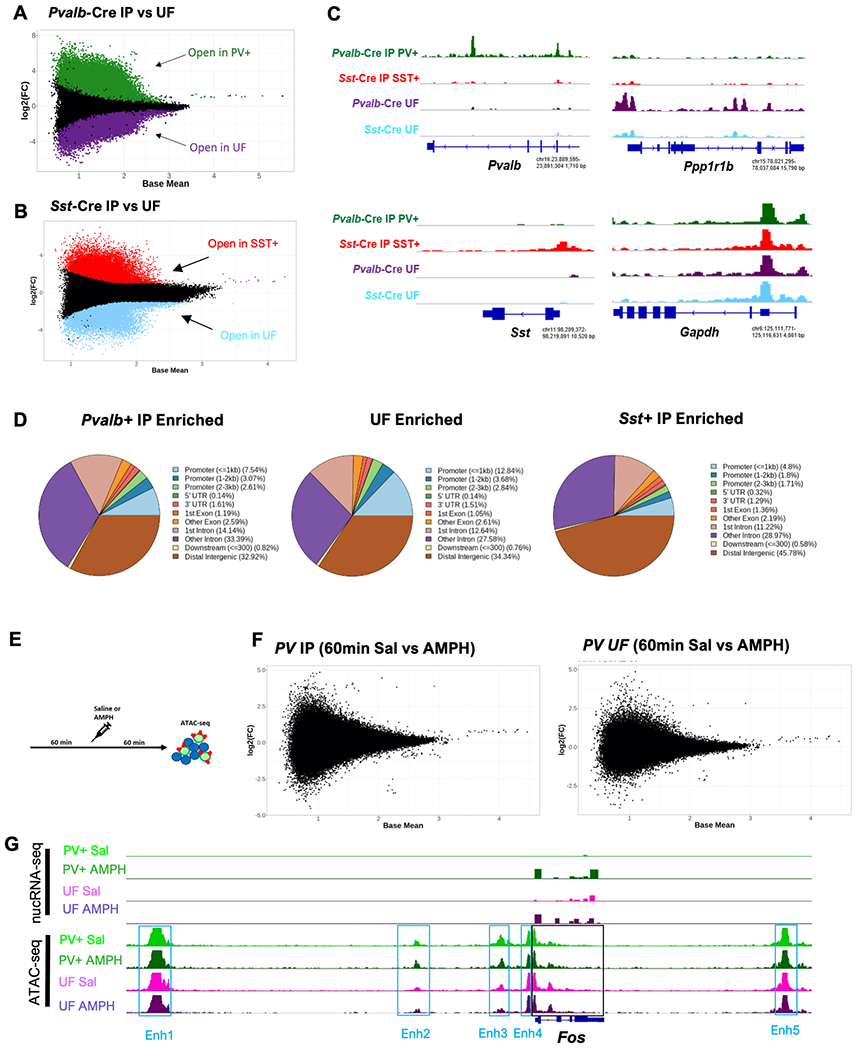
A-B) MA plots of cell-type specific differential chromatin accessibility in each population of isolated nuclei *FDR<0.05. Pvalb-Cre IP vs Pvalb-Cre UF, green points indicate regions significantly differentially accessible in PV+ nuclei; purple points indicate regions significantly differentially accessible in Pvalb-Cre UF nuclei (A); Sst-Cre IP, red Sst-Cre IP vs Sst-Cre UF, red points indicate regions significantly differentially accessible in SST+ nuclei; blue points indicate regions significantly differentially accessible in Sst-Cre UF nuclei (B). C) Example tracks of cell-type specific accessible regions in the vicinity of cell-type marker genes in each isolated cell fraction. Gapdh track included as a commonly accessible reference gene in all cell types. Y-axis is consistent across all tracks for each gene. D) Pie chart depicting relative genomic location (Promoter, Gene body/Intragenic, Downstream, or Distal Intergenic) of cell type specific (Pvalb-Cre IP, Sst-Cre IP, Combined UF) differentially accessible chromatin regions enriched in each fraction. E) Experimental timeline. Mice received an injection of saline (Sal) or amphetamine (AMPH, 3mg/kg, i.p.) after 60 min habituation in the open field. Brains were harvested 60 min later for ATAC-seq. F) MA plots of AMPH-induced differential chromatin accessibility in each population of isolated nuclei 60 min post administration *FDR<0.05; Pvalb-Cre IP n=4/treatment condition, Pvalb-Cre UF n=4/treatment condition. G) Merged genomic tracks of nuc-RNAseq and ATAC-seq from Sal control and AMPH-treated samples on and in the vicinity of the Fos gene. nucRNA-seq tracks show AMPH-induced expression of Fos at 35min in both PV+ and UF cell populations. ATAC-seq depicts chromatin accessibility at the Fos gene (black box) and at its five known enhancer regions (blue boxes).
Some studies have reported dynamic changes in chromatin accessibility following stimuli that lead to activation of rapid PRG TFs44–46. These changes may reflect the concerted eviction of histones by RNA polymerase II (RNAPolII) during active transcription or the recruitment of rapid PRG TFs to regulatory elements driving subsequent chromatin remodeling. Given that we observed robust and overlapping programs of rapid PRG TF induction in all our NAc nuclear fractions following AMPH (Fig. 2), we asked whether this induction was associated with changes in chromatin accessibility in PV+ neurons or the corresponding SPN-enriched UF.
We administered saline or AMPH to mice in the open field and harvested PV+ neurons by INTACT 60min later (Fig. 4E, S3A). The accessibility landscape of PV+ interneurons in both conditions was comparable to that of drug-naïve mice and clearly distinguished from accessibility in the UF (Fig. S3B). However, acute AMPH exposure did not induce any substantial changes in chromatin accessibility either in PV+ interneurons or in the UF (Fig. 4F; Table S5). This stability of chromatin accessibility was evident even at known regulatory elements controlling production of rapid PRG TFs despite their AMPH-induced transcription, as shown for Fos (Fig. 4G) and other rapid PRGs (Fig S3C). To determine whether changes in chromatin accessibility might require repeated exposure to AMPH, we next performed ATAC-seq following 7d repeated AMPH exposure (Fig. S3D). 24hrs following the final AMPH administration we harvested PV+ nuclei by INTACT for ATAC-seq. This resulted in 361 differentially expressed transcripts within PV+ cells (Fig. S3F, Table S6). Six of the chronic AMPH-regulated genes that passed our significance threshold overlapped the gene set induced at 3hr after acute AMPH (Enox1, Gria1, Mfsd14b, Pde10a, Snd1, Zdhhc14). Moreover, RRHO revealed an expanded list of 62 genes showing significant concordance in the AMPH-treated quadrant suggesting persistent changes in transcription following repeated AMPH-exposure (Fig. S3G, Table S6). Nonetheless, we again observed no substantial changes in chromatin accessibility in either the PV+ or the UF fractions after repeated AMPH exposure (Fig. S3H; Table S7).
Single-nucleus RNA-Seq of PV+ nuclei reveals rapid PRG induction in multiple PV+ subtypes
By immunostaining we found that only a small percentage of PV+ neurons (~15%) show robust, AMPH-dependent increases in Fos protein (Fig. S4A,B). We thus considered the possibility that heterogeneity in our purified PV+ nuclear fraction could mask chromatin accessibility dynamics in a subset. To determine whether molecularly identifiable PV+ neuron subtypes were distinguishable within our purified population, we used fluorescence-activated nuclear sorting (FANS) to isolate Sun1-GFP tagged nuclei from Pvalb-Cre mice for single nuclear RNA sequencing (snRNA-seq). We harvested and pooled NAc nuclei from mice (Sal n=3, AMPH n=4) 35min following an injection of saline or AMPH (Fig. S4C,D). Prior to FANS, we incubated nuclei from each condition with unique lipid-modified oligonucleotides (LMOs)22 to allow for multiplexing and post-hoc bioinformatic identification of nuclei from saline and AMPH-treated mice.
After filtering, we successfully recovered 1456 nuclei with a mean read depth of 6,370 counts per nucleus and a median 2,827 genes sequenced per nucleus (Fig. S4E; Table S8). We performed dimensionality reduction via principal components analysis (PCA) and generated a UMAP defining 9 clusters with Pvalb+ nuclei (Fig. 5A,B; Fig. S4E–H). These clusters all expressed the GABA synthesizing enzyme Gad1, which is enriched in PV+ interneurons47 (Fig. S4I). None of the final clusters contained the glial markers Gfap/Sox10, or the SPN marker Ppp1r1b, indicating that we had little contamination from other major cell types of the NAc.
Figure 5: Single nucleus RNA-seq reveals molecular heterogeneity of PV+ interneurons in the NAc.

A) Nine-cluster final UMAP projection of snRNA-seq data from Pvalb-Cre nuclei isolated with FANS; n= 1687 nuclei after initial count/UMI quality filtration, removal of off-target preliminary clusters 4 and 7, normalization, scaling, and dimensionality reduction. B) Violin plot of Pvalb log-normalized expression levels in nuclei across the 9 final UMAP projection clusters. C) Violin plots of log-normalized expression levels of Adarb2 and Gpc5 in nuclei across the 9 final UMAP projection clusters. D) Fluorescent in situ hybridization using probes against Pvalb and Adarb2 in the mouse NAc exhibiting partial colocalization of Pvalb and Adarb2 RNA in single cells; Yellow circles indicate Pvalb/Adarb2 co-positive cells, white circles indicate Pvalb+/Adarb2− cells. E-F) Violin plots of log-normalized expression levels of Pvalb, Fos, and Npas4 in nuclei confirmed positive for Multi-seq LMO 5 (E, Sal treated n=134) or LMO6 (F, AMPH-treated, n=363). G) Feature plots depicting nuclei with detectable transcripts of various PRGs across the 9 final UMAP projection clusters. H) Violin plot of log-normalized expression levels of Pvalb, Adarb2, and Gpc5 in nuclei confirmed positive for Multi-seq LMO 6 (AMPH) in two-cluster UMAP projection of snRNA-seq data from Pvalb-Cre nuclei. Neg, Adarb2−; Pos, Adarb2+. I) Violin plot of log-normalized expression levels of various PRGs in two-cluster UMAP projection of snRNA-seq data from Pvalb-Cre nuclei confirmed positive for Multi-seq LMO 6 (AMPH) clustered as in H.
Two of the top genes contributing the greatest cell-to-cell variance across the Pvalb-expressing clusters were Adenosine Deaminase RNA Specific B2 (Adarb2) and cell surface heparan sulfate proteoglycan Glypican-5 (Gpc5) (Fig. 5C), both of which were most highly expressed in cluster 4. It was surprising to find Adarb2 coexpressed in Pvalb+ neurons, because Adarb2 has been characterized as a marker of cortical interneurons that originate from the caudal ganglionic eminence during development, whereas Pvalb+ neurons are thought to originate from the medial ganglion eminence48. We used FISH on coronal sections of NAc from mouse brain to confirm coexpression of Adarb2 in this novel subset of Pvalb+ interneurons (Fig. 5D), whereas no colocalization was observed in cortex from the same mice (Fig. S4M). We subset our final nuclei into Adarb2+/− identities and performed differential expression analysis to identify transcripts significantly differentially expressed between these two predefined clusters (Table S8).
To determine whether AMPH-dependent gene induction was occurring within specific subsets of PV+ neurons, we deconvolved the Multi-seq barcodes to confirm that we could detect induction of rapid PRG TFs in nuclei of AMPH-exposed mice in our snRNA-seq data. The LMO barcodes were successfully amplified in a subset of our sequenced libraries allowing us to confirm enrichment of rapid PRGs in nuclei of AMPH-exposed mice relative to saline (n=134 Sal, n=363 AMPH) (Fig. 5E,F; Fig. S4K,L). We observed expression of rapid PRGs in all clusters (Fig. 5G). We then created identities to subset our final, PV-enriched nuclei into Adarb2+/− groups (Fig. 5H), however, with the sole exception of Fos, which was slightly enriched in the Adarb2+ population, expression of rapid PRGs was not significantly different between either subset (Fig. 5I, Table S8). These data confirm that a fraction of PV+ neurons in the NAc respond to AMPH with a rapid PRG transcriptional response. However, this fraction is not a transcriptionally defined subset of PV+ interneurons, suggesting it is more likely to be a result of differential functional or developmental connectivity.
Cell-type specific transcriptional regulation of AMPH-dependent genes
Although we saw no AMPH-dependent changes in chromatin accessibility, we did observe cell-type specific regions of accessible chromatin between our isolated cell types that correlated with cell-type specific AMPH-dependent transcriptional regulation (Fig. 6A). We thus asked if the unique landscapes of cell-type specific chromatin accessibility in NAc could reveal differential binding sites for TFs that mediate cell-type specific transcriptional responses to AMPH.
Figure 6: Motif analysis of differentially accessible chromatin near AMPH-regulated genes suggests transcriptional mechanisms of gene regulation in NAc neurons.

A) Merged genomic tracks of nuc-RNAseq and ATAC-seq from Sal control only (ATAC) or Sal and AMPH-treated samples (nuc-RNAseq) in the vicinity of the Cntnap4 gene. nucRNA-seq tracks show significant AMPH-induction of Cntnap4 RNA specific to the PV+ cell population. ATAC-seq depicts regions within the Cntnap4 gene significantly differentially accessible within PV+ interneurons (Pvalb-Cre IP) outlined in blue. B-D) Enriched Transcription Factor Motifs as determined by HOMER at cell-type-unique differentially accessible inter- (+/− 50Kb) and intragenic chromatin regions at genes induced by AMPH at 3hrs in each cell fraction, *q<0.05. We assessed if the cognate TFs predicted to bind these motifs were differentially expressed in the cell types where the chromatin was selectively accessible, and log2FC (x-axis) refers to the relative expression of those TFs in the cell type of interest compared with the other fraction; Pvalb-Cre IP vs UF (B), Sst-Cre IP vs UF (C), Combined UF vs Combined IP (Pvalb-Cre+Sst-Cre IP)(D).
For all the genes induced in PV+, SST+, or the UF at 3hr post AMPH, we identified regions of differential chromatin accessibility between cell types at promoters (transcription start site ± 1kb) and putative enhancers (gene body ± 50kb, excluding the promoter). We searched these regions for enriched TF binding motifs, matched the motifs to TF families (Fig. S5A) and then identified those TFs that showed cell-type enriched (Fig. 6B–D) or AMPH-regulated expression (Fig. S5B–D) in the cell type that displayed open chromatin relative to other NAc cell types.
We found more diversity of TF binding sites in the enhancers compared with the promoter regions, consistent with prior evidence that intragenic and distal enhancers are major regulators of cell-type specific gene expression5. In all three cell types we identified enrichment of binding sites for multiple TFs that show cell-type specific expression (Table S9). TCF4 was a top hit in both PV+ and SST+ neurons (Fig. 6B,C). Although TCF4 is broadly expressed in the cortex, within striatal regions its expression is limited to GABAergic interneurons49. PV+-specific enhancers also show enrichment for ETV150, a TF also on our list of concordant delayed (3hr) and chronic AMPH-regulated transcripts. By contrast, differentially accessible enhancers in the UF fraction showed enrichment of binding sites for members of the RFX and MEF251 families of TFs among others (Fig. 6D). Rfx1,3, and 4 are enriched in the UF fraction relative to the interneuron populations (Fig. 6D; Table S1) and Rfx4 is rapidly induced by AMPH in the UF (Fig. S5D; Table S2).
These data suggest that the differential pattern of accessible enhancers near AMPH-regulated genes is maintained by cell-type specific control of the expression of TFs some of which are targets of regulation by psychostimulant-induced signaling cascades. We also found enrichment of binding sites in for rapid PRG TFs of the Fos, Jun, and Egr families (Fig. S5B–D), suggesting, as has been previously proposed, that these ubiquitous TFs work together with cell-type specific TFs to amplify programs of stimulus-regulated gene transcription52. The rapid induction of these TFs may drive the later cell-type specific programs of gene transcription by acting at cell-type specific sites of accessibility.
Regulation of PV+ neuron gene regulation in MeCP2 Ser421Ala knockin mice
Finally, to begin to determine which genes in PV+ interneurons might contribute to behavioral responses to drugs of abuse, we assessed PV+ neuron gene expression in the NAc of MeCP2 Ser421Ala KI mice. These mice show both behavioral hypersensitivity to psychostimulants and altered AMPH-regulated Fos expression in NAc PV+ interneurons11, thus we hypothesized that gene expression differences in PV+ interneurons of these mice could reveal genes important for addictive-like behaviors. We used the RiboTag method23, crossing Cre-inducible HA-Rpl22 RiboTag mice with Pvalb-2A-Cre mice, to enrich for actively translating mRNAs from NAc PV+ neurons of MeCP2 WT and Ser421Ala KI mice (Fig. 7A). We confirmed co-expression of the HA tagged ribosomal subunit with PV in the NAc (Fig. 7B). We confirmed enrichment of Pvalb mRNA in the immunoprecipitated fraction from both MeCP2 WT and Ser421Ala KI mice relative to input (Fig. 7C) and saw significant concordance by RRHO between the actively translating RNAs recovered by RiboTag from PV+ neurons of the Mecp2 mice with the nuclear transcripts enriched from PV+ neurons of the INTACT mice (Fig. 7D). These data support the use of the comparison to this model as a method for cross-validating the functional relevance of PV+ enriched, AMPH-regulated genes. We found 1082 transcripts differentially expressed in the PV+ interneurons of MeCP2 Ser421Ala KI mice compared with their WT littermates (Fig. 7E; Fig. S6A; Table S10). PV+ neurons of the MeCP2 Ser421Ala KI mice showed elevated expression of the PV-specific, AMPH-inducible genes Cntnap4, Clstn2, and Acan (Fig. 7F–J; Table S10), whereas expression of the canonical housekeeping gene Gapdh did not differ by genotype (Fig. S6B–C). Taken together, these data support our identification of synaptic cell-adhesion gene products as promising candidates to modulate behaviorally-relevant connectivity of PV+ interneurons following exposure to psychostimulants.
Figure 7: Gene regulation in NAc PV+ neurons of MeCP2 Ser421Ala knockin mice.

A) Depiction of Pvalb-2A-Cre-dependent HA tagging to Rpl22 for cell-type specific (PV+) isolation of actively translating mRNA. B) IHC for colocalization of the HA tag on Rpl22 with expression of PV protein in the NAc. Scale bar 25μm. C) Representative genomic tracks at the Pvalb gene of WT and S421 KI IP and Input fractions demonstrating significant enrichment of Pvalb RNA in the IP conditions. Gapdh gene track included as a commonly expressed reference gene in all fractions. Y-axis is consistent across all tracks for each gene. D) RRHO visualizing the strength of concordance in gene expression in PV+ cells as measured by INTACT nucRNA-Seq (y-axis) IP versus UF and Ribotag (x-axis) IP versus input. E) Volcano Plot of differentially dysregulated genes between MeCP2 WT vs KI immunoprecipitated fractions (IP) in naïve mice; Black dots, not significant; colored dots (dark green, WT; light green S421A KI), FDR<0.1; n=15/genotype, pooled into 3 replicates of 5 mice each. F) Representative genomic tracks at the nucRNA-seq AMPH-induced genes Acan and Cntnap4 of WT and Ser421Ala (S421A) KI IP and Input fractions. G) Representative image of FISH targeting Pvalb, Ppp1r1b, and Cntnap4 mRNA. H) smFISH quantification of Cntnap4 transcript number in Pvalb+ or Ppp1r1b+ nuclei (n=34 WT PV, 37 KI PV+ nuclei, 24 WT SPN nuclei, 24 KI SPN nuclei); Two-way ANOVA, F (1, 117) = 8.943, *p=0.0034, Bonferroni post-hoc Pvalb WT vs S421A p=.0226. I) Representative image of FISH targeting Pvalb and Acan mRNA. J) smFISH quantification of Acan transcript number in Pvalb+ or Ppp1r1b+ nuclei (n=21 WT Pvalb+, 20 KI Pvalb+ nuclei, 37 WT Ppp1r1b+ nuclei, 28 KI Ppp1r1b+ nuclei) Two-way ANOVA, F (1, 102) = 13.47, *p=0.0004, Bonferroni post-hoc Pvalb+ WT vs S421A p<.0001.
Discussion
Here we conducted cell-type specific RNA and chromatin sequencing to identify the in vivo gene regulatory responses induced by AMPH in NAc interneurons. Our data show that transcriptional changes induced by AMPH diverge between different GABAergic cell-types in the NAc. We did not observe dynamic changes in chromatin accessibility following AMPH exposure, however we did see that differential accessibility of transcriptional enhancers correlates with cell-type specific responses to AMPH. Finally, we identified genes selectively regulated by AMPH in PV+ neurons that also show altered expression in a mutant mouse strain that shows hypersensitivity to psychostimulants, suggesting potential for the functional importance of these gene expression programs in the expression of addictive-like behaviors.
Artificially changing the activity of NAc PV+ interneurons modulates the expression of addictive-like behaviors16, 17, however whether this associated with transcriptional plasticity was unknown. A few recent studies have profiled stimulus-induced gene transcription in cortical and NAc neurons at the level of single cells, but they were limited in their ability to discern gene regulation in any but the most abundant cell types53, 54. By using INTACT to purify rare cell types out of heterogeneous brain tissue, our data now identify hundreds of genes in NAc PV+ and SST+ interneurons that show significant and cell-type selective changes in their expression following acute or repeated AMPH exposure. These data suggest that even similar kinds of neurons experience distinct forms of cellular plasticity in response to a common stimulus, extending results of previous studies comparing more diverse cell types30, 37.
Examination of the PV+ specific AMPH-regulated gene expression program shows induction of cell adhesion proteins that localize to both pre- and postsynaptic sites. Taken together with the evidence that PV+ neurotransmitter release is positively correlated with the expression of addictive-like behaviors16, 17, these data suggest that PV+ interneurons may enhance their connectivity within NAc circuits following psychostimulant exposure. We validated PV+ interneuron specific induction of Cntnap4, a member of the neurexin superfamily that functions in presynaptic PV+ interneuron terminals to promote inhibitory synaptic strength by limiting the size of the synaptic cleft40. We observed PV+ specific induction of Acan, encoding aggrecan, a PNN component that plays an important role in organizing postsynaptic protein complexes in PV+ neurons38, 55. Expression of these genes is elevated in PV+ neurons of AMPH-naïve MeCP2 Ser421Ala KI mice compared with their WT littermates, providing a potential mechanism for the enhanced behavioral sensitivity of these mice to psychostimulant drugs of abuse. A prior study using FANS to isolate SST+ nuclei from the NAc also observed regulation of the cell adhesion genes Ank3 and Nrcam after chronic cocaine exposure8. Like PV+ neurons, NAc SST+ interneuron activity is positively associated with the expression of locomotor sensitization and conditioned place preference after cocaine8, suggesting that enhancing local inhibition in the NAc could be a common circuit mechanism of addictive-like behaviors even if the molecular mediators of that state differ by interneuron cell type.
Although we observed largely cell-type specific programs of gene regulation by AMPH, many of the genes whose expression changed following AMPH exposure were expressed under control conditions in more than one NAc cell type. We validated by smFISH that Cntnap4 is expressed in both Ppp1r1b+ SPNs and Pvalb+ interneurons of the NAc but only induced by AMPH in the Pvalb+ population. We also find genes such as Acan that are expressed in both PV+ and SST+ neurons, but only AMPH-induced in PV+ neurons.
Our chromatin data suggest that the differential accessibility of intra- and intergenic enhancers, rather than gene promoters, underlies the differences in the AMPH responsivity of genes between cell types5. The link between enhancer activity and chromatin accessibility reflects the differential binding of TFs at these regulatory elements. Indeed, when we examined the DNA sequences of putative enhancers near our cell-type specific AMPH-regulated genes, we observed enrichment of binding sites for numerous TFs that display cell-type specific patterns of expression. In this manner, the pattern of available enhancers would be permissive for the ability of a gene to show stimulus-dependent regulation. However, these differentially accessible regions were also enriched for binding sites for rapid PRG TFs, suggesting that the common induction of this rapid program in all AMPH responsive cells could instruct differential programs of stimulus responsive transcription by collaborating with cell-type specific TFs, similar to the mechanisms proposed for neuronal activity-dependent regulation of development56.
Some studies have shown intriguing evidence that activity-dependent induction of rapid PRG TFs can drive the formation of new regions of accessible chromatin, leaving a lasting mark on the chromatin landscape that could potentially function as a form of epigenetic memory44–46. We did not find significant changes in chromatin accessibility in PV+ interneuron nuclei or the SPN-enriched nuclei of the UF either following acute or repeated AMPH, though we cannot rule out that these changes could have occurred in a small subset of neurons. However, accessibility is only one measure of chromatin state. Previously we have shown that Ser421 phosphorylation of the methyl-DNA binding protein MeCP2 is selectively induced in NAc PV+ neurons following AMPH exposure9, and here we have identified a program of gene expression that is dysregulated in NAc PV+ neurons of mice bearing a non-phosphorylatable Ser421Ala mutation knocked into the Mecp2 gene. MeCP2 is highly abundant in neurons, and it binds globally across CpG and CpA methylated regions of the genome yet acts locally at transcription start sites to control transcriptional initiation57, 58. Future studies using measures of chromatin state or structure that can be scaled to the single cell level59, 60 offer a promising approach to discovering novel mechanisms of AMPH-dependent chromatin regulation in NAc interneurons.
Supplementary Material
Acknowledgments:
We thank Xiaoting Wang, Alexias Safi, and Greg Crawford for assistance with experiments. We thank Chris McGinnis for assistance in disambiguating Multi-seq LMOs. The Duke University School of Medicine Sequencing and Genomic Technologies Shared Resource provided sequencing services and the Duke University Mouse Behavioral and Neuroendocrine Analysis Core Facility provided equipment and support for the mouse behavioral studies. FANS was performed in the Immunology Unit of the Regional Biocontainment Laboratory at Duke, which receives support from NIH grant UC6-AI058607. This work was supported by NIH grants R01DA047115 and R33DA041878 (A.E.W.).
Footnotes
Competing Interests: The authors declare no competing interests.
References
- 1.Hyman SE, Malenka RC, Nestler EJ. Neural mechanisms of addiction: the role of reward-related learning and memory. Annu Rev Neurosci 2006; 29: 565–598. [DOI] [PubMed] [Google Scholar]
- 2.Robison AJ, Nestler EJ. Transcriptional and epigenetic mechanisms of addiction. Nat Rev Neurosci 2011; 12(11): 623–637. [DOI] [PMC free article] [PubMed] [Google Scholar]
- 3.Feng J, Shao N, Szulwach KE, Vialou V, Huynh J, Zhong C et al. Role of Tet1 and 5-hydroxymethylcytosine in cocaine action. Nature Neuroscience 2015; 18: 536–544. [DOI] [PMC free article] [PubMed] [Google Scholar]
- 4.Lopez AJ, Siciliano CA, Calipari ES. Activity-Dependent Epigenetic Remodeling in Cocaine Use Disorder. Handbook of experimental pharmacology 2020; 258: 231–263. [DOI] [PubMed] [Google Scholar]
- 5.Nord AS, West AE. Neurobiological functions of transcriptional enhancers. Nat Neurosci 2020; 23(1): 5–14. [DOI] [PMC free article] [PubMed] [Google Scholar]
- 6.Tepper JM, Tecuapetla F, Koos T, Ibanez-Sandoval O. Heterogeneity and diversity of striatal GABAergic interneurons. Front Neuroanat 2010; 4: 150. [DOI] [PMC free article] [PubMed] [Google Scholar]
- 7.Witten IB, Lin SC, Brodsky M, Prakash R, Diester I, Anikeeva P et al. Cholinergic interneurons control local circuit activity and cocaine conditioning. Science 2010; 330(6011): 1677–1681. [DOI] [PMC free article] [PubMed] [Google Scholar]
- 8.Ribeiro EA, Salery M, Scarpa JR, Calipari ES, Hamilton PJ, Ku SM et al. Transcriptional and physiological adaptations in nucleus accumbens somatostatin interneurons that regulate behavioral responses to cocaine. Nature communications 2018; 9(1): 3149. [DOI] [PMC free article] [PubMed] [Google Scholar]
- 9.Deng JV, Rodriguiz RM, Hutchinson AN, Kim I-H, Wetsel WC, West AE. MeCP2 in the nucleus accumbens contributes to neural and behavioral responses to psychostimulants. Nature Neuroscience 2010; 13(9): 1128–1136. [DOI] [PMC free article] [PubMed] [Google Scholar]
- 10.Cohen S, Gabel HW, Hemberg M, Hutchinson AN, Sadacca LA, Ebert DH et al. Genome-Wide Activity-Dependent MeCP2 Phosphorylation Regulates Nervous System Development and Function. Neuron 2011; 72(1): 72–85. [DOI] [PMC free article] [PubMed] [Google Scholar]
- 11.Deng JV, Wan Y, Wang X, Cohen S, Wetsel WC, Greenberg ME et al. MeCP2 phosphorylation limits psychostimulant-induced behavioral and neuronal plasticity. J Neurosci 2014; 34(13): 4519–4527. [DOI] [PMC free article] [PubMed] [Google Scholar]
- 12.Koos T, Tepper JM. Inhibitory control of neostriatal projection neurons by GABAergic interneurons. Nat Neurosci 1999; 2(5): 467–472. [DOI] [PubMed] [Google Scholar]
- 13.Schall TA, Wright WJ, Dong Y. Nucleus accumbens fast-spiking interneurons in motivational and addictive behaviors. Mol Psychiatry 2021; 26(1): 234–246. [DOI] [PMC free article] [PubMed] [Google Scholar]
- 14.Wiltschko AB, Pettibone JR, Berke JD. Opposite effects of stimulant and antipsychotic drugs on striatal fast-spiking interneurons. Neuropsychopharmacology 2010; 35(6): 1261–1270. [DOI] [PMC free article] [PubMed] [Google Scholar]
- 15.Winters BD, Kruger JM, Huang X, Gallaher ZR, Ishikawa M, Czaja K et al. Cannabinoid receptor 1-expressing neurons in the nucleus accumbens. Proc Natl Acad Sci U S A 2012; 109(40): E2717–2725. [DOI] [PMC free article] [PubMed] [Google Scholar]
- 16.Yu J, Yan Y, Li KL, Wang Y, Huang YH, Urban NN et al. Nucleus accumbens feedforward inhibition circuit promotes cocaine self-administration. Proc Natl Acad Sci U S A 2017. [DOI] [PMC free article] [PubMed] [Google Scholar]
- 17.Wang X, Gallegos DA, Pogorelov VM, O’Hare JK, Calakos N, Wetsel WC et al. Parvalbumin Interneurons of the Mouse Nucleus Accumbens are Required For Amphetamine-Induced Locomotor Sensitization and Conditioned Place Preference. Neuropsychopharmacology 2018; 43(5): 953–963. [DOI] [PMC free article] [PubMed] [Google Scholar]
- 18.Trouche S, Koren V, Doig NM, Ellender TJ, El-Gaby M, Lopes-Dos-Santos V et al. A Hippocampus-Accumbens Tripartite Neuronal Motif Guides Appetitive Memory in Space. Cell 2019; 176(6): 1393–1406 e1316. [DOI] [PMC free article] [PubMed] [Google Scholar]
- 19.Mo A, Mukamel EA, Davis FP, Luo C, Henry GL, Picard S et al. Epigenomic Signatures of Neuronal Diversity in the Mammalian Brain. Neuron 2015; 86(6): 1369–1384. [DOI] [PMC free article] [PubMed] [Google Scholar]
- 20.Cahill KM, Huo Z, Tseng GC, Logan RW, Seney ML. Improved identification of concordant and discordant gene expression signatures using an updated rank-rank hypergeometric overlap approach. Sci Rep 2018; 8(1): 9588. [DOI] [PMC free article] [PubMed] [Google Scholar]
- 21.Corces MR, Trevino AE, Hamilton EG, Greenside PG, Sinnott-Armstrong NA, Vesuna S et al. An improved ATAC-seq protocol reduces background and enables interrogation of frozen tissues. Nat Methods 2017; 14(10): 959–962. [DOI] [PMC free article] [PubMed] [Google Scholar]
- 22.McGinnis CS, Patterson DM, Winkler J, Conrad DN, Hein MY, Srivastava V et al. MULTI-seq: sample multiplexing for single-cell RNA sequencing using lipid-tagged indices. Nat Methods 2019; 16(7): 619–626. [DOI] [PMC free article] [PubMed] [Google Scholar]
- 23.Sanz E, Yang L, Su T, Morris DR, McKnight GS, Amieux PS. Cell-type-specific isolation of ribosome-associated mRNA from complex tissues. Proc Natl Acad Sci U S A 2009; 106(33): 13939–13944. [DOI] [PMC free article] [PubMed] [Google Scholar]
- 24.Chen R, Blosser TR, Djekidel MN, Hao J, Bhattacherjee A, Chen W et al. Decoding molecular and cellular heterogeneity of mouse nucleus accumbens. Nat Neurosci 2021. Onine ahead of print. DOI: 10.1038/s41593-021-00938-x. [DOI] [PMC free article] [PubMed] [Google Scholar]
- 25.Gokce O, Stanley GM, Treutlein B, Neff NF, Camp JG, Malenka RC et al. Cellular Taxonomy of the Mouse Striatum as Revealed by Single-Cell RNA-Seq. Cell Rep 2016; 16(4): 1126–1137. [DOI] [PMC free article] [PubMed] [Google Scholar]
- 26.Bakken TE, Hodge RD, Miller JA, Yao Z, Nguyen TN, Aevermann B et al. Single-nucleus and single-cell transcriptomes compared in matched cortical cell types. PLoS One 2018; 13(12): e0209648. [DOI] [PMC free article] [PubMed] [Google Scholar]
- 27.Massengill JL, Smith MA, Son DI, O’Dowd DK. Differential expression of K4-AP currents and Kv3.1 potassium channel transcripts in cortical neurons that develop distinct firing phenotypes. J Neurosci 1997; 17(9): 3136–3147. [DOI] [PMC free article] [PubMed] [Google Scholar]
- 28.Jaglin XH, Hjerling-Leffler J, Fishell G, Batista-Brito R. The origin of neocortical nitric oxide synthase-expressing inhibitory neurons. Front Neural Circuits 2012; 6: 44. [DOI] [PMC free article] [PubMed] [Google Scholar]
- 29.Tyssowski KM, DeStefino NR, Cho JH, Dunn CJ, Poston RG, Carty CE et al. Different Neuronal Activity Patterns Induce Different Gene Expression Programs. Neuron 2018; 98(3): 530–546 e511. [DOI] [PMC free article] [PubMed] [Google Scholar]
- 30.Whitney O, Pfenning AR, Howard JT, Blatti CA, Liu F, Ward JM et al. Core and region-enriched networks of behaviorally regulated genes and the singing genome. Science 2014; 346(6215): 1256780. [DOI] [PMC free article] [PubMed] [Google Scholar]
- 31.Penrod RD, Thomsen M, Taniguchi M, Guo Y, Cowan CW, Smith LN. The activity-regulated cytoskeleton-associated protein, Arc/Arg3.1, influences mouse cocaine self-administration. Pharmacol Biochem Behav 2020; 188: 172818. [DOI] [PMC free article] [PubMed] [Google Scholar]
- 32.Szumlinski KK, Dehoff MH, Kang SH, Frys KA, Lominac KD, Klugmann M et al. Homer proteins regulate sensitivity to cocaine. Neuron 2004; 43(3): 401–413. [DOI] [PubMed] [Google Scholar]
- 33.Wang Z, Edwards JG, Riley N, Provance DW Jr., Karcher R, Li XD et al. Myosin Vb mobilizes recycling endosomes and AMPA receptors for postsynaptic plasticity. Cell 2008; 135(3): 535–548. [DOI] [PMC free article] [PubMed] [Google Scholar]
- 34.Dong Z, Chen W, Chen C, Wang H, Cui W, Tan Z et al. CUL3 Deficiency Causes Social Deficits and Anxiety-like Behaviors by Impairing Excitation-Inhibition Balance through the Promotion of Cap-Dependent Translation. Neuron 2020; 105(3): 475–490 e476. [DOI] [PMC free article] [PubMed] [Google Scholar]
- 35.Cho KI, Haque M, Wang J, Yu M, Hao Y, Qiu S et al. Distinct and atypical intrinsic and extrinsic cell death pathways between photoreceptor cell types upon specific ablation of Ranbp2 in cone photoreceptors. PLoS Genet 2013; 9(6): e1003555. [DOI] [PMC free article] [PubMed] [Google Scholar]
- 36.King IF, Yandava CN, Mabb AM, Hsiao JS, Huang HS, Pearson BL et al. Topoisomerases facilitate transcription of long genes linked to autism. Nature 2013; 501(7465): 58–62. [DOI] [PMC free article] [PubMed] [Google Scholar]
- 37.Spiegel I, Mardinly AR, Gabel HW, Bazinet JE, Couch CH, Tzeng CP et al. Npas4 regulates excitatory-inhibitory balance within neural circuits through cell-type-specific gene programs. Cell 2014; 157(5): 1216–1229. [DOI] [PMC free article] [PubMed] [Google Scholar]
- 38.Rowlands D, Lensjo KK, Dinh T, Yang S, Andrews MR, Hafting T et al. Aggrecan Directs Extracellular Matrix-Mediated Neuronal Plasticity. J Neurosci 2018; 38(47): 10102–10113. [DOI] [PMC free article] [PubMed] [Google Scholar]
- 39.Lasek AW, Chen H, Chen WY. Releasing Addiction Memories Trapped in Perineuronal Nets. Trends Genet 2018; 34(3): 197–208. [DOI] [PMC free article] [PubMed] [Google Scholar]
- 40.Karayannis T, Au E, Patel JC, Kruglikov I, Markx S, Delorme R et al. Cntnap4 differentially contributes to GABAergic and dopaminergic synaptic transmission. Nature 2014; 511(7508): 236–240. [DOI] [PMC free article] [PubMed] [Google Scholar]
- 41.Dickel DE, Ypsilanti AR, Pla R, Zhu Y, Barozzi I, Mannion BJ et al. Ultraconserved Enhancers Are Required for Normal Development. Cell 2018; 172(3): 491–499 e415. [DOI] [PMC free article] [PubMed] [Google Scholar]
- 42.Frank CL, Liu F, Wijayatunge R, Song L, Biegler MT, Yang MG et al. Regulation of chromatin accessibility and Zic binding at enhancers in the developing cerebellum. Nat Neurosci 2015; 18(5): 647–656. [DOI] [PMC free article] [PubMed] [Google Scholar]
- 43.Song L, Zhang Z, Grasfeder LL, Boyle AP, Giresi PG, Lee BK et al. Open chromatin defined by DNaseI and FAIRE identifies regulatory elements that shape cell-type identity. Genome Res 2011; 21(10): 1757–1767. [DOI] [PMC free article] [PubMed] [Google Scholar]
- 44.Su Y, Shin J, Zhong C, Wang S, Roychowdhury P, Lim J et al. Neuronal activity modifies the chromatin accessibility landscape in the adult brain. Nat Neurosci 2017; 20(3): 476–483. [DOI] [PMC free article] [PubMed] [Google Scholar]
- 45.Fernandez-Albert J, Lipinski M, Lopez-Cascales MT, Rowley MJ, Martin-Gonzalez AM, Del Blanco B et al. Immediate and deferred epigenomic signatures of in vivo neuronal activation in mouse hippocampus. Nat Neurosci 2019; 22(10): 1718–1730. [DOI] [PMC free article] [PubMed] [Google Scholar]
- 46.Marco A, Meharena HS, Dileep V, Raju RM, Davila-Velderrain J, Zhang AL et al. Mapping the epigenomic and transcriptomic interplay during memory formation and recall in the hippocampal engram ensemble. Nat Neurosci 2020; 23(12): 1606–1617. [DOI] [PMC free article] [PubMed] [Google Scholar]
- 47.Kawaguchi Y, Wilson CJ, Augood SJ, Emson PC. Striatal interneurones: chemical, physiological and morphological characterization. Trends Neurosci 1995; 18(12): 527–535. [DOI] [PubMed] [Google Scholar]
- 48.Yuste R, Hawrylycz M, Aalling N, Aguilar-Valles A, Arendt D, Arnedillo RA et al. A community-based transcriptomics classification and nomenclature of neocortical cell types. Nat Neurosci 2020; 23(12): 1456–1468. [DOI] [PMC free article] [PubMed] [Google Scholar]
- 49.Kim H, Berens NC, Ochandarena NE, Philpot BD. Region and Cell Type Distribution of TCF4 in the Postnatal Mouse Brain. Front Neuroanat 2020; 14: 42. [DOI] [PMC free article] [PubMed] [Google Scholar]
- 50.Dehorter N, Ciceri G, Bartolini G, Lim L, del Pino I, Marin O. Tuning of fast-spiking interneuron properties by an activity-dependent transcriptional switch. Science 2015; 349(6253): 1216–1220. [DOI] [PMC free article] [PubMed] [Google Scholar]
- 51.Pulipparacharuvil S, Renthal W, Hale CF, Taniguchi M, Xiao G, Kumar A et al. Cocaine regulates MEF2 to control synaptic and behavioral plasticity. Neuron 2008; 59(4): 621–633. [DOI] [PMC free article] [PubMed] [Google Scholar]
- 52.Fonseca GJ, Tao J, Westin EM, Duttke SH, Spann NJ, Strid T et al. Diverse motif ensembles specify non-redundant DNA binding activities of AP-1 family members in macrophages. Nature communications 2019; 10(1): 414. [DOI] [PMC free article] [PubMed] [Google Scholar]
- 53.Savell KE, Tuscher JJ, Zipperly ME, Duke CG, Phillips RA 3rd, Bauman AJ et al. A dopamine-induced gene expression signature regulates neuronal function and cocaine response. Sci Adv 2020; 6(26): eaba4221. [DOI] [PMC free article] [PubMed] [Google Scholar]
- 54.Hrvatin S, Hochbaum DR, Nagy MA, Cicconet M, Robertson K, Cheadle L et al. Single-cell analysis of experience-dependent transcriptomic states in the mouse visual cortex. Nat Neurosci 2018; 21(1): 120–129. [DOI] [PMC free article] [PubMed] [Google Scholar]
- 55.Favuzzi E, Marques-Smith A, Deogracias R, Winterflood CM, Sanchez-Aguilera A, Mantoan L et al. Activity-Dependent Gating of Parvalbumin Interneuron Function by the Perineuronal Net Protein Brevican. Neuron 2017; 95(3): 639–655 e610. [DOI] [PubMed] [Google Scholar]
- 56.Vierbuchen T, Ling E, Cowley CJ, Couch CH, Wang X, Harmin DA et al. AP-1 Transcription Factors and the BAF Complex Mediate Signal-Dependent Enhancer Selection. Mol Cell 2017; 68(6): 1067–1082 e1012. [DOI] [PMC free article] [PubMed] [Google Scholar]
- 57.Clemens AW, Wu DY, Moore JR, Christian DL, Zhao G, Gabel HW. MeCP2 Represses Enhancers through Chromosome Topology-Associated DNA Methylation. Mol Cell 2020; 77(2): 279–293 e278. [DOI] [PMC free article] [PubMed] [Google Scholar]
- 58.Boxer LD, Renthal W, Greben AW, Whitwam T, Silberfeld A, Stroud H et al. MeCP2 Represses the Rate of Transcriptional Initiation of Highly Methylated Long Genes. Mol Cell 2020; 77(2): 294–309 e299. [DOI] [PMC free article] [PubMed] [Google Scholar]
- 59.Buenrostro JD, Wu B, Litzenburger UM, Ruff D, Gonzales ML, Snyder MP et al. Single-cell chromatin accessibility reveals principles of regulatory variation. Nature 2015; 523(7561): 486–490. [DOI] [PMC free article] [PubMed] [Google Scholar]
- 60.Beagrie RA, Scialdone A, Schueler M, Kraemer DC, Chotalia M, Xie SQ et al. Complex multi-enhancer contacts captured by genome architecture mapping. Nature 2017; 543(7646): 519–524. [DOI] [PMC free article] [PubMed] [Google Scholar]
Associated Data
This section collects any data citations, data availability statements, or supplementary materials included in this article.
Supplementary Materials
Data Availability Statement
RNA and ATAC sequencing data have been deposited at GEO (GSE181421). All primary data are stored on a secure server at Duke University and are available from the corresponding author.