

Summary
Bromocriptine is approved as a diabetes therapy, yet its therapeutic mechanisms remain unclear. Though bromocriptine’s actions have been mainly attributed to the stimulation of brain dopamine D2 receptors (D2R), bromocriptine also targets the pancreas. Here, we employ bromocriptine as a tool to elucidate the roles of catecholamine signaling in regulating pancreatic hormone secretion. In β-cells, bromocriptine acts on D2R and α2A-adrenergic receptor (α2A-AR) to reduce glucose-stimulated insulin secretion (GSIS). Moreover, in α-cells, bromocriptine acts via D2R to reduce glucagon secretion. α2A-AR activation by bromocriptine recruits an ensemble of G proteins with no β-arrestin2 recruitment. In contrast, D2R recruits G proteins and β-arrestin2 upon bromocriptine stimulation, demonstrating receptor-specific signaling. Docking studies reveal distinct bromocriptine binding to α2A-AR versus D2R, providing a structural basis for bromocriptine’s dual actions on β-cell α2A-AR and D2R. Together, joint dopaminergic and adrenergic receptor actions on α-cell and β-cell hormone release provide a new therapeutic mechanism to improve dysglycemia.
Subject areas: Chemistry, biological sciences, molecular biology, Endocrinology
Graphical abstract
Highlights
-
•
In β-cells, bromocriptine acts on both D2R and α2A-AR to lower insulin secretion
-
•
In α-cells, bromocriptine acts via D2R to reduce glucagon secretion
-
•
Distinct G proteins are recruited to D2R versus α2A-AR in response to bromocriptine
-
•
Bromocriptine is a G protein-biased and partial agonist at α2A-AR
Chemistry; Biological sciences; Molecular biology; Endocrinology
Introduction
Diabetes is one of the foremost health problems today. Prevalence has reached epidemic proportions as millions worldwide carry a diagnosis of diabetes mellitus, with type 2 diabetes (T2D) representing 95% of cases (Prevention, 2017). Yet, despite the many treatments for diabetes, over time, most therapies stop working and/or have serious limitations or side effects that cause treatment discontinuation or poor compliance (Krentz and Bailey, 2005; Valerón and de Pablos-Velasco, 2013). Thus, developing both new therapeutic approaches and a better understanding of diabetes pathophysiology is critical. An important clue may lie in recent evidence that dopamine (DA) signaling via DA D2-like receptors including D2 receptors (D2R) are important regulators of metabolism (Farino et al., 2020; Freyberg et al., 2017; Khelifa et al., 2021). Moreover, D2R polymorphisms are associated with insulin resistance and T2D (Barnard et al., 2009). Work also suggests that stimulating D2R with agonists can correct dysglycemia (Lopez Vicchi et al., 2016). Indeed, the D2R agonist bromocriptine is FDA-approved as a novel T2D therapy based on its efficacy in improving glycemic control (Shivaprasad and Kalra, 2011; Valiquette, 2011). Furthermore, bromocriptine mitigates dysglycemia produced by antipsychotic medications (Naguy and Al-Tajali, 2016). Indeed, timed administration of a quick-release analogue of bromocriptine, bromocriptine-QR (Cycloset), improves glycemic control in T2D by improving insulin sensitivity and glucose tolerance as well as by reducing hyperinsulinemia and hepatic glucose production (Defronzo, 2011; Liang et al., 2015). Nevertheless, many questions remain concerning the biological mechanisms by which bromocriptine restores glycemic control as well as the drug’s metabolically relevant sites of action.
Until recently, bromocriptine was mainly employed to treat disorders of the CNS including pituitary adenomas and Parkinson’s disease (Holt et al., 2010). Thus, it was assumed that bromocriptine owes its therapeutic efficacy to the augmentation of DA signaling in brain regions important for metabolic control. Most studies examining bromocriptine’s actions focused on hypothalamic targets given this region’s established roles in regulating metabolism, in part via DA signaling (Ballon et al., 2014; de Leeuw van Weenen et al., 2011a; de Leeuw van Weenen et al., 2011b; Freyberg et al., 2017; Liang et al., 2015; Raskin and Cincotta, 2016). Bromocriptine’s CNS actions also diminish sympathetic tone that ultimately reduces post-prandial plasma glucose levels and improves glycemic control (Defronzo, 2011; Liang et al., 2015). Moreover, bromocriptine therapy may correct circadian clock disturbances in T2D by restoring the normal waking rise in central dopaminergic activity (Holt et al., 2010). Nevertheless, though bromocriptine’s actions in the CNS are important, growing evidence suggests that bromocriptine also acts on dopaminergic targets outside the CNS to improve glycemic control (Wei et al., 2020).
Recent observations indicate that peripheral DA signaling in the endocrine pancreas plays a key role in regulating metabolism (Aslanoglou et al., 2021; Farino et al., 2020; García-Tornadú et al., 2010a; Rubí and Maechler, 2010; Ustione et al., 2013). We and others demonstrated that insulin-secreting β-cells produce DA and express D2R (Farino et al., 2020; Rubí et al., 2005; Simpson et al., 2012; Ustione et al., 2013). This locally produced DA mediates the inhibition of glucose-stimulated insulin secretion (GSIS) via D2R signaling as part of an autocrine/paracrine negative feedback mechanism (Aslanoglou et al., 2018; Farino et al., 2016, 2020; Simpson et al., 2012). Conversely, D2R blockade by antipsychotic drugs (APDs) interferes with β-cell DA signaling to raise GSIS, which leads to hyperinsulinemia and insulin resistance as found in T2D (Farino et al., 2020; Freyberg et al., 2017; Simpson et al., 2012; Ustione and Piston, 2012). Importantly, glucagon-secreting α-cells similarly express D2R, and, like β-cells, synthesize and secrete DA to modulate hormone secretion (Aslanoglou et al., 2021; Chen et al., 2014; Zhang et al., 2015). Furthermore, we recently established that, within islets, locally produced DA signals not only through DA receptors but also via adrenergic receptors to regulate hormone release from both α-cells and β-cells (Aslanoglou et al., 2021; Sánchez-Soto et al., 2016, 2018). This is consistent with earlier studies showing that bromocriptine binds and activates not only D2R but also additional aminergic receptors including serotonergic and adrenergic receptors (de Leeuw van Weenen et al., 2010; McPherson and Beart, 1983; Millan et al., 2002; Mukherjee and Yun, 2013; Newman-Tancredi et al., 2002; Zawilska and Iuvone, 1990). Collectively, these findings raise the possibility that an important mechanism for bromocriptine’s therapeutic actions is its ability to act directly on both peripheral aminergic targets in α-cells and β-cells to modify hormone secretion and thus treat dysglycemia.
Here, we investigate the actions of bromocriptine on peripheral targets in the endocrine pancreas. We use this unique drug as a tool to further elucidate the respective roles of dopaminergic and adrenergic signaling in the regulation of pancreatic hormone secretion as well as to identify novel therapeutic mechanisms in the pancreas by which bromocriptine improves dysglycemia. We demonstrate that bromocriptine inhibits GSIS through its concurrent actions on both β-cell D2R and α2A-adrenergic receptors (α2A-AR). Just as importantly, bromocriptine potently reduces glucagon secretion from α-cells in mouse and human islets as an additional mechanism to reduce hyperglycemia. To identify the functional mechanisms by which bromocriptine diminishes islet hormone secretion, we investigate the intracellular signaling triggered by bromocriptine stimulation of D2R and α2A-AR. This includes investigations of bromocriptine’s effects on β-cell intracellular cyclic AMP (cAMP) levels, a key modulator of both insulin and glucagon release (Fridlyand and Philipson, 2016; Ravnskjaer et al., 2016; Tengholm and Gylfe, 2017). In parallel, we have characterized the molecular mechanisms by which bromocriptine acts at D2R and α2A-AR. We specifically identify the drug’s effects on receptor recruitment of different G protein subtypes and β-arrestins to D2R and α2A-AR using nanoBRET, a new, more sensitive methodology of bioluminescence resonance energy transfer (BRET) (Machleidt et al., 2015; Stoddart et al., 2018). We show that bromocriptine, a known efficacious D2R agonist, is also a potent partial agonist at α2A-AR, favoring signaling toward inhibitory GαoA-, GαoB- and Gαz-proteins, while demonstrating no measurable efficacy for recruitment of either β-arrestin1 or 2. In contrast, bromocriptine stimulation of D2R elicits robust recruitment of both G proteins and β-arrestin2, indicating that the unique signaling pattern observed for bromocriptine is restricted to its actions at α2A-AR. Lastly, to identify the structural basis for the receptor-specific differences in bromocriptine signaling, we model the binding of bromocriptine at α2A-AR versus D2R. Our modeling data shows that bromocriptine binds these aminergic receptors in a manner distinct from other ligands, consistent with earlier studies (Choudhary et al., 1995).
Results
Bromocriptine acts on β-cells to reduce glucose-stimulated insulin secretion
Since β-cells express D2R, a key target of bromocriptine (Farino et al., 2020; Rubí et al., 2005; Simpson et al., 2012), we functionally tested bromocriptine’s ability to act through this inhibitory dopaminergic receptor to modulate GSIS. Bromocriptine reduces GSIS in a concentration-dependent manner both in mouse islets (IC50 = 15.8 nM; Figure 1A) and in rat β-cell-derived INS-1E cells (Merglen et al., 2004) (IC50 = 14.0 nM; Figure 1B and Table 1). Though bromocriptine’s inhibition of GSIS is similar to DA’s actions (Aslanoglou et al., 2018), bromocriptine is markedly more potent than DA in both mouse islets (DA IC50 = 1.3 μM) and INS-1E cells (DA IC50 = 1.5 μM) (Table 1) as we reported recently (Aslanoglou et al., 2021). To establish whether bromocriptine’s GSIS inhibition is primarily through its agonism of DA D2-like receptors including D2R, we compared bromocriptine’s GSIS response with that of quinpirole, a highly selective D2R/D3R agonist. Like bromocriptine, quinpirole decreases GSIS in mouse islets (IC50 = 1.6 μM; Figure 1C) and INS-1E cells (IC50 = 3.3 μM; Figure 1D and Table 1), suggesting that β-cell D2R/D3R agonism is important for bromocriptine’s ability to reduce GSIS. Nevertheless, because both DA and quinpirole exhibit reduced efficacy and potency compared with bromocriptine, we examined whether additional β-cell targets contribute to bromocriptine’s GSIS inhibition.
Figure 1.

Bromocriptine reduces glucose-stimulated insulin secretion via both D2R and α2A-AR
(A and B) Treatment with bromocriptine produced a dose-dependent decrease in glucose-stimulated insulin secretion (GSIS) in (A) mouse islets (IC50 = 15.8 nM) and (B) INS-1E cells, a rat β-cell line (IC50 = 14.0 nM).
(C and D) Quinpirole, a selective D2R receptor agonist, also reduced GSIS, albeit with lower efficacy and potency compared with bromocriptine in (C) mouse islets (IC50 = 1.6 μM) and (D) INS-1E cells (IC50 = 3.3 μM). (E and F) Clonidine, a selective α2-AR agonist, reduced GSIS in (E) mouse islets (IC50 = 7.4 nM) and (F) INS-1E cells (IC50 = 9.1 nM), comparably with bromocriptine.
(G) Co-treatment of bromocriptine with α2-AR antagonist yohimbine (100 nM) increased the potency of bromocriptine’s GSIS inhibition (in magenta, IC50 = 6.6 nM; p = 0.039), whereas co-treatment with D2R blocker sulpiride (100 nM) diminished bromocriptine’s potency of GSIS inhibition (in black, IC50 = 49.1 nM; p < 0.0001) compared with bromocriptine alone (in blue). Bromocriptine’s efficacy of GSIS inhibition was similarly reduced in the presence of either yohimbine or sulpiride compared with bromocriptine alone (in blue; p < 0.0001).
(H) CRISPR/Cas9-mediated knockout of endogenous α2A-AR expression in INS-1E cells similarly increased bromocriptine’s potency (in red, IC50 = 6.7 nM); p = 0.03 but diminished the efficacy of GSIS inhibition (80.6% reduction; p < 0.0001) compared with the unmodified parental INS-1E cell line (in black). Insulin secretion assays were performed in triplicate from n ≥ 3 independent experiments. Insulin data were normalized to % maximal secreted insulin. In Panels (A)–(F), black squares represent unstimulated controls. Data are represented as mean ± SEM. See also Figures S1, S2, Table 1.
Table 1.
Drug potencies of adrenergic and dopaminergic receptor ligands on glucose-stimulated insulin secretion (GSIS), related to Figure 1
| Bromocriptine pIC50 (IC50, nM) [95% CI] | DA pIC50 (IC50, nM) [95% CI] | Quinpirole pIC50 (IC50, nM) [95% CI] | Clonidine pIC50 (IC50, nM) [95% CI] | Bromocriptine + Yohimbine pIC50 (IC50, nM) [95% CI] | Bromocriptine + Sulpiride pIC50 (IC50, nM) [95% CI] | |
|---|---|---|---|---|---|---|
| Islets | 7.80 (15.80) [7.15–8.33] | 5.89 (1296.65) [5.40–6.36] | 5.80 (1585.74) [5.17–6.50] | 8.13 (7.36) [7.84–8.47] | ND | ND |
| INS-1E | 7.85 (13.99) [7.58–8.10] | 5.83 (1489.16) [5.48–6.18] | 5.48 (3305.73) [4.79–6.23] | 8.04 (9.06) [7.64–8.47] | 8.18 (6.64) [7.57–8.77] | 7.31 (49.14) [5.84–8.69] |
| α2A-AR KO | 8.18 ± 0.41 (6.67) [5.68–9.04] | 6.32 (474.11) [5.69–6.98] | ND | ND | ND | ND |
Drug potencies of adrenergic and dopaminergic receptor ligand inhibition of GSIS were determined in wildtype mouse pancreatic islets, the INS-1E β-cell line, and a clonal α2A-adrenergic receptor knockout (α2A-AR KO) INS-1E-derived cell line. pIC50 values represent the negative logarithm of the respective receptor ligand IC50; corresponding IC50 values are in parentheses. ND, not determined. Values for DA were previously reported in Aslanoglou et al. (2021). Results represent means of at least three independent experiments performed in triplicate with 95% confidence intervals.
We previously demonstrated that DA is an agonist not only at dopaminergic receptors but at adrenergic receptors as well (Aslanoglou et al., 2021; Sánchez-Soto et al., 2018). This raises the possibility that bromocriptine also stimulates α2A-AR, the predominantly expressed adrenergic receptor in human and mouse β-cells (Aslanoglou et al., 2021). To test this, we first examined the effects of clonidine, a highly selective α2-AR agonist, on GSIS in both mouse islets and INS-1E cells. Clonidine treatment produces a dose-dependent reduction in GSIS in mouse islets (IC50 = 7.4 nM; Figure 1E) and INS-1E cells (IC50 = 9.1 nM; Figure 1F). These actions demonstrate that stimulation of α2A-AR can also decrease GSIS, suggesting that bromocriptine acts at both β-cell α2A-AR and D2R to decrease GSIS.
Bromocriptine binds to α2A-AR and D2R to reduce GSIS
We investigated whether bromocriptine directly binds to β-cell α2A-AR, in addition to its well-established binding to D2R (Yin et al., 2020). We conducted radioligand binding studies using the selective α2-adrenergic receptor antagonist [3H]-RX821002 in INS-1E cell-derived membranes to determine bromocriptine’s binding affinity to endogenously expressed α2A-AR. In competition binding assays, bromocriptine displaces [3H]-RX821002 with high nanomolar affinity (Ki = 161.8 nM; pKi = 6.8, 95% CI: 6.5–7.1) (Figure S1A), comparable with the previously reported affinity of the endogenous ligand norepinephrine (NE) for α2A-AR in INS-1E cells (Aslanoglou et al., 2021). These results demonstrate bromocriptine’s ability to bind to endogenously expressed β-cell α2A-AR with high affinity, confirming previously published results in recombinant systems (Millan et al., 2002).
We also directly compared bromocriptine’s binding with human D2R versus human α2A-AR using membranes from HEK-293 cells overexpressing each of the receptors. Bromocriptine displaces radioligand from D2R ([3H]-N-methylspiperone) (Ki = 43.2 nM; pKi = 7.4, 95% CI: 7.2–7.5) and α2A-AR ([3H]-RX821002) (Ki = 198.7 nM; pKi = 6.7, 95% CI: 6.6–6.8) (Figure S1B). Together, our findings suggest that bromocriptine binds both D2R and α2A-AR with nanomolar affinity, albeit with a higher affinity for D2R.
To assess the functional contribution of bromocriptine’s α2A-AR-dependent actions on GSIS, we blocked α2A-AR using yohimbine, a selective α2-AR antagonist. Co-treatment with yohimbine (100 nM) reduces bromocriptine’s efficacy of GSIS inhibition by 66.5% compared with bromocriptine alone (Figure 1G). Interestingly, α2A-AR blockade by yohimbine results in a slight increase in bromocriptine’s potency at reducing GSIS (IC50 = 6.6 nM) compared with bromocriptine alone (IC50 = 14.0 nM; Figure 1G and Table 1). We validated these pharmacological findings in a clonal INS-1E-derived cell line where α2A-AR was completely knocked out (KO) via CRISPR/Cas9 (Aslanoglou et al., 2021). Similar to pharmacologic α2A-AR inhibition, KO of α2A-AR reduces bromocriptine’s efficacy of GSIS inhibition by 80.6% (Figure 1H). α2A-AR KO also increases bromocriptine’s potency as a GSIS inhibitor (IC50 = 6.7 nM) compared with the unmodified parental cells (Figure 1H and Table 1). Thus, removing available β-cell α2A-ARs unmasks the contributions of the less abundantly expressed D2R, revealing bromocriptine’s true potency and efficacy at β-cell D2R (Table 1). Conversely, co-treatment with sulpiride (100 nM), a highly selective D2R blocker, diminishes both bromocriptine’s potency (IC50 = 49.1 nM) and efficacy (66.7% decrease) at reducing GSIS (Figure 1G and Table 1) versus bromocriptine alone. These results suggest that removing available β-cell D2R unmasks the contributions of α2A-ARs that may function as lower potency but equally efficacious targets for bromocriptine’s actions on GSIS. Overall, our results indicate that bromocriptine reduces GSIS by jointly acting on D2R and α2A-AR.
In further characterizing the α2A-AR KO cells, we additionally found that deletion of α2A-AR upregulates INS1 gene expression (Figure S2A). This is also accompanied by increased basal insulin release compared with the unaltered parental INS-1E cells (Figure S2B). Our results suggest that α2A-AR is essential not only for the modulation of GSIS, but also in the regulation of unstimulated, basal insulin secretion.
Bromocriptine decreases glucagon secretion from mouse and human islets
Like β-cells, human and mouse α-cells express D2R; in contrast, α-cells express relatively little α2A-AR compared with β-cells (Aslanoglou et al., 2021). Therefore, we determined whether bromocriptine also acts on islet α-cells to modify glucagon secretion. In mouse islets, bromocriptine treatment potently reduces secreted glucagon from these cells (10 pM: 26.7% decrease; 100 pM: 29.7% decrease) (Figure 2A). Similar results were obtained in human islets (10 pM: 30.8% decrease; 100 pM: 36.7% decrease) (Figure 2B and Table 2). In contrast, insulin secretion from human islets is not significantly altered at the same low bromocriptine concentrations that reduce glucagon release (Figure 2C). This is consistent with our findings in mouse islets that similarly show that picomolar bromocriptine concentrations are insufficient to modify insulin secretion (see Figure 1A). Rather, higher bromocriptine concentrations in the nanomolar range are required to significantly reduce mouse islet GSIS (IC50 = 15.8 nM). Such potency differences provide further evidence that bromocriptine acts at multiple targets in α-cells versus β-cells. Thus, bromocriptine may primarily stimulate D2R in α-cells that binds the drug with higher affinity compared with α2A-AR in β-cells, which functions as a lower affinity target (Aslanoglou et al., 2021). Since hyperglucagonemia is an important contributor to the hyperglycemia present in both type 1 and 2 diabetes, our findings suggest that bromocriptine’s ability to lower α-cell glucagon secretion may also be an important mechanism underlying the drug’s ability to treat dysglycemia.
Figure 2.

Bromocriptine lowers glucagon secretion in human and mouse islets
(A) Bromocriptine significantly reduced glucagon secretion at picomolar concentrations in mouse islets compared with the vehicle control [F(2,48) = 4.597, p = 0.0149; 10 pM: p = 0.0320; 100 pM: p = 0.0171].
(B) Treatment with bromocriptine also significantly lowered glucagon secretion from human islets compared with the vehicle [F(2,14) = 4.108, p = 0.0395; 10 pM: p = 0.0883; 100 pM: p = 0.0324]; representative experiment shown.
(C) Treatment with bromocriptine did not significantly alter insulin secretion from human islets compared with the vehicle control (p > 0.05); representative experiment shown. Glucagon and insulin secretion assays were performed in triplicate from n = 3 independent experiments. Data are represented as mean ± SEM; one-way ANOVA followed by Dunnett’s multiple comparisons test. ∗p < 0.05. See also Table 2.
Table 2.
Human donor demographic information, related to Figure 2 and STAR Methods
| Donor | Age (Years) | Disease State | Gender | Body Mass Index | Cause of Death | Pancreas Weight (grams) |
|---|---|---|---|---|---|---|
| 1 | 55 | No | F | 22 | Stroke | 118 |
| 2 | 45 | No | F | 29.8 | Anoxia | 98.9 |
| 3 | 48 | No | M | 24.6 | Anoxia | 84.1 |
| 4 | 24 | No | M | 31.74 | Anoxia | 101.8 |
Donor information is provided for pancreata obtained from non-diabetic adult donors including the age, gender, body mass index, presence of disease state, cause of death, and pancreatic weight. This donor information was previously reported in Aslanoglou et al. (2021).
Bromocriptine and DA diminish β-cell cyclic AMP via α2A-AR and D2R
We next sought to determine the signaling mechanisms by which D2R- and α2A-AR modulate insulin secretion. In β-cells, the second messenger cAMP is a positive modulator of insulin secretion, where elevations in cAMP biosynthesis amplify insulin release (Rorsman and Braun, 2013; Tengholm and Gylfe, 2017). Catecholamine receptors are important regulators of intracellular cAMP production, and the resulting changes in cAMP modify hormone secretion (Masri et al., 2008; Tengholm and Gylfe, 2017). In α-cells, activation of stimulatory β-adrenergic receptors raises intracellular cAMP levels that promote glucagon secretion (Leclercq-Meyer et al., 1971; Schuit and Pipeleers, 1986). Conversely, in β-cells, activation of inhibitory α2-ARs diminishes GSIS by lowering cAMP (Schuit and Pipeleers, 1986; Tengholm and Gylfe, 2017). Therefore, given the functional relevance of catecholamine receptor signaling on cAMP-mediated regulation of hormone secretion, we posited: 1) bromocriptine dose-dependently stimulates β-cell D2R and α2A-AR, 2) which produces accompanying decreases in β-cell cAMP production, that 3) lower GSIS. To test this, we assessed the abilities of DA and bromocriptine to inhibit cAMP production in INS-1E cells. We found that DA dose-dependently inhibits cAMP production (IC50 = 3.0 μM; Figure 3A, Table 3). In contrast, bromocriptine is 290-fold more potent in diminishing intracellular cAMP (IC50 = 10.4 nM) but is less efficacious compared with DA (35.1% of DA’s maximum response) (Figure 3B and Table 3).
Figure 3.

Dopamine and bromocriptine reduce intracellular cAMP in INS-1E cells
(A) Treatment with DA produced a dose-dependent reduction of intracellular cAMP in INS-1E cells (in black, IC50 = 3.0 μM). α2A-AR knockout (KO) in INS-1E cells diminished DA’s potency (in red, IC50 = 1.5 μM) and efficacy (57% reduction) in lowering intracellular cAMP levels.
(B) Bromocriptine more potently reduced intracellular cAMP in a dose-dependent manner in the parental unmodified INS-1E cells (in black, IC50 = 10.4 nM). α2A-AR KO rendered bromocriptine less potent (in red, IC50 = 1.2 μM) versus unmodified INS-1E cells but did not alter the drug’s efficacy. cAMP assays were performed in triplicate from at least three independent experiments; cAMP data were normalized to % maximal intracellular cAMP levels. Data are represented as mean ± SEM. See also Table 3.
Table 3.
Potencies and efficacies of bromocriptine and DA agonism in reducing cAMP production, related to Figure 3
| DA (INS-1E) | DA (⍺2a-AR KO) | Bromocriptine (INS-1E) | Bromocriptine (⍺2a-AR KO) | |
|---|---|---|---|---|
| pIC50(IC50, nM) [95% CI] | 5.52 (2996.99) [5.04–6.01] | 5.82 (1500.04) [4.38–6.88] | 7.99 (10.35) [7.08–9.45] | 5.92 (1204.68) [4.35–7.49] |
| Emax(% DA) [95% CI] | 100.00 | 57.15 [46.22–88.79] | 35.10 [33.09–38.47] | 56.28 [5.32–107.26] |
Potency (pIC50) and efficacy (Emax) of drug-induced inhibition of cAMP production by DA or bromocriptine in INS-1E cells versus in a clonal α2A-adrenergic receptor knockout (α2A-AR KO) INS-1E-derived cell line. Potency data are represented by pIC50 [95% confidence interval] with corresponding IC50 values in parentheses (in nM). Emax values are normalized to DA’s efficacy in cAMP inhibition in the parental INS-1E cell line. Results represent means of three independent experiments performed in triplicate with 95% confidence intervals.
Using our α2A-AR KO cell line, we discovered that deletion of α2A-AR slightly increases DA’s potency 1.7-fold in diminishing cAMP production (IC50 = 1.5 μM) while reducing its efficacy by 57.2% (Figure 3A and Table 3). By comparison, α2A-AR KO renders bromocriptine less potent (IC50 = 1.2 μM) but does not substantially alter the drug’s efficacy versus the parental cell line (Figure 3B and Table 3). These results suggest that bromocriptine reduces cAMP levels in β-cells via concurrent actions on D2R and α2A-AR, further emphasizing the joint roles of adrenergic and dopaminergic receptor agonism in cAMP-dependent regulation of GSIS. Nevertheless, bromocriptine’s diminished efficacy in reducing cAMP suggests that there may be additional mechanisms in the regulation of GSIS.
Bromocriptine is a partial agonist of α2A-AR-mediated Gαo/z signaling
The abilities of α2A-AR and D2R to recruit intracellular effectors including G proteins and β-arrestin2 in response to agonist stimulation are critical for modulating hormone secretion (Beaulieu et al., 2015; Masri et al., 2008; Zhu et al., 2017) and inform our mechanistic understanding by which an agonist like bromocriptine improves dysglycemia. However, the precise mechanisms of agonist-stimulated G protein and/or β-arrestin2 recruitment, particularly at α2A-AR, remain unknown. To address this, we employed nanoBRET since its exceptional sensitivity allows for the detection of transient and/or weak intermolecular interactions that other methods could not easily measure (Machleidt et al., 2015; Stoddart et al., 2018). In our nanoBRET assay, the receptor is labeled with a bright fluorescent dye via HaloTag and the intracellular effector (i.e., G protein or β-arrestin) is tagged with the highly sensitive nanoluciferase (NanoLuc). Upon recruitment, closeness and proximity of the receptor-effector pair enables luminescence from the NanoLuc-tagged effector to excite the receptor-bound dye to generate measurable fluorescence (Figure 4A). Using nanoBRET, we aimed to (1) characterize bromocriptine’s ability to initiate intracellular signaling via G protein- and β-arrestin-dependent pathways following its activation of α2A-AR and (2) compare bromocriptine’s signaling versus endogenous agonists NE and DA at α2A-AR and D2R.
Figure 4.

Bromocriptine stimulation of α2A-AR causes selective G protein recruitment
(A) Schematic of nanoBRET to detect intermolecular interactions between G protein-coupled receptors like α2A-AR or D2R and Gα protein subtypes. Here, α2A-AR is labeled with a bright fluorescent dye and the intracellular effector, e.g., G protein, β-arrestin2 (Arr2), is fused to a bioluminescent nanoLuciferase (NanoLuc) tag. Upon recruitment, the molecules’ close proximity enables luminescence from the NanoLuc-tagged effector to excite a dye bound to the receptor via HaloTag, producing a measurable fluorescent signal.
(B–G) Concentration-response nanoBRET assays examining drug-stimulated G protein recruitment in response to treatment with bromocriptine (in black), DA (in purple), or NE (in blue). HEK-293T cells expressed HaloTag-labeled α2A-AR and different NanoLuc-labeled Gα proteins as the respective nanoBRET pairs. Bromocriptine stimulation resulted in significantly more potent recruitment of (B) GαoA (EC50 = 22.9 nM), (C) GαoB (EC50 = 10.5 nM), and (D) Gαz protein (EC50 = 11.5 nM) to α2A-AR compared with recruitment in response to DA or NE, albeit with a reduced efficacy compared with these endogenous ligands (see Tables 4 and 5).
(E–G) Even though bromocriptine was similarly potent in causing recruitment of members of the Gαi family to α2A-AR: (E) Gαi1 EC50 = 52.6 nM; (F) Gαi2 EC50 = 38.5 nM; (G) Gαi3: EC50 = 0.6 nM, the drug was less efficacious compared with its actions on GαoA, GαoB, or GαoZ. NanoBRET data were baseline-corrected and normalized to % maximal NE response. Assays were performed in triplicate from n ≥ 3 independent experiments. Data are represented as mean ± SEM for all experimental replicates. NanoBRET data from DA and NE dose responses showing coupling of α2A-AR to Gαi1 were previously published in Aslanoglou et al. (2021). See also Figure S3, Tables 4 and 5.
Bromocriptine stimulation of α2A-AR results in a signaling profile that is distinct from either DA or NE (Figures 4B–4G). Because β-cells express Gαi, Gαo, and Gαz families of G proteins (Berger et al., 2015; Straub and Sharp, 2012), we focused on the receptor recruitment of these effectors. Receptor activation by bromocriptine results in significantly more potent recruitment of GαoA (EC50 = 22.9 nM; Figure 4B), GαoB (EC50 = 10.5 nM; Figure 4C), and Gαz protein (EC50 = 11.5 nM; Figure 4D) to α2A-AR, compared with stimulation by either DA or NE (Table 4). Nevertheless, whereas bromocriptine is less efficacious versus DA or NE in recruiting GαoA and GαoB to α2A-AR, it is almost as efficacious as DA in recruiting Gαz (Figure 4D and Table 5). Our data therefore suggest that bromocriptine is a partial agonist at α2A-AR for GαoA/B and Gαz. In contrast, bromocriptine is considerably less efficacious in recruiting Gαi1, Gαi2, and Gαi3 to α2A-AR versus NE (Figures 4E–4G, Table 5). These data suggest that the most robust signaling stimulated by bromocriptine is driven by Gαo and Gαz signaling, indicating that these signaling pathways may drive bromocriptine’s downstream signaling via α2A-AR.
Table 4.
Potencies of bromocriptine-, DA-, and NE-stimulated G protein and β-arrestin2 recruitment to the α2A-adrenergic receptor (α2A-AR), related to Figures 4 and 5
| ⍺2A-AR Recruitment Potency pEC50 (EC50, nM) [95% CI] |
|||||||
|---|---|---|---|---|---|---|---|
| G⍺i1 | G⍺i2 | G⍺i3 | G⍺oA | G⍺oB | G⍺z | β-Arrestin2 | |
| Bromo | 7.28 (52.58) [6.14–8.38] | 7.42 (38.45) [5.15–9.68] | 9.26 (0.56) [4.78–13.73] | 7.64 (22.93) [7.05–8.25] | 7.98 (10.53) [7.37–8.61] | 7.94 (11.53) [7.16–8.84] | ND |
| DA | 5.67 (2144.80) [5.30–6.01] | 5.98 (1044.39) [4.24–7.72] | 5.99 (1026.62) [5.29–6.68] | 6.08 (836.50) [5.78–6.39] | 6.03 (944.72) [5.68–6.39] | 6.18 (666.26) [5.65–6.69] | ND |
| NE | 6.27 (533.25) [6.00–6.57] | 6.32 (476.15) [5.38–7.27] | 6.71 (196.31) [6.05–7.36] | 6.96 (109.37) [6.71–7.20] | 7.01 (97.42) [6.76–7.27] | 6.10 (789.05) [5.95–6.27] | 5.51 (3052.17) [5.23–5.80] |
Potencies of Gαi/o/z and β-arrestin2 recruitment to α2A-AR in response to agonist stimulation by bromocriptine (bromo), DA, or NE as measured by nanoBRET. Potency data are represented by pEC50 [95% confidence interval] with corresponding EC50 values in parentheses (in nM). Results represent means of at least three independent experiments performed in triplicate with 95% confidence intervals.
Table 5.
Efficacies of bromocriptine-stimulated G protein and β-arrestin2 recruitment to D2R and α2A-AR, related to Figures 4 and 5
| Emax [95% CI] | G⍺i1 | G⍺i2 | G⍺i3 | G⍺oA | G⍺oB | G⍺z | β-arrestin2 |
|---|---|---|---|---|---|---|---|
| D2R | 60.03 [46.83–73.23] | 89.32 [55.48–123.20] | 64.15 [25.28–103.00] | 109.13 [71.26–147.01] | 96.05 [65.07–127.03] | 66.51 [20.68–112.34] | 60.94 [22.30–99.59] |
| α2A-AR | 15.45 [7.42–23.48] | 43.78 [2.90–84.67] | 12.69 [-10.92-36.30] | 42.98 [33.31–52.66] | 40.32 [30.38–50.27] | 21.25 [14.49–28.01] | ND |
Efficacies (Emax) of Gαi/o/z protein and β-arrestin2 recruitment to D2R (n = 5) or α2A-AR (n = 4) in response to receptor stimulation by bromocriptine. Emax values for D2R and α2A-AR are represented as the percentage of recruitment relative to DA and NE, respectively. Results represent means of independent experiments performed in triplicate with 95% confidence intervals (in brackets).
We also measured G protein recruitment to D2R upon bromocriptine stimulation (Table 6). Consistent with bromocriptine’s higher affinity for D2R compared with α2A-AR (Figure S1B), bromocriptine is more potent in recruiting GαoA (EC50 = 76.7 pM, Emax = 109.1), GαoB (EC50 = 270.0 pM, Emax = 96.1) and Gαz (EC50 = 4.3 nM, Emax = 66.5) to D2R versus α2A-AR (Tables 4 and 6). Unlike α2A-AR, bromocriptine’s stimulation of D2R leads to strong Gαi1 receptor coupling, where bromocriptine demonstrates 4.5-fold higher potency (EC50 = 103.8 nM, Emax = 60.0) than DA (EC50 = 471.1 nM) and 47.2-fold higher potency than NE (EC50 = 4.9 μM) (Figure S3, Table 6). Bromocriptine is similarly more potent at recruiting Gαi2 and Gαi3 to D2R versus DA or NE (Tables 5 and 6). We also find that bromocriptine is more efficacious in the recruitment of Gαi, Gαo, and Gαz families of G proteins to D2R compared with α2A-AR (Table 5).
Table 6.
Potencies of bromocriptine-, DA-, and NE-stimulated recruitment of Gα proteins and β-arrestin2 to D2R, related to Figure 5
| D2R Recruitment Potency pEC50 (EC50, nM) [95% CI] |
|||||||
|---|---|---|---|---|---|---|---|
| G⍺i1 | G⍺i2 | G⍺i3 | G⍺oA | G⍺oB | G⍺z | β-Arrestin2 | |
| Bromo | 6.98 (103.77) [6.50–7.57] | 7.67 (21.61) [6.62–8.71] | 7.07 (84.30) [5.78–8.37] | 10.12 (0.08) [8.90–11.23] | 9.57 (0.27) [8.55–10.64] | 8.37 (4.30) [6.63–10.10] | 6.54 (285.90) [5.21–7.78] |
| DA | 6.33 (471.13) [6.10–6.56] | 8.54 (2.88) [7.50–9.58] | 6.44 (366.46) [5.61–7.26] | 6.95 (113.33) [6.18–7.73] | 7.65 (22.38) [6.90–8.40] | 6.89 (129.56) [5.75–8.03] | 5.41 (3881.89) [4.39–6.45] |
| NE | 5.31 (4897.53) [5.05–5.59] | 7.60 (25.29) [6.25–8.95] | 4.49 (32610.75) [3.17–5.80] | 5.48 (3346.18) [4.32–7.17] | 6.86 (138.55) [6.05–7.65] | 10.17 (0.07) [8.85–11.48] | 4.78 (16745.32) [3.62–5.93] |
Potencies of Gαi/o/z and β-arrestin2 recruitment to D2R in response to agonist stimulation by bromocriptine (bromo), DA, or NE as measured by nanoBRET. Potency data are represented by pEC50 with corresponding EC50 values in parentheses (in nM). Results represent means of five independent experiments performed in triplicate with 95% confidence intervals for the respective pEC50 values in brackets.
Figure 6.

Computational model of bromocriptine binding to D2R and α2A-AR
(A and B) Two-dimensional views of bromocriptine’s interactions with key residues in the binding pocket of D2R (A) versus α2A-AR, (B) using RosettaLigand docking, and (C, D) three-dimensional views of bromocriptine-receptor binding.
(C) Binding pose of bromocriptine utilizing the cryo-EM structure of the bromocriptine-bound D2R-Gαi complex (PDB 7JVR and 6VMS) with key binding pocket residues colored cyan.
(D) Predicted binding pose of bromocriptine to α2A-AR using the X-ray crystal structure of α2A-AR complexed with a partial agonist, (S)-4-fluoro-2-(1H-imidazol-5-yl)-1-iso-propylindoline (PDB 6KUY); key binding pocket residues are colored orange and intramolecular hydrogen bonds are indicated by dots.
(E and F) D2R-bromocriptine (E) and α2A-AR-bromocriptine (F) binding modes at the extracellular loops, as delineated by receptor surfaces demonstrate the formation of a salt bridge between Arg405 and Glu189 present in α2a-AR but absent in D2R. See also Figure S5.
Bromocriptine stimulation does not recruit β-arrestins to α2A-AR
The two β-arrestin isoforms, β-arrestin1 (arrestin2) and β-arrestin2 (arrestin3), are scaffold proteins critical for GPCR desensitization and internalization and are ubiquitously expressed in virtually every cell type including β-cells (Wess, 2022). Therefore, we examined whether β-arrestins are also recruited to D2R and/or α2A-AR in response to bromocriptine stimulation. We found that bromocriptine stimulation of D2R leads to recruitment of β-arrestin2 with greater potency (EC50 = 285.9 nM) than receptor stimulation with either DA (EC50 = 3.9 μM) or NE (EC50 = 16.8 μM) (Figure 5A, Table 6). However, bromocriptine stimulation does not result in measurable recruitment of β-arrestin2 to α2A-AR (Figure 5B). By comparison, NE treatment causes robust recruitment of β-arrestin2 to α2A-AR (EC50 = 3.1 μM; Figure 5B and Table 4). These findings suggest that bromocriptine stimulation of α2A-AR leads to preferential recruitment of G proteins rather than β-arrestin2, similar to the actions of DA at this receptor.
Figure 5.

Bromocriptine stimulation causes selective β-arrestin2 recruitment to D2R but not α2A-AR
Concentration response curves by nanoBRET examining ligand-stimulated recruitment of β-arrestin2 to D2R versus α2A-AR.
(A) Bromocriptine stimulation of D2R caused β-arrestin2 recruitment to the receptor in a concentration-dependent manner (EC50 = 285.9 nM). Though bromocriptine was substantially more potent compared with DA (EC50 = 3.9 μM) or NE (EC50 = 16.8 μM), it was less efficacious than either endogenous ligand.
(B) Neither bromocriptine nor DA stimulation of α2A-AR caused significant β-arrestin2 receptor recruitment. In contrast, NE treatment produced dose-dependent β-arrestin2 recruitment to α2A-AR (EC50 = 3.1 μM). NanoBRET data were baseline-corrected and normalized to either % maximal DA response for D2R or to % maximal NE response for α2A-AR. Assays were performed in triplicate from n ≥ 3 independent experiments. Data are represented as mean ± SEM. NanoBRET data from DA and NE dose responses were previously published in Aslanoglou et al. (2021). See also Figure S4, Tables 4, 5, and 6.
We also assayed β-arrestin1 to D2R or α2A-AR, finding negligible recruitment to either receptor in response to stimulation by DA, NE, or bromocriptine (Figure S4). These results suggest that agonist stimulation of D2R or α2A-AR mainly drives β-arrestin2 recruitment, consistent with earlier findings (Beaulieu et al., 2005; Cottingham et al., 2011; Sánchez-Soto et al., 2016; Skinbjerg et al., 2009; Urs and Caron, 2014). Furthermore, there is no detectable internalization of α2A-AR following bromocriptine stimulation (data not shown). This is consistent with the absence of β-arrestin1 or β-arrestin2 recruitment following bromocriptine stimulation. Overall, our results suggest that bromocriptine stimulation elicits distinct signaling depending on the receptor, preferentially directing signaling toward G protein-mediated signal transduction pathways at α2A-AR and away from β-arrestins.
Structural basis for bromocriptine binding at α2A-AR versus D2R
To further understand bromocriptine’s actions at α2A-AR versus D2R at the structural level, we performed computational modeling of the drug’s binding at these receptors using RosettaLigand (Meiler and Baker, 2006; Sánchez-Soto et al., 2018). Given the absence of a preexisting structure of bromocriptine bound to α2A-AR, we used the bromocriptine-D2R cryo-EM structures (PDB 6VMS and 7JVR) (Yin et al., 2020; Zhuang et al., 2021) as templates to predict bromocriptine’s binding interactions at α2A-AR. Employing these structural data to identify the initial starting coordinates, we docked bromocriptine to α2A-AR using the X-ray crystal structure of α2A-AR complexed with the partial agonist, (S)-4-fluoro-2-(1H-imidazol-5-yl)-1-iso-propylindoline (PDB 6KUY) (Qu et al., 2019). Our docking analyses show that bromocriptine’s ergoline core forms similar interactions in the orthosteric binding pockets of both D2R and α2A-AR in transmembrane domains TM3 and TM5 (Figure 6). This is consistent with bromocriptine’s ability to activate both receptors. Indeed, residues Asp1133.32 (TM3) and Ser2045.46 (TM5) in α2A-AR’s binding pocket are predicted to form interactions with dihydroquinoline and indole nitrogens of bromocriptine’s ergoline core (Figures 6B and 6D), analogous to bromocriptine-D2R interactions via Asp1143.32 (TM3) and Ser1975.46 (TM5) of D2R (Figures 6A and 6C). Furthermore, the substitution of D2R’s Thr4127.39 (TM7) for Phe4127.39 (TM7) in α2A-AR produces a more rigid molecular conformation in α2A-AR’s binding pocket that may account for the differences in ligand binding affinity and specificity between the two receptors (Figures 6C and 6D). Consistent with this, previous work showed that differences in binding to conserved aromatic residences within the binding pocket of aminergic receptors (e.g., Phe4127.39) play a key role in establishing the binding differences between ergopeptines such as bromocriptine versus other ligands (Choudhary et al., 1995).
Importantly, we discovered differences between bromocriptine’s interactions with key residues in extracellular loops EL2 and EL3 of α2A-AR versus D2R. The diminished flexibility of bromocriptine docked in α2A-AR’s binding pocket enables strong interactions between the drug and residues Arg405 (EL2) and Ile190 (EL3) that may be responsible for forming a salt bridge between Arg405 and Glu189 (EL3) (Figures 6B–6F). Such a salt bridge could explain differences between the opening and closure of the extracellular lid in adrenergic versus dopaminergic receptors responsible for the binding of high-affinity agonists like bromocriptine as well as for receptor-selective coupling of G proteins (DeVree et al., 2016).
Lastly, we examined the binding of other ligands to α2A-AR including DA and NE (Figure S5). Docking analyses showed that, like bromocriptine, both catecholamines form strong interactions with α2A-AR at residues Asp1133.32, Ser2005.42, and Ser2045.46 (Figures 6B, S5A, and S5B). However, the additional hydroxyl group on NE’s catechol ring forms an interaction with Asp1133.32 that produces tighter binding compared with DA, providing a structural basis for NE’s higher affinity at α2A-AR. Docking to α2A-AR was also performed with an antagonist, yohimbine. Interestingly, compared with the agonists above, yohimbine has more limited interactions in the α2A-AR binding pocket. Indeed, the only interaction that yohimbine shares with either bromocriptine, DA, or NE is at Asp1133.32 (Figure S5C). Overall, these data provide the structural basis for the further investigation of bromocriptine’s actions at α2A-AR versus D2R and open the door to future development of drugs that exploit these receptor-specific structural features to achieve even greater therapeutic efficacy.
Discussion
We and others have demonstrated that pancreatic DA signaling via D2R modulates glucose homeostasis (Aslanoglou et al., 2021; Farino et al., 2020; García-Tornadú et al., 2010b; Maffei et al., 2015; Ustione et al., 2013), suggesting that targeting DA signaling in the periphery may be a viable new therapeutic option for effective treatment of dysglycemia in diabetes. Consistent with this, stimulation of pancreatic islet D2R by an agonist like bromocriptine treats dysglycemia in T2D (Lopez Vicchi et al., 2016; Naguy and Al-Tajali, 2016; Shivaprasad and Kalra, 2011; Valiquette, 2011). Yet, the precise mechanisms of bromocriptine’s metabolic actions have remained poorly understood.
It has long been suggested that bromocriptine and its quick-release analogue, bromocriptine-QR, act primarily on CNS targets in the hypothalamus to restore diabetic alterations to glucose sensing and central sympathetic tone (Defronzo, 2011; Stoelzel et al., 2020). However, recent evidence from us and others suggests that bromocriptine also acts on peripheral targets, including pancreas, to improve dysglycemia (de Leeuw van Weenen et al., 2010; Freyberg et al., 2017; Wei et al., 2020). Here, we show that bromocriptine acts directly on β-cells and α-cells to decrease both insulin and glucagon secretion. Notably, bromocriptine is substantially more potent than other classical D2R agonists including DA and quinpirole in diminishing β-cell GSIS. These data suggest that bromocriptine may be acting at additional β-cell targets in concert with D2R. Importantly, we recently demonstrated in β-cells that (1) both mouse and human β-cells express α2A-AR (Aslanoglou et al., 2021). Like D2R, α2A-AR is an inhibitory Gαi-coupled GPCR that decreases GSIS (Straub and Sharp, 2012); (2) DA also signals via α2A-AR that is abundantly expressed in mouse and human β-cells (Aslanoglou et al., 2021); and (3) joint signaling through both D2R and α2A-AR is responsible for DA’s ability to modulate GSIS (Aslanoglou et al., 2021). We therefore hypothesized that, like DA, bromocriptine also signals via β-cell α2A-AR. We discovered that disrupting α2A-AR signaling either via pharmacologic inhibition with yohimbine or through genetic α2A-AR KO markedly impairs bromocriptine’s efficacy at reducing GSIS, confirming our hypothesis. Furthermore, radioligand binding data offers further support for bromocriptine’s ability to target α2A-AR. This is similar to our previous work showing that DA binds to α2A-AR as a lower affinity substrate in pancreas and brain (Aslanoglou et al., 2021; Sánchez-Soto et al., 2016). These data suggest that bromocriptine’s inhibitory effects on GSIS are mediated by its direct stimulation of α2A-AR. Additionally, β-cell α2A-AR KO reduces bromocriptine’s efficacy in GSIS inhibition but increases the drug’s potency, suggesting that the loss of α2A-AR expression unmasks bromocriptine’s actions at remaining D2R.
Our findings in islets are consistent with earlier studies demonstrating that bromocriptine binds α2A-AR in vitro as well as in brain tissue (e.g., hippocampus) (Jackisch et al., 1985; McPherson and Beart, 1983; Millan et al., 2002). Functionally, previous work in the brain also showed that bromocriptine functions as an α2A-AR agonist in the chicken pineal gland to suppress circadian increases in melatonin synthesis (Zawilska and Iuvone, 1990). Bromocriptine’s actions on adrenergic receptors may therefore offer a novel mechanism for the drug’s ability to modify circadian regulation of catecholamine signaling in the CNS and periphery (Cincotta et al., 1993; Freyberg and Logan, 2018; Holt et al., 2010; Wei et al., 2020). Similarly, in adipocytes, bromocriptine diminishes adipogenesis, lipogenesis, and obesity-related inflammation via α2A-AR agonism (Mukherjee and Yun, 2013). Indeed, it has been proposed that α2A-AR-mediated anti-inflammatory effects contribute to bromocriptine’s anti-diabetic properties (Mukherjee and Yun, 2013). Importantly, our work in islets confirms past studies in INS-1E cells suggesting that α2A-AR is targeted by bromocriptine in β-cells and that bromocriptine’s inhibitory effects on insulin secretion are attributable to its agonism of β-cell α2-ARs (de Leeuw van Weenen et al., 2010).
Bromocriptine potently diminishes glucagon secretion in both human and mouse islets, suggesting that bromocriptine also acts on α-cells. We previously demonstrated that human and mouse α-cells express both dopaminergic and adrenergic receptors (Aslanoglou et al., 2021). Yet, whereas the major catecholamine receptor subtypes expressed in β-cells are inhibitory (i.e., α2A-AR, D2R), both mouse and human α-cells mainly express a combination of inhibitory D2R and stimulatory β1-adrenergic receptors (β1-AR) (Aslanoglou et al., 2021). Since the affinity of bromocriptine for β1-AR is ∼120-fold lower compared with D2R (Millan et al., 2002), we contend that bromocriptine’s inhibition of glucagon secretion is primarily owing to the drug’s unopposed actions on α-cell D2R. Together, our islet secretion data point to bromocriptine’s ability to signal via different ensembles of catecholamine receptors expressed in α-cells and β-cells to concurrently lower islet insulin and glucagon secretion.
We used nanoBRET to comprehensively dissect the mechanisms by which α2A-AR and D2R recruit G proteins versus β-arrestins in response to stimulation by different receptor ligands. Our nanoBRET results further demonstrate that bromocriptine stimulates the recruitment of inhibitory G protein subtypes at both α2A-AR and D2R, albeit with different potencies and efficacies. We discovered that bromocriptine is especially potent in recruiting GαoA, GαoB, and Gαz to D2R compared with either DA or NE. By comparison, GαoA and GαoB are preferentially recruited to α2A-AR in response to bromocriptine. Bromocriptine’s ability to target these G proteins is consistent with earlier work suggesting key roles for Gαz and Gαo in modulating β-cell insulin secretion and survival (Kimple et al., 2008; Régnauld et al., 2002). Indeed, in β-cells, Gαo proteins regulate the number of docked insulin granules and GαoB specifically plays a key role in maintaining a tonic inhibitory tone for insulin secretion (Straub and Sharp, 2012; Wang et al., 2011). Moreover, Gαz modulates endocytosis in β-cells to finely tune insulin granule availability (Straub and Sharp, 2012; Zhao et al., 2010).
In addition to G proteins, GPCRs can also recruit β-arrestins (e.g., β-arrestin1 and β-arrestin2) that serve as scaffolding proteins to facilitate receptor internalization and desensitization as well as to modulate the signaling of downstream effectors including MAPK, Akt and GSK-3 (Beaulieu et al., 2007; Han et al., 2019; Pydi et al., 2022). In β-cells, β-arrestins play important critical roles in the regulation of both insulin secretion and β-cell mass (Barella et al., 2019, 2021; Sonoda et al., 2008; Wess, 2022; Zhu et al., 2017). We previously demonstrated that DA activation of α2A-AR results in G protein recruitment to the receptor, whereas β-arrestin2 recruitment is absent. In contrast, NE treatment causes robust G protein and β-arrestin2 recruitment (Aslanoglou et al., 2021). We now show that, like DA, bromocriptine stimulation of α2A-AR elicits negligible β-arrestin2 recruitment. By comparison, bromocriptine stimulation of D2R causes β-arrestin2 receptor recruitment, though with reduced efficacy versus DA. These findings further underscore the crucial differences in signaling by bromocriptine at D2R versus α2A-AR. There are several possible mechanisms underlying this observation: (1) bromocriptine may not demonstrate measurable recruitment of β-arrestin2 to the α2A-AR owing to its stabilization of a unique receptor confirmation that does not favor β-arrestin2 recruitment; and (2) bromocriptine is both a biased and partial agonist at α2A-AR compared with D2R. We posit that the observed effects on GSIS in β-cells likely reflect some combination of these putative mechanisms.
Receptor- and agonist-specific differences in β-arrestin2 recruitment raise important questions concerning the functional impact of these phenomena on pancreatic hormone secretion. Previous work showed that β-cell β-arrestin2 is important for the regulation of glucose tolerance and GSIS, particularly under obesogenic conditions (Luan et al., 2009; Pydi et al., 2022; Zhu et al., 2017). These metabolic effects are based on β-arrestin2’s roles in promoting insulin vesicle docking and release. Consistent with this, β-cell-specific β-arrestin2 KO significantly diminishes GSIS (Pydi et al., 2022; Zhu et al., 2017). Therefore, the absence of β-arrestin2 recruitment to α2A-AR in response to bromocriptine offers an additional functional mechanism linking β-arrestin2 to drug-induced reductions of GSIS. Furthermore, given β-arrestin2’s importance in GPCR internalization and desensitization (Beaulieu and Gainetdinov, 2011), bromocriptine’s inability to recruit β-arrestin2 at α2A-AR may lead to longer periods of receptor signaling while the receptors remain at the cell surface. This would prolong inhibitory G protein recruitment, resulting in reduced GSIS produced by bromocriptine. Lack of β-arrestin2 recruitment may also lead to longer-term changes in gene expression. Recent work demonstrated that GPCR recruitment of β-arrestin2 triggers Akt/GSK-3-dependent crosstalk with the Wnt/β-catenin pathway that regulates gene transcription (Beaulieu et al., 2007; Freyberg et al., 2010; Han et al., 2019).
Our data also suggest that, in contrast to DA or NE, bromocriptine behaves as a partial agonist in recruiting several G proteins (e.g., GαoA, GαoB) to α2A-AR or β-arrestin2 to D2R. Partial agonism may provide functional outcomes that differ from those of full agonists (Hilger, 2021; Mukhtasimova and Sine, 2018). Whereas partial agonists can initiate the same cellular processes as full agonists, they only produce submaximal responses even at total receptor occupancy. Partial agonists can achieve this by causing receptors to adopt conformational states that are different from those produced by full agonists. Indeed, α2A-AR achieves distinct conformations in response to different full versus partial agonists. As a result, these different receptor confirmations affect Gαi/o-protein signaling efficacies and kinetics (Nikolaev et al., 2006). Bromocriptine’s partial agonism in recruiting β-arrestin2 to D2R may therefore explain the drug's greater potency versus DA in diminishing insulin and glucagon secretion. With less β-arrestin2 recruitment in response to bromocriptine stimulation compared with full agonists like DA, this may lead to diminished β-arrestin2-mediated D2R internalization and desensitization, extending D2R’s ability to remain functionally active at the cell surface. Thus, with more active D2R receptors available for inhibitory Gαi/o-mediated signaling in alpha- and beta-cells, lower doses of bromocriptine are capable of diminishing insulin and glucagon secretion compared with DA. Indeed, increasing evidence implicates β-arrestin2 as an important regulator of beta-cell insulin secretion (Luan et al., 2009; Zhu et al., 2017).
Besides β-arrestin2, β-cells also express β-arrestin1 (Barella et al., 2021; Pydi et al., 2022). Increasing evidence suggests that β-cell β-arrestin1 plays an important role in regulating glycemic control, albeit in a manner distinct from β-arrestin2 (Pydi et al., 2022). Conditional KO studies in mice showed that β-arrestin1 enhances the efficacy of sulfonylurea T2D drugs in stimulating insulin secretion (Barella et al., 2019). Moreover, β-arrestin1 stimulates β-cell replication, impacting β-cell mass in obese mice (Barella et al., 2021). However, we find that β-arrestin1 and β-arrestin2 are not equally recruited to D2R or α2A-AR. This is in line with earlier studies by Lefkowitz and colleagues showing that β-arrestin1 and β-arrestin2 are recruited differently at a variety of GPCRs (Kohout et al., 2001). Our work shows that stimulation of D2R with any of the agonists tested (bromocriptine, DA, NE) does not lead to significant β-arrestin1 recruitment, which is consistent with work demonstrating that D2R primarily recruits β-arrestin2 rather than β-arrestin1 (Beaulieu et al., 2005; Sánchez-Soto et al., 2016; Skinbjerg et al., 2009; Urs and Caron, 2014). For α2A-AR, we detected negligible β-arrestin1 recruitment in response to NE, consistent with earlier studies (Cottingham et al., 2011). Moreover, there is no significant recruitment of either β-arrestin1 or β-arrestin2 to α2A-AR in response to bromocriptine stimulation. Altogether, these data suggest that (1) β-arrestin1 does not play a prominent role in D2R or α2A-AR signaling compared with β-arrestin2; and (2) neither β-arrestin1 nor β-arrestin2 play a key role in bromocriptine-induced signaling following its activation of α2A-AR. Despite the lack of interactions with D2R and α2A-AR, β-arrestin1 still likely plays important functional roles in regulating β-cell function via interactions with other GPCRs including the glucagon-like peptide-1 (GLP-1) receptor (Sonoda et al., 2008).
GPCRs modulate hormone release via second messenger signaling through cAMP in both α- and β-cells (Tengholm and Gylfe, 2017). For example, incretins including glucagon, GLP-1, and glucose-dependent insulinotropic polypeptide (GIP) potentiate increased insulin release by activating stimulatory β-cell receptors that recruit Gαs, which boosts adenylate cyclase (AC) activity (Holst et al., 2009). The resulting elevation in cAMP production amplifies GSIS by activating protein kinase A (PKA) and Epac2 effector systems (Rorsman and Braun, 2013; Tengholm and Gylfe, 2017). Conversely, recruitment of inhibitory Gαi/o to β-cell α2-ARs lowers AC activity, which diminishes cAMP levels and negatively regulates insulin secretion (Schuit and Pipeleers, 1986). Consistent with these earlier studies, we show that activation of inhibitory D2R and α2A-AR receptors similarly reduces intracellular cAMP levels in INS-1E cells. These decreases in intracellular cAMP link our functional insulin secretion studies to an established signal transduction mechanism responsible for amplifying GSIS. Interestingly, although α2-AR KO increases DA’s potency in decreasing intracellular cAMP in INS-1E cells, we found the opposite was true for bromocriptine where α2-AR KO produces a ∼120-fold loss of potency compared with unmodified cells. Such potency differences suggest that bromocriptine relies significantly more on its stimulation of α2-AR to drive inhibition of intracellular cAMP levels compared with DA. It is also possible that the ensemble of G proteins recruited to α2-AR in response to bromocriptine is more effective in inhibiting AC activity versus the G proteins recruited following DA treatment; subsequent studies will address this possibility.
In parallel to our GSIS findings, we also demonstrate that bromocriptine lowers islet glucagon secretion. This raises the possibility that bromocriptine similarly diminishes cAMP production in α-cells, providing an additional putative target for this drug’s therapeutic actions. Future studies will dissect the intracellular signaling responsible for the drug’s effects on α-cell glucagon secretion. Indeed, such work may lead to better treatments for the hyperglucagonemia that precipitates chronic hyperglycemia and insulin resistance (Ballon et al., 2018; Freyberg et al., 2017; Simpson et al., 2012) to further improve glycemic control.
Molecular modeling of bromocriptine binding to D2R versus α2-AR provides structural insights into bromocriptine’s actions in our biological assays. Ligand docking analyses revealed that the molecular flexibility of ligands is a crucial determinant of binding affinity and specificity at both D2R and α2-AR. Since bromocriptine, as an ergopeptine, has both an ergoline core and a bicyclic tripeptide domain, these structural features enable the drug to adopt a more rigid conformation within the receptor binding pocket. The bulky peptide substituent found in ergopeptines may explain the binding differences between bromocriptine versus more flexible ligands including DA, NE, or ergolines (e.g., methysergide) (Choudhary et al., 1995). This is consistent with earlier work showing that distinct conformational features of ergopeptine structure confer differences in receptor binding compared with ergolines (Choudhary et al., 1995; Pierri et al., 1982). Overall, bromocriptine’s greater rigidity enables it to have strong interactions with key receptor binding pocket residues – features shared between D2R and α2-AR.
Importantly, bromocriptine’s ability to form a salt bridge that is present in α2-AR but is absent in D2R may account for key differences in bromocriptine’s actions between the two receptors. We propose that this salt bridge facilitates high-affinity agonist binding and G protein signaling, as has been described for other adrenergic receptors (e.g., β2-adrenergic receptors) (DeVree et al., 2016). Such structural features may account for bromocriptine’s higher binding affinity and potency versus DA and NE, as well as its partial agonism for coupling of specific G proteins to α2-AR (e.g., GαoA, GαoB, Gαz). Future mutagenesis and structural studies work will experimentally validate our models to better explain why a ligand such as bromocriptine can differentially affect signaling at D2R versus α2-AR.
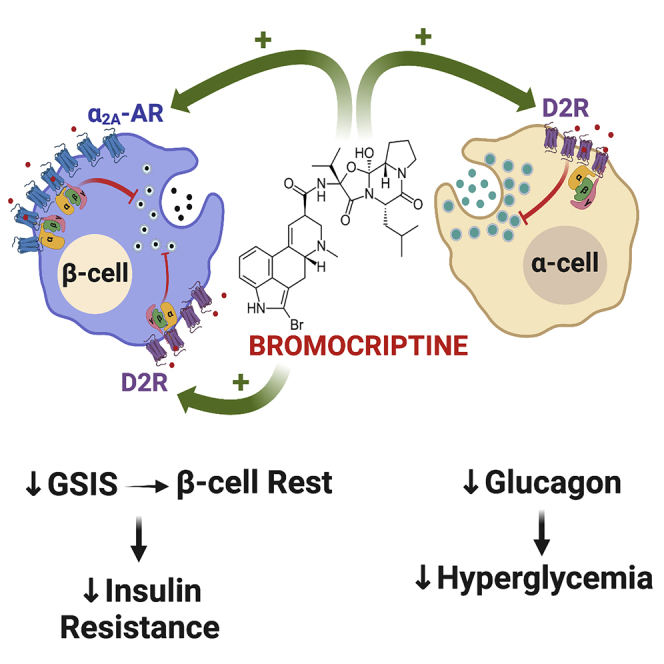
Based on our functional secretion and signaling data, we offer a model by which bromocriptine modifies pancreatic islet function to improve dysglycemia in diabetes (Figure 7). β-cells express D2R and α2A-AR that function as higher- and lower-affinity targets for bromocriptine, respectively. Bromocriptine stimulation of both β-cell D2R and α2A-AR results in receptor recruitment of inhibitory G proteins (e.g., GαoA, GαoB, Gαz) that diminish levels of intracellular cAMP and ultimately decrease GSIS. Suppression of insulin release from β-cells, which one might initially assume further drives β-cell activity owing to hyperglycemia, paradoxically leads to a form of “β-cell rest.” This has been increasingly recognized as a mechanism for correcting β-cell dysfunction in diabetes and improving glycemic control, particularly during hyperglycemia (Brown and Rother, 2008; Grill and Björklund, 2009; van Raalte and Verchere, 2017). In general, persistent hyperglycemia desensitizes β-cells to glucose, depletes β-cell insulin stores over time, and produces β-cell stress/toxicity, to cause or exacerbate dysglycemia (Brown and Rother, 2008; Grill and Björklund, 2009). Therefore, bromocriptine’s ability to diminish insulin secretion relieves β-cell stress and, again, paradoxically improves β-cell function during hyperglycemia (Brown and Rother, 2008; Grill and Björklund, 2009; Song et al., 2003). Such periodic β-cell rests are akin to “pumping the brakes,” which re-sensitize peripheral tissues to insulin to improve insulin resistance despite transient decreases in insulin secretion and transient hyperglycemia (van Raalte and Verchere, 2017). In parallel, bromocriptine stimulates α-cell D2R, which, as in β-cells, leads to the recruitment of inhibitory G proteins that lower glucagon secretion. The resulting decrease in hyperglucagonemia reduces hyperglycemia, which offsets the transient hyperglycemia caused by bromocriptine-induced decreases in GSIS as well as further ameliorates insulin resistance. Taken together, bromocriptine’s joint actions on dopaminergic and adrenergic receptors in pancreatic islets provide a novel mechanism for its therapeutic improvements in glycemic control.
Figure 7.

Model for bromocriptine’s therapeutic actions on α-cells and β-cells in diabetes
(1) In β-cells, bromocriptine stimulates both dopaminergic and adrenergic receptor populations including D2R and α2A-AR that function as high- and lower-affinity targets for bromocriptine, respectively. The resulting recruitment of distinct combinations of inhibitory G protein subtypes to these receptors decreases cAMP production and diminishes GSIS. This produces a state of β-cell rest, which reduces the β-cell stress present in diabetes and promotes improved β-cell metabolic function and viability. Bromocriptine-induced decreases in insulin release also ultimately re-sensitize insulin sensitive organs to reduce insulin resistance and improve overall dysglycemia.
(2) In parallel, bromocriptine potently acts on α-cell D2R to decrease glucagon secretion.
(3) The resulting decrease in hyperglucagonemia reduces hyperglycemia, which further ameliorates insulin resistance and glycemic control in diabetes.
Besides the endocrine pancreas, other metabolically relevant tissues in the periphery produce DA and/or rely on DA signaling. Prior studies demonstrated that peripheral DA stimulates glucose uptake in insulin-sensitive tissues including adipose tissue, liver, and skeletal muscle. Bromocriptine similarly increases both glucose uptake and insulin sensitivity in these tissues (Tavares et al., 2021a, 2021b). These data suggest that bromocriptine achieves its metabolic effects in part by targeting peripheral catecholamine receptors in addition to those in the pancreas. Consistent with this, D2R is expressed in adipose tissue and D2R-mediated signaling regulates adipokine expression (Borcherding et al., 2011; Freyberg et al., 2017; Wang et al., 2018).
Though we primarily focused on bromocriptine’s actions on catecholamine receptors, an important caveat of our work is that bromocriptine may also act on other receptor systems (Millan et al., 2002; Newman-Tancredi et al., 2002). Recent work showed that bromocriptine can improve cell stress as well as modify insulin resistance independently of its actions on catecholamine receptors (Henderson et al., 2021). This is consistent with evidence that bromocriptine can bind to multiple rodent and human serotonin receptors (Boess and Martin, 1994; Gillman, 2005, 2010; Kohen et al., 1996; Millan et al., 2002; Plassat et al., 1993; Shen et al., 1993). Bromocriptine’s actions on the serotonin system may be relevant to the endocrine pancreas since human and rodent β-cells also possess the machinery for serotonin synthesis (Almaca et al., 2016; Cataldo et al., 2016; Ohta et al., 2011; Richmond et al., 1996) and express serotonergic 5-HT2A and 5-HT2C receptors (Bennet et al., 2016; Xie et al., 2021; Zhang et al., 2013). Nevertheless, there is currently little consensus as to the precise roles of the serotonin system in the regulation of insulin secretion; existing findings claim either negligible, stimulatory, or inhibitory serotonergic effects on GSIS (Bennet et al., 2016; Xie et al., 2021; Zhang et al., 2013). It is possible that species-specific differences in β-cell serotonin receptor expression, and differences in genetic and/or diet-based rodent models of dysglycemia may account for these discrepant results. Notably, α-cells also express inhibitory serotonin 5-HT1F receptors, which diminish glucagon secretion upon stimulation (Almaca et al., 2016). Nevertheless, despite characterization of bromocriptine’s actions at most serotonin receptors (Gillman, 2010; Millan et al., 2002), to date, it remains unknown whether this is also the case for 5-HT1F receptors. Future pharmacologic and genetic studies including islet cell type-specific receptor deletion will be needed to definitively characterize bromocriptine’s actions at these non-catecholaminergic targets in α-cells and β-cells.
In summary, our results offer a new understanding of the interactions between dopaminergic and adrenergic receptor signaling in modulating pancreatic hormone release and islet function. The interactions between dopaminergic and adrenergic signaling in pancreatic islets are essential for the therapeutic mechanisms of the novel T2D drug bromocriptine. We establish that bromocriptine acts directly on pancreatic islets to modify both insulin and glucagon secretion via concurrent stimulation of both dopaminergic and adrenergic receptors in α-cells and β-cells. The resulting receptor activation triggers the recruitment of distinct ensembles of intracellular effectors unique to each receptor type. Consequently, our work provides critical novel mechanistic insights specifically into bromocriptine’s therapeutic actions on targets in the periphery. Ultimately, these insights open the door for the development of novel, more effective therapeutics for dysglycemia in diabetes that exploit this interplay between dopaminergic and adrenergic signaling.
Limitations of the study
Although we have shown that bromocriptine acts directly upon pancreatic α-cell and β-cell catecholamine receptors, our studies did not explore bromocriptine’s potential actions at additional receptor systems including serotonergic receptors. Likewise, we did not examine bromocriptine’s actions at other metabolically relevant tissues that express D2R such as adipose tissue. Further studies are required to examine these possibilities. Moreover, whereas we have modeled bromocriptine’s distinct actions at α2-AR versus D2R at the structural level, mutagenesis studies are needed to directly test our models.
STAR★Methods
Key resources table
| REAGENT or RESOURCE | SOURCE | IDENTIFIER |
|---|---|---|
| Biological samples | ||
| Human pancreatic islets | Pittsburgh, PA | N/A |
| Mouse pancreatic islets | Pittsburgh, PA | RRID:IMSR_APB:4790 |
| Chemicals, peptides, and recombinant proteins | ||
| Bromocriptine mesylate | Tocris Bioscience | Cat# 0427 |
| Yohimbine hydrochloride | Tocris Bioscience | Cat# 1127 |
| Dopamine hydrochloride | Sigma-Aldrich | Cat# H8502 |
| Norepinephrine bitartrate | Sigma-Aldrich | Cat# A0937 |
| Butaclamol hydrochloride | Sigma-Aldrich | Cat# D033 |
| [3H]RX821002 | Perkin Elmer | Cat# NET1153250UC |
| [3H]-N-methylspipirone | Perkin Elmer | Cat# NET856 |
| RPMI 1640 medium | Fisher Scientific | Cat# 11875093 |
| Opti-MEM™ I Reduced Serum Medium, no phenol red | Fisher Scientific | Cat# 11058021 |
| Hanks’ Balanced Salt Solution | Sigma-Aldrich | Cat# H8264 |
| Earle′s Balanced Salt Solution | Sigma-Aldrich | Cat# E3024 |
| cOmplete Mini, EDTA-free protease inhibitor cocktail tablets | Sigma-Aldrich | Cat# 11836170001 |
| MicroScint PS liquid scintillation cocktail | PerkinElmer | Cat# 6013631 |
| Lipofectamine 3000 transfection reagent | Fisher Scientific | Cat# L3000008 |
| Critical commercial assays | ||
| Insulin high range kit | Cisbio/PerkinElmer | Cat# 62IN1PEH |
| Glucagon kit | Cisbio/PerkinElmer | Cat# 62CGLPEH |
| cAMP Gs dynamic kit | Cisbio/PerkinElmer | Cat# 62AM4PEB |
| NanoBRET™ Nano-Glo® Detection System | Promega Corporation | Cat# N1662 |
| BCA protein assay kit | Fisher Scientific | Cat# PI23227 |
| RNeasy Plus Micro Kit | Qiagen | Cat# 74034 |
| QuantiTect SYBR Green PCR Kit | Qiagen | Cat# 204143 |
| Deposited data | ||
| Bromocriptine 3D structure | PubChem | ID 31101 |
| Dopamine 3D structure | PubChem | ID 65340 |
| Norepinephrine 3D structure | PubChem | ID 439260 |
| Yohimbine 3D structure | PubChem | ID 8969 |
| X-ray crystal structure of α2A-adrenergic receptor complexed with (S)-4-fluoro-2-(1H-imidazol-5-yl)-1-iso-propylindoline | RCSB PDB | PDB 6KUY |
| Cryo-EM structure of bromocriptine-bound dopamine D2 receptor-G protein complex in a lipid membrane | RCSB PDB | PDB 6VMS |
| Cryo-EM structure of bromocriptine-bound dopamine D2receptor in complex with Gi protein | RCSB PDB | PDB 7JVR |
| Experimental models: Cell lines | ||
| INS-1E cells | Dr. Pierre Maechler, Université de Genève | RRID:CVCL_0351 |
| Adra2a knockout INS-1E cells | Freyberg laboratory | N/A |
| HEK-293 cells | ATCC | Cat# CRL-1573; RRID:CVCL_0045 |
| HEK-293T cells | ATCC | Cat# CRL-3216; RRID:CVCL_0063 |
| Experimental models: Organisms/strains | ||
| Mouse: BALB/c | The Jackson Laboratory | JAX: 000651; RRID:IMSR_JAX:000651 |
| Oligonucleotides | ||
| Ins1forward and reverse qPCR primers (details found in 'Quantitative real-time PCR' method) | Thermo Fisher Scientific (custom-designed by Freyberg laboratory) | N/A |
| Recombinant DNA | ||
| IL6-HiBiT-D2R-HaloTag | Freyberg lab | N/A |
| IL6-HiBiT-α2A-AR-HaloTag | Freyberg lab | N/A |
| NanoLuc-Gαi1(91) | Freyberg lab | N/A |
| NanoLuc-Gαi2(91) | Freyberg lab | N/A |
| NanoLuc-Gαi3(91) | Freyberg lab | N/A |
| NanoLuc-GαoA(91) | Freyberg lab | N/A |
| NanoLuc-GαoB(91) | Freyberg lab | N/A |
| NanoLuc-Gαz(91) | Freyberg lab | N/A |
| Software and algorithms | ||
| PRISM GraphPad (7.02) | GraphPad Software | https://www.graphpad.com/scientific-software/prism/; RRID:SCR_002798 |
| RosettaLigand | https://www.rosettacommons.org | |
| BioRender | Biorender.com | https://biorender.com/; RRID:SCR_018361 |
Resource availability
Lead contact
Further information and requests for resources and reagents should be directed to and will be fulfilled by the lead contact, Zachary Freyberg (freyberg@pitt.edu).
Material availability
All new and unique plasmids or cell lines in this study are available upon request from the lead contact through an MTA.
Experimental model and subject details
Animal husbandry
Animals were housed and handled in accordance with appropriate NIH guidelines through the University of Pittsburgh Institutional Animal Care and Use Committee (Protocol # 19075490), which approved the study. We abided by all appropriate animal care guidelines including ARRIVE guidelines for reporting animal research. Mice were housed in cages with a 12:12 light:dark cycle and had access to food and water ad lib at all times. Every effort was made to ameliorate animal suffering.
Human subjects
Pancreata were obtained from non-diabetic adult donors via a partnership with CORE (Center for Organ Recovery and Education) as described previously (Aslanoglou et al., 2021). Donor demographic information is summarized in Table 2. The Institutional Review Board of the University of Pittsburgh declared studies on de-identified human pancreatic specimens do not qualify as human subject research.
Pancreatic islet preparation
Mouse pancreatic islets were obtained from 8 to 10-week-old wildtype BALB/c mice. Islets were freshly isolated via collagenase digestion of pancreata as described previously (Bertera et al., 2012). Human pancreatic islets were isolated via collagenase digestion and allowed to recover overnight in complete RPMI 1640 media supplemented with 10% FBS prior to use in hormone secretion assays as described earlier (Aslanoglou et al., 2021; Balamurugan et al., 2003).
Cell culture
INS-1E cells (gift of Dr. Pierre Maechler, Université de Genève) were cultured as previously described (Farino et al., 2020; Merglen et al., 2004). We also used a clonal α2A-AR KO cell line derived from the original INS-1E cell line which was described earlier (Aslanoglou et al., 2021). Both INS-1E cells and INS-1E-derived α2A-AR KO cells were maintained in RPMI 1640 medium supplemented with 5% (v/v) heat-inactivated fetal bovine serum, 2 mM L-glutamine, 10 mM HEPES, 1 mM sodium pyruvate, 100 U/mL penicillin/streptomycin, and 50 μM 2-mercaptoethanol. HEK-293 cells (ATCC, #CRL-1573) and HEK-293T cells (ATCC, #CRL-3216) were cultured in DMEM medium supplemented with 10% FBS and 100 U/mL penicillin/streptomycin. All cell lines were maintained in a humidified 37°C incubator with 5% CO2 and tested negative for mycoplasma contamination.
Method details
Hormone secretion assays
Glucose-stimulated insulin secretion (GSIS)
For mouse islets, following overnight recovery, islets were glucose-starved by placement into KRB buffer (132.2 mM NaCl, 3.6 mM KCl, 5 mM NaHCO3, 0.5 mM NaH2PO4, 0.5 mM MgCl2, 1.5 mM CaCl2, and 0.001 g/mL BSA, pH 7.4) supplemented with 2.8 mM glucose (1 h, 37°C) as described earlier (Aslanoglou et al., 2021; Farino et al., 2020). Islets were then glucose-stimulated by addition of glucose-supplemented KRB (20 mM glucose final concentration) in the presence of drugs or vehicle (90 min, 37°C). For INS-1E cells and INS-1E-derived α2A-AR KO cells, glucose stimulation was conducted as described earlier (Aslanoglou et al., 2018, 2021). Briefly, cells were seeded into poly-L-Lysine-coated 24-well plates at 5 × 10⁵ cells/well and cultured overnight. Insulin secretion assays were conducted 48 h after cell seeding. On the experimental day, cells were glucose-starved in KRB (0 mM glucose, 1 h), followed by glucose stimulation with KRB supplemented with 20 mM glucose in the presence of drugs or vehicle (90 min, 37°C). For islets and cells, at assay conclusion, supernatants were collected and diluted 1:10 in KRB for insulin detection.
Glucagon secretion
Following islet isolation and overnight recovery in complete RPMI 1640 medium (containing 11 mM glucose), human or mouse islets were transitioned to complete RPMI 1640 media supplemented with 25 mM glucose. This enabled us to diminish the high levels of basal glucagon secretion in islets to unmask drug-mediated effects on glucagon secretion as described earlier (Aslanoglou et al., 2021; Hughes et al., 2018). Islets were then treated with different bromocriptine concentrations in glucose-supplemented KRB (25 mM glucose final concentration) (1 h, 37°C). After treatment, KRB was supplemented with protease inhibitors (1 tablet/10 mL KRB; Roche Diagnostics, Mannheim, Germany) which were added to each well to prevent glucagon degradation. Collected supernatants were then placed on ice to further prevent glucagon degradation and precipitation. Undiluted supernatants and 1:2 dilutions in KRB were used for the detection of glucagon; for human islets, secreted insulin was also measured.
Hormone detection
For insulin detection, we used a commercially available insulin detection kit (high-range; PerkinElmer/Cisbio Bioassays, Bedford, MA) based on homogeneous time-resolved fluorescence resonance energy transfer (HTRF) technology as described in detail previously (Aslanoglou et al., 2018). Briefly, standard curve and supernatant samples were plated in a 384-well white, low-volume, round-bottom plate (Corning, Corning, NY). Two anti-insulin antibodies were mixed in a 1:2 donor (cryptate)/acceptor (XL665) ratio in assay detection buffer (Cisbio) and added to each sample. For glucagon detection, we used a similar HTRF-based glucagon detection kit (Cisbio Bioassays) according to manufacturer instructions (Aslanoglou et al., 2021). For both glucagon and insulin HTRF assays, samples were incubated with the antibodies for 2 h at room temperature. Plates were read using a PheraStar FSX equipped with an HTRF optic module (BMG Labtech, Ortenberg, Germany). Integration start was set at 60 μs and the integration time was 400 μs with 200 flashes/well. Insulin and glucagon concentrations were derived via extrapolation of ratiometric fluorescence readings (665 nm/620 nm) to a second-order quadratic polynomial curve. The raw data were obtained in ng/mL insulin secreted and pg/mL glucagon secreted. Dose-response curves were fit via non-linear regression of Log[ligand] versus normalized % maximum glucagon or % maximum insulin secretion via GraphPad software (version 7.02, GraphPad Software, San Diego, CA). IC50 values were calculated from these non-linear regression analyses.
cAMP assay
Drug-induced changes in intracellular cAMP were measured using an HTRF-based cAMP assay kit according to manufacturer instructions (PerkinElmer/Cisbio Bioassays). INS-1E cells or INS-1E-derived α2A-AR KO cells were seeded into 384-well white, small volume, round bottom plates (Greiner Bio-One, Monroe, NC) at 5×10³ cells/well. Cells were subsequently resuspended in Hanks’ Balanced Salt Solution (HBSS, Sigma-Aldrich) containing forskolin (5 μM final concentration) and incubated in the presence of either drugs or vehicle diluted in stimulation buffer containing 500 μM IBMX (1 h, 37°C). After stimulation, the cells were lysed and incubated with HTRF reagents: anti-cAMP-Ab-d2 (energy acceptor) and cAMP-cryptate (donor) (1 h, room temperature). Concentrations of cAMP (in nM) from samples were extrapolated from a cAMP standard curve normalized to % cAMP inhibition from samples treated only with forskolin. Dose-response curves were fit using non-linear regression of Log[ligand] versus normalized % cAMP inhibition via GraphPad software.
Quantitative real-time PCR
Total mRNA was isolated from unmodified parental INS-1E cells and the INS-1E-derived α2A-AR KO cell line using RNeasy Plus Micro kit (Qiagen, Valencia, CA) followed by reverse transcription via the Superscript III First-Strand Synthesis System (Thermo Fisher Scientific) according to manufacturers’ instructions. Using the respective cDNA, Ins1 expression was detected by quantitative real-time PCR (qPCR). cDNA was subjected to 30–40 cycles of qPCR using the QuantiTect SYBR Green PCR Kit (Qiagen) and SYBR Select Master mix (Sigma-Aldrich) and quantified according to the 2ΔΔCt method in 10 μL reactions containing 1X SYBR Green or SYBR Select Master mix (Sigma-Aldrich). For these reactions, we used 0.5 μM of forward and reverse primers (Ins1 forward primer: 5′-AGCATCGGAAAGACGAACCG-3′ and Ins1 reverse primer: 5′-GTGCAAAAGAGCACGTCGAG-3′). Data were normalized to the expression of the reference gene Tbp which encodes TATA-binding protein.
Radioligand assays
Radioligand competition-binding assays were conducted as described earlier (Aslanoglou et al., 2021; Free et al., 2014; Sánchez-Soto et al., 2018). Briefly, INS-1E cells endogenously expressing α2A-AR or transfected HEK-293 cells overexpressing either human α2A-AR or human D2R were dissociated from plates, and intact cells were collected by centrifugation (600g, 5 min, 4°C). Cells were resuspended and lysed in 5 mM Tris-HCl and 5 mM MgCl2 (pH 7.4, 4°C). Cell lysates were pelleted by centrifugation (30,000g, 30 min) and resuspended in Earle′s Balanced Salt Solution (EBSS, Sigma-Aldrich) with Ca2+. Lysates (100 μL, 2–5 μg of protein for HEK-293 cells and 10–20 μg of protein for INS-1E cells, quantified by the BCA protein assay) were then incubated with the indicated concentrations of bromocriptine and 0.4–0.9 nM [3H]-RX821002 (PerkinElmer, Billerica, MA) for α2A-AR assays or with 0.2–0.3 nM [3H]-N-methylspipirone (PerkinElmer) for D2R assays (90 min, room temperature). Nonspecific binding was determined either in the presence of 10 μM yohimbine (for α2A-AR assays) or 4 μM butaclamol (for D2R assays). Bound ligand was separated from free ligand by filtration through a PerkinElmer Unifilter-96 GF/C 96-well microplate using the PerkinElmer Unifilter-96 Harvester (PerkinElmer, Waltham, MA), followed by washing in ice-cold assay buffer. After drying, liquid scintillation cocktail (MicroScint PS; PerkinElmer) was added to each well, and plates were sealed and analyzed on a PerkinElmer TopCount NXT liquid scintillation counter. Ki values were calculated from observed IC50 values using the Cheng-Prusoff equation (Cheng and Prusoff, 1973).
NanoBRET
DNA constructs
NanoBRET experiments employed receptor constructs consisting of either human D2R (DRD2) or rat α2A-AR (Adra2a) cDNAs tagged at the N-terminus with an IL6 signal sequence followed by a HiBiT tag and tagged at the C-terminus with a HaloTag: IL6-HiBiT-D2R-HaloTag, IL6-HiBiT-α2A-AR-HaloTag. For G protein recruitment studies, we used human Gαi1, Gαi2, Gαi3, GαoA, GαoB, Gαz with nanoluciferase (NanoLuc) inserted at position 91 for all the G proteins: NanoLuc-Gαi1(91), NanoLuc-Gαi2(91), NanoLuc-Gαi3(91), NanoLuc-GαoA(91), NanoLuc-GαoB(91), NanoLuc-Gαz(91). Nanoluc was also fused to the N-termini of human β-arrestin1 and β-arrestin2: NanoLuc-β-arrestin1 and NanoLuc-β-arrestin2, respectively. All constructs were prepared by Genscript USA (Piscataway, NJ) and cloned into a pcDNA3.1(+) vector backbone (Thermo Fisher Scientific). Constructs were confirmed by sequencing analysis.
Transfection
HEK-293T cells were transfected upon 70% confluency using Lipofectamine 3000 (Thermo Fisher Scientific) (2.5 μg total cDNA) according to manufacturer instructions. The following nanoBRET donor/acceptor pair ratios were used for transfections: 50 (IL6-HiBiT-α2A-AR-HaloTag):1 (NanoLuc-G protein subtypes or NanoLuc-β-arrestin2) and 100 (IL6-HiBiT-D2R-HaloTag):1 (NanoLuc-G protein subtypes or NanoLuc-β-arrestin2). For NanoLuc-only controls, empty pcDNA3.1(+) vector was used to maintain a constant amount of total transfected DNA.
NanoBRET
Post-transfection, cells were plated onto poly-D-Lysine pre-coated, white, 96-well, flat bottom plates (Greiner Bio-One) at a density of 5 × 10⁴ cells/well. After adhering to the plates overnight, cells were washed with HBSS and labeled with 100 nM HaloTag NanoBRET 618 ligand (Promega Corp., Fitchburg, WI) in phenol red-free Opti-MEM I reduced serum medium (Gibco/Thermo Fisher Scientific) (2 h, 37°C). Cells were subsequently washed with HBSS and 5 μM furimazine was added to every well followed by the respective drug treatments. Plates were then read 5 min post-drug addition. All assays (except for β-arrestin1 recruitment assays) employed a PHERAstar FSX equipped with a nanoBRET-compatible optic module (LUM 610 450) (BMG Labtech); β-arrestin1 recruitment assays were read via a CLARIOstar Plus equipped with nanoBRET-compatible 620-610 nm/435 nm emission filters (BMG Labtech). The nanoBRET ratio was calculated as the emission of the acceptor (618 nm) divided by the emission of the donor (460 nm). Net nanoBRET values were obtained by subtracting the background nanoBRET ratio obtained from cells expressing only NanoLuc. Data were normalized to the % maximum response of either NE for α2A-AR experiments or DA for D2R experiments. NanoBRET data were further normalized to define the minimum and maximum response to the corresponding endogenous ligand. EC50 values were calculated by non-linear regression analysis via GraphPad software.
Protein-ligand docking
The three-dimensional structures of ligands including bromocriptine (ID 31101), DA (ID 65340), NE (ID 439260) and yohimbine (ID 8969) were obtained from PubChem. Conformers were generated using the BioChemical Library (BCL) (Kothiwale et al., 2015). Receptor-ligand docking was performed in RosettaLigand using the small perturbation of ligand position protocol and swapping of ligand conformers (Lemmon and Meiler, 2012; Meiler and Baker, 2006). We used two cryo-EM complexes of bromocriptine bound to D2R (PDB 6VMS and 7JVR) (Yin et al., 2020; Zhuang et al., 2021) as templates to predict bromocriptine’s binding interactions at α2A-AR, followed by docking bromocriptine to α2A-AR using the X-ray crystal structure of α2A-AR complexed with a partial agonist, (S)-4-fluoro-2-(1H-imidazol-5-yl)-1-iso-propylindoline (PDB 6KUY) (Qu et al., 2019). 2000 models for each protein-ligand complex were generated. Models were sorted initially by total energy and then culled to the top 5% of models by interface energies for analysis.
Quantification and statistical analysis
GraphPad Prism (version 7.02) was used for all statistical analyses. Two-tailed Student’s t-tests were used to analyze qPCR analyses comparing Ins1 expression and insulin secretion in α2A-AR KO cells versus control parental INS-1E cells. One-way ANOVA followed by Dunnett’s multiple comparisons tests were used to analyze differences between effects of bromocriptine treatments on glucagon secretion from mouse and human islets. Nonlinear regression was used to fit curves to GSIS from mouse islets in response to: 1) bromocriptine co-treatment with either yohimbine or sulpiride versus bromocriptine alone; or 2) α2A-AR KO versus the unmodified parental cell line. Coefficients from the fitted curves were used to compare the effects of yohimbine, sulpiride, or α2A-AR KO across varying doses of bromocriptine. Sample sizes were initially chosen based on power analyses assuming an effect size of 0.60, power level of 0.80, and a probability level for statistical significance of 0.05.
Acknowledgments
This study was supported by awards from the Department of Defense PR141292, PR210207 (Z.F.), National Institutes of Health (NIH) R01DK124219 (Z.F.), R21AG068607 (Z.F.), R21DA052419 (Z.F.), R21AA028800 (Z.F.), the John F. and Nancy A. Emmerling Fund of The Pittsburgh Foundation (Z.F.), the Intramural Research Program of the National Institute of Neurological Disorders and Stroke (ZIA-NS002263) at the NIH (M.S.S., R.B.F., D.R.S.), Veterans Affairs VA-ORD-BLR&D I01BX002678 (V.K.Y.), and NIH R01DK130499 (V.K.Y.). Work in the Meiler laboratory is supported by NIH NIDA R01DA046138 and by the Deutsche Forschungsgemeinschaft (DFG, German Research Foundation) through SFB1423, project number 421152132. P.J.M. is supported by the UKRI BBSRC grant BB/R006946/1. J.M. is supported by a Humboldt Professorship of the Alexander von Humboldt Foundation. We thank Drs. George Gittes, Amy Newman, Yi Sheng, and Andrea Workman for technical and conceptual support. Schematic figures were created with BioRender.com.
Author contributions
The study was designed and conceptualized by Z.F. and D.A. Experiments were conducted by D.A., S.B., M.S.S., and J.L. Experimental design and data interpretation were conducted by D.A., S.B., M.S.S., J.L., X.X., R.W.L., J.R.L., V.K.Y., P.J.M., R.B.F., D.R.S., R.B., and Z.F. Computational modeling studies were conducted by L.F. and J.M. The manuscript was written by D.A. and Z.F. with input from the other authors.
Declaration of interests
The authors declare no competing interests.
Published: August 19, 2022
Footnotes
Supplemental information can be found online at https://doi.org/10.1016/j.isci.2022.104771.
Supplemental information
Data and code availability
-
•
All data reported in this paper will be shared by the lead contact upon request.
-
•
This paper does not report original code.
-
•
Any additional information required to reanalyze the data reported in this paper is available from the lead contact upon request.
References
- Almaça J., Molina J., Menegaz D., Pronin A.N., Tamayo A., Slepak V., Berggren P.O., Caicedo A. Human beta cells produce and release serotonin to inhibit glucagon secretion from alpha cells. Cell Rep. 2016;17:3281–3291. doi: 10.1016/j.celrep.2016.11.072. [DOI] [PMC free article] [PubMed] [Google Scholar]
- Aslanoglou D., George E.W., Freyberg Z. Homogeneous time-resolved forster resonance energy transfer-based assay for detection of insulin secretion. J. Vis. Exp. 2018 doi: 10.3791/57531. [DOI] [PMC free article] [PubMed] [Google Scholar]
- Aslanoglou D., Bertera S., Sánchez-Soto M., Benjamin Free R., Lee J., Zong W., Xue X., Shrestha S., Brissova M., Logan R.W., et al. Dopamine regulates pancreatic glucagon and insulin secretion via adrenergic and dopaminergic receptors. Transl. Psychiatry. 2021;11:59. doi: 10.1038/s41398-020-01171-z. [DOI] [PMC free article] [PubMed] [Google Scholar]
- Balamurugan A.N., Chang Y., Fung J.J., Trucco M., Bottino R. Flexible management of enzymatic digestion improves human islet isolation outcome from sub-optimal donor pancreata. Am. J. Transplant. 2003;3:1135–1142. doi: 10.1046/j.1600-6143.2003.00184.x. [DOI] [PubMed] [Google Scholar]
- Ballon J.S., Pajvani U., Freyberg Z., Leibel R.L., Lieberman J.A. Molecular pathophysiology of metabolic effects of antipsychotic medications. Trends Endocrinol. Metab. 2014;25:593–600. doi: 10.1016/j.tem.2014.07.004. [DOI] [PubMed] [Google Scholar]
- Ballon J.S., Pajvani U.B., Mayer L.E., Freyberg Z., Freyberg R., Contreras I., Rosenbaum M., Leibel R.L., Lieberman J.A. Pathophysiology of drug induced weight and metabolic effects: findings from an RCT in healthy volunteers treated with olanzapine, iloperidone, or placebo. J. Psychopharmacol. 2018;32:533–540. doi: 10.1177/0269881118754708. [DOI] [PMC free article] [PubMed] [Google Scholar]
- Barella L.F., Rossi M., Zhu L., Cui Y., Mei F.C., Cheng X., Chen W., Gurevich V.V., Wess J. β-Cell-intrinsic β-arrestin 1 signaling enhances sulfonylurea-induced insulin secretion. J. Clin. Invest. 2019;129:3732–3737. doi: 10.1172/jci126309. [DOI] [PMC free article] [PubMed] [Google Scholar]
- Barella L.F., Rossi M., Pydi S.P., Meister J., Jain S., Cui Y., Gavrilova O., Fulgenzi G., Tessarollo L., Wess J. β-Arrestin-1 is required for adaptive β-cell mass expansion during obesity. Nat. Commun. 2021;12:3385. doi: 10.1038/s41467-021-23656-1. [DOI] [PMC free article] [PubMed] [Google Scholar]
- Barnard N.D., Noble E.P., Ritchie T., Cohen J., Jenkins D.J.A., Turner-McGrievy G., Gloede L., Green A.A., Ferdowsian H. D2 dopamine receptor Taq1A polymorphism, body weight, and dietary intake in type 2 diabetes. Nutrition. 2009;25:58–65. doi: 10.1016/j.nut.2008.07.012. [DOI] [PMC free article] [PubMed] [Google Scholar]
- Beaulieu J.M., Gainetdinov R.R. The physiology, signaling, and pharmacology of dopamine receptors. Pharmacol. Rev. 2011;63:182–217. doi: 10.1124/pr.110.002642. [DOI] [PubMed] [Google Scholar]
- Beaulieu J.M., Sotnikova T.D., Marion S., Lefkowitz R.J., Gainetdinov R.R., Caron M.G. An Akt/beta-arrestin 2/PP2A signaling complex mediates dopaminergic neurotransmission and behavior. Cell. 2005;122:261–273. doi: 10.1016/j.cell.2005.05.012. S0092-8674(05)00457-5. [DOI] [PubMed] [Google Scholar]
- Beaulieu J.M., Gainetdinov R.R., Caron M.G. The Akt-GSK-3 signaling cascade in the actions of dopamine. Trends Pharmacol. Sci. 2007;28:166–172. doi: 10.1016/j.tips.2007.02.006. S0165-6147(07)00053-3. [DOI] [PubMed] [Google Scholar]
- Beaulieu J.M., Espinoza S., Gainetdinov R.R. Dopamine receptors - IUPHAR review 13. Br. J. Pharmacol. 2015;172:1–23. doi: 10.1111/bph.12906. [DOI] [PMC free article] [PubMed] [Google Scholar]
- Bennet H., Mollet I.G., Balhuizen A., Medina A., Nagorny C., Bagge A., Fadista J., Ottosson-Laakso E., Vikman P., Dekker-Nitert M., et al. Serotonin (5-HT) receptor 2b activation augments glucose-stimulated insulin secretion in human and mouse islets of Langerhans. Diabetologia. 2016;59:744–754. doi: 10.1007/s00125-015-3847-6. [DOI] [PubMed] [Google Scholar]
- Berger M., Scheel D.W., Macias H., Miyatsuka T., Kim H., Hoang P., Ku G.M., Honig G., Liou A., Tang Y., et al. Gαi/o-coupled receptor signaling restricts pancreatic β-cell expansion. Proc. Natl. Acad. Sci. USA. 2015;112:2888–2893. doi: 10.1073/pnas.1319378112. [DOI] [PMC free article] [PubMed] [Google Scholar]
- Bertera S., Balamurugan A.N., Bottino R., He J., Trucco M. Increased yield and improved transplantation outcome of mouse islets with bovine serum albumin. J. Transplant. 2012;2012:856386. doi: 10.1155/2012/856386. [DOI] [PMC free article] [PubMed] [Google Scholar]
- Boess F.G., Martin I.L. Molecular biology of 5-HT receptors. Neuropharmacology. 1994;33:275–317. doi: 10.1016/0028-3908(94)90059-0. [DOI] [PubMed] [Google Scholar]
- Borcherding D.C., Hugo E.R., Idelman G., De Silva A., Richtand N.W., Loftus J., Ben-Jonathan N. Dopamine receptors in human adipocytes: expression and functions. PLoS One. 2011;6:e25537. doi: 10.1371/journal.pone.0025537. [DOI] [PMC free article] [PubMed] [Google Scholar]
- Brown R.J., Rother K.I. Effects of beta-cell rest on beta-cell function: a review of clinical and preclinical data. Pediatr. Diabetes. 2008;9:14–22. doi: 10.1111/j.1399-5448.2007.00272.x. [DOI] [PMC free article] [PubMed] [Google Scholar]
- Cataldo L.R., Mizgier M.L., Busso D., Olmos P., Galgani J.E., Valenzuela R., Mezzano D., Aranda E., Cortés V.A., Santos J.L. Serotonin- and dopamine-related gene expression in db/db mice islets and in MIN6 β-cells treated with palmitate and oleate. J. Diabetes Res. 2016;2016:3793781. doi: 10.1155/2016/3793781. [DOI] [PMC free article] [PubMed] [Google Scholar]
- Chen Y., Hong F., Chen H., Fan R.F., Zhang X.L., Zhang Y., Zhu J.X. Distinctive expression and cellular distribution of dopamine receptors in the pancreatic islets of rats. Cell Tissue Res. 2014;357:597–606. doi: 10.1007/s00441-014-1894-9. [DOI] [PubMed] [Google Scholar]
- Cheng Y., Prusoff W.H. Relationship between the inhibition constant (K1) and the concentration of inhibitor which causes 50 per cent inhibition (I50) of an enzymatic reaction. Biochem. Pharmacol. 1973;22:3099–3108. doi: 10.1016/0006-2952(73)90196-2. [DOI] [PubMed] [Google Scholar]
- Choudhary M.S., Sachs N., Uluer A., Glennon R.A., Westkaemper R.B., Roth B.L. Differential ergoline and ergopeptine binding to 5-hydroxytryptamine2A receptors: ergolines require an aromatic residue at position 340 for high affinity binding. Mol. Pharmacol. 1995;47:450–457. [PubMed] [Google Scholar]
- Cincotta A.H., MacEachern T.A., Meier A.H. Bromocriptine redirects metabolism and prevents seasonal onset of obese hyperinsulinemic state in Syrian hamsters. Am. J. Physiol. 1993;264:E285–E293. doi: 10.1152/ajpendo.1993.264.2.E285. [DOI] [PubMed] [Google Scholar]
- Cottingham C., Chen Y., Jiao K., Wang Q. The antidepressant desipramine is an arrestin-biased ligand at the α(2A)-adrenergic receptor driving receptor down-regulation in vitro and in vivo. J. Biol. Chem. 2011;286:36063–36075. doi: 10.1074/jbc.M111.261578. [DOI] [PMC free article] [PubMed] [Google Scholar]
- de Leeuw van Weenen J.E., Parlevliet E.T., Maechler P., Havekes L.M., Romijn J.A., Ouwens D.M., Pijl H., Guigas B. The dopamine receptor D2 agonist bromocriptine inhibits glucose-stimulated insulin secretion by direct activation of the alpha2-adrenergic receptors in beta cells. Biochem. Pharmacol. 2010;79:1827–1836. doi: 10.1016/j.bcp.2010.01.029. [DOI] [PubMed] [Google Scholar]
- de Leeuw van Weenen J.E., Auvinen H.E., Parlevliet E.T., Coomans C.P., Schröder-van der Elst J.P., Meijer O.C., Pijl H. Blocking dopamine D2 receptors by haloperidol curtails the beneficial impact of calorie restriction on the metabolic phenotype of high-fat diet induced obese mice. J. Neuroendocrinol. 2011;23:158–167. doi: 10.1111/j.1365-2826.2010.02092.x. [DOI] [PubMed] [Google Scholar]
- de Leeuw van Weenen J.E., Parlevliet E.T., Schröder-van der Elst J.P., van den Berg S.A., Willems van Dijk K., Romijn J.A., Pijl H. Pharmacological modulation of dopamine receptor D2-mediated transmission alters the metabolic phenotype of diet induced obese and diet resistant C57Bl6 mice. Exp. Diabetes Res. 2011;2011:928523. doi: 10.1155/2011/928523. [DOI] [PMC free article] [PubMed] [Google Scholar]
- Defronzo R.A. Bromocriptine: a sympatholytic, d2-dopamine agonist for the treatment of type 2 diabetes. Diabetes Care. 2011;34:789–794. doi: 10.2337/dc11-0064. [DOI] [PMC free article] [PubMed] [Google Scholar]
- DeVree B.T., Mahoney J.P., Vélez-Ruiz G.A., Rasmussen S.G.F., Kuszak A.J., Edwald E., Fung J.J., Manglik A., Masureel M., Du Y., et al. Allosteric coupling from G protein to the agonist-binding pocket in GPCRs. Nature. 2016;535:182–186. doi: 10.1038/nature18324. [DOI] [PMC free article] [PubMed] [Google Scholar]
- Farino Z.J., Morgenstern T.J., Vallaghe J., Gregor N., Donthamsetti P., Harris P.E., Pierre N., Freyberg R., Charrier-Savournin F., Javitch J.A., Freyberg Z. Development of a rapid insulin assay by homogenous time-resolved fluorescence. PLoS One. 2016;11:e0148684. doi: 10.1371/journal.pone.0148684. [DOI] [PMC free article] [PubMed] [Google Scholar]
- Farino Z.J., Morgenstern T.J., Maffei A., Quick M., De Solis A.J., Wiriyasermkul P., Freyberg R.J., Aslanoglou D., Sorisio D., Inbar B.P., et al. New roles for dopamine D(2) and D(3) receptors in pancreatic beta cell insulin secretion. Mol. Psychiatry. 2020;25:2070–2085. doi: 10.1038/s41380-018-0344-6. [DOI] [PMC free article] [PubMed] [Google Scholar]
- Free R.B., Chun L.S., Moritz A.E., Miller B.N., Doyle T.B., Conroy J.L., Padron A., Meade J.A., Xiao J., Hu X., et al. Discovery and characterization of a G protein-biased agonist that inhibits beta-arrestin recruitment to the D2 dopamine receptor. Mol. Pharmacol. 2014;86:96–105. doi: 10.1124/mol.113.090563. [DOI] [PMC free article] [PubMed] [Google Scholar]
- Freyberg Z., Logan R.W. The intertwined roles of circadian rhythms and neuronal metabolism fueling drug reward and addiction. Curr. Opin. Physiol. 2018;5:80–89. doi: 10.1016/j.cophys.2018.08.004. [DOI] [PMC free article] [PubMed] [Google Scholar]
- Freyberg Z., Ferrando S.J., Javitch J.A. Roles of the Akt/GSK-3 and Wnt signaling pathways in schizophrenia and antipsychotic drug action. Am. J. Psychiatry. 2010;167:388–396. doi: 10.1176/appi.ajp.2009.08121873. [DOI] [PMC free article] [PubMed] [Google Scholar]
- Freyberg Z., Aslanoglou D., Shah R., Ballon J.S. Intrinsic and antipsychotic drug-induced metabolic dysfunction in schizophrenia. Front. Neurosci. 2017;11:432. doi: 10.3389/fnins.2017.00432. [DOI] [PMC free article] [PubMed] [Google Scholar]
- Fridlyand L.E., Philipson L.H. Pancreatic beta cell G-protein coupled receptors and second messenger interactions: a systems biology computational analysis. PLoS One. 2016;11:e0152869. doi: 10.1371/journal.pone.0152869. [DOI] [PMC free article] [PubMed] [Google Scholar]
- García-Tornadú I., Ornstein A.M., Chamson-Reig A., Wheeler M.B., Hill D.J., Arany E., Rubinstein M., Becu-Villalobos D. Disruption of the dopamine d2 receptor impairs insulin secretion and causes glucose intolerance. Endocrinology. 2010;151:1441–1450. doi: 10.1210/en.2009-0996. [DOI] [PubMed] [Google Scholar]
- García-Tornadú I., Perez-Millan M.I., Recouvreux V., Ramirez M.C., Luque G., Risso G.S., Ornstein A.M., Cristina C., Diaz-Torga G., Becu-Villalobos D. New insights into the endocrine and metabolic roles of dopamine D2 receptors gained from the Drd2 mouse. Neuroendocrinology. 2010;92:207–214. doi: 10.1159/000321395. [DOI] [PubMed] [Google Scholar]
- Gillman P.K. Monoamine oxidase inhibitors, opioid analgesics and serotonin toxicity. Br. J. Anaesth. 2005;95:434–441. doi: 10.1093/bja/aei210. [DOI] [PubMed] [Google Scholar]
- Gillman P.K. Triptans, serotonin agonists, and serotonin syndrome (serotonin toxicity): a review. Headache. 2010;50:264–272. doi: 10.1111/j.1526-4610.2009.01575.x. [DOI] [PubMed] [Google Scholar]
- Grill V., Björklund A. Impact of metabolic abnormalities for beta cell function: clinical significance and underlying mechanisms. Mol. Cell. Endocrinol. 2009;297:86–92. doi: 10.1016/j.mce.2008.06.009. [DOI] [PubMed] [Google Scholar]
- Han F., Konkalmatt P., Mokashi C., Kumar M., Zhang Y., Ko A., Farino Z.J., Asico L.D., Xu G., Gildea J., et al. Dopamine D2 receptor modulates Wnt expression and control of cell proliferation. Sci. Rep. 2019;9:16861. doi: 10.1038/s41598-019-52528-4. [DOI] [PMC free article] [PubMed] [Google Scholar]
- Henderson M.J., Trychta K.A., Yang S.M., Bäck S., Yasgar A., Wires E.S., Danchik C., Yan X., Yano H., Shi L., et al. A target-agnostic screen identifies approved drugs to stabilize the endoplasmic reticulum-resident proteome. Cell Rep. 2021;35:109040. doi: 10.1016/j.celrep.2021.109040. [DOI] [PMC free article] [PubMed] [Google Scholar]
- Hilger D. The role of structural dynamics in GPCR-mediated signaling. FEBS J. 2021;288:2461–2489. doi: 10.1111/febs.15841. [DOI] [PubMed] [Google Scholar]
- Holst J.J., Vilsbøll T., Deacon C.F. The incretin system and its role in type 2 diabetes mellitus. Mol. Cell. Endocrinol. 2009;297:127–136. doi: 10.1016/j.mce.2008.08.012. [DOI] [PubMed] [Google Scholar]
- Holt R.I.G., Barnett A.H., Bailey C.J. Bromocriptine: old drug, new formulation and new indication. Diabetes Obes. Metab. 2010;12:1048–1057. doi: 10.1111/j.1463-1326.2010.01304.x. [DOI] [PubMed] [Google Scholar]
- Hughes J.W., Ustione A., Lavagnino Z., Piston D.W. Regulation of islet glucagon secretion: beyond calcium. Diabetes Obes. Metab. 2018;20:127–136. doi: 10.1111/dom.13381. [DOI] [PMC free article] [PubMed] [Google Scholar]
- Jackisch R., Moll S., Feuerstein T.J., Hertting G. Dopaminergic modulation of hippocampal noradrenaline release. Evidence for alpha 2-antagonistic effects of some dopamine receptor agonists and antagonists. Naunyn-Schmiedeberg’s Arch. Pharmacol. 1985;330:105–113. doi: 10.1007/bf00499902. [DOI] [PubMed] [Google Scholar]
- Khelifa M.S., Skov L.J., Holst B. Biased ghrelin receptor signaling and the dopaminergic system as potential targets for metabolic and psychological symptoms of anorexia nervosa. Front. Endocrinol. 2021;12:734547. doi: 10.3389/fendo.2021.734547. [DOI] [PMC free article] [PubMed] [Google Scholar]
- Kimple M.E., Joseph J.W., Bailey C.L., Fueger P.T., Hendry I.A., Newgard C.B., Casey P.J. Galphaz negatively regulates insulin secretion and glucose clearance. J. Biol. Chem. 2008;283:4560–4567. doi: 10.1074/jbc.M706481200. [DOI] [PubMed] [Google Scholar]
- Kohen R., Metcalf M.A., Khan N., Druck T., Huebner K., Lachowicz J.E., Meltzer H.Y., Sibley D.R., Roth B.L., Hamblin M.W. Cloning, characterization, and chromosomal localization of a human 5-HT6 serotonin receptor. J. Neurochem. 1996;66:47–56. doi: 10.1046/j.1471-4159.1996.66010047.x. [DOI] [PubMed] [Google Scholar]
- Kohout T.A., Lin F.S., Perry S.J., Conner D.A., Lefkowitz R.J. beta-Arrestin 1 and 2 differentially regulate heptahelical receptor signaling and trafficking. Proc. Natl. Acad. Sci. USA. 2001;98:1601–1606. doi: 10.1073/pnas.98.4.1601. [DOI] [PMC free article] [PubMed] [Google Scholar]
- Kothiwale S., Mendenhall J.L., Meiler J. BCL::Conf: small molecule conformational sampling using a knowledge based rotamer library. J. Cheminform. 2015;7:47. doi: 10.1186/s13321-015-0095-1. [DOI] [PMC free article] [PubMed] [Google Scholar]
- Krentz A.J., Bailey C.J. Oral antidiabetic agents: current role in type 2 diabetes mellitus. Drugs. 2005;65:385–411. doi: 10.2165/00003495-200565030-00005. [DOI] [PubMed] [Google Scholar]
- Leclercq-Meyer V., Brisson G.R., Malaisse W.J. Effect of adrenaline and glucose on release of glucagon and insulin in vitro. Nat. New Biol. 1971;231:248–249. doi: 10.1038/newbio231248a0. [DOI] [PubMed] [Google Scholar]
- Lemmon G., Meiler J. Rosetta Ligand docking with flexible XML protocols. Methods Mol. Biol. 2012;819:143–155. doi: 10.1007/978-1-61779-465-0_10. [DOI] [PMC free article] [PubMed] [Google Scholar]
- Liang W., Gao L., Li N., Wang B., Wang L., Wang Y., Yang H., You L., Hou J., Chen S., et al. Efficacy and safety of bromocriptine-QR in type 2 diabetes: a systematic review and meta-analysis. Horm. Metab. Res. 2015;47:805–812. doi: 10.1055/s-0035-1559684. [DOI] [PubMed] [Google Scholar]
- Lopez Vicchi F., Luque G.M., Brie B., Nogueira J.P., Garcia Tornadu I., Becu-Villalobos D. Dopaminergic drugs in type 2 diabetes and glucose homeostasis. Pharmacol. Res. 2016;109:74–80. doi: 10.1016/j.phrs.2015.12.029. [DOI] [PubMed] [Google Scholar]
- Luan B., Zhao J., Wu H., Duan B., Shu G., Wang X., Li D., Jia W., Kang J., Pei G. Deficiency of a beta-arrestin-2 signal complex contributes to insulin resistance. Nature. 2009;457:1146–1149. doi: 10.1038/nature07617. [DOI] [PubMed] [Google Scholar]
- Machleidt T., Woodroofe C.C., Schwinn M.K., Méndez J., Robers M.B., Zimmerman K., Otto P., Daniels D.L., Kirkland T.A., Wood K.V. NanoBRET--A novel BRET platform for the analysis of protein-protein interactions. ACS Chem. Biol. 2015;10:1797–1804. doi: 10.1021/acschembio.5b00143. [DOI] [PubMed] [Google Scholar]
- Maffei A., Segal A.M., Alvarez-Perez J.C., Garcia-Ocaña A., Harris P.E. Anti-incretin, anti-proliferative action of dopamine on β-cells. Mol. Endocrinol. 2015;29:542–557. doi: 10.1210/me.2014-1273. [DOI] [PMC free article] [PubMed] [Google Scholar]
- Masri B., Salahpour A., Didriksen M., Ghisi V., Beaulieu J.M., Gainetdinov R.R., Caron M.G. Antagonism of dopamine D2 receptor/beta-arrestin 2 interaction is a common property of clinically effective antipsychotics. Proc. Natl. Acad. Sci. USA. 2008;105:13656–13661. doi: 10.1073/pnas.0803522105. [DOI] [PMC free article] [PubMed] [Google Scholar]
- McPherson G.A., Beart P.M. The selectivity of some ergot derivatives for alpha 1 and alpha 2-adrenoceptors of rat cerebral cortex. Eur. J. Pharmacol. 1983;91:363–369. doi: 10.1016/0014-2999(83)90159-0. [DOI] [PubMed] [Google Scholar]
- Meiler J., Baker D. ROSETTALIGAND: protein-small molecule docking with full side-chain flexibility. Proteins. 2006;65:538–548. doi: 10.1002/prot.21086. [DOI] [PubMed] [Google Scholar]
- Merglen A., Theander S., Rubi B., Chaffard G., Wollheim C.B., Maechler P. Glucose sensitivity and metabolism-secretion coupling studied during two-year continuous culture in INS-1E insulinoma cells. Endocrinology. 2004;145:667–678. doi: 10.1210/en.2003-1099. [DOI] [PubMed] [Google Scholar]
- Millan M.J., Maiofiss L., Cussac D., Audinot V., Boutin J.A., Newman-Tancredi A. Differential actions of antiparkinson agents at multiple classes of monoaminergic receptor. I. A multivariate analysis of the binding profiles of 14 drugs at 21 native and cloned human receptor subtypes. J. Pharmacol. Exp. Ther. 2002;303:791–804. doi: 10.1124/jpet.102.039867. [DOI] [PubMed] [Google Scholar]
- Mukherjee R., Yun J.W. Bromocriptine inhibits adipogenesis and lipogenesis by agonistic action on α2-adrenergic receptor in 3T3-L1 adipocyte cells. Mol. Biol. Rep. 2013;40:3783–3792. doi: 10.1007/s11033-012-2455-5. [DOI] [PubMed] [Google Scholar]
- Mukhtasimova N., Sine S.M. Full and partial agonists evoke distinct structural changes in opening the muscle acetylcholine receptor channel. J. Gen. Physiol. 2018;150:713–729. doi: 10.1085/jgp.201711881. [DOI] [PMC free article] [PubMed] [Google Scholar]
- Naguy A., Al-Tajali A. Bromocriptine mitigated paliperidone metabolic and neuro-hormonal side effects and improved negative domain in a case of early onset schizophrenia. Nord. J. Psychiatry. 2016;70:318–319. doi: 10.3109/08039488.2015.1094127. [DOI] [PubMed] [Google Scholar]
- Newman-Tancredi A., Cussac D., Audinot V., Nicolas J.P., De Ceuninck F., Boutin J.A., Millan M.J. Differential actions of antiparkinson agents at multiple classes of monoaminergic receptor. II. Agonist and antagonist properties at subtypes of dopamine D(2)-like receptor and alpha(1)/alpha(2)-adrenoceptor. J. Pharmacol. Exp. Ther. 2002;303:805–814. doi: 10.1124/jpet.102.039875. [DOI] [PubMed] [Google Scholar]
- Nikolaev V.O., Hoffmann C., Bünemann M., Lohse M.J., Vilardaga J.P. Molecular basis of partial agonism at the neurotransmitter alpha2A-adrenergic receptor and Gi-protein heterotrimer. J. Biol. Chem. 2006;281:24506–24511. doi: 10.1074/jbc.M603266200. [DOI] [PubMed] [Google Scholar]
- Ohta Y., Kosaka Y., Kishimoto N., Wang J., Smith S.B., Honig G., Kim H., Gasa R.M., Neubauer N., Liou A., et al. Convergence of the insulin and serotonin programs in the pancreatic β-cell. Diabetes. 2011;60:3208–3216. doi: 10.2337/db10-1192. [DOI] [PMC free article] [PubMed] [Google Scholar]
- Pierri L., Pitman I.H., Rae I.D., Winkler D.A., Andrews P.R. Conformational analysis of the ergot alkaloids ergotamine and ergotaminine. J. Med. Chem. 1982;25:937–942. doi: 10.1021/jm00350a010. [DOI] [PubMed] [Google Scholar]
- Plassat J.L., Amlaiky N., Hen R. Molecular cloning of a mammalian serotonin receptor that activates adenylate cyclase. Mol. Pharmacol. 1993;44:229–236. [PubMed] [Google Scholar]
- Prevention C.F.D.C.A. Centers for Disease Control and Prevention, U.S. Dept of Health and Human Services; 2017. National Diabetes Statistics Report, 2017.https://www.cdc.gov/diabetes/pdfs/data/statistics/national-diabetes-statistics-report.pdf [Google Scholar]
- Pydi S.P., Barella L.F., Zhu L., Meister J., Rossi M., Wess J. β-Arrestins as important regulators of glucose and energy homeostasis. Annu. Rev. Physiol. 2022;84:17–40. doi: 10.1146/annurev-physiol-060721-092948. [DOI] [PubMed] [Google Scholar]
- Qu L., Zhou Q., Xu Y., Guo Y., Chen X., Yao D., Han G.W., Liu Z.J., Stevens R.C., Zhong G., et al. Structural basis of the diversity of adrenergic receptors. Cell Rep. 2019;29:2929–2935.e4. doi: 10.1016/j.celrep.2019.10.088. [DOI] [PubMed] [Google Scholar]
- Raskin P., Cincotta A.H. Bromocriptine-QR therapy for the management of type 2 diabetes mellitus: developmental basis and therapeutic profile summary. Expert Rev. Endocrinol. Metab. 2016;11:113–148. doi: 10.1586/17446651.2016.1131119. [DOI] [PubMed] [Google Scholar]
- Ravnskjaer K., Madiraju A., Montminy M. Role of the cAMP pathway in glucose and lipid metabolism. Handb. Exp. Pharmacol. 2016;233:29–49. doi: 10.1007/164_2015_32. [DOI] [PubMed] [Google Scholar]
- Régnauld K.L., Leteurtre E., Gutkind S.J., Gespach C.P., Emami S. Activation of adenylyl cyclases, regulation of insulin status, and cell survival by G(alpha)olf in pancreatic beta-cells. Am. J. Physiol. Regul. Integr. Comp. Physiol. 2002;282:R870–R880. doi: 10.1152/ajpregu.00374.2001. [DOI] [PubMed] [Google Scholar]
- Richmond J.E., Codignola A., Cooke I.M., Sher E. Calcium- and barium-dependent exocytosis from the rat insulinoma cell line RINm5F assayed using membrane capacitance measurements and serotonin release. Pflugers Arch. 1996;432:258–269. doi: 10.1007/s004240050132. [DOI] [PubMed] [Google Scholar]
- Rorsman P., Braun M. Regulation of insulin secretion in human pancreatic islets. Annu. Rev. Physiol. 2013;75:155–179. doi: 10.1146/annurev-physiol-030212-183754. [DOI] [PubMed] [Google Scholar]
- Rubí B., Maechler P. Minireview: new roles for peripheral dopamine on metabolic control and tumor growth: let's seek the balance. Endocrinology. 2010;151:5570–5581. doi: 10.1210/en.2010-0745. [DOI] [PubMed] [Google Scholar]
- Rubí B., Ljubicic S., Pournourmohammadi S., Carobbio S., Armanet M., Bartley C., Maechler P. Dopamine D2-like receptors are expressed in pancreatic beta cells and mediate inhibition of insulin secretion. J. Biol. Chem. 2005;280:36824–36832. doi: 10.1074/jbc.M505560200. [DOI] [PubMed] [Google Scholar]
- Sánchez-Soto M., Bonifazi A., Cai N.S., Ellenberger M.P., Newman A.H., Ferré S., Yano H. Evidence for noncanonical neurotransmitter activation: norepinephrine as a dopamine D2-like receptor agonist. Mol. Pharmacol. 2016;89:457–466. doi: 10.1124/mol.115.101808. [DOI] [PMC free article] [PubMed] [Google Scholar]
- Sánchez-Soto M., Casadó-Anguera V., Yano H., Bender B.J., Cai N.S., Moreno E., Canela E.I., Cortés A., Meiler J., Casadó V., Ferré S. alpha2A- and alpha2C-adrenoceptors as potential targets for dopamine and dopamine receptor ligands. Mol. Neurobiol. 2018;55:8438–8454. doi: 10.1007/s12035-018-1004-1. [DOI] [PMC free article] [PubMed] [Google Scholar]
- Schuit F.C., Pipeleers D.G. Differences in adrenergic recognition by pancreatic A and B cells. Science. 1986;232:875–877. doi: 10.1126/science.2871625. [DOI] [PubMed] [Google Scholar]
- Shen Y., Monsma F.J., Jr., Metcalf M.A., Jose P.A., Hamblin M.W., Sibley D.R. Molecular cloning and expression of a 5-hydroxytryptamine7 serotonin receptor subtype. J. Biol. Chem. 1993;268:18200–18204. [PubMed] [Google Scholar]
- Shivaprasad C., Kalra S. Bromocriptine in type 2 diabetes mellitus. Indian J. Endocrinol. Metab. 2011;15:S17–S24. doi: 10.4103/2230-8210.83058. [DOI] [PMC free article] [PubMed] [Google Scholar]
- Simpson N., Maffei A., Freeby M., Burroughs S., Freyberg Z., Javitch J., Leibel R.L., Harris P.E. Dopamine-mediated autocrine inhibitory circuit regulating human insulin secretion in vitro. Mol. Endocrinol. 2012;26:1757–1772. doi: 10.1210/me.2012-1101. [DOI] [PMC free article] [PubMed] [Google Scholar]
- Skinbjerg M., Ariano M.A., Thorsell A., Heilig M., Halldin C., Innis R.B., Sibley D.R. Arrestin3 mediates D(2) dopamine receptor internalization. Synapse. 2009;63:621–624. doi: 10.1002/syn.20636. [DOI] [PMC free article] [PubMed] [Google Scholar]
- Song S.H., Rhodes C.J., Veldhuis J.D., Butler P.C. Diazoxide attenuates glucose-induced defects in first-phase insulin release and pulsatile insulin secretion in human islets. Endocrinology. 2003;144:3399–3405. doi: 10.1210/en.2003-0056. [DOI] [PubMed] [Google Scholar]
- Sonoda N., Imamura T., Yoshizaki T., Babendure J.L., Lu J.C., Olefsky J.M. Beta-Arrestin-1 mediates glucagon-like peptide-1 signaling to insulin secretion in cultured pancreatic beta cells. Proc. Natl. Acad. Sci. USA. 2008;105:6614–6619. doi: 10.1073/pnas.0710402105. [DOI] [PMC free article] [PubMed] [Google Scholar]
- Stoddart L.A., Kilpatrick L.E., Hill S.J. NanoBRET approaches to study ligand binding to GPCRs and RTKs. Trends Pharmacol. Sci. 2018;39:136–147. doi: 10.1016/j.tips.2017.10.006. [DOI] [PubMed] [Google Scholar]
- Stoelzel C.R., Zhang Y., Cincotta A.H. Circadian-timed dopamine agonist treatment reverses high-fat diet-induced diabetogenic shift in ventromedial hypothalamic glucose sensing. Endocrinol. Diabetes Metab. 2020;3:e00139. doi: 10.1002/edm2.139. [DOI] [PMC free article] [PubMed] [Google Scholar]
- Straub S.G., Sharp G.W.G. Evolving insights regarding mechanisms for the inhibition of insulin release by norepinephrine and heterotrimeric G proteins. Am. J. Physiol. Cell Physiol. 2012;302:C1687–C1698. doi: 10.1152/ajpcell.00282.2011. [DOI] [PMC free article] [PubMed] [Google Scholar]
- Tavares G., Marques D., Barra C., Rosendo-Silva D., Costa A., Rodrigues T., Gasparini P., Melo B.F., Sacramento J.F., Seiça R., et al. Dopamine D2 receptor agonist, bromocriptine, remodels adipose tissue dopaminergic signalling and upregulates catabolic pathways, improving metabolic profile in type 2 diabetes. Mol. Metab. 2021;51:101241. doi: 10.1016/j.molmet.2021.101241. [DOI] [PMC free article] [PubMed] [Google Scholar]
- Tavares G., Martins F.O., Melo B.F., Matafome P., Conde S.V. Peripheral dopamine directly acts on insulin-sensitive tissues to regulate insulin signaling and metabolic function. Front. Pharmacol. 2021;12:713418. doi: 10.3389/fphar.2021.713418. [DOI] [PMC free article] [PubMed] [Google Scholar]
- Tengholm A., Gylfe E. cAMP signalling in insulin and glucagon secretion. Diabetes Obes. Metab. 2017;19:42–53. doi: 10.1111/dom.12993. [DOI] [PubMed] [Google Scholar]
- Urs N.M., Caron M.G. The physiological relevance of functional selectivity in dopamine signalling. Int. J. Obes. Suppl. 2014;4:S5–S8. doi: 10.1038/ijosup.2014.3. [DOI] [PMC free article] [PubMed] [Google Scholar]
- Ustione A., Piston D.W. Dopamine synthesis and D3 receptor activation in pancreatic beta-cells regulates insulin secretion and intracellular [Ca(2+)] oscillations. Mol. Endocrinol. 2012;26:1928–1940. doi: 10.1210/me.2012-1226. [DOI] [PMC free article] [PubMed] [Google Scholar]
- Ustione A., Piston D.W., Harris P.E. Minireview: dopaminergic regulation of insulin secretion from the pancreatic islet. Mol. Endocrinol. 2013;27:1198–1207. doi: 10.1210/me.2013-1083. [DOI] [PMC free article] [PubMed] [Google Scholar]
- Valerón P.F., de Pablos-Velasco P.L. Limitations of insulin-dependent drugs in the treatment of type 2 diabetes mellitus. Med. Clin. 2013;141:20–25. doi: 10.1016/s0025-7753(13)70059-9. [DOI] [PubMed] [Google Scholar]
- Valiquette G. Bromocriptine for diabetes mellitus type II. Cardiol. Rev. 2011;19:272–275. doi: 10.1097/CRD.0b013e318229d2d2. [DOI] [PubMed] [Google Scholar]
- van Raalte D.H., Verchere C.B. Improving glycaemic control in type 2 diabetes: stimulate insulin secretion or provide beta-cell rest? Diabetes Obes. Metab. 2017;19:1205–1213. doi: 10.1111/dom.12935. [DOI] [PubMed] [Google Scholar]
- Wang Y., Park S., Bajpayee N.S., Nagaoka Y., Boulay G., Birnbaumer L., Jiang M. Augmented glucose-induced insulin release in mice lacking G(o2), but not G(o1) or G(i) proteins. Proc. Natl. Acad. Sci. USA. 2011;108:1693–1698. doi: 10.1073/pnas.1018903108. [DOI] [PMC free article] [PubMed] [Google Scholar]
- Wang X., Villar V.A., Tiu A., Upadhyay K.K., Cuevas S. Dopamine D2 receptor upregulates leptin and IL-6 in adipocytes. J. Lipid Res. 2018;59:607–614. doi: 10.1194/jlr.M081000. [DOI] [PMC free article] [PubMed] [Google Scholar]
- Wei H., Zapata R.C., Lopez-Valencia M., Aslanoglou D., Farino Z.J., Benner V., Osborn O., Freyberg Z., McCarthy M.J. Dopamine D(2) receptor signaling modulates pancreatic beta cell circadian rhythms. Psychoneuroendocrinology. 2020;113:104551. doi: 10.1016/j.psyneuen.2019.104551. [DOI] [PMC free article] [PubMed] [Google Scholar]
- Wess J. The two β-arrestins regulate distinct metabolic processes: studies with novel mutant mouse models. Int. J. Mol. Sci. 2022;23:495. doi: 10.3390/ijms23010495. [DOI] [PMC free article] [PubMed] [Google Scholar]
- Xie K.Y., Chien S.J., Tan B.C.M., Chen Y.W. RNA editing of 5-HT(2C) R impairs insulin secretion of pancreatic beta cells via altered store-operated calcium entry. FASEB J. 2021;35:e21929. doi: 10.1096/fj.202100265RR. [DOI] [PubMed] [Google Scholar]
- Yin J., Chen K.Y.M., Clark M.J., Hijazi M., Kumari P., Bai X.C., Sunahara R.K., Barth P., Rosenbaum D.M. Structure of a D2 dopamine receptor-G-protein complex in a lipid membrane. Nature. 2020;584:125–129. doi: 10.1038/s41586-020-2379-5. [DOI] [PMC free article] [PubMed] [Google Scholar]
- Zawilska J., Iuvone P.M. Alpha-2 adrenergic activity of bromocriptine and quinpirole in chicken pineal gland. Effects on melatonin synthesis and [3H]rauwolscine binding. J. Pharmacol. Exp. Ther. 1990;255:1047–1052. [PubMed] [Google Scholar]
- Zhang Q., Zhu Y., Zhou W., Gao L., Yuan L., Han X. Serotonin receptor 2C and insulin secretion. PLoS One. 2013;8:e54250. doi: 10.1371/journal.pone.0054250. [DOI] [PMC free article] [PubMed] [Google Scholar]
- Zhang Y., Zheng R., Meng X., Wang L., Liu L., Gao Y. Pancreatic endocrine effects of dopamine receptors in human islet cells. Pancreas. 2015;44:925–929. doi: 10.1097/mpa.0000000000000357. [DOI] [PubMed] [Google Scholar]
- Zhao Y., Fang Q., Straub S.G., Lindau M., Sharp G.W.G. Hormonal inhibition of endocytosis: novel roles for noradrenaline and G protein G(z) J. Physiol. 2010;588:3499–3509. doi: 10.1113/jphysiol.2010.190116. [DOI] [PMC free article] [PubMed] [Google Scholar]
- Zhu L., Almaça J., Dadi P.K., Hong H., Sakamoto W., Rossi M., Lee R.J., Vierra N.C., Lu H., Cui Y., et al. beta-arrestin-2 is an essential regulator of pancreatic beta-cell function under physiological and pathophysiological conditions. Nat. Commun. 2017;8:14295. doi: 10.1038/ncomms14295. [DOI] [PMC free article] [PubMed] [Google Scholar]
- Zhuang Y., Xu P., Mao C., Wang L., Krumm B., Zhou X.E., Huang S., Liu H., Cheng X., Huang X.P., et al. Structural insights into the human D1 and D2 dopamine receptor signaling complexes. Cell. 2021;184:931–942.e18. doi: 10.1016/j.cell.2021.01.027. [DOI] [PMC free article] [PubMed] [Google Scholar]
Associated Data
This section collects any data citations, data availability statements, or supplementary materials included in this article.
Supplementary Materials
Data Availability Statement
-
•
All data reported in this paper will be shared by the lead contact upon request.
-
•
This paper does not report original code.
-
•
Any additional information required to reanalyze the data reported in this paper is available from the lead contact upon request.