

Summary
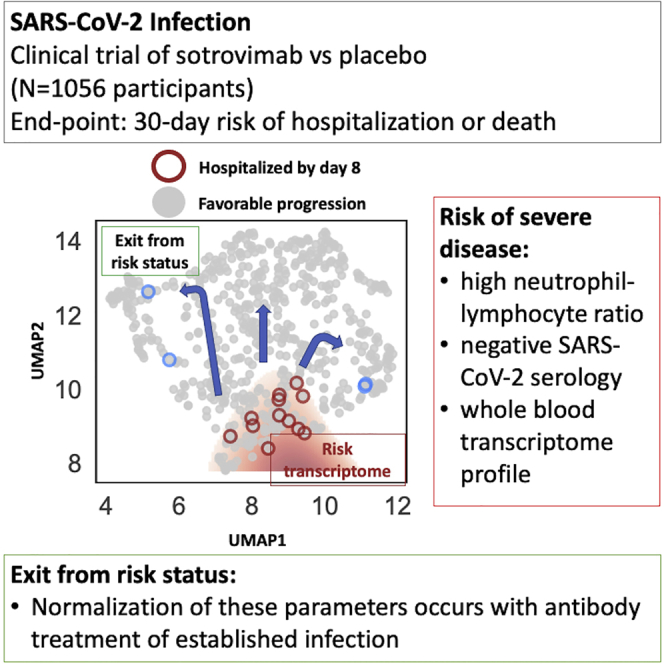
Understanding who is at risk of progression to severe coronavirus disease 2019 (COVID-19) is key to clinical decision making and effective treatment. We study correlates of disease severity in the COMET-ICE clinical trial that randomized 1:1 to placebo or to sotrovimab, a monoclonal antibody for the treatment of severe acute respiratory syndrome coronavirus 2 (SARS-CoV-2) infection (ClinicalTrials.gov04545060). Laboratory parameters identify study participants at greater risk of severe disease, including a high neutrophil-to-lymphocyte ratio (NLR), a negative SARS-CoV-2 serologic test, and whole-blood transcriptome profiles. Sotrovimab treatment is associated with normalization of NLR and the transcriptomic profile and with a decrease of viral RNA in nasopharyngeal samples. Transcriptomics provides the most sensitive detection of participants who would go on to be hospitalized or die. To facilitate timely measurement, we identify a 10-gene signature with similar predictive accuracy. We identify markers of risk for disease progression and demonstrate that normalization of these parameters occurs with antibody treatment of established infection.
Keywords: biomarkers, SARS-CoV-2, prediction
Graphical abstract
Highlights
-
•
Laboratory parameters identify individuals at risk of severe COVID-19
-
•
Transcriptomics provides sensitive detection of those who will be hospitalized or die
-
•
A 10-gene signature provides comparable predictive accuracy to transcriptome
-
•
Antibody treatment normalizes infection-associated risk biomarkers
Maher et al. report laboratory parameters, including gene-expression signatures, that predict severity and progression of SARS-CoV-2 infection. These biomarkers are normalized by the administration of monoclonal antibody therapy.
Introduction
Sotrovimab is a human monoclonal antibody (mAb) derived from an Ab isolated from a person recovered from severe acute respiratory syndrome coronavirus (SARS-CoV) infection. This mAb broadly neutralizes SARS-CoV-2, SARS-CoV, and other related animal sarbecoviruses.1, 2, 3 Sotrovimab targets a highly conserved epitope in the SARS-CoV-2 spike protein located in a site outside the angiotensin-converting enzyme 2 (ACE2) receptor-binding motif (RBM) within the receptor-binding domain (RBD). Sotrovimab retains in vitro activity against many SARS-CoV-2 variants of concern (VOCs) (Alpha, Beta, Gamma, Delta, Omicron BA.1) and variants of interest (VOIs).4,5 Recent preclinical studies have demonstrated a reduction of sotrovimab neutralization by the Omicron BA.2 variant;6,7 however, studies are underway to explore whether modified dosing can restore clinical efficacy.
Sotrovimab was tested in a multi-center, double-blind, phase 3 clinical trial (COMET-ICE, ClinicalTrials.gov: NCT04545060) that recruited non-hospitalized participants with symptomatic coronavirus 2019 (COVID-19) and at least one known risk factor (age and/or comorbidities) for severe disease progression. Participants were randomized to a single intravenous infusion of 500 mg sotrovimab or placebo. In the interim analysis of the trial, sotrovimab significantly reduced the risk of all-cause hospitalization (>24 h) or death from COVID-19.1 The final data show that among 1,056 participants randomized (sotrovimab, 528; placebo, 529), all-cause hospitalization longer than 24 h or death was significantly reduced with sotrovimab (6/528 [1%]) versus placebo (30/529 [6%]) by 79% (95% confidence interval [CI], 50%–91%; p < 0.001).2
While the impact of sotrovimab was profound, the relatively low rate of hospitalization or death among participants considered at risk for poor disease outcomes in the placebo arm led us to investigate if additional biomarkers or biomarker profiles beyond the known demographic and comorbid conditions could be identified. The setting of a randomized, controlled clinical trial presented a unique opportunity to identify signals of disease progression that resolved in response to treatment and could thus be used both to provide insights into COVID-19 pathogenesis and as potential surrogate endpoints in the design of future trials. Thus, the present study aimed at identifying baseline correlates of hospitalization and severe disease/death in an at-risk population based on routine laboratory parameters, SARS-CoV-2 serology, and transcriptome analysis. It then sought to assess the impact of Ab treatment on these parameters. This approach enabled assessment of the impact of Ab treatment on populations with different intrinsic risks of disease progression and the identification and testing of surrogates of treatment response.
Results
Identification of study participants at high risk of progression of COVID-19 using clinical laboratory values
COMET-ICE included 1,057 adults with a positive local polymerase chain reaction or other molecular SARS-CoV-2 test result and onset of symptoms within the prior 5 days (Table 1).2 The study population represented patients at high risk for COVID-19 progression according to previously identified clinical parameters (see STAR Methods for details). We analyzed 63 available central laboratory parameters for their association with hospitalization or death (Data S1). On day 1, predose, white blood cell proportions were most predictive of eventual hospitalization or death. White blood cell proportions were also quantified by the neutrophil-to-lymphocyte ratio (NLR). NLR obtained an overall predictive performance, summarized by the area under the receiver operating characteristic curve (AUC), of 0.81. Ferritin (AUC 0.74), eosinophils percentage (AUC 0.74), spO2 in blood (AUC 0.73), serum glucose (AUC 0.73), and interleukin (IL)-6 levels (AUC 0.71) were also predictors of severity at baseline (Data S1).
Table 1.
Baseline demographic and disease characteristics
| Full cohort |
Transcriptome cohort |
||||||||
|---|---|---|---|---|---|---|---|---|---|
| All | Sotrovimab | Placebo | p value | All | Sotrovimab | Placebo | p value | ||
| Demographics | N | 1,057 | 528 | 529 | 1 | 302 | 151 | 151 | 1 |
| age | 53.1 (18.0–97.0) | 52.6 (19.0–97.0) | 53.6 (18.0–89.0) | 0.148 | 54.3 (19.0–97.0) | 53.8 (19.0–97.0) | 54.8 (20.0–89.0) | 0.287 | |
| age ≥65 | 237 (22%) | 113 (21%) | 124 (23%) | 0.491 | 76 (25%) | 38 (25%) | 38 (25%) | 1 | |
| Age ≥70 | 142 (13%) | 71 (13%) | 71 (13%) | 1 | 51 (17%) | 27 (18%) | 24 (16%) | 0.77 | |
| female gender | 572 (54%) | 299 (57%) | 273 (52%) | 0.221 | 170 (56%) | 85 (56%) | 84 (56%) | 1 | |
| BMI | 32.3 (6.6) | 32.3 (6.7) | 32.2 (6.6) | 0.44 | 31.9 (6.6) | 31.7 (6.6) | 32.0 (6.6) | 0.357 | |
| risk age ≥55 | 512 (48%) | 254 (48%) | 258 (49%) | 0.879 | 144 (47%) | 70 (46%) | 74 (48%) | 0.775 | |
| diabetes mellitus | 249 (24%) | 130 (25%) | 119 (22%) | 0.5 | 69 (23%) | 37 (25%) | 32 (21%) | 0.609 | |
| obesity (BMI >30) | 670 (63%) | 330 (62%) | 340 (64%) | 0.674 | 183 (60%) | 88 (58%) | 94 (62%) | 0.557 | |
| chronic kidney disease | 26 (2%) | 12 (2%) | 14 (3%) | 0.844 | 9 (3%) | 4 (3%) | 5 (3%) | 1 | |
| congestive heart failure | 17 (2%) | 8 (2%) | 9 (2%) | 1 | 6 (2%) | 2 (1%) | 4 (3%) | 0.686 | |
| COPD | 54 (5%) | 26 (5%) | 28 (5%) | 0.891 | 16 (5%) | 5 (3%) | 11 (7%) | 0.204 | |
| moderate to severe asthma | 244 (23%) | 126 (24%) | 118 (22%) | 0.634 | 79 (26%) | 46 (30%) | 33 (22%) | 0.147 | |
| baseline log10 viral load | 6.6 (1.7) | 6.6 (1.6) | 6.7 (1.7) | 0.428 | 7.0 (1.7) | 6.9 (1.7) | 7.1 (1.7) | 0.412 | |
| Race/ethnicity | Latino | 649 (62%) | 326 (62%) | 323 (61%) | 0.925 | 153 (50%) | 76 (50%) | 76 (50%) | 1 |
| White | 272 (26%) | 132 (25%) | 140 (27%) | 0.649 | 105 (35%) | 54 (36%) | 51 (33%) | 0.83 | |
| Black or African American | 82 (8%) | 40 (8%) | 42 (8%) | 0.91 | 27 (9%) | 10 (7%) | 17 (11%) | 0.237 | |
| Asian | 45 (4%) | 24 (5%) | 21 (4%) | 0.764 | 18 (6%) | 11 (7%) | 6 (4%) | 0.318 | |
| mixed race | 4 (<1%) | 4 (<1%) | 0 | 0.125 | 0 | 0 | 0 | 1 | |
| Native American | 3 (<1%) | 1 (<1%) | 2 (<1%) | 1 | 1 (<1%) | 0 | 1 (<1%) | 1 | |
| No. risk factors | 0 | 169 (16%) | 80 (15%) | 89 (17%) | 0.521 | 51 (17%) | 24 (16%) | 26 (17%) | 0.87 |
| 1 | 263 (25%) | 134 (25%) | 129 (24%) | 0.792 | 80 (26%) | 37 (25%) | 43 (28%) | 0.549 | |
| 2 | 190 (18%) | 98 (19%) | 92 (17%) | 0.704 | 43 (14%) | 24 (16%) | 19 (12%) | 0.527 | |
| ≥3 | 435 (41%) | 216 (41%) | 219 (41%) | 0.914 | 130 (43%) | 66 (44%) | 63 (42%) | 0.816 | |
Numbers in parentheses represent the percentage of all study participants in that category when denoted with “%”; otherwise, they represent the standard deviation. The numbers outside the parentheses are counts when represented with “%” in the parentheses. Otherwise, they are the mean value of that variable. COPD, chronic obstructive pulmonary disease; VL, viral load.
For comparison, a baseline risk model of age, body mass index (BMI), and number of comorbidities yielded an AUC of 0.71. These variables did not add to predictive performance when combined with NLR, suggesting that NLR captures a superset of the risk signals ascertained by these variables. Viral load obtained an AUC of 0.65 on its own. Combining viral load and serology information along with NLR and baseline risk variables improved AUC slightly to 0.83 but, compared with NLR alone, decreased performance at high specificities, which is undesirable for maintaining high positive predictive value (AUCSpec>90 of 0.63 versus 0.66 for NLR alone). In summary, we found that NLR alone outperformed a range of popular signals for risk stratification, even when combined in a multivariate analysis setting. We did not observe that these signals provided appreciable complementarity to NLR.
We found that an NLR greater or equal to 6 provided an optimal cutoff for the highest enrichment for disease progression and is hereafter defined as “high NLR.” This threshold was chosen based on a natural threshold in the data that also maximized association to hospitalization (Figure S1). Although this cutoff was chosen purely based on the data within this study, it has been proposed independently elsewhere.8 High NLR was significantly associated with a viral load greater than 6 log units (odds ratio [OR] = 3.2, p = 1e−4) and an age greater than 65 (OR = 2.6, p = 1e−3).
Of the 36 hospitalizations or deaths that occurred in the COMET-ICE study, 29 of these were observed among the 901 participants with available hospitalization status and NLR at day 1, the day of dosing. NLR had a sensitivity of 36.1% (22%–52%) and a specificity of 95% (94%–96%) for the prediction of all-cause hospitalization or death (Fisher’s exact p < 0.001). NLR normalized more rapidly in participants receiving sotrovimab (Figure 1). The sensitivity and specificity for predicting hospitalization in the full trial and in the placebo arm alone are presented in Table S1.
Figure 1.

Response to sotrovimab in high-risk group defined by neutrophil-to-lymphocyte ratio (NLR)
The time trend of NLR for sotrovimab- versus placebo-treated patients (hue) in the full cohort and low- and high-risk groups as defined by NLR >6. Error bars indicate the 95% confidence interval on the mean. The Mann-Whitney U test for the difference between study arms at day 5 in the high-risk group was 0.02.
The role of SARS-CoV-2 serostatus in defining risk of progression of COVID-19
Serology data (anti-nucleocapsid Abs) were available for 942 study participants (89%). In the current study, seropositivity at baseline may indicate prior natural infection by SARS-CoV-2 or that a participant is already seroconverting during an acute infection episode. The baseline demographics were similar between the seropositive and seronegative groups who received placebo versus sotrovimab (Table 2). Seropositivity was also associated with lower viral RNA in nasopharyngeal swabs at baseline at time of enrollment into study: mean 4.2 versus 6.4 log10 viral RNA in seropositive versus seronegative participants (Mann-Whitney U p = 1e−36) (Table 2). This finding is broadly consistent with previous reports.9,10
Table 2.
Comparison of representative baseline values between seropositive and seronegative patients
| Seropositive (n = 202) | Seronegative (n = 740) | p value | ||
|---|---|---|---|---|
| Demographics | age | 54.1 (23.0–89.0) | 52.9 (18.0–97.0) | 0.18 (N.S.) |
| female gender | 118 (58%) | 401 (54%) | 0.30 (N.S.) | |
| Risk factors | age ≥65 | 51 (25%) | 163 (22%) | 0.34 (N.S.) |
| COPD | 10 (5%) | 41 (6%) | 0.86 (N.S.) | |
| chronic kidney disease | 6 (3%) | 19 (3%) | 0.80 (N.S.) | |
| congestive heart failure | 3 (1%) | 13 (2%) | 1.00 (N.S.) | |
| diabetes mellitus | 54 (27%) | 173 (23%) | 0.35 (N.S.) | |
| moderate to severe asthma | 58 (29%) | 163 (22%) | 0.06 (N.S.) | |
| obesity (BMI >30) | 116 (57%) | 479 (65%) | 0.07 (N.S.) | |
| Race/ethnicity | Asian | 5 (2%) | 37 (5%) | 0.18 (N.S.) |
| Black or African American | 18 (9%) | 57 (8%) | 0.56 (N.S.) | |
| Latino | 156 (77%) | 412 (56%) | 2E−8 | |
| mixed race | 0 | 3 (<1%) | 1.00 (N.S.) | |
| Native American | 1 (<1%) | 1 (<1%) | 0.38 (N.S.) | |
| White | 22 (11%) | 229 (31%) | 2E−9 | |
| Laboratory | log10 viral load | 4.2 (1.4) | 6.4 (2.0) | 3E−36 |
| hemoglobin | 133.0 (16.2) | 140.1 (15.1) | 1E−7 | |
| lymphocytes | 2.0 (0.7) | 1.6 (0.7) | 5E−13 | |
| neutrophils | 4.9 (4.9) | 3.7 (1.8) | 1E−12 | |
| NLR | 3.0 (4.4) | 2.8 (2.2) | 0.34 (N.S.) | |
| platelets | 274.7 (75.3) | 230.7 (67.9) | 1E−12 | |
| APTT | 24.9 (2.8) | 26.1 (3.0) | 6E−7 | |
| spO2 blood | 97.7 (1.3) | 97.5 (1.4) | 0.05 (N.S.) | |
Numbers in parentheses represent the percentage of all participants in that category when denoted with “%”; otherwise, they represent the standard deviation. The numbers outside the parentheses are counts when represented with “%” in the parentheses. Otherwise, they are the mean value of that variable. p value significance thresholds are based on a Bonferroni correction (p = 0.05/23 comparisons). p values are calculated using either Mann-Whitney U or Fisher’s exact test depending on whether the variable is continuous or binary, respectively. N.S., not significant. NLR, neutrophil-to-lymphocyte ratio.
4% (4/97) of participants who were seropositive at baseline and received placebo progressed to hospitalization and/or death compared with 7% (25/375) of the seronegative participants who received placebo and progressed to hospitalization and/or death before day 29. Among participants who received placebo, there were no deaths or intensive care unit (ICU) admissions in those who were seropositive at baseline compared with 4 deaths (2 deaths before day 29 and 2 additional deaths that occurred after day 29) and 9 ICU admissions (2.4%) in those who were seronegative at baseline. This is consistent with established findings that having SARS-CoV-2 anti-nucleocapsid Abs indicating prior infection may be associated with protection against SARS-CoV-2 re-infection and severity of symptoms.11
Of the 202 seropositive participants at baseline, 6 (3%) were hospitalized or died: 4/97 (4%) received placebo, and 2/105 (2%) received sotrovimab. Notably, as the COMET-ICE study captured all-cause hospitalizations or death, the 2 seropositive participants in the sotrovimab arm were hospitalized with events potentially unrelated to COVID-19 (one instance of diabetic foot, and one instance of non-small cell lung cancer), while only 1 of 4 seronegative participants who received sotrovimab was admitted for potentially non-COVID-19-related hospitalization of small intestinal obstruction. All other hospitalizations were due to COVID-19. No sotrovimab-treated participants died or were admitted to the ICU. The sensitivity and specificity for predicting hospitalization in the full trial and in the placebo arm alone is presented in Table S1.
Identification of high-risk cluster using transcriptomics
We used whole-blood transcriptomics to define additional laboratory-based predictors of disease progression and response to treatment. Transcriptomics is the measurement of the complete set of messenger RNA molecules (transcripts) in a cell or population of cells. This measurement can be used to establish the internal biological state of the cells and is a common tool for the identification of biomarkers. In theory, such transcriptome signatures could provide complementary insight into the biology of risk and recovery. The substudy included samples collected prior to treatment on day 1 and at day 8 from 302 patients. Among these 302 patients, 6/151 (4.0%) participants were hospitalized in the placebo group, and 2/151 (1.3%) participants were hospitalized in the sotrovimab group.
We visualized the transcriptomes of each patient using uniform manifold approximation and projection (UMAP). We noted that from day 1 to day 8, the distribution of all transcriptome profiles tended to shift toward higher values of UMAP component 2 (Figure 2A). We defined a putative risk cluster based on the differences in the distributions of day 1 and day 8 samples in the UMAP (see STAR Methods). While the contrast between day 1 and day 8 transcriptomes was used to generate the initial hypothesis, high-risk status is assessed at day 1 and tested against variables other than the time point variable (hospitalization, NLR, viral load, etc.). In other words, we tested the hypothesis on variables that were not used to generate the hypothesis in the first place.
Figure 2.

High-risk cluster defined by blood transcriptome profile
UMAP projection of transcriptomic profiles across day 1 and day 8 samples with hospitalized patients outlined in red (placebo) or blue (sotrovimab) circles.
(A) A two-dimensional (2D) kernel density, presented as a contour plot, highlights distribution of transcriptomics profiles in UMAP by visit day.
(B) A threshold on the density difference between day 1 and day 8 distributions defines a high-risk cluster (red fill), which encompasses day 1 and day 8 transcriptomics profiles for 6 of 8 hospitalized patients.
(C) Day 1 and day 8 distributions of baseline seropositive patients (n = 69).
(D) Distribution of day 1 and day 8 transcriptomics profiles for patients in putative risk cluster at day 1 split by treatment.
The described risk cluster includes Day 1 and Day 8 transcriptomics profiles for 6 of 8 hospitalized participants (Figure 2B). Participants in the high-risk cluster were significantly older and White, with a higher NLR and higher viral RNA levels in nasopharyngeal samples (Table S2). The cluster analysis also highlighted that baseline seropositive participants were less likely to be associated with the high-risk transcriptome cluster on day 1, and no seropositive patient remained in the high-risk cluster by day 8 (Figure 2C). While most patients who are in the high-risk region at day 1 have exited it by day 8, the migration toward the putatively low-risk state is less pronounced in the placebo group (Figure 2D).
The two hospitalized participants misidentified by the baseline transcriptome analysis were in the sotrovimab arm. One of the two participants had undetectable viral RNA in nasopharyngeal swabs at enrollment and through 8 days post-enrollment when blood was drawn for the transcriptome analysis. This patient was then hospitalized by Day 21 with elevated viral load in nasopharyngeal samples, suggestive of a unique clinical course that may have included nosocomial infection. The second misidentified patient treated with sotrovimab was hospitalized due to a small intestinal obstruction deemed unrelated to COVID-19. Therefore, we found support for the hypothesis that the area outlined in red in Figure 2 corresponded to a UMAP-defined high-risk cluster for COVID-19 progression where protective responses had failed to engage appropriately between day 1 and day 8. Although statistical power was limited due to only 8 hospitalizations in the transcriptomic substudy, the transcriptome high-risk group demonstrated a strong association with all-cause hospitalization and death (Fisher’s exact p = 0.004) with a sensitivity of 75% (41%–94%) and a specificity of 76% (71%–80%).
Using logistic regression on baseline risk factors, we found that this transcriptome signature was associated most strongly with viral load in nasopharyngeal samples, higher NLR, and older age (Table S3). We see the association of known risk factors to the transcriptome risk signature as validating the benefit of this data source of an aggregator of diverse biological signals and as a rich representation of the health status of the patient.
Response to treatment identified by transcriptomics
Given the effect of sotrovimab demonstrated in COMET-ICE, we determined whether treatment altered the probability of remaining in the transcriptome-defined high-risk cluster. To perform this analysis, we compared the rate of exiting the high-risk cluster for participants receiving sotrovimab versus placebo (Figure 2D). Among those who were high risk on day 1, on day 8, 29% of placebo-treated (n = 11, including the hospitalized participants) versus 10% of sotrovimab-treated participants (n = 4) remained high risk as defined by the transcriptome analysis. This corresponds to a 2.8-fold lower prevalence of risk-correlated transcriptional signatures for sotrovimab relative to placebo (Fisher’s exact p = 0.045). Receipt of sotrovimab was also associated with a more rapid decline in viral RNA in nasopharyngeal samples by day 8 (Figure 3).
Figure 3.

Viral RNA response to sotrovimab in high-risk transcriptome cluster
The high-risk transcriptome cluster associates with higher viral RNA concentration in respiratory secretions at both day 1 and day 8. The red dotted line highlights viral load differences at baseline between the groups. Error bars indicate the 95% confidence interval on the mean. At baseline, the high-risk group had a viral load 1.1 [0.69–1.55] log units higher than the cohort as a whole. At day 5, the high-risk cluster had a log viral load of 6.1 [5.6–6.6] units in the placebo group compared with 5.4 [4.9–6.0] units in the sotrovimab group. The Mann-Whitney U test for the difference between study arms at day 5 in the high-risk group was 0.03.
Examining the biology of the transcriptome-defined high-risk cluster
For both day 1 and 8 visits, we scored genes for differential expression between high- versus low-risk clusters. We found a widespread transcriptional shift with thousands of genes identified as differentially expressed after adjusting for multiple comparisons (Figure 4A; Data S2). We characterized differentially expressed genes via gene set enrichment analysis using the MSigDB Hallmark Gene Set annotation.12 The most enriched Hallmark Gene Sets were associated with innate immune responses, in particular the complement system set and the inflammatory response set, as well as the interferon alpha and gamma response gene-expression modules (Figure 4B). Overexpression of genes in these pathways agrees well with previous work showing strong associations between increased innate immune system activation and disease severity.13 We confirm this concordance by showing that the high-risk grouping can be approximated using inflammatory response genes (particularly interferon alpha), as well as gene sets known to be involved in severe influenza (Figure S2).14 There is also agreement based on a gene set previously found to be active and biologically informative across a range of viral and bacterial pathogens (Figure S2).15 These results point to generalizable aspects of transcriptomic abnormalities in severe SARS-CoV-2 and other pathogen-induced disease states.
Figure 4.

Transcriptome characteristics of high-risk group
(A) Summary of differential expression analysis results comparing high-risk group with recovery group, accounting for visit day and subject gender, shown per gene with labels for top 10 among down- (blue) and up-regulated (red) genes by statistical significance, respectively (q < 0.05, absolute LFC > log2(1.5)). For display, abs(LFC) ≤ 8.
(B) Gene set enrichment analysis results using Hallmark Gene Sets (top 10 gene sets with q < 0 for NES >0; q < 0.05 for NES <0). LFC, log fold change. NES, normalized enrichment score. q: false discovery rate (FDR)-adjusted p value.
In summary, whole-transcriptome analysis is consistent with a significant inflammatory response and identifies participants on day 1 that have a high risk of disease progression, a finding that is further supported by the lack of normalization of the high-risk transcriptome profile in participants who were subsequently hospitalized.
Identifying a set of genes whose expression captures the risk-defining elements of the overall transcriptome
Having established a transcriptomic profile associated with risk of COVID-19 progression, recovery, and treatment response, we next determined whether a smaller number of mRNAs that might practically be measured by RT-PCR captured the predictive power of the overall transcriptome. Such an approach is preferable due to lower cost and greatly reduced turnaround time relative to whole-transcriptome sequencing. To select a gene panel, we clustered genes into 10 groups according to their co-expression patterns across participants (Figure S3). This was accomplished using UMAP and K-means clustering. We then selected the top gene from each group as a candidate for identification of a risk-predictive set of 10 genes. The 10-gene panel (CD38, DAB2, EFHC2, EIF2D, EIF4B, MYO18A, NUDT3, OAS2, RPL10, TADA3) accurately recapitulated the whole-transcriptome risk clusters at both days 1 (AUC = 0.95) and 8 (AUC = 0.99; Figure 5A). The expression of each gene in the panel is shown in Figure 5B. Expression of the 10-gene panel was highly associated with viral load in nasopharyngeal samples and hospitalization and was strongly affected by sotrovimab (Figure S4). On the transcriptomic subset, the 10-gene risk stratification had a sensitivity of 75% (41%–94%) and a specificity of 76% (72%–82%) for the prediction of all-cause hospitalization and death (Fisher’s exact p = 0.003). The sensitivity increased to 83% and specificity to 80% when the analysis was limited to the placebo arm, reflecting the real case scenario where there is no modification of the outcome by sotrovimab. The 10-gene transcriptomic panel identified 74 patients at risk compared with 78 for the full transcriptome panel. A comparison of this performance across risk predictors is presented in Table S2.
Figure 5.

Surrogates to predict both risk of COVID-19 disease and response to sotrovimab using a 10-gene panel
(A) In cross-validation, the 10-gene panel accurately predicts risk groups assigned by the full transcriptome at both day 1 and day 8.
(B) Changes in expression for each of the genes in the 10-gene panel from day 1 to day 8.
(C) Performance of each of the genes in the same 10-gene panel to track the response (change in expression from day 1 to day 8) to sotrovimab versus placebo.
The whiskers in (B) and (C) are 1.5 times the difference between the 25th and 75th percentiles (interquartile range or IQR)
As an exploratory analysis, we compared the univariate predictive performance of panel genes with other baseline risk factors. We found that EIF2D and EIF4B had AUCs of 0.82 (p = 0.004) and 0.80 (p = 0.006), respectively. On this subset of the data, NLR had an AUC of 0.79 (p = 0.008), viral load had an AUC of 0.71 (p = 0.03), and age had an AUC of 0.66 (p = 0.08); a complete list of univariate performances is presented in Table S3. The Fisher’s p value for the association of seropositivity to hospitalization status in this subcohort was 0.34.
Finally, to independently validate the 10-gene panel, we examined gene-expression profiles reported by Hu et al.16 We chose this study because it had similar enrollment criteria, time points, sample handling, and sequencing and it had over 100 patients. Compared with Hu et al.,16 we find that, with the exception of MYO18A, the trends in expression that we observe for low- versus high-risk participant clusters closely match the trends by disease severity in this external cohort (Figure S5). Given the methodological differences between the studies and the known sensitivity of RNA sequencing (RNA-seq) to these deviations, this result further supports the robustness of the 10-gene panel. Slight variations in absolute gene expression between studies also underline the importance of proper calibration and quality control if deploying a test such as this across multiple sites.
Discussion
We defined clinical laboratory and molecular biomarkers that can potentially identify participants with mild to moderate COVID-19 who are at the highest risk for progression to severe disease and hospitalization or death using data collected in the prospective, phase 3 pivotal study COMET-ICE. Baseline NLR and a 10-gene transcriptomic signature associated with all-cause hospitalization or death with respective sensitivity and specificity of 36% and 95% (NLR) as well as 75% and 76% (10-gene panel), respectively, on the transcriptomics subcohort. Changes in these biomarkers were also associated with response to treatment with the monoclonal Ab sotrovimab.
Currently, the risk of developing severe COVID-19 has been associated with a number of demographic factors such as age and specific comorbidities. However, there is considerable heterogeneity in disease outcome that would benefit from additional stratification of risk. NLR, the simple ratio of neutrophil over lymphocyte counts, could be informative and easy to implement, an observation supported by other studies.17, 18, 19 Though NLR sensitivity is low, the high specificity suggests that high NLR could be used as a triage test for persons at high risk of progressing and could prioritize those individuals for closer monitoring.
Serostatus, defined here as immunoglobulin G (IgG) Ab response to nucleocapsid, could also be a predictor of disease severity. The rate of hospitalization was lower among seropositive participants who received placebo. None of the participants that were seropositive at baseline, whether because of previous infection or because of ongoing seroconversion,20 died or were admitted to the ICU. Seropositive participants had lower levels of viral RNA in nasopharyngeal samples and were less likely to present or maintain a risk transcriptome profile. One important caveat of the serostatus analysis is that VOCs have continued to emerge and there are ongoing re-infections and declining protection of vaccine-elicited seropositivity. Therefore, additional analysis may be needed to confirm the protective effect of seropositivity as a result of prior infection in the context of evolving VOCs. Furthermore, the utility of serostatus as a diagnostic or predictive tool is complicated by a lack of standardization in assays and consensus in thresholds of seropositivity or protective immunity, especially as VOCs continue to emerge.
Whole-blood transcriptome analysis revealed a signature of disease severity that encompassed overexpression of genes involved in interferon response, inflammation, and the complement system. We showed that a full transcriptome signature can be captured faithfully with a 10-gene panel. Use of a simple expression signature lowers the bar for an eventual implementation, as recently shown by work to make a three-gene tuberculosis signature using point-of-care rapid testing.21
An important effort of the present work was to define whether the set of predictive parameters of hospitalization and disease severity was also modified by treatment with sotrovimab, i.e., whether these parameters could serve as surrogate markers of sotrovimab response because they are modified by treatment and strongly associated with the study clinical endpoints of interest. Indeed, sotrovimab accelerated the normalization of NLR and the transcriptome profiles in a statistically significant manner. In particular, hospitalized participants in the placebo group retained the transcriptome profile associated with risk by day 8 at a time when the majority of study participants normalized their peripheral blood gene-expression profiles.
One topic of discussion in the field is the value of measuring the levels of viral RNA in nasopharyngeal samples. In the present study, viral RNA levels measured by RT-PCR were of modest value as a baseline predictor. However, there was an association between viral RNA levels and the predictors of risk that we explored: NLR, serology, and transcriptome profiles. Participants at risk of severe disease and hospitalization present higher levels of baseline nasopharyngeal viral RNA.10 Weinreich et al.22 reported that mAb therapy had a significant effect on participants with a high viral load at baseline. Chen et al.23 reported a decreased viral load at day 11 did not appear to be a clinically meaningful endpoint since the viral load was substantially reduced from baseline for the majority of patients, including those in the placebo group, a finding that is consistent with the natural course of the disease. Gottlieb et al.24 reported that treatment with mAb combination therapy, but not monotherapy, resulted in a reduction in SARS-CoV-2 log viral load at day 11 in participants with mild to moderate COVID-19. US FDA authorized the monoclonal bebtelovimab under EUA primarily on the symptomatic improvement and day 5 reduction in viral load versus placebo. In the present work, resolution of disease was associated with decrease of viral load, in particular for participants receiving sotrovimab.
The strengths of the current study reside on the well-characterized, geographically diverse, prospective clinical trial with whole blood/RNA collected at multiple time points to evaluate response to treatment and disease characteristics over time. This dataset enabled the implementation of machine-learning methods for predicting disease severity from both clinical and transcriptomic markers. In conclusion, this study identifies laboratory parameters associated with COVID-19 disease progression and hospitalization and shows that sotrovimab treatment effectively contributed to normalization of these parameters. By providing general tools for COVID-19 risk stratification, these results may prove useful independently of the treatment in use.
Limitations of the study
A limitation of the study is that it included a predefined risk population of adults based on demographic and comorbid factors. A second limitation is the low number of study endpoints (e.g., hospitalizations) in the transcriptomic substudy. However, if validated in additional studies, this approach could expand the definition of risk to include participants that might otherwise not be considered for treatment based on risk criteria currently in use.
STAR★Methods
Key resources table
| REAGENT or RESOURCE | SOURCE | IDENTIFIER |
|---|---|---|
| Deposited data | ||
| Metadata: accessions_metadata_nopatid.tsv contains the accession id, the day and treatment information | This work | 10.6084/m9.figshare.20323416 |
| Transcriptome data: counts.tsv contains the tpm (transcripts per million) matrix for the respective accession ids. | This work | 10.6084/m9.figshare.20323416 |
| Additional Supplemental Items | This work | https://data.mendeley.com/datasets/mfj7t3wfk3/1 |
| Software and algorithms | ||
| Trimmomatic (v 0.39) | Bolger et al., 201425 | http://www.usadellab.org/cms/?page=trimmomatic |
| STAR (v 2.7.3a) | Dobin et al., 201326 | https://github.com/alexdobin/STAR |
| Salmon (v 1.0.0) | Patro et al., 201727 | https://github.com/COMBINE-lab/salmon |
| FASTQC (v 0.11.8) | Babraham Bioinformatics | https://www.bioinformatics.babraham.ac.uk/projects/fastqc/ |
| Picard (v 2.20.2) | Broad Institute | https://github.com/broadinstitute/picard |
| DupRadar (v 1.12.1) | Sayols et al., 20163 | https://bioconductor.org/packages/release/bioc/html/dupRadar.html |
| RSeQC (v 3.0.1) | Wang et al., 201228 | https://github.com/MonashBioinformaticsPlatform/RSeQC |
| Tximport (v 1.20.0) | Soneson et al., 201529 | https://bioconductor.org/packages/release/bioc/html/tximport.html |
| DESeq2 (v 1.32.0) | Love et al., 201430 | https://bioconductor.org/packages/release/bioc/html/DESeq2.html |
| msigdbr (v 7.4.1) | Dolgalev (2022) | https://igordot.github.io/msigdbr/ |
| Gencode GRCH38, release 30 | Frankish et al., 201931 | https://www.gencodegenes.org/human/ |
| Ensembl (ASM985889v3) | Howe et al., 202132 | https://uswest.ensembl.org/index.html |
| UMAP | Mclnnes et al., 2018 | https://umap-learn.readthedocs.io/en/latest/ |
| fgsea (v 1.18.0) | Korotkevich et al., 2019 | https://bioconductor.org/packages/release/bioc/html/fgsea.html |
Resource availability
Lead contact
Further information and requests for resources and reagents should be directed to and will be fulfilled by the Lead Contact, Amalio Telenti (atelenti@vir.bio).
Materials availability
This study did not generate new unique reagents.
Experimental model and subject details
Characteristics of clinical trial population
COMET-ICE included 1057 adults with a positive local polymerase-chain-reaction or other molecular SARS-CoV-2 test result and onset of symptoms within the prior 5 days (Table 1).2 Recruitment was between August 2020 and March 2021, during which time Alpha, Epsilon, and Gamma were the predominant circulating variants in countries where this study was recruited. Participants were required to be at risk for COVID-19 progression based on previously identified clinical parameters: age ≥55 years or adults with at least one of the following comorbid conditions: diabetes requiring medication, obesity (body mass index >30 kg/m2), chronic kidney disease (estimated glomerular filtration rate <60 mL/min/1.73 m2), congestive heart failure (New York Heart Association class II or higher), chronic obstructive pulmonary disease, or moderate to severe asthma. Participants with already severe COVID-19, defined by shortness of breath at rest, oxygen saturation less than 94%, or requiring supplemental oxygen, were excluded. Participants were randomized 1:1 to receive either a single 500-mg infusion of sotrovimab or equal volume saline placebo. A subset of participants (n = 302) consented for peripheral whole blood transcriptome analysis. Participants who opted-in to the transcriptome sub-study had similar demographic, clinical and laboratory characteristics to those in the overall study. They were evenly divided between placebo and sotrovimab arms (Table 1). In-person study visits occurred on days 1, 5, 8, 11, 15, 22 (W3), and 29 (W4) to assess adverse events and worsening of COVID-19. During study visits, blood samples and nasopharygeal swabs were collected for routine laboratory assessments and viral load, respectively. Samples for transcriptome analysis were collected twice: at the time of treatment (referred to as Day 1 herein) and a week later at the Day 8 visit.
All necessary patient/participant informed consent has been obtained and the appropriate institutional forms have been archived. The details of the IRB/oversight body that provided approval or exemption for the research are provided in the Additional Resources/clinical trial information section below.
Method details
Clinical data analysis
The associations between laboratory values, and treatment response and hospitalization were measured using the area under a receiver operating characteristic curve (AUC). For single variable analyses, this metric was computed by directly ranking participants with no model fitting step, to avoid overfitting. Significance of AUC was assessed by the Mann-Whitney U test, relying on the equivalence between the Mann-Whitney U statistic and AUC. All reported AUCs were significant after a Bonferroni adjustment for multiple comparisons. The significance threshold was calculated as 0.05 divided by the number of clinical variables tested. For binary variables such as baseline risk factors, significance was assessed by Fisher exact test. Assessing complementarity of features was complicated by varying missingness patterns, leading to sample size loss. This was minimized by looking at only pairs of variables, and by median imputation of missing values.33 Neither approach significantly improved on the single most predictive variable, indicating that single variable predictors are sufficient for accurate risk prediction.
SARS-CoV-2 viral load and serology
Nasopharyngeal swabs were collected in universal transport media, and viral load was measured using the CDC 2019-nCoV Real-Time RT-PCR method run at central lab (https://www.fda.gov/media/134922/download). Serum samples were analyzed for anti-SARS-CoV-2 antibody by the Abbott SARS-CoV-2 IgG assay run on the Architect i2000SR immunoassay analyzer (https://www.fda.gov/media/137383/download). This assay qualitatively measures IgG anti-SARS-CoV-2 antibodies against the nucleocapsid protein that are present as a result of endogenous immune response to natural infection. Due to the potential for cross-reaction of sotrovimab with anti-spike antibody assays, only analysis of anti-nucleocapsid serostatus was conducted.
RNA isolation and sequencing
Peripheral whole blood was collected into PAXgene Blood RNA tubes (PreAnalytiX), identified by a sample accession number. Immediately after blood collection, samples were inverted 8-10 times to fully mix the Paxgene RNA stabilizing agent with the collected blood. Tubes were stored upright and on the day of collection were frozen to −20C for 24 h before being transferred to −70C for long term storage. Day 1 and Day 8 samples for the same patient were sent for processing in the same batch. RNA purification, library preparation and sequencing were performed by Q2 Solutions (Morrisville, NC). Total RNA was isolated according to the Paxgene protocol. Briefly, sample tubes are centrifuged to pellet nucleic acid which is washed and treated with protease under denaturing conditions followed by purification via a Paxgene RNA 96 well plate to remove contaminants. The purified total RNA is then eluted with nuclease-free water and quantified via spectrometry and analyzed by Agilent Bioanalyzer for integrity. Recovery of >1.25 ug of total RNA and an RNA Integrity (RIN) score >7.0 was required for each sample to proceed through further sample processing. Isolated total RNA was then depleted of globin mRNA using the GLOBINclear kit (Invitrogen); total RNA is incubated with biotinylated oligos capable of hybridizing to globin mRNA which allows depletion of globin mRNA by flowing the mixture over streptavidin beads and collecting the unbound RNAs.
The globin-depleted RNA was used to generate a sequencing library using the TruSeq Stranded mRNA method (Illumina). Briefly, globin-depleted total RNA samples are concentration normalized and incubated with poly(T) oligonucleotides in order to select poly-adenylated RNAs from the total RNA population. The selected RNA is then fragmented using heat in the presence of divalent cations. The fragmented RNA is converted to double stranded cDNA using random primers in two steps to maintain strand specific information. This is enabled by using dUTP in place of dTTP in the second strand master mix; during sequencing the presence of uracil in the DNA sequence causes the polymerase to stall leaving only the first strand as a viable amplification template. The double stranded cDNA undergoes end-repair, A-tailing and ligation of adapters that include index sequences. cDNA libraries are PCR amplifed and purified, then are assessed for quantity and quality using qPCR and TapeStation prior to sequencing.
Normalized libraries of cDNA were pooled and sequenced on Illumina NovaSeq 6000 instruments to a target sequencing depth of 25 million paired-end reads per sample at a minimum read length of 50 bp. Samples were automatically selected by Q2 Solutions for repeat library preparation and sequencing based on pre-defined quality control metrics for ribosomal RNA fraction (>10% rRNA aligned reads threshold for repeat).
RNA-seq analysis
701 sequenced libraries from 638 whole blood samples were delivered from Q2 Solutions by processing batch and sequencing run. Reads were cropped to a common read length of 50 bp and low-quality bases and adapters were further trimmed using Trimmomatic (v. 0.39).25 Trimmed reads less than 31bp were discarded. Trimmed sequenced reads per library were then aligned to a custom reference genome using STAR (v 2.7.3a)26 and to a custom reference transcriptome using Salmon (v. 1.0.0)28. The custom reference genome and transcriptome annotation was based on combining the human reference genome and annotation from Gencode (GRCh38, release 30) with the SARS-CoV-2 reference genome and annotation from Ensembl (ASM985889v3 version). Libraries were assessed for total reads (minimum, maximum, and median of 23.4, 94.4, and 33.2 million read pairs), average read length (49 bp), and adapter content, post-trimming with FASTQC (v. 0.11.8). Alignment metrics, such as total aligned reads, aligned reads by feature type, gene body coverage and 3′ bias, were assessed using Picard CollectRnaSeqMetrics (v 2.20.2–0). We profiled duplication rate versus reads per kbp and verified that low read counts were not associated with high duplication at the library level using DupRadar (v 1.12.1). Known junction saturation rate as a function of sequencing depth was also profiled for all libraries using RSeQC (v 3.0.1). Transcript-level counts from Salmon were converted to gene-level counts and gene-level transcripts-per-million (TPM) using the R package tximport (v. 1.20.0). As genes with consistently low supporting read counts across libraries are unlikely to be called differentially expressed, a filtering step to remove genes with few to no supporting read counts across libraries was performed.34 Conservatively, only genes with a minimum of 10 read counts in at least 4% (n = 24) of the libraries were considered for further analysis (n = 23,540 genes). When multiple libraries (due to repeated library preparation and sequencing) were available for the same sample accession number (whole blood sample), a representative library with the higher median TPM value was selected as libraries with outlier values for alignment quality metrics were associated with (low) outlier median TPM values. Only libraries representing matched Day 1 and Day 8 whole blood samples for a patient were included for downstream analysis. No other library exclusion criteria were applied. Inclusion in this sub-cohort was based on opt-in on day 1. We found that, as expected with this format, the day of hospitalization was not significantly associated to inclusion in the transcriptome subcohort (χ2 p = 0.14). The study was not powered to predict early versus late hospitalization.
The transcriptomic data to validate the 10-gene signature were obtained from the GEO under the accession number GSE178967.16 The data were processed through the same analytical pipeline as described above.
Data analysis transcriptome
Using the R package DESeq2 (v 1.32.0),30 variance-stabilizing transformation was applied to gene-level counts.34 For exploration of transcriptome signatures, UMAP was run on the variance-stabilizing transformed RNA-seq count data. Prior to UMAP projection, data were pre-conditioned and de-noised using principal component analysis (PCA). The first 20 PCs were selected based on the point at which explained variance tended towards zero (Figure S6). For this baseline analysis, UMAP (from the umap-learn python package; https://umap-learn.readthedocs.io/en/latest/) was run with default parameters.
To test the robustness of the embedding, this analysis was repeated for the full transcriptome (without PCA) for pathogen-associated transfer genes identified by di Iulio et al.,15 and for immune-related pathway gene sets (Hallmark Gene Sets annotation).12 In each case, a variety of nearest neighbor values were tried, and the embedding was run multiple times to ensure repeatability. In all cases, the embeddings were similar. For example, the observed gradient between Day 1 and Day 8 samples, as well as the relative placement of the hospitalized was always consistent.
High risk due to laboratory parameters vs low risk categorizations were derived as follows. Two-dimensional kernel density estimation with a bandwidth of 1 was applied to Day 1 and Day 8 UMAP values separately. High risk participants were defined as those within an area where the Day 1 density exceeded the Day 8 density by 0.005. This cutoff was derived by choosing a round positive number near the beginning of the tail of the distribution (Figure S7). As a validation of this approach, we also performed a line search on this cutoff to optimize the separation between Day 1 and Day 8, as measured by Fisher’s exact p-value. This yielded an optimal cutoff of 0.006. To be conservative, we did not use this optimized value since the selection of cutoffs for the line search could be influenced by information beyond Day 1 vs Day 8 status.
Differentially expressed genes associated with the putative high-risk cluster were scored using a model accounting for gender and visit day (DESeq2, v. 1.32.0).30 Differentially expressed genes were characterized via gene set enrichment analysis (fgsea, v 1.18.0)35 using the Hallmark Gene Sets annotation (msigdbr, v. 7.4.1).12 For selection of a gene signature, we conducted diversity-based selection according to top ANOVA F-scores within 10 empirically identified gene clusters. Gene clusters were derived by performing UMAP dimensionality reduction on the transpose of the transcriptome matrix (with genes as rows instead of patients). This created a similarity map of genes based on their co-expression patterns across patients. We then defined 10 gene clusters from this map using K-means clustering (Figure S3). From each cluster, we selected the gene most associated with risk according to its ANOVA F-score. Diversity-based selection using gene clustering significantly improved on greedy selection based on F-score alone (Figure S8A) and yielded comparable performance to transfer-learned15 and hallmark gene sets (Figure S8B). To assess performance of this set of 10 genes representing co-expression clusters, we repeated this entire process within a five-fold cross-validation loop, including gene clustering. In this procedure the dataset is partitioned into five folds. For each of the five folds, we trained a model on the other four chunks to predict its values in an unbiased manner. To avoid overfitting due to patient-specific attributes, samples from the same patient on different days were always kept in the same fold.
Quantification and statistical analysis
There was no analysis plan for this work in COMET-ICE; this was post-hoc analysis of the trial data. Analyses conform with the STARD 2015 reporting guideline for diagnostic accuracy studies. Specific analytical approach of clinical data and of transcriptome data are described in their respective sections above. We checked that transcriptome data were not dominated by batch effects by principal component analysis (PCA) and profiling the distribution of batches Transcriptomics samples for the same patient were processed in the same batch. Similarly, clinical variables which checked to have the expected ranges to rule out differences in units, errors in data entry or extraction, etc. Clinical variables were also plotted pairwise to ensure that expected correlations between variables were observed without notable outliers. Finally, observed associations to disease were checked against reports in the literature to verify the consistency of the findings.
Statistical analysis
Differences in NLR and log viral load between study arms were assessed by Mann-Whitney U test, as described in the figure legends of Figures 1 and 3. For binary variables such as baseline risk factors, significance was assessed by Fisher’s exact test. Classification accuracy was measured by the area under the receiver operating characteristic curve. Sample sizes for analyses for each clinical variable are presented in Table S1. Differential gene expression was assessed using DESeq2, as described above. P-values were adjusted for multiple comparisons using a false discovery rate control strategy. Sample sizes for the full and transcriptome cohorts are presented in Table 1. Table 2 presents sample sizes for the serology analysis.
Additional resources
Clinical trial information
Registration: NCT04545060 (https://clinicaltrials.gov/ct2/show/NCT04545060)
Study Type: Interventional (Clinical Trial)
Actual Enrollment: 1057 participants
Allocation: Randomized
Intervention Model: Parallel Assignment
Masking: Quadruple (Participant, Care Provider, Investigator, Outcomes Assessor)
Primary Purpose: Treatment
Official Title: A Randomized, Multi-center, Double-blind, Placebo-controlled Study to Assess the Safety and Efficacy of Monoclonal Antibody VIR-7831 for the Early Treatment of Coronavirus Disease 2019 (COVID-19) in Non-hospitalized Patients
Actual Study Start Date: August 27, 2020
Actual Primary Completion Date: April 8, 2021
Actual Study Completion Date: September 2, 2021
The details of the IRB/oversight body that provided approval or exemption for the research described are given below:
Ethics approval was obtained from the following ethics review boards: Research Ethical Committee of the Universidade De Passo Fundo/Office Of The Assistant Dean Of Research And Graduate Studies, Brazil (454545/249305), Research Ethical Committee of the Liga Norte Riograndense Contra O Cancer, Brazil (356987/249067), Comite de Etica em Pesquisa do Hospital Leforte, Brazil (454407/249306; 454407/249306), Research ethical Committee of the Hospital de Clinicas de Porto Alegre of the Federal University of Rio Grande do Sul, Brazil (412641/249076), Research Ethical Committee of the Brotherhood of the Holy House of Mercy of Porto Alegre, Brazil (452132/249278), Advarra, Canada (125285/249219; 233252/249074), Comite Nacional Transitorio de Etica en Investigacion para la evaluacion y supervision eticas de los Ensayos Clinicos de la enfermedad COVID-19 (CNTEI COVID-19), Peru (453319/249281), CEIm Corporacio Sanitaria Parc Tauli Parque del Tauli, Spain (466003/249291; 010074/249923; 230601/249242), Advarra, United States (316647/249611; 393090/249560; 320687/249555; 427380/249631; 093073/249546; 449583/248364; 009334/249320; 021490/248894; 457707/249681; 076115/248362; 457712/249682; 354044/249803; 171466/248900; 458530/249910; 457765/249683; 408728/249251; 458692/249844; 176292/249239; 006879/248345; 347052/249553; 455576/249387; 455582/249389; 456034/249493; 053521/249195; 455575/249386; 028996/249554; 458529/249909; 370717/249241; 331745/249072; 453800/249220; 459369/249998; 429263/248346; 455578/249390; 457328/249637; 259973/249632; 023446/249253; 457766/249684; 456703/249634; 014897/248899; 306670/249073; 306670/249073; 007907/250048; 373940/248347; 419336/249556; 455826/249420. I confirm that all necessary patient/participant consent has been obtained and the appropriate institutional forms have been archived, and that any patient/participant/sample identifiers included were not known to anyone (e.g., hospital staff, patients or participants themselves) outside the research group so cannot be used to identify individuals.
Acknowledgments
This work was funded by Vir Biotechnology, Inc.
Author contributions
Study design, M.C.M. and A.T.; clinical trial study, A.G., A.L.C., M.A., E.A., A.P., D.A., E.M., W.W.Y., A.E.S., and P.S.P.; data management, L.B.S., J.d.I., S.L., M.J.S., K.M., D.S., and Y.-P.C.; data analyses, M.C.M., L.B.S., X.D., and Y.-P.C.; scientific oversight, D.C., H.W.V., P.S.P., and A.T.; paper drafting, M.C.M., L.B.S., H.W.V., and A.T. with participation of all authors. M.C.M., L.B.S., K.M., P.S.P., and A.T. had unrestricted access to all data. All authors agreed to submit the manuscript, read and approved the final draft, and take full responsibility of its content, including the accuracy of the data and the fidelity of the trial to the registered protocol and its statistical analysis.
Declaration of interests
This study was sponsored by Vir Biotechnology, Inc., in collaboration with GlaxoSmithKline. M.C.M., L.B.S., Y.-P.C., J.d.I., S.L., M.J.S., A.L.C., K.M., D.S., M.A., E.A., L.P., X.D., E.M., W.W.Y., D.C., H.W.V., P.S.P., and A.T. are employees of Vir Biotechnology, Inc., and may hold shares in Vir Biotechnology, Inc. D.A. and A.P. are employees of and hold shares in GlaxoSmithKline. D.C. and A.T. are named inventors of the US patent 17384665 “Antibodies against SARS-CoV-2 and methods of using the same.”
Published: August 16, 2022
Footnotes
Supplemental information can be found online at https://doi.org/10.1016/j.xcrm.2022.100721.
Contributor Information
M. Cyrus Maher, Email: cmaher@vir.bio.
Amalio Telenti, Email: atelenti@vir.bio.
Supplemental information
Data and code availability
-
•
Data: We have released transcriptomic count data from the clinical trial since they do not not include identifiable genetic data. Links to these data can be found in the Key resources table.
-
•
Code: Software packages used in the analysis are also presented in the Key resources table.
-
•
General statement: Any additional information required to reanalyze the data reported in this work paper is available from the Lead Contact upon request.
References
- 1.Gupta A., Gonzalez-Rojas Y., Juarez E., Crespo Casal M., Moya J., Falci D.R., Sarkis E., Solis J., Zheng H., Scott N., et al. Early treatment for Covid-19 with SARS-CoV-2 neutralizing antibody sotrovimab. N. Engl. J. Med. 2021;385:1941–1950. doi: 10.1056/NEJMoa2107934. [DOI] [PubMed] [Google Scholar]
- 2.Gupta A., Gonzalez-Rojas Y., Juarez E., Crespo Casal M., Moya J., Rodrigues Falci D., Sarkis E., Solis J., Zheng H., Scott N., et al. Effect of sotrovimab on hospitalization or death among high-risk patients with mild to moderate COVID-19: a randomized clinical trial. JAMA. 2022;327:1236–1246. doi: 10.1001/jama.2022.2832. [DOI] [PMC free article] [PubMed] [Google Scholar]
- 3.Sayols S., Scherzinger D., Klein H. dupRadar: a Bioconductor package for the assessment of PCR artifacts in RNA-Seq data. BMC Bioinf. 2016;17:428. doi: 10.1186/s12859-016-1276-2. [DOI] [PMC free article] [PubMed] [Google Scholar]
- 4.Cathcart A.L., Havenar-Daughton C., Lempp F.A., Ma D., Schmid M.A., Agostini M.L., Guarino B., Di iulio J., Rosen L.E., Tucker H., et al. The dual function monoclonal antibodies VIR-7831 and VIR-7832 demonstrate potent in vitro and in vivo activity against SARS-CoV-2. bioRxiv. 2021 https://www.biorxiv.org/content/10.1101/2021.03.09.434607v7 Preprint at. [Google Scholar]
- 5.Cameroni E., Saliba C., Bowen J.E., Rosen L.E., Culap K., Pinto D., VanBlargan L.A., De Marco A., Zepeda S.K., di Iulio J., et al. Broadly neutralizing antibodies overcome SARS-CoV-2 Omicron antigenic shift. bioRxiv. 2021 doi: 10.1038/s41586-021-04386-2. https://www.biorxiv.org/content/10.1101/2021.12.12.472269v2 Preprint at. [DOI] [PMC free article] [PubMed] [Google Scholar]
- 6.Bruel T., Hadjadj J., Maes P., Planas D., Seve A., Staropoli I., Guivel-Benhassine F., Porrot F., Bolland W.H., Nguyen Y., et al. Serum neutralization of SARS-CoV-2 Omicron sublineages BA.1 and BA.2 in patients receiving monoclonal antibodies. Nat. Med. 2022;28:1297–1302. doi: 10.1038/s41591-022-01792-5. [DOI] [PubMed] [Google Scholar]
- 7.Iketani S., Liu L., Guo Y., Liu L., Chan J.F.W., Huang Y., Wang M., Luo Y., Yu J., Chu H., et al. Antibody evasion properties of SARS-CoV-2 Omicron sublineages. Nature. 2022;604:553–556. doi: 10.1038/s41586-022-04594-4. [DOI] [PMC free article] [PubMed] [Google Scholar]
- 8.Cai J., Li H., Zhang C., Chen Z., Liu H., Lei F., Qin J.J., Liu Y.M., Zhou F., Song X., et al. The neutrophil-to-lymphocyte ratio determines clinical efficacy of Corticosteroid therapy in patients with COVID-19. Cell Metab. 2021;33:258–269.e3. doi: 10.1016/j.cmet.2021.01.002. [DOI] [PMC free article] [PubMed] [Google Scholar]
- 9.Letizia A.G., Ge Y., Vangeti S., Goforth C., Weir D.L., Kuzmina N.A., Balinsky C.A., Chen H.W., Ewing D., Soares-Schanoski A., et al. SARS-CoV-2 seropositivity and subsequent infection risk in healthy young adults: a prospective cohort study. Lancet Respir. Med. 2021;9:712–720. doi: 10.1016/S2213-2600(21)00158-2. [DOI] [PMC free article] [PubMed] [Google Scholar]
- 10.Boyapati A., Wipperman M.F., Ehmann P.J., Hamon S., Lederer D.J., Waldron A., Flanagan J.J., Karayusuf E., Bhore R., Nivens M.C., et al. Baseline SARS-CoV-2 viral load is associated with COVID-19 disease severity and clinical outcomes: post-hoc analyses of a phase 2/3 trial. J. Infect. Dis. 2021;224:1830–1838. doi: 10.1093/infdis/jiab445. [DOI] [PMC free article] [PubMed] [Google Scholar]
- 11.Kohler P., Güsewell S., Seneghini M., Egger T., Leal O., Brucher A., Lemmenmeier E., Möller J.C., Rieder P., Ruetti M., et al. Impact of baseline SARS-CoV-2 antibody status on syndromic surveillance and the risk of subsequent COVID-19-a prospective multicenter cohort study. BMC Med. 2021;19:270. doi: 10.1186/s12916-021-02144-9. [DOI] [PMC free article] [PubMed] [Google Scholar]
- 12.Liberzon A., Birger C., Thorvaldsdóttir H., Ghandi M., Mesirov J.P., Tamayo P. The Molecular Signatures Database (MSigDB) hallmark gene set collection. Cell Syst. 2015;1:417–425. doi: 10.1016/j.cels.2015.12.004. [DOI] [PMC free article] [PubMed] [Google Scholar]
- 13.Schultze J.L., Aschenbrenner A.C. COVID-19 and the human innate immune system. Cell. 2021;184:1671–1692. doi: 10.1016/j.cell.2021.02.029. [DOI] [PMC free article] [PubMed] [Google Scholar]
- 14.Walters K.A., Zhu R., Welge M., Scherler K., Park J.K., Rahil Z., Wang H., Auvil L., Bushell C., Lee M.Y., et al. Differential effects of influenza virus NA, HA head, and HA stalk antibodies on peripheral blood leukocyte gene expression during human infection. mBio. 2019;10 doi: 10.1128/mBio.00760-19. [DOI] [PMC free article] [PubMed] [Google Scholar]
- 15.di Iulio J., Bartha I., Spreafico R., Virgin H.W., Telenti A. Transfer transcriptomic signatures for infectious diseases. Proc. Natl. Acad. Sci. USA. 2021;118 doi: 10.1073/pnas.2022486118. [DOI] [PMC free article] [PubMed] [Google Scholar]
- 16.Hu Z., Ploeg K.v.d., Chakraborty S., Arunachalam P., Mori D., Jacobson K., Bonilla H., Parsonnet J., Andrews J., Hedlin H., et al. Early immune responses have long-term associations with clinical, virologic, and immunologic outcomes in patients with COVID-19. Res. Sq. 2022 doi: 10.21203/rs.3.rs-847082/v1. [DOI] [Google Scholar]
- 17.Ulloque-Badaracco J.R., Ivan Salas-Tello W., Al-Kassab-Córdova A., Alarcón-Braga E.A., Benites-Zapata V.A., Maguiña J.L., Hernandez A.V. Prognostic value of neutrophil-to-lymphocyte ratio in COVID-19 patients: a systematic review and meta-analysis. Int. J. Clin. Pract. 2021;75 doi: 10.1111/ijcp.14596. [DOI] [PMC free article] [PubMed] [Google Scholar]
- 18.Simadibrata D.M., Calvin J., Wijaya A.D., Ibrahim N.A.A. Neutrophil-to-lymphocyte ratio on admission to predict the severity and mortality of COVID-19 patients: a meta-analysis. Am. J. Emerg. Med. 2021;42:60–69. doi: 10.1016/j.ajem.2021.01.006. [DOI] [PMC free article] [PubMed] [Google Scholar]
- 19.Kåsine T., Dyrhol-Riise A.M., Barratt-Due A., Kildal A.B., Olsen I.C., Nezvalova-Henriksen K., Lund-Johansen F., Hoel H., Holten A.R., Tveita A., et al. Neutrophil count predicts clinical outcome in hospitalized COVID-19 patients: results from the NOR-Solidarity trial. J. Intern. Med. 2022;291:241–243. doi: 10.1111/joim.13377. [DOI] [PMC free article] [PubMed] [Google Scholar]
- 20.Lee C.Y.P., Lin R.T.P., Renia L., Ng L.F.P. Serological Approaches for COVID-19: Epidemiologic Perspective on surveillance and control. Front. Immunol. 2020;11:879. doi: 10.3389/fimmu.2020.00879. [DOI] [PMC free article] [PubMed] [Google Scholar]
- 21.Sutherland J.S., van der Spuy G., Gindeh A., Thuong N.T.T., Namuganga A., Owolabi O., Mayanja-Kizza H., Nsereko M., Thwaites G., Winter J., et al. Diagnostic accuracy of the Cepheid 3-gene host response fingerstick blood test in a prospective, multi-site study: interim results. Clin. Infect. Dis. 2022;74:2136–2141. doi: 10.1093/cid/ciab839. [DOI] [PMC free article] [PubMed] [Google Scholar]
- 22.Weinreich D.M., Sivapalasingam S., Norton T., Ali S., Gao H., Bhore R., Musser B.J., Soo Y., Rofail D., Im J., et al. REGN-COV2, a neutralizing antibody cocktail, in outpatients with Covid-19. N. Engl. J. Med. 2021;384:238–251. doi: 10.1056/NEJMoa2035002. [DOI] [PMC free article] [PubMed] [Google Scholar]
- 23.Chen P., Nirula A., Heller B., Gottlieb R.L., Boscia J., Morris J., Huhn G., Cardona J., Mocherla B., Stosor V., et al. SARS-CoV-2 neutralizing antibody LY-CoV555 in Outpatients with Covid-19. N. Engl. J. Med. 2021;384:229–237. doi: 10.1056/NEJMoa2029849. [DOI] [PMC free article] [PubMed] [Google Scholar]
- 24.Gottlieb R.L., Nirula A., Chen P., Boscia J., Heller B., Morris J., Huhn G., Cardona J., Mocherla B., Stosor V., et al. Effect of Bamlanivimab as monotherapy or in combination with Etesevimab on viral load in patients with mild to moderate COVID-19: a randomized clinical trial. JAMA. 2021;325:632–644. doi: 10.1001/jama.2021.0202. [DOI] [PMC free article] [PubMed] [Google Scholar]
- 25.Bolger A.M., Lohse M., Usadel B. Trimmomatic: a flexible trimmer for Illumina sequence data. Bioinformatics. 2014;30:2114–2120. doi: 10.1093/bioinformatics/btu170. [DOI] [PMC free article] [PubMed] [Google Scholar]
- 26.Dobin A., Davis C.A., Schlesinger F., Drenkow J., Zaleski C., Jha S., Batut P., Chaisson M., Gingeras T.R. STAR: ultrafast universal RNA-seq aligner. Bioinformatics. 2013;29:15–21. doi: 10.1093/bioinformatics/bts635. [DOI] [PMC free article] [PubMed] [Google Scholar]
- 27.Patro R., Duggal G., Love M.I., Irizarry R.A., Kingsford C. Salmon provides fast and bias-aware quantification of transcript expression. Nat. Methods. 2017;14:417–419. doi: 10.1038/nmeth.4197. [DOI] [PMC free article] [PubMed] [Google Scholar]
- 28.Wang L., Wang S., Li W. RSeQC: quality control of RNA-seq experiments. Bioinformatics. 2012;28:2184–2185. doi: 10.1093/bioinformatics/bts356. [DOI] [PubMed] [Google Scholar]
- 29.Soneson C., Love M.I., Robinson M.D. Differential analyses for RNA-seq: transcript-level estimates improve gene-level inferences. F1000Res. 2015;4:1521. doi: 10.12688/f1000research.7563.2. [DOI] [PMC free article] [PubMed] [Google Scholar]
- 30.Love M.I., Huber W., Anders S. Moderated estimation of fold change and dispersion for RNA-seq data with DESeq2. Genome Biol. 2014;15:550. doi: 10.1186/s13059-014-0550-8. [DOI] [PMC free article] [PubMed] [Google Scholar]
- 31.Frankish A., Diekhans M., Ferreira A.M., Johnson R., Jungreis I., Loveland J., Mudge J.M., Sisu C., Wright J., Armstrong J., et al. GENCODE reference annotation for the human and mouse genomes. Nucleic Acids Res. 2019;47:D766–D773. doi: 10.1093/nar/gky955. [DOI] [PMC free article] [PubMed] [Google Scholar]
- 32.Howe K.L., Achuthan P., Allen J., Allen J., Alvarez-Jarreta J., Amode M.R., Armean I.M., Azov A.G., Bennett R., Bhai J., et al. Ensembl 2021. Nucleic Acids Res. 2021;49:D884–D891. doi: 10.1093/nar/gkaa942. [DOI] [PMC free article] [PubMed] [Google Scholar]
- 33.Sterne J.A.C., White I.R., Carlin J.B., Spratt M., Royston P., Kenward M.G., Wood A.M., Carpenter J.R. Multiple imputation for missing data in epidemiological and clinical research: potential and pitfalls. BMJ. 2009;338:b2393. doi: 10.1136/bmj.b2393. [DOI] [PMC free article] [PubMed] [Google Scholar]
- 34.Love M.I., Anders S., Kim V., Huber W. RNA-Seq workflow: gene-level exploratory analysis and differential expression. F1000Res. 2015;4:1070. doi: 10.12688/f1000research.7035.1. [DOI] [PMC free article] [PubMed] [Google Scholar]
- 35.Korotkevich G., Sukhov V., Budin N., Shpak B., Artyomov M.A., Sergushichev A. Fast gene set enrichment analysis. bioRxiv. 2021 https://www.biorxiv.org/content/10.1101/060012v3 Preprint at. [Google Scholar]
Associated Data
This section collects any data citations, data availability statements, or supplementary materials included in this article.
Supplementary Materials
Data Availability Statement
-
•
Data: We have released transcriptomic count data from the clinical trial since they do not not include identifiable genetic data. Links to these data can be found in the Key resources table.
-
•
Code: Software packages used in the analysis are also presented in the Key resources table.
-
•
General statement: Any additional information required to reanalyze the data reported in this work paper is available from the Lead Contact upon request.