Abstract
Dental fluorosis is an increasing problem due to over exposure to fluoride from the environment. Fluorosis causes hypomineralization of the enamel during tooth development and mild fluorosis is visible as faint white lines on the tooth surface while the most severe fluorosis can result in pitted surfaces. It is difficult to quantify the severity of mild to moderate fluorosis and assessments are limited to subjective visual examinations. Dental fluorosis appears with very high contrast at short wavelength infrared (SWIR) wavelengths beyond 1400 nm and we hypothesize that these wavelengths may be better suited for detecting mild fluorosis and for estimating the severity on tooth surfaces. In this study, the contrast of fluorosis of varying severity on extracted human permanent teeth was measured at SWIR wavelengths ranging from 1300 to 2150 nm using an extended range of InGaAs camera and broadband light sources. The contrast was also measured in the visible range and with quantitative light-induced fluorescence (QLF) for comparison. The depth of hypomineralization and the integrated reflectivity were also measured with cross-polarization optical coherence tomography. The contrast of hypomineralization is significantly higher (P < 0.05) at 1460 and 1950 nm wavelengths than for the visible, fluorescence or other SWIR wavelengths from 1300 to 2150 nm. The highest correlation of the contrast with the depth of hypomineralization measured with cross-polarization-optical coherence tomography (CP-OCT) was at 1950 nm. This SWIR in vitro imaging study exploring wavelengths beyond 1400 nm has shown that hypomineralization on tooth surfaces can be viewed with extremely high contrast at SWIR wavelengths from 1460 to 2000 nm and that SWIR imaging has great potential for monitoring hypomineralization on tooth surfaces. New clinical methods are needed for the measurement of fluorosis that are valid, reliable, and feasible for surveillance at the community level. In addition, methods are needed for the quantitative assessment of fluorosis in vivo.
Keywords: dental fluorosis, optical coherence tomography, short-wavelength infrared imaging
1 |. INTRODUCTION
Over the past 50 years, the nature of dental decay or dental caries in the USA has changed due to the introduction of fluoride to the drinking water, the use of fluoride dentifrices and rinses, application of fluoride topicals in the dental office, and improved dental hygiene. With the increase of fluoride use, the prevalence of caries has been reduced, but fluorosis has become a growing problem. Fluorosis is the hypomineralization of enamel due to excessive fluoride ingestion during permanent tooth development (first 6–8 years of life for most permanent teeth). Enamel fluorosis is characterized by greater surface and subsurface porosity [1]. Estimates show that fluorosis or questionable fluorosis affects almost 40% of persons ages 6–49 [2–5].
Severe fluorosis can be readily distinguished, but the more common mild fluorosis can be easily mistaken for early enamel demineralization due to caries. Currently, fluorosis is scored based on color and tooth morphology using either the Thylstrup-Fejerskov (TF) index or Dean’s Fluorosis Index [1]. Most cases of fluorosis can be identified using these criteria. However, it has not been confirmed that the spatial distribution of hypomineralization on tooth surfaces due to fluorosis is unique and is a reliable means of identification. Angmar-Mansson et al [6] researched several optical techniques for improving the assessment of dental fluorosis and described the optical appearance of fluorosis as diffuse opacities caused by light scattering from a subsurface or surface porous layer with a lower mineral content that have a texture and color similar to those of initial caries lesions but generally a different shape and location [6]. Quantitative light-induced fluorescence (QLF) has been used as a potential diagnostic tool for fluorosis since the subsurface porosities scatter light in a similar manner to demineralized carious lesions [7]. McGrady et al [8, 9] employed QLF in an epidemiological fluorosis survey in fluoridated and non-fluoridated communities in England and Thailand. The CDC has developed a system that combines QLF with cross-polarized visible reflected light based on that work for use by Oral Health Examiners in the USA [10].
Clinical studies have demonstrated that SWIR imaging is capable of higher diagnostic performance than radiography for the detection of lesions on the proximal and occlusal surfaces [11]. Reflectance measurements at wavelengths greater than 1400 nm where water absorption increases be used to detect demineralization on tooth surfaces at earlier stages than existing methods such as QLF [12]. Highly conjugated molecules, such as melanin and porphyrins that are found in foods, drinks and produced by oral bacteria, accumulate in dental plaque and are responsible for the pigmentation in the visible range, but do not absorb light beyond 1200 nm [13, 14]. Since images acquired using SWIR reflectance measurements are free of interference from stains beyond 1200 nm the lesion contrast provides a quantitative measure of hypomineralization. This facilitates automated and objective assessment of lesion severity which is advantageous for screening large numbers of teeth in epidemiological studies.
Optical coherence tomography (OCT) is a noninvasive technique for creating cross-sectional images of internal biological structure [15]. The intensity of the reflected/backscattered light is measured as a function of its axial position in the tissue. Low coherence interferometry is used to selectively remove or gate out the component of backscattered signal that has undergone multiple scattering events, resulting in an axial or depth resolution in the range of a few microns. The primary advantages of OCT for acquiring depth-resolved images of biological tissue include the capability for non-destructive high resolution (<10 μm) coupled with good penetration depth (several mm) and utilization of optical fiber-probes for in vivo imaging. Ultrasound allows good imaging depth several mm or cm’s but has poor resolution (>100 μm) and cannot easily be used on teeth due to the high acoustic impedance [16]. Conventional confocal microscopic methods used in caries research offer very high resolution, 100’s of nanometers, but have limited penetration depths of less than 200 μm and are not designed for in vivo use [17]. cross-polarization-optical coherence tomography (CP-OCT) is ideally suited for measuring the subsurface structure of fluorotic lesions for quantifying their severity.
CP-OCT measurements of the subsurface structure of fluorotic lesions may also be useful for clinical diagnosis and treatment [18]. Measurements of the lesion depth with CP-OCT can inform the clinician whether physical or chemical abrasion of the lesion for esthetic reasons is likely to be successful without removing an excessive thickness of enamel. For example, if the CP-OCT scan shows that the area of hypomineralization is quite severe and penetrates more than halfway through the enamel then treatment would likely cause excessive damage to the tooth and likely should not be attempted. CP-OCT measurements of the zone of higher mineral content can also be used to assess the susceptibility of the fluorotic lesion to erosion and decay from caries. Lesions with a thick transparent surface zone are likely more resistant to further erosion, decay, and cavitation than lesions in which the hypomineralized body of the fluorotic lesion is exposed at the tooth surface.
SWIR reflectance imaging has been exploited for caries detection because sound enamel is transparent in the SWIR and the scattering coefficient increases significantly with increasing mineral loss [11, 12, 19–24]. Zakian et al [25] carried out SWIR reflectance measurements from 1000 to 2500 nm using a hyperspectral imaging system and showed that the reflectance from sound tooth structure decreases at longer wavelengths where water absorption is higher. Further measurements over the past 10 years have shown that the contrast between sound and demineralized enamel continues to increase with increasing wavelength [12, 21] due to the decreasing scattering coefficient of sound enamel [20], increased water absorption and decreased interference from stains [22]. Recent measurements have been extended to 1950 nm where extremely high contrast of demineralization has been observed [20, 22, 26]. The purpose of this study is to measure the contrast of hypomineralization on tooth surfaces at these longer SWIR wavelengths.
2 |. MATERIALS AND METHODS
2.1 |. Tooth samples
Twenty posterior teeth were collected with fluorosis on the buccal and lingual surfaces. Teeth without identifiers were collected from patients in the San Francisco Bay area with approval from the UCSF Committee on Human Research. The teeth were sterilized using gamma radiation and stored in 0.1% thymol solution to maintain tissue hydration and prevent bacterial growth. Fluorosis was diagnosed by a clinician (JS) and proximal and occlusal surfaces that are more likely to contain caries lesions were avoided. Samples were mounted in black orthodontic resin to facilitate repeatable imaging angle and orientation. Some teeth were imaged using Microcomputed X-ray tomography (μCT) with a 10 μm resolution. A Scanco μCT 50 from Scanco USA (Wayne, PA) located at the UCSF Bone Imaging Core Facility was used to acquire those images.
2.2 |. Cross-polarization optical coherence tomography
The cross-polarization OCT system used for this study was purchased from Santec (Komaki, Aichi, Japan). This system acquires only CP-OCT images, not both the cross and co-polarization images (PS-OCT). The Model IVS-3000-CP utilizes a swept laser source; Santec Model HSL-200–30 operating with a 30 kHz a-scan sweep rate. The Mac-Zehnder interferometer is integrated into the handpiece which also contains the microelectromechanical (MEMS) scanning mirror and the imaging optics. It is capable of acquiring complete tomographic images of a volume of 6 × 6 × 7 mm in approximately 3 seconds. The body of the handpiece is 7 × 18 cm with an imaging tip that is 4 cm long and 1.5 cm across. This system operates at a wavelength of 1321 nm with a bandwidth of 111 nm with a measured resolution in air of 11.4 μm (3 dB). The lateral resolution is 80 μm (1/e2) with a transverse imaging window of 6 mm × 6 mm and a measured imaging depth of 7 mm in air. The polarization extinction ratio was measured to be 32 dB.
2.3 |. SWIR reflectance measurements
Samples were stored in a moist environment to preserve internal hydration and the samples were immersed in a water bath before mounting and performing measurements. A computer-controlled air nozzle with a 1 mm aperture and an air pressure set to 25 psi was positioned 4 cm away at a 20° angle above the sample plane as shown in Figure 1 and dried for 30 s before each measurement. The contrast of fluorosis depends on the state of hydration of the hypomineralization therefore a fixed drying time was chosen for reproducibility.
FIGURE 1.
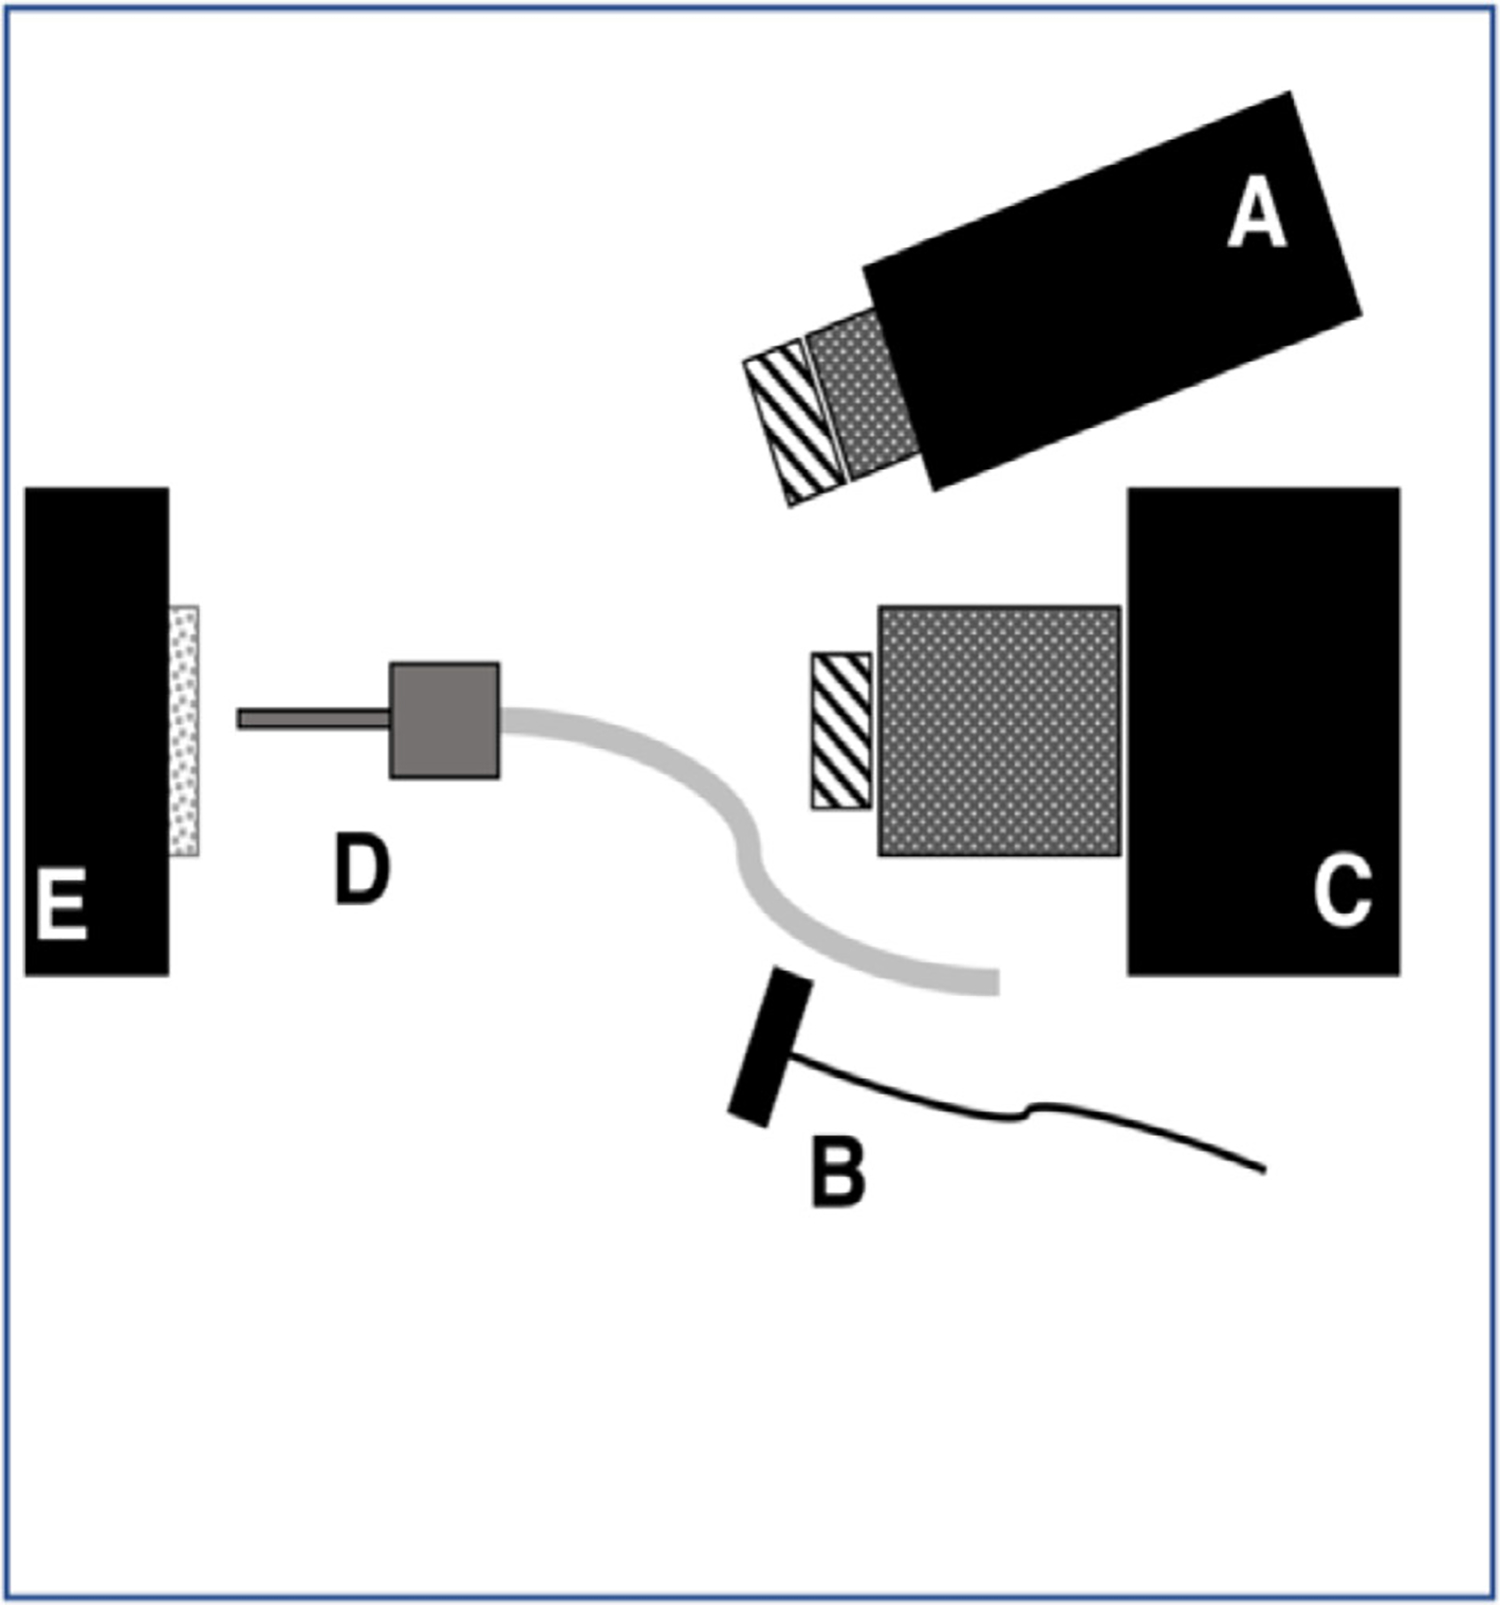
Schematic of the experimental setup showing (A) tungsten-halogen light source with bandpass filters, collimating lens and polarizer, (B) polarized 1950-nm fiber optic light source, (C) Xenics extended range of InGaAs camera with lens and polarizer, (D) air nozzle and (E) tooth samples mounted on XYZ stage. Light sources A and B were positioned on the same side for these measurements
A Xenics (Leuven, Belgium) Model Xeva-2.35–320 extended range of InGaAs camera sensitive from 900 to 2350 nm (320 × 256 pixels) was used to acquire the SWIR images. The camera was equipped with a Navitar f = 35-mm SWIR optimized (f/1.4) lens and a 60 mm achromat lens was positioned 40 mm from the 35 mm lens. A high extinction polarizer was used to acquire cross-polarization images from 1300 to 2150 nm. The quantum efficiency peaks at 1500 nm near 65% and drops off rapidly to 30% after 1700 nm and drops off again to below 20% after 2000 nm. A Model SLS202 extended wavelength tungsten-halogen light source from Thorlabs (Newton, NJ) with a peak output at 1500 nm and collimating optics and a high extinction polarizer was used. Bandpass filters of varying wavelength (bandwidth) 1300 nm (90 nm), 1460 nm (85 nm), 1535 nm (80 nm) and 1675 nm (90 nm) were used. A polarized, broadband amplified spontaneous emission (ASE) light source Model AP-ASE-2000 from AdValue Photonics (Tucson, AZ) with a center wavelength of 1959 nm and a bandwidth of ~100 nm (−3 dB), 230 nm (−30 dB) and an output power of 11 mW was used for the 1950 nm light source. The light sources were placed at 20° angles to the camera as shown in Figure 1 but positioned on the same side. Images were processed and automatically analyzed using a dedicated program constructed with LabVIEW software. The contrast of hypomineralization was calculated using (IL – IS)/IL where (L) represents areas of hypomineralization and (S) represents sound areas. The contrast varies from 0 to 1 for positive contrast. Often the entire coronal tooth surface is covered with areas of hypomineralization and sound areas are not available, therefore, we chose four teeth that appeared sound with no areas of hypomineralization and used the mean of the reflectivity/intensity to represent the sound intensity for calculation of the contrast of hypomineralization. This approach was used for the calculation of the contrast for visible and SWIR wavelengths and for QLF.
2.4 |. Visible/color images
A USB digital microscope, Model 5MP Edge AM7915MZT, AnMO Electronics Corp. (New Taipei City, Taiwan) equipped with a visible polarizer was used to acquired visible images of all samples. The digital microscope captures 5 megapixel (2952 × 1944) color images. Eight white LED lights contained in the camera illuminate the sample and a single polarization element is utilized to reduce glare. The contrast for hypomineralization the visible images was calculated using the same equation used for the SWIR contrast with the exception that the 24-bit color images were converted to 8-bit grayscale images prior to calculation.
2.5 |. Quantitative light fluorescence
Quantitative light fluorescence (QLF) images were acquired using a USB microscope with five blue (480 nm) illumination blue light-emitting diodes and a 510 nm long pass filter, Model AM4115TW-GFBW from BigC (Torrance, CA). The same hypomineralization (L) and sound enamel (S) areas were measured with QLF. However, QLF utilizes fluorescence loss so the intensity of sound enamel is higher than stained and hypomineralized enamel and the following formula for contrast was used (IS – IL)/IS. The 24 bit color images were also converted to 8-bit grayscale images prior to calculation.
2.6 |. Statistical comparisons
Differences between the wavelengths were compared using one-way analysis of variance with repeated measures (RM-ANOVA) with Tukey’s multiple comparisons post test. Linear regression (Pearson) was used to compare the contrast with lesion depth and integrated reflectivity measured with CP-OCT. A significant difference (P < 0.05) from a line with a slope of zero indicated correlation and R2 values indicate the strength of association. Prism statistical software from GraphPad Software, Inc., (La Jolla, CA) was used for the calculations. The significance level was set at P < 0.05.
3 |. RESULTS
Figures 2–4 show CP-OCT, visible and SWIR reflectance, and QLF measurements of three teeth, two with mild fluorosis (hypomineralization) and one sound tooth. A CP-OCT scan is shown in each Figure (A) taken at the position of the dashed line in the visible/color image (B) showing the depth of hypomineralization. Figure 2 shows a tooth with mild fluorosis that penetrates approximately 200 μm deep with diffuse bandlike structures present from the crown to the cementum-enamel junction (CEJ). The CP-OCT b-scan image in Figure 2A taken along the position of the dotted line in Figure 2B shows the variation in depth and reflectivity from the crown to the CEJ. The two greatest variations in the severity of hypomineralization occur at the positions of the red (dashed) and green (solid) arrows. The red arrow indicates a position where the SWIR contrast is high and the depth of hypomineralization is a maximum in the CP-OCT image while the position indicated by the green arrow shows lower SWIR contrast and a shallower depth of hypomineralization. In the visible/color image, it is difficult to assess whether fluorosis is present due to the slight staining/discoloration of the tooth surface and the extremely low contrast of the hypomineralization due to the high reflectivity of the sound tooth. Areas of hypomineralization appear darker in the QLF image in Figure 2C and the area corresponding to the position of the red arrow appears slightly darker although the contrast is poor. Figure 2D shows the SWIR image at 1300 nm where the tooth enamel is the most transparent. The tooth appears somewhat diffuse and the hypomineralization is visible with very low contrast. The contrast increases markedly at longer SWIR wavelengths due to the decreasing reflectivity of sound enamel and the higher water absorption. The highest contrast appears to be at 1460 and 1950 nm, wavelengths coincident with water absorption bands. At 1950 nm, the sound areas of the tooth are almost invisible producing very high contrast of the hypomineralization. A second tooth with moderate bands of hypomineralization is shown in Figure 3. The hypomineralization is greater than 600 μm deep at the position of the red arrow. The ellipticalshaped structure near the CEJ indicated by the yellow arrow in Figure 3G is calcified plaque or dental calculus that highly scatters light. Figure 4 shows similar images from a sound tooth. The CP-OCT scan only shows reflection from the tooth surface which is suppressed due to the cross-polarization and weak scattering from the interior of the tooth. The small highly scattering area on the lower right just above the CEJ is dental calculus. The tooth above the CEJ is barely visible at wavelengths greater than 1460 nm, Figures 4E, F and G.
FIGURE 2.
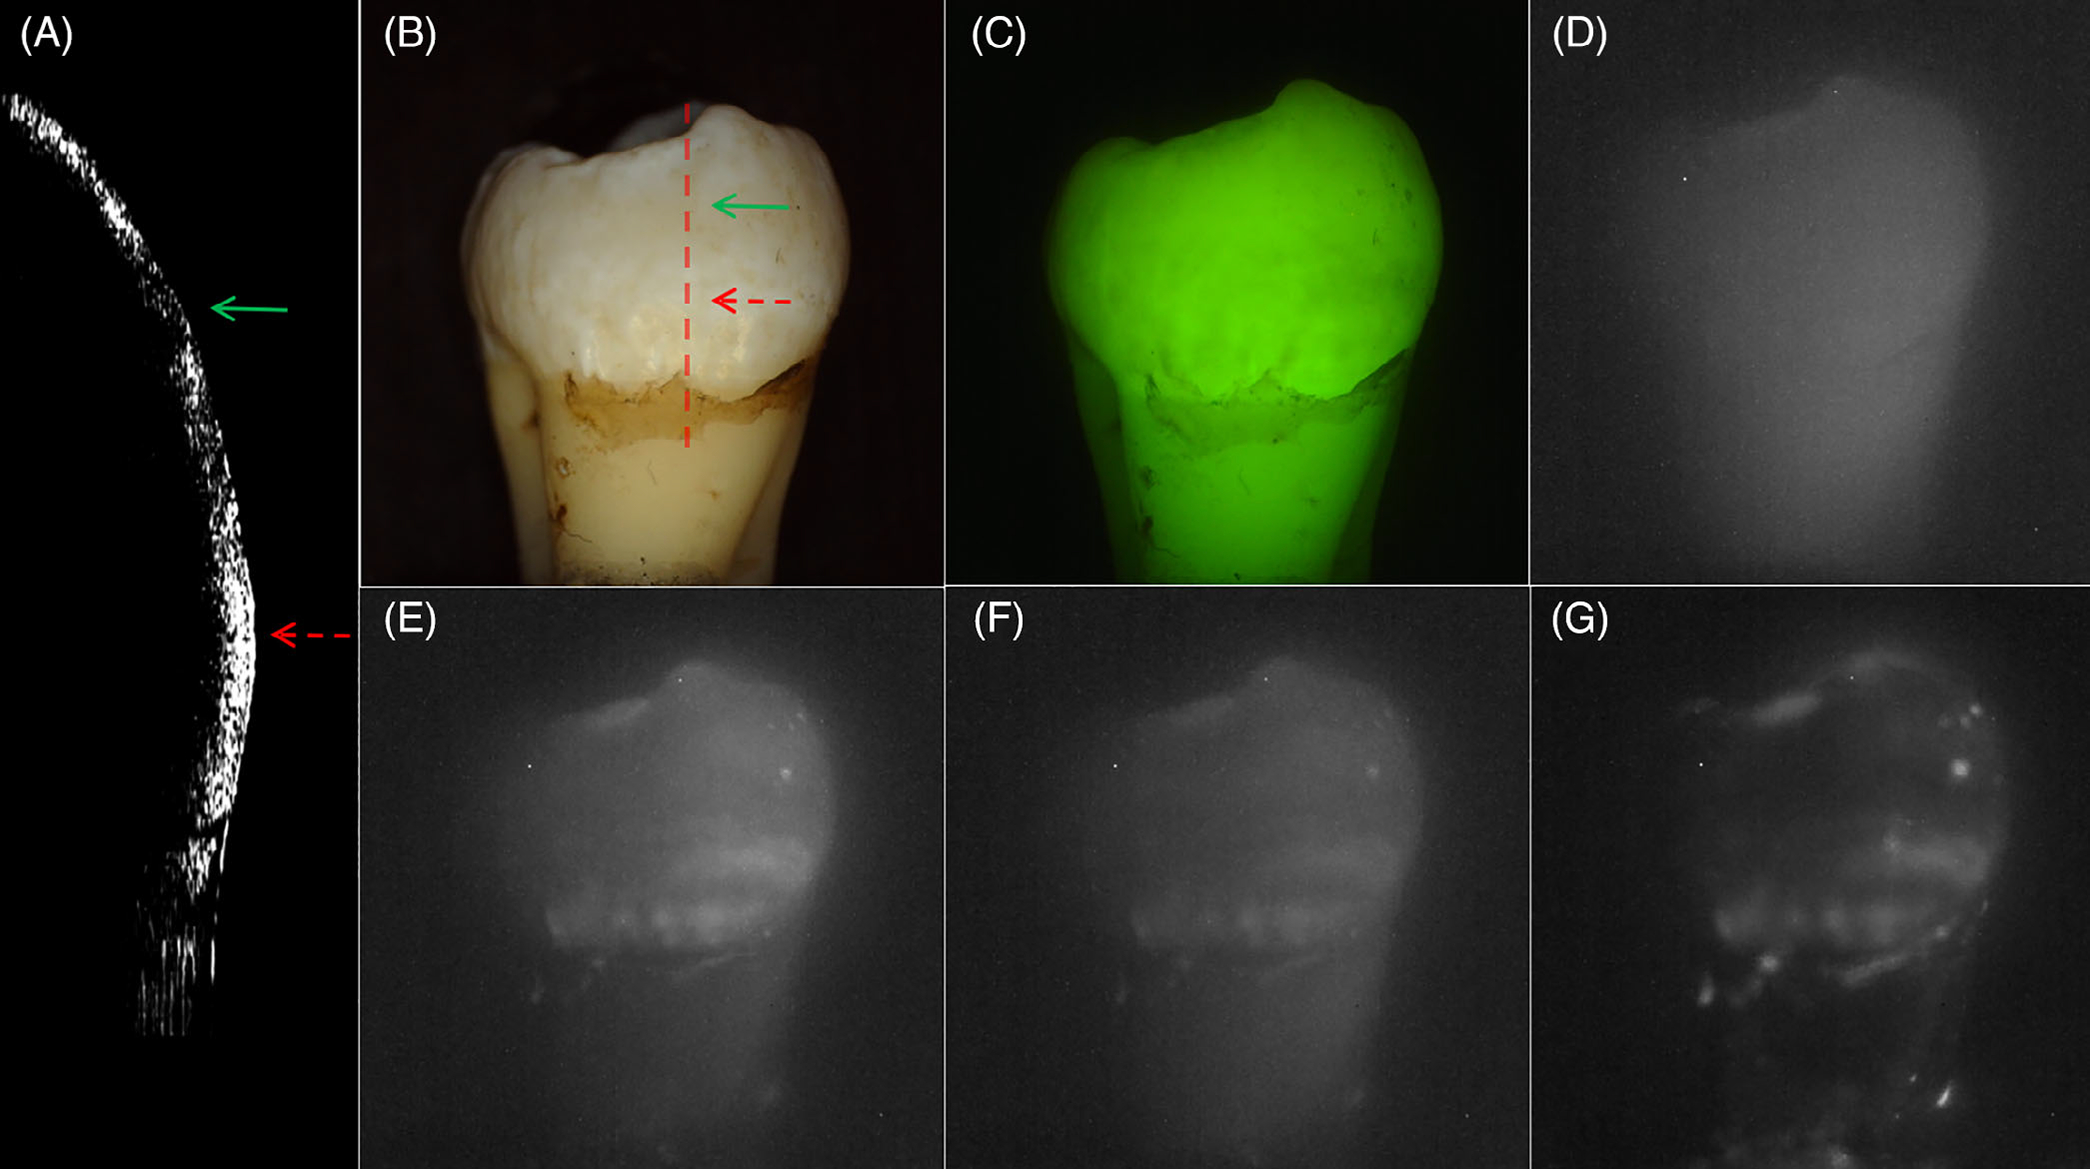
Images of a sample with mild fluorosis. (A) cross-polarization optical coherence tomography (CP-OCT) b-scan acquired at the position of the dashed line in the (B), (B) visible/color, (C) quantitative light-induced fluorescence (QLF) and cross-polarization short wavelength infrared (SWIR) images at (D) 1300, (E) 1460, (F) 1675 and (G) 1950 nm. The depth of hypomineralization is 199 and 185 μm at the positions of the red and green arrows in the CP-OCT scan in (A)
FIGURE 4.
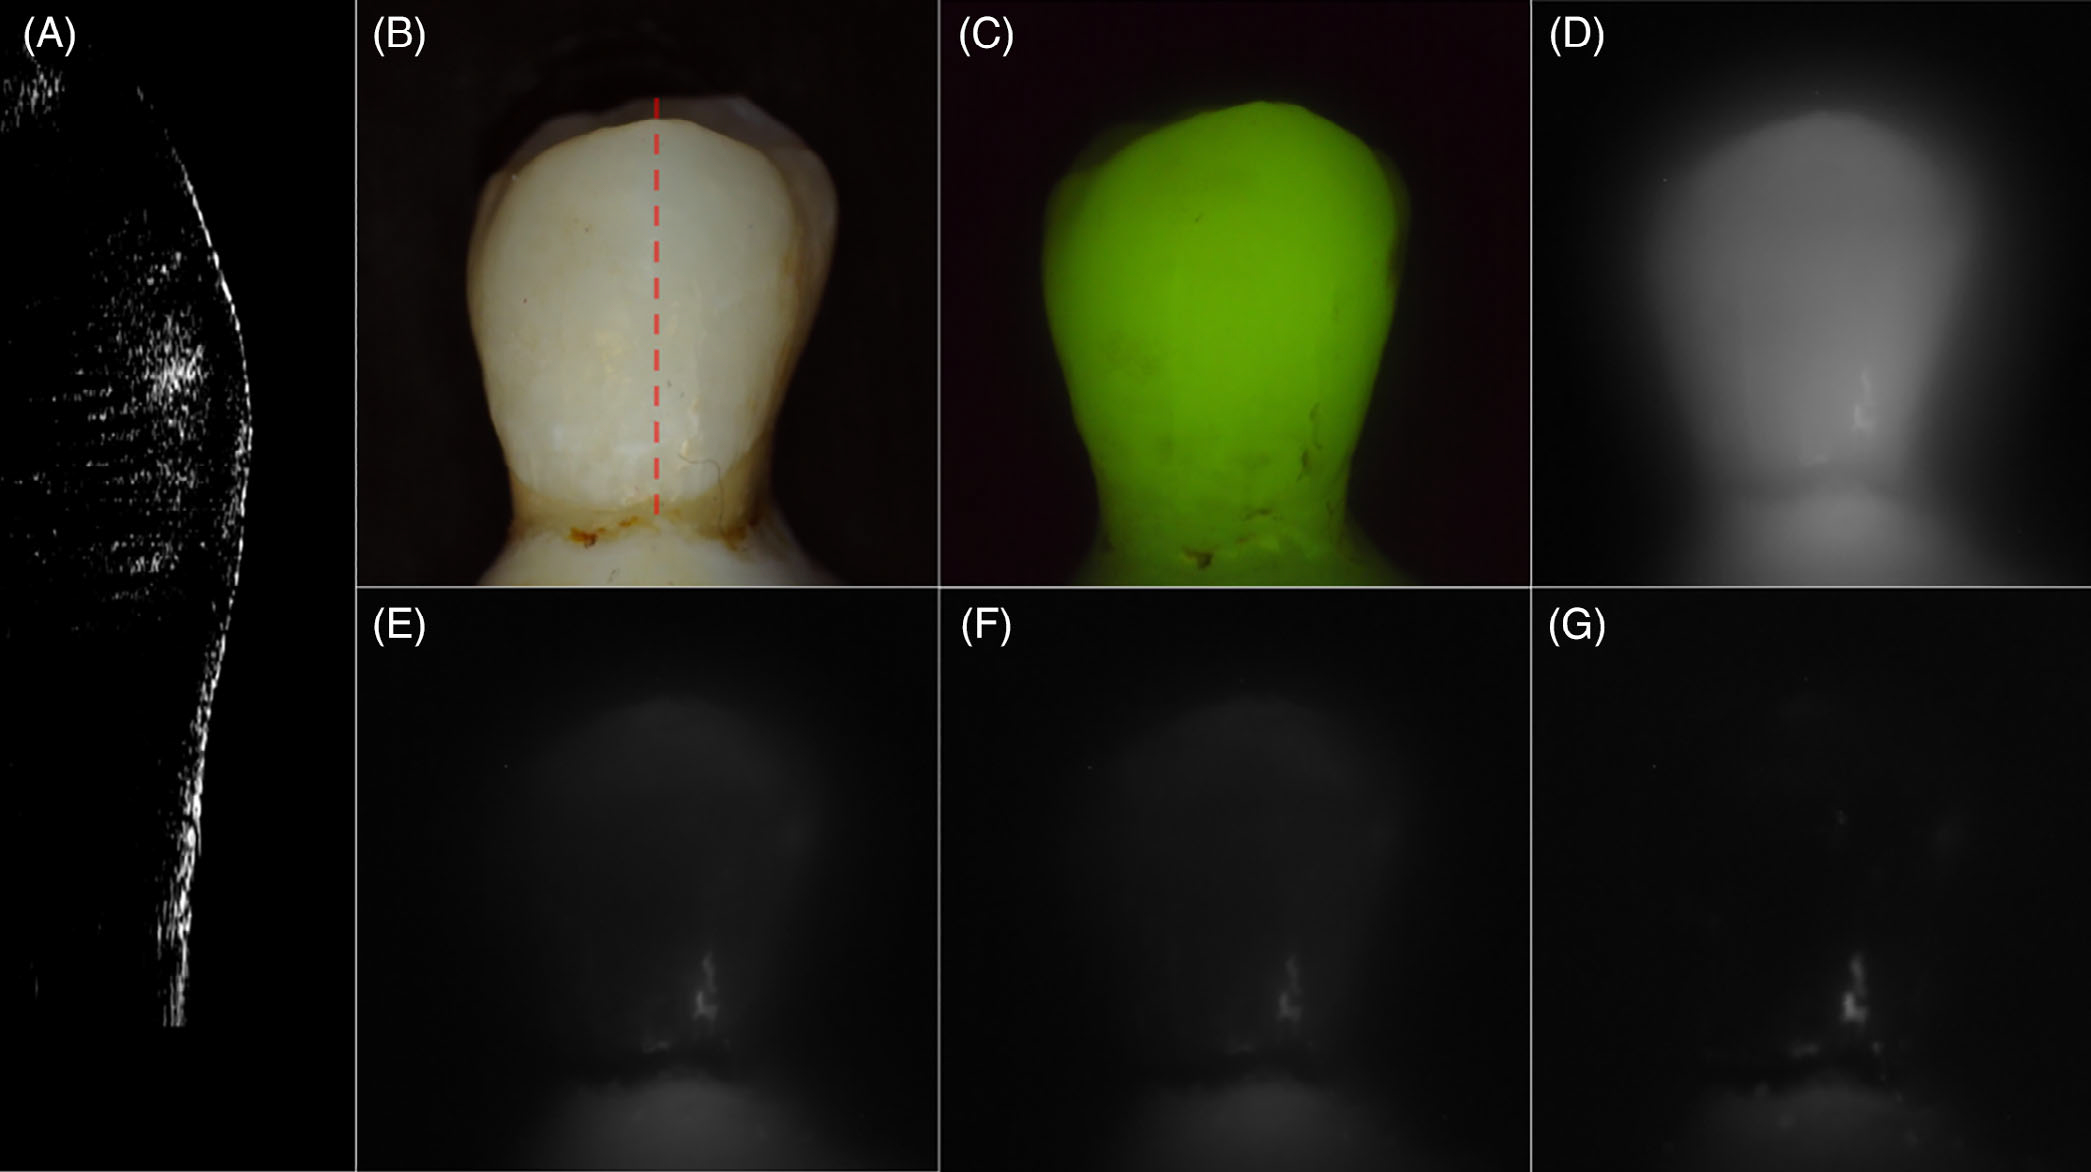
Images of a sound sample. (A) cross-polarization optical coherence tomography (CP-OCT) b-scan acquired at the position of the dashed line in the (B), (B) visible/color, (C) quantitative light-induced fluorescence (QLF) and cross-polarization short wavelength infrared (SWIR) images at (D) 1300, (E) 1460, (F) 1675 and (G) 1950 nm
FIGURE 3.
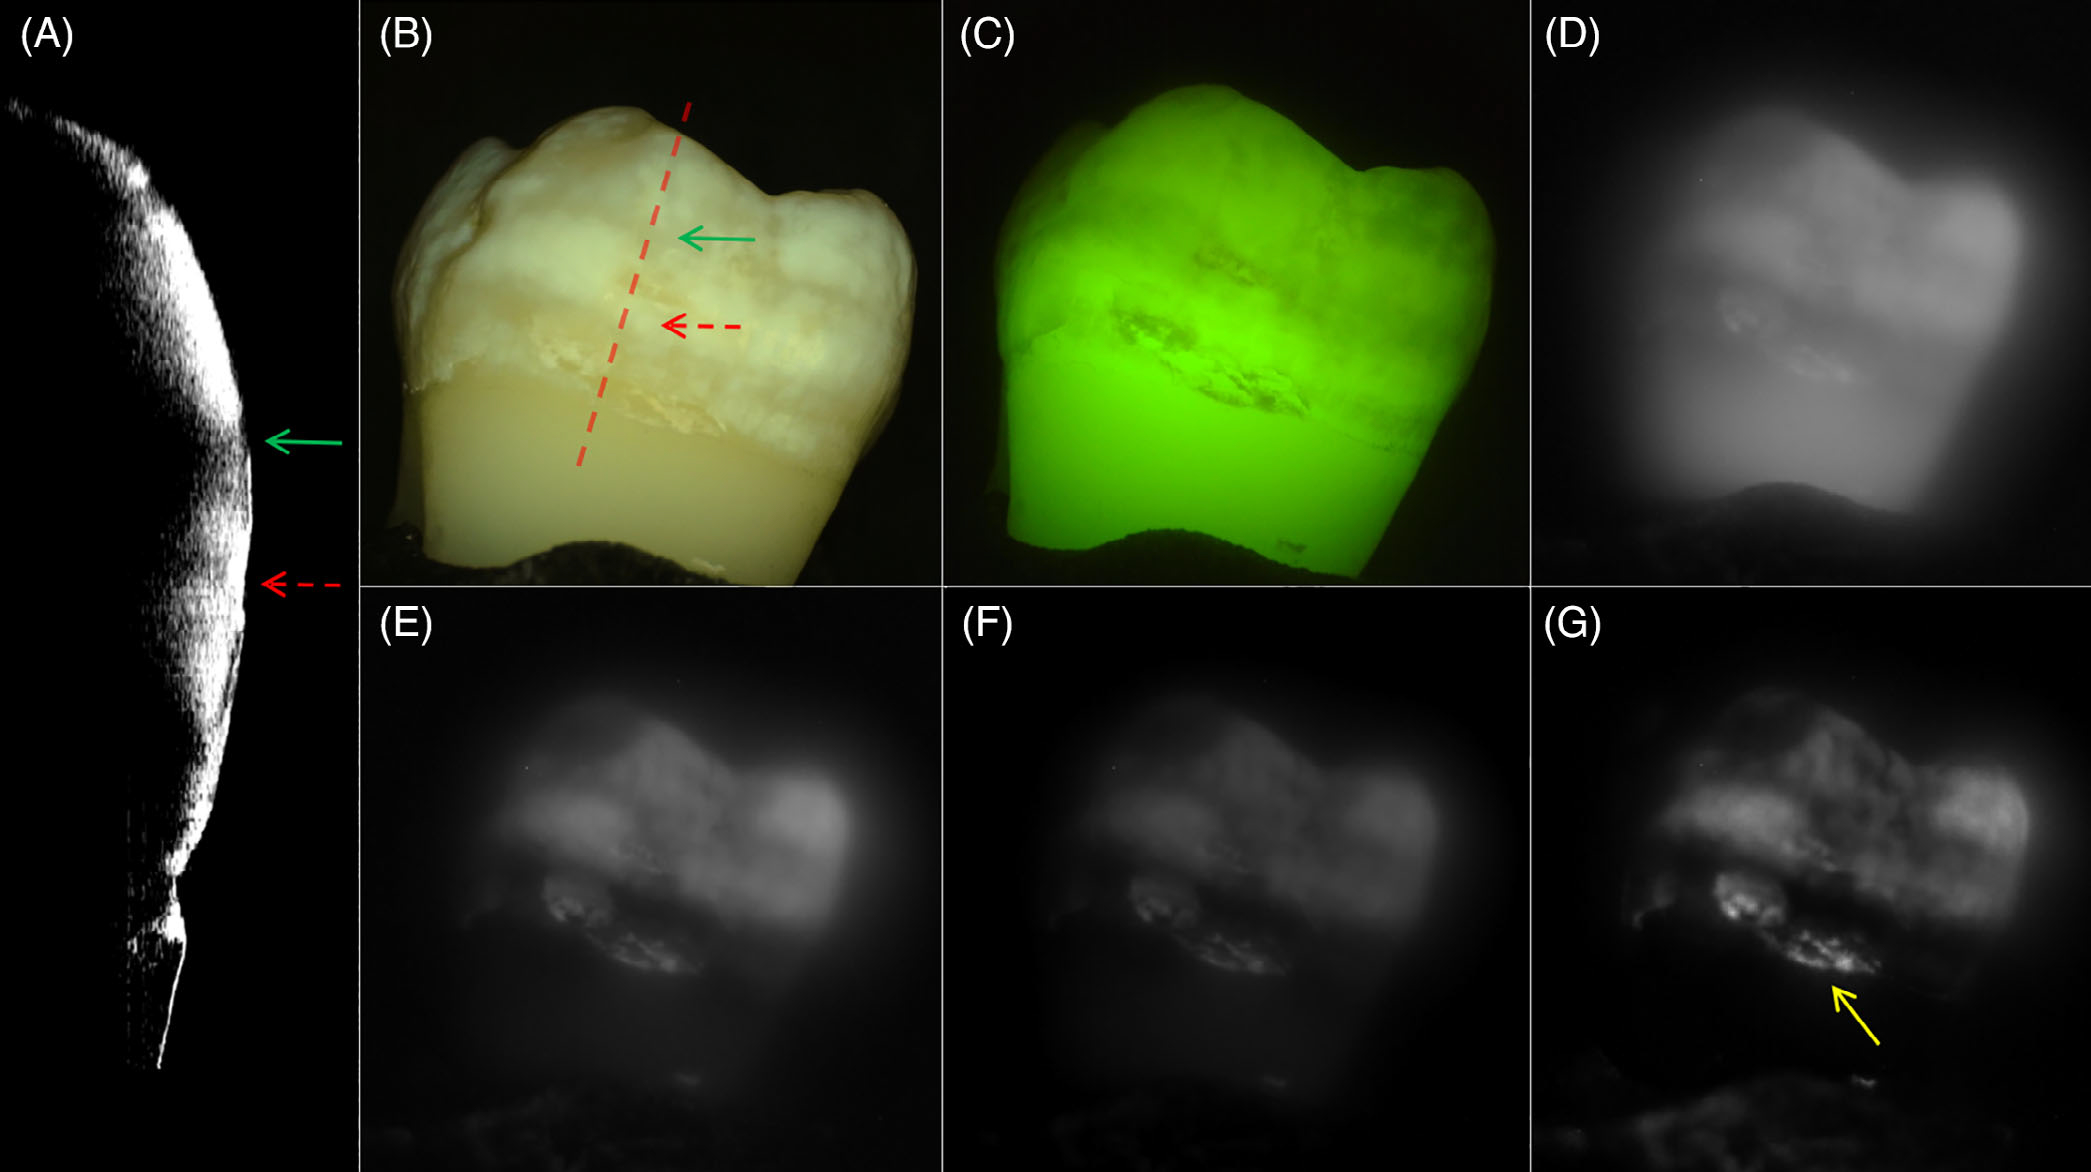
Images of a sample with moderate fluorosis. (A) cross-polarization optical coherence tomography (CP-OCT) b-scan acquired at the position of the dashed line in the (B), (B) visible/color, (C) quantitative light-induced fluorescence (QLF) and cross-polarization short wavelength infrared (SWIR) images at (D) 1300, (E) 1460, (F) 1675 and (G) 1950 nm. The depth of hypomineralization is 651 and 387 μm at the positions of the red and green arrows in the CP-OCT scan in (A). The yellow arrow in (G) is pointed towards calculus on the tooth surface
The mean ± SD of the contrast of hypomineralization is plotted for the 44 selected areas on the 20 teeth in Figure 5 at the five SWIR wavelengths and for the visible/color and QLF. The highest contrast was at 1950 nm which is the longest wavelength and also the wavelength coincident with the highest water absorption. The second highest contrast was at 1460 nm which is coincident with another water absorption band that is weaker in intensity relative to 1950 nm. The lowest contrast was measured for the visible and QLF. The mean ± SD for the contrast of hypomineralization, and the association of that contrast with the depth and integrated reflectivity of hypomineralization measured with CP-OCT is tabulated in Table 1 for the 44 locations on the 20 teeth. The mean ± SD for the depth and integrated reflectivity of hypomineralization for the 44 locations measured with CP-OCT was 217 ± 101 μm and 5100 ± 2062 μm × dB, respectively.
FIGURE 5.
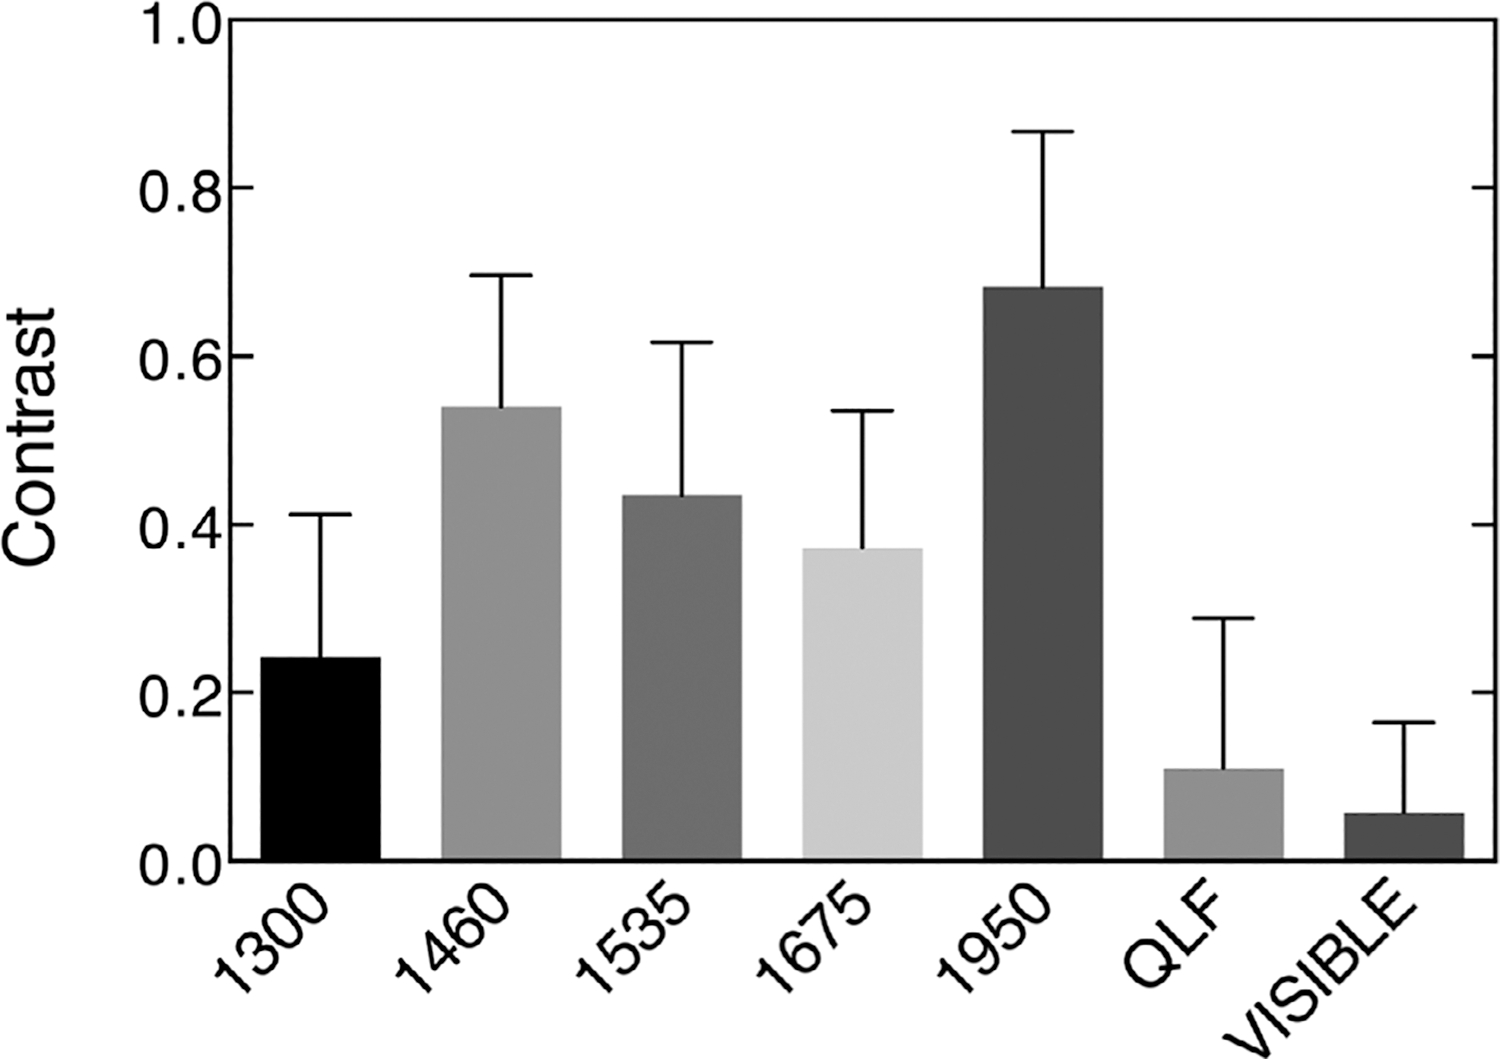
Plot of the mean ± SD for the contrast of hypomineralization at 44 locations on 20 extracted teeth with suspected fluorosis for quantitative light-induced fluorescence (QLF), visible/color and the five short wavelength infrared (SWIR) wavelengths investigated
TABLE 1.
Mean (SD) of the contrast of hypomineralization at 44 locations on 20 teeth
| Wavelength (range/bandwidth) | Mean contrast (SD) | Correlation of contrast and CP-OCT depth R2 (P-value) | Correlation of contrast and CP-OCT integrated reflectivity R2 (P-value) |
|---|---|---|---|
| Visible (390–700 nm) | 0.058 (0.11) a | 0.12 (0.019*) | 0.12 (0.021*) |
| QLF (480 nm excitation) (510–700 nm) | 0.11 (0.18) a,b | 0.029 (0.272) | 0.076 (0.071) |
| 1300 nm (90 nm) | 0.24 (0.17) b | 0.0041(0.68) | 0.0058 (0.62) |
| 1460 nm (85 nm) | 0.54 (0.16)c | 0.14 (0.013*) | 0.055 (0.12) |
| 1535 nm (80 nm) | 0.44 (0.18)d | 0.12 (0.019*) | 0.025 (0.31) |
| 1675 nm (90 nm) | 0.37 (0.16)e | 0.17(0.006*) | 0.017 (0.40) |
| 1950 nm (100 nm) | 0.68 (0.18)f | 0.31 (< 0.0001*) | 0.11 (0.028*) |
Note: The bandwidth in nanometers is specified in parentheses. Contrast values with the same letter are statistically similar (P > 0.05). The Pearson correlation (R2) between the contrast and the hypomineralization depth and the integrated reflectivity over the depth measured with cross-polarization optical coherence tomography (CP-OCT) are also listed. The P value indicates whether the data is significantly different from a line with a slope of zero and values with P < 0.05 are marked with an asterisk.
The highest correlation of the depth of hypomineralization measured with CP-OCT and the contrast was measured at 1950 nm. Plots of the contrast versus the depth of hypomineralization and the integrated reflectivity over the depth of hypomineralization are shown in Figure 6. The dotted line in Figure 6A is the best exponential fit of the contrast to the lesion depth and the dotted line in Figure 6B shows the best linear fit of the contrast to the integrated reflectivity.
FIGURE 6.
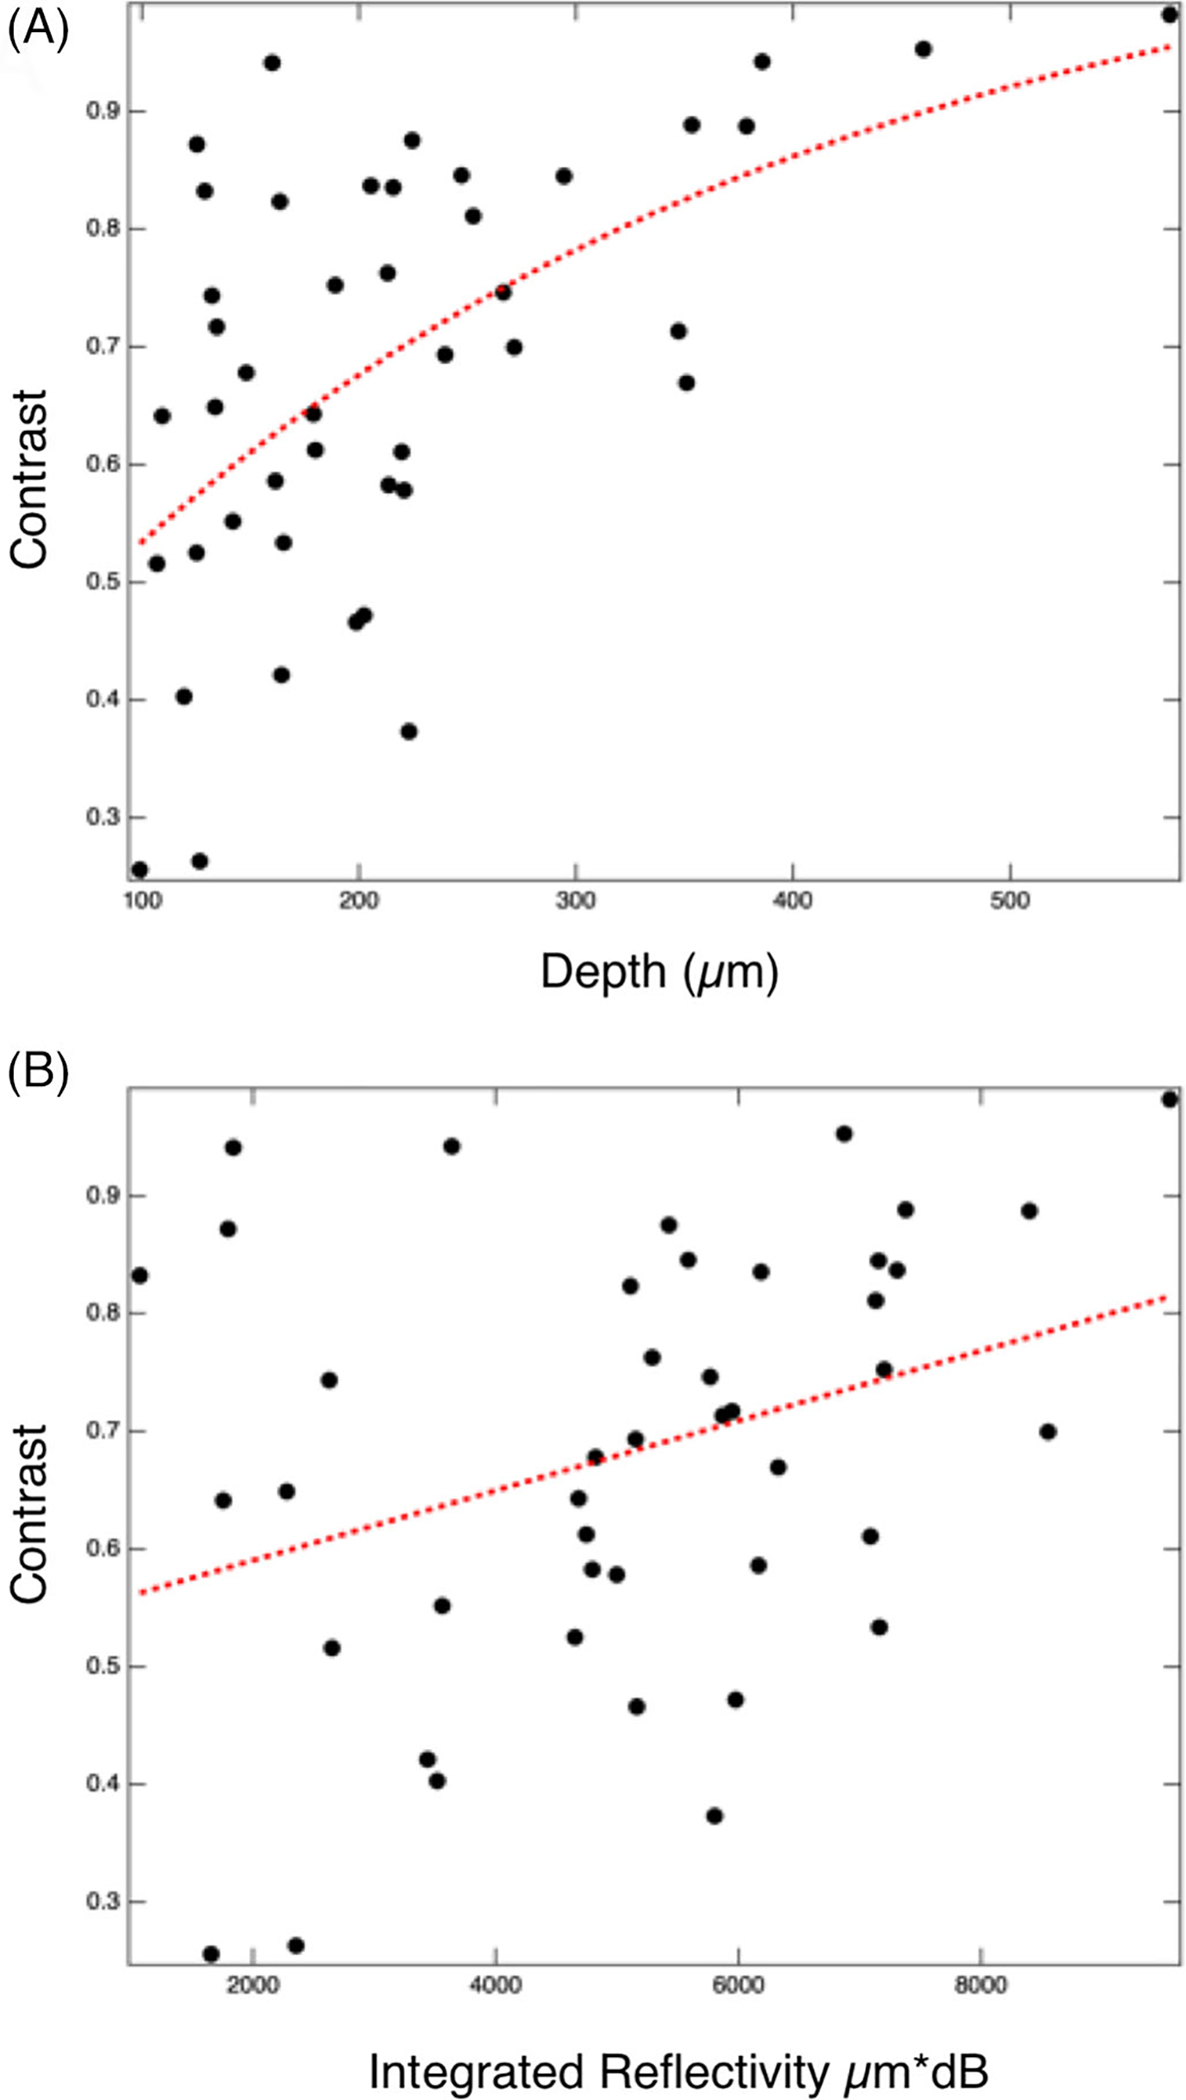
(A) Plot of the of the contrast of hypomineralization at 1950 nm for 44 locations on 20 extracted teeth against the lesion depth measured with cross-polarization optical coherence tomography (CP-OCT). The dotted line in (A) is the best exponential fit. (B) Plot of the of the contrast of hypomineralization against the lesion integrated reflectivity with depth measured with CP-OCT. The dotted line (B) is the best linear fit
Micro-CT data were available for five extracted teeth with hypomineralization and we acquired CP-OCT images that provide examples of the differences in the two technologies and their respective sensitivities to the reduced mineral density. Figure 7 shows comparisons for four of the areas on four teeth in which the CP-OCT and micro-CT images match to varying degrees. The CP-OCT b-scan and microCT cross sections shown in Figure 7A match extremely well including the thickness of the transparent/highly mineralized surfaces and the body of the lesion areas with reduced mineral content. Figure 7B shows an area in which the transparent/highly mineralized surface zone is visible in the micro-CT image, but it is not visible in the CP-OCT image even though the depth of the lesion area matches well. In Figure 7C, the thickness of the transparent/highly mineralized surface zone match well but the deeper penetration of hypomineralization is not as clear in the CP-OCT image. In the last image, Figure 7D the transparent/highly mineralized surface zone and the body of hypomineralization on the upper half of the image are clearly visible in the CP-OCT but is not visible in the micro-CT image.
FIGURE 7.
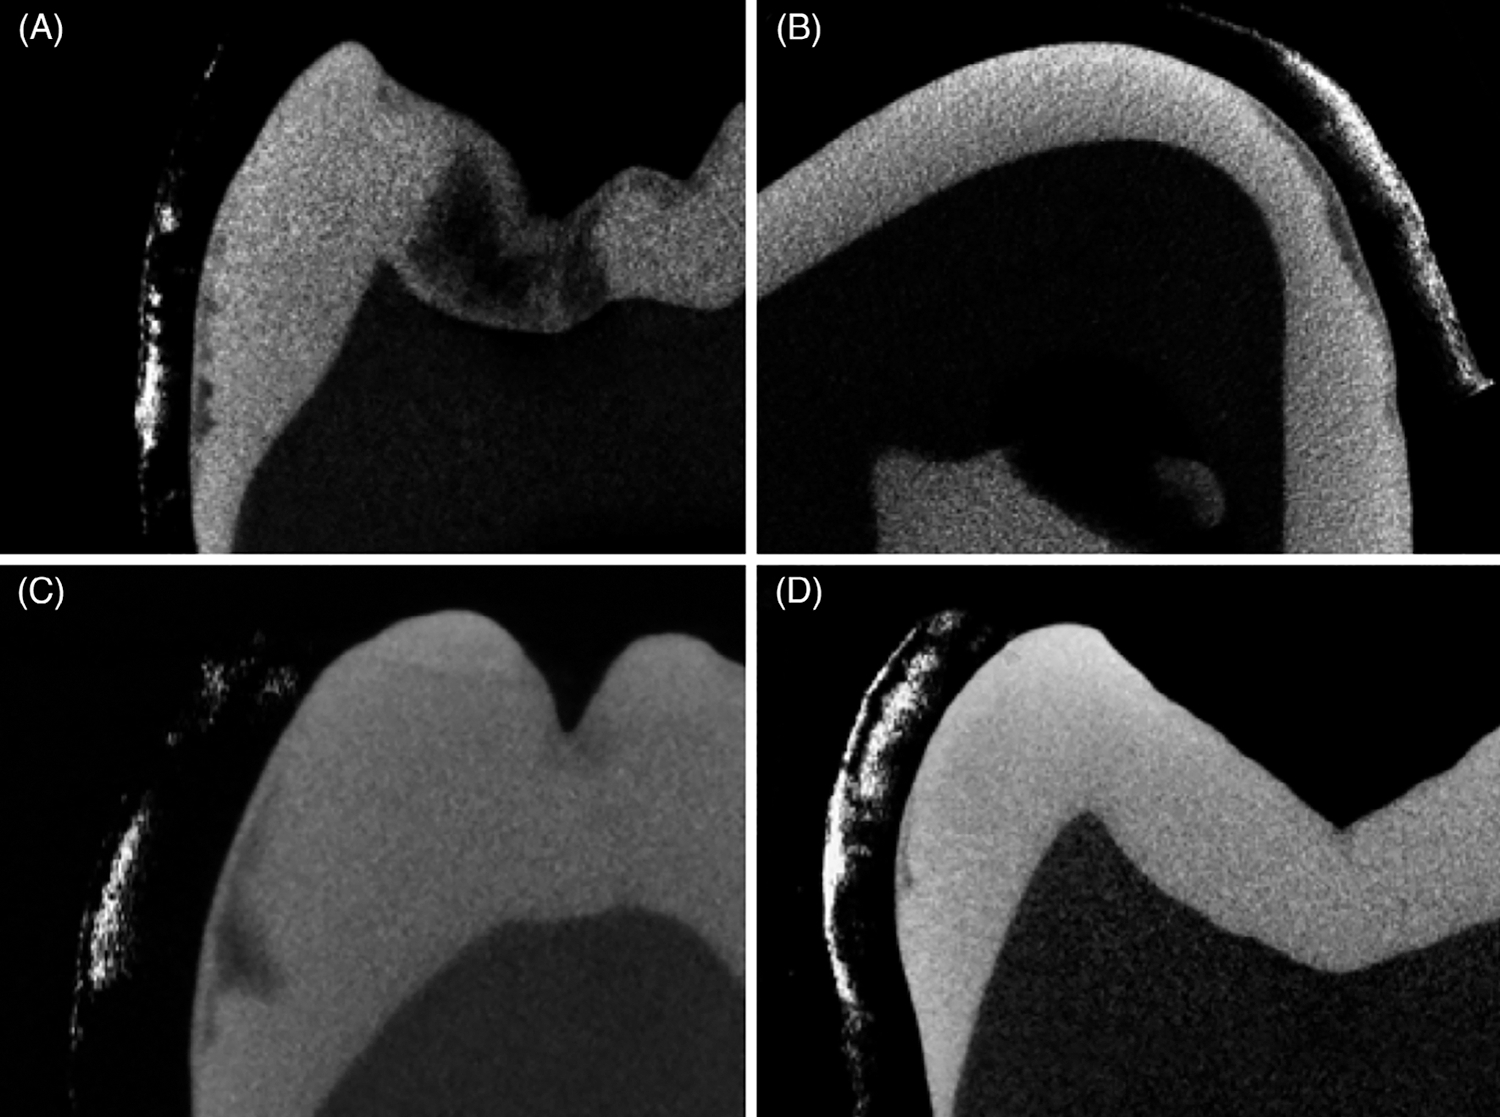
Matching cross-polarization optical coherence tomography (CP-OCT) scans and micro-CT scans of four samples of varying severity of hypomineralization. CP-OCT images are shown to the left of the micro-CT image for A, C and D and to the right for B. Whiter areas in CP-OCT represent increased light scattering/reflectivity due to hypomineralization while darker areas in the microCT images correspond to areas of reduced mineral content or lower density
4 |. DISCUSSION
This study shows that SWIR wavelengths, particularly those coincident with water absorption bands, greatly increase the contrast of hypomineralization in a similar fashion to tooth demineralization and have considerable promise for monitoring hypomineralization on tooth surfaces. SWIR images/videos of the dental arches can be quickly acquired using intraoral probes. The highest contrast was observed for 1950 nm. However, it was not much higher than at 1460 nm and both wavelengths perform well. Currently, it is easier and less expensive to use devices at 1460 nm than at 1950 nm since conventional InGaAs sensors can be used.
Currently, visible/color cross-polarized reflectance imaging and QLF are being used to monitor hypomineralization on tooth surfaces. However, low contrast and interference from stains are major disadvantages of these two methods. All tooth surfaces are subject to intrinsic and extrinsic staining and porous hypomineralized areas are more prone to stain accumulation. Multiple studies have shown the advantage of SWIR reflectance for monitoring demineralization on tooth surfaces regarding stains [21, 22].
The organic molecules that are responsible for stains on teeth at wavelengths from 400 to 1200 nm originate from food, beverages, tobacco products, blood and oral bacteria and they do not absorb light beyond 1200 nm [13, 14]. SWIR reflectance measurements are free of interference from stains beyond 1200 nm, therefore, the lesion contrast provides a more quantitative measure of hypomineralization in a similar fashion to demineralization.
SWIR reflectance imaging has also been exploited for caries detection because sound enamel is transparent in the SWIR and the scattering coefficient increases significantly with the increasing mineral loss [11, 12, 19–24]. Few studies have looked at the contrast of caries lesions at wavelengths beyond 1700 nm due to the limited sensitivity range of conventional InGaAs sensors and the limited availability of high-intensity broadband light sources in this range. Recent measurements beyond 1700 nm show that the contrast of caries lesions continues to increase [12, 21, 26] due to the decreasing scattering coefficient of sound enamel [20], increased water absorption and decreased interference from stains [22]. Reflectance measurements at wavelengths greater than 1400 nm where water absorption increases can be used to detect demineralization on tooth surfaces at earlier stages than existing methods such as QLF [12].
Another potential concern with QLF is that the fluorescence originates from collagen so that much of the fluorescence originates from the underlying dentin. Therefore, the remaining enamel thickness has a strong influence on the contrast [27–29]. This can be readily seen in the QLF images of teeth shown in Figures 2–4. The intensity of fluorescence increases from the crown of the tooth to the CEJ. The influence of the remaining enamel thickness is a potential concern for near-IR and shorter SWIR wavelengths as well. Enamel is highly transparent in the SWIR therefore light can easily penetrate deep into the tooth reaching the dentin and the underlying dentin can contribute to the overall reflectivity of the tooth. This is one reason why the entire sound tooth is more visible at 1300 nm where water absorption is minimal and the images appear blurry or out of focus compared to the longer SWIR wavelengths. Sound enamel and dentin have minimal visibility at longer wavelengths where water absorption is high, since the water absorption suppresses deeply penetrating light. The angular distribution of light scattering or the directional nature also changes markedly for demineralized enamel and likely changes in similar fashion for hypomineralization [19]. Light scattering in sound enamel and dentin is highly forward directed due to the size and shapes of the scatters in relation to the wavelength of the light [30] and the directional nature of light scattering in enamel changes markedly with demineralization and hypomineralization as the pores become the dominant contributors to scattering. There is a large rise in backscattered light due to the highly scattering pores that are formed. The magnitude and directional nature of that scattering subsequently changes when the pores are filled with mineral when remineralization occurs.
The association between the depth and integrated reflectivity of hypomineralization measured with OCT with the SWIR contrast was not as high as was expected. A high association of the contrast with the depth of hypomineralization is useful to facilitate scoring or grading the severity of hypomineralization to monitor the severity of fluorosis in communities. The longer SWIR wavelengths did perform better in this regard showing higher association with depth than other wavelengths. The correlation appeared higher for depth of hypomineralization than the integrated reflectivity of hypomineralization over the depth which was surprising. It was anticipated that there would be higher correlation for the integrated reflectivity over the depth since it accounts for variations in the severity of hypomineralization over the depth This may be due to a high level of variation in the outer thickness surface zone of the highly mineralized surface zone. In addition, the variation in the contrast with depth is expected to be nonlinear with the contrast asymptotically approaching 1 as the thickness of hypomineralization increases. The contrast with depth at 1950 nm plotted in Figure 6A is indeed nonlinear.
It was suspected that the presence of a transparent surface zone visible in the CP-OCT images in the area of hypomineralization is a definitive marker of hypomineralization [18, 31]. However, we found that some of the hypomineralized areas did not have a surface zone that was discernable in the CP-OCT images. Although studies have shown that well defined zones can be seen in TMR images, for such zones to appear transparent in CP-OCT images the hypermineralized surface zone requires a much higher mineral content approaching that of sound enamel. It is not simply sufficient to have an increased mineral content as is the case for TMR and micro-CT images. We also discovered that hypomineralized areas that were clearly visible in CP-OCT images were not visible in micro-CT images. This can be explained by the higher sensitivity of CP-OCT. CP-OCT measures increases in reflectivity due to increased light scattering due to the pores formed in areas of hypomineralization and demineralization. Light scattering increases with mineral loss of up to 20% but does not increase for higher degrees of mineral loss [19], in contrast micro-CT measures changes in mineral density over the entire range of mineral loss but is insensitive to small changes in mineral density and can miss areas of hypomineralization of only a slightly reduced mineral content. Therefore, care must be taken in interpreting both technologies. In addition, for more severe areas of demineralization, the depth of hypomineralization can be underestimated in OCT images due to strong attenuation as can be seen in the example in Figure 7C.
New clinical methods are needed for the measurement of fluorosis that are valid, reliable, and feasible for surveillance at the community level. In addition, methods are needed for the quantitative assessment of fluorosis in vivo. This SWIR imaging study exploring wavelengths beyond 1400 nm has shown that such wavelengths have great potential for monitoring hypomineralization on tooth surfaces.
ACKNOWLEDGMENT
This work was supported by NIH/NIDCR Grants R01-DE027335 and R01-DE028295.
DATA AVAILABILITY STATEMENT
There is no shared data accompanying this manuscript
REFERENCES
- [1].Fejerskov O, Kidd E, Dental Caries: The Disease and its Clinical Management, Oxford: Blackwell, 2003. [Google Scholar]
- [2].McDonagh MS, Whiting PF, Wilson PM, Sutton AJ, Chestnutt I, Cooper J, Misso K, Bradley M, Treasure E, Kleijnen J, BMJ. 2010, 321, 855. [DOI] [PMC free article] [PubMed] [Google Scholar]
- [3].Beltran-Aguilar ED, Barker LK, Canto MT, Dye BA, Gooch BF, Griffin SO, Hyman J, Jaramillo F, Kingman A, Nowjack-Raymer R, Selwitz RH, Wu T, MMWR Surveill Summ. 2005, 54, 1. [PubMed] [Google Scholar]
- [4].Beltran-Aguilar ED, Barker L, Dye BA, NCHS Data Brief 2010, 1. [PubMed] [Google Scholar]
- [5].Beltran-Aguilar ED, Griffin SO, Lockwood SA, J Am Dent Assoc. 2002, 133, 157. [DOI] [PubMed] [Google Scholar]
- [6].Angmar-Mansson B, de Josselin de Jong E, Sundstrom F, ten Bosch JJ, Adv Dent Res. 1994, 8, 75. [DOI] [PubMed] [Google Scholar]
- [7].Li SM, Zou J, Wang Z, Wright JT, Zhang Y, Pediatr Dent. 2003, 25, 485. [PubMed] [Google Scholar]
- [8].McGrady MG, Ellwood RP, Taylor A, Maguire A, Goodwin M, Boothman N, Pretty IA, BMC Oral Health 2012, 12, 47. [DOI] [PMC free article] [PubMed] [Google Scholar]
- [9].Pretty IA, McGrady M, Zakian C, Ellwood RP, Taylor A, Sharif MO, Iafolla T, Martinez-Mier EA, Srisilapanan P, Korwanich N, Goodwin M, Dye BA, BMC Public Health 2012, 12, 366. [DOI] [PMC free article] [PubMed] [Google Scholar]
- [10].NHANES in CDC Oral Health Examiners Manual, 2016.
- [11].Simon JC, Lucas SA, Lee RC, Staninec M, Tom H, Chan KH, Darling CL, Fried D, Lasers Surg Med. 2016, 48, 828. [DOI] [PMC free article] [PubMed] [Google Scholar]
- [12].Fried WA, Darling CL, Chan K, Fried D, Lasers Surg Med. 2013, 45, 533. [DOI] [PMC free article] [PubMed] [Google Scholar]
- [13].Kleter GA, Arch Oral Bio. 1998, 43, 629. [DOI] [PubMed] [Google Scholar]
- [14].Sarna T, Sealy RC, Photochem Photobiol. 1984, 39, 69. [DOI] [PubMed] [Google Scholar]
- [15].Bouma BE, Tearney GJ, Handbook of Optical Coherence Tomography, New York: Marcel Dekker, 2002. [Google Scholar]
- [16].Culjat M, Singh RS, Yoon DC, Brown ER, IEEE Trans Med Imaging 2003, 22, 526. [DOI] [PubMed] [Google Scholar]
- [17].Fontana M, Li Y, Dunipace AJ, Noblitt TW, Fischer G, Katz BP, Stookey GK, Caries Res. 1996, 30, 317. [DOI] [PubMed] [Google Scholar]
- [18].Hirasuna K, Fried D, Darling CL, J Biomed Opt. 2008, 13, 44011. [DOI] [PubMed] [Google Scholar]
- [19].Darling CL, Huynh GD, Fried D, J. Biomed. Opt. 2006, 11, 034023. [DOI] [PubMed] [Google Scholar]
- [20].Chan KH, Fried D, J. Biomed. Opt. 2018, 23, 060501. [DOI] [PMC free article] [PubMed] [Google Scholar]
- [21].Chung S, Fried D, Staninec M, Darling CL, Biomed Opt Express. 2011, 2, 2804. [DOI] [PMC free article] [PubMed] [Google Scholar]
- [22].Ng C, Almaz EC, Simon JC, Fried D, Darling CL, J. Biomed. Opt. 2019, 24, 036002. [DOI] [PMC free article] [PubMed] [Google Scholar]
- [23].Simon JC, Chan KH, Darling CL, Fried D, Lasers Surg Med. 2014, 46, 203. [DOI] [PMC free article] [PubMed] [Google Scholar]
- [24].Wu J, Fried D, Lasers Surg Med. 2009, 41, 208. [DOI] [PMC free article] [PubMed] [Google Scholar]
- [25].Zakian C, Pretty I, Ellwood R J Biomed Opt. 2009, 14, 064047–1–064047–7. [DOI] [PubMed] [Google Scholar]
- [26].Fried WA, Abdelaziz M, L Darling C, Fried D, Lasers Surg Med, 2021, 10.1002/lsm.23371 [DOI] [PMC free article] [PubMed] [Google Scholar]
- [27].Oguro R, Nakajima M, Seki N, Sadr A, Tagami J, Sumi Y, J Dent. 2016, 51, 36. [DOI] [PubMed] [Google Scholar]
- [28].Ando M, Schemehorn BR, Eckert GJ, Zero DT, Stookey GK, Caries Res. 2003, 37, 24. [DOI] [PubMed] [Google Scholar]
- [29].Ando M, Eckert GJ, Stookey GK, Zero DT, Caries Res. 2004, 38, 39. [DOI] [PubMed] [Google Scholar]
- [30].Fried D, Glena RE, Featherstone JD, Seka W, Applied Opt. 1995, 34, 1278. [DOI] [PubMed] [Google Scholar]
- [31].Lee RC, Jang AT, Fried D, Proc. SPIE 2017, 10044, 08:01–04. [DOI] [PMC free article] [PubMed] [Google Scholar]
Associated Data
This section collects any data citations, data availability statements, or supplementary materials included in this article.
Data Availability Statement
There is no shared data accompanying this manuscript


