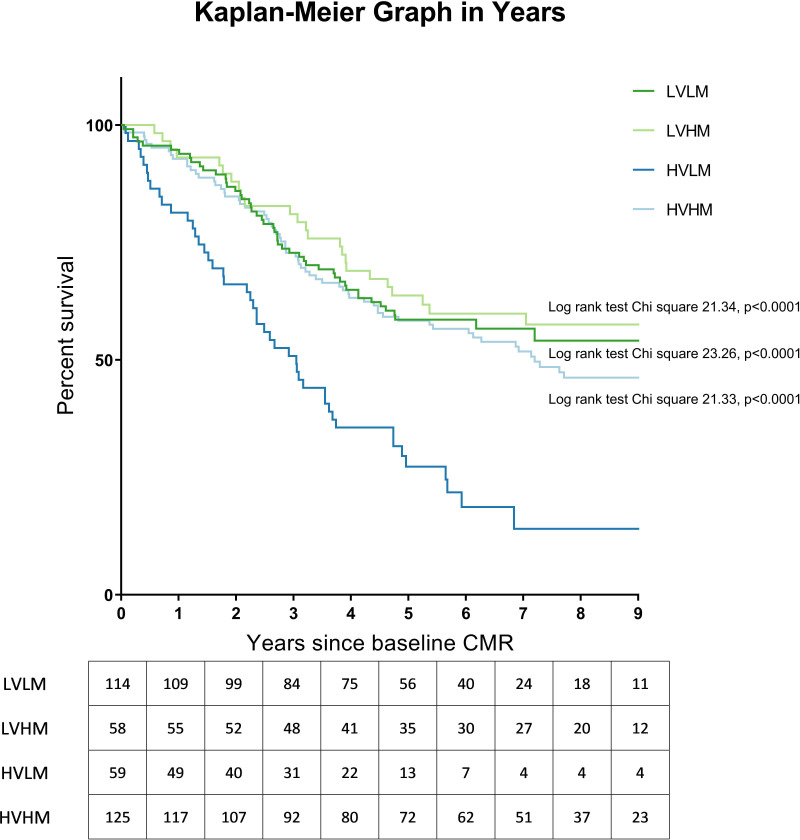
Figure 4.
Kaplan-Meier graph illustrating survival of the subgroup of incident patients at baseline assessment, excluding patients with congenital heart disease. Log-rank test results comparing each group with HVLM are shown, with p value corrected for false discovery rate. CMR, cardiac magnetic resonance; HVHM, high-volume-high-mass; HVLM, high-volume-low-mass; LVHM, low-volume-high-mass; LVLM, low-volume-low-mass.

