ABSTRACT
Meropenem is a broad spectrum carbapenem used for the treatment of cerebral infections. There is a need for data describing meropenem pharmacokinetics (PK) in the brain tissue to optimize therapy in these infections. Here, we present a meropenem PK model in the central nervous system and simulate dosing regimens. This was a population PK analysis of a previously published prospective study of patients admitted to the neurointesive care unit between 2016 and 2019 who received 2 g of meropenem intravenously every 8 h. Meropenem concentration was determined in blood, cerebrospinal fluid (CSF), and brain microdialysate. Meropenem was described by a six-compartment model: two compartments in the blood, two in the CSF, and two in the brain tissue. Creatinine clearance and brain glucose were included as covariates. The median elimination rate constant was 1.26 h−1, the central plasma volume was 5.38 L, and the transfer rate constants from the blood to the CSF and from the blood to the brain were 0.001 h−1 and 0.02 h−1, respectively. In the first 24 h, meropenem 2 g, administered every 8 h via intermittent and extended infusions achieved good target attainment in the CSF and brain, but continuous infusion (CI) was better at steady-state. Administering a 3 g loading dose (LD) followed by 8 g CI was beneficial for early target attainment. In conclusion, a meropenem PK model was developed using blood, CSF, and brain microdialysate samples. An 8 g CI may be needed for good target attainment in the CSF and brain. Giving a LD prior to the CI improved the probability of early target attainment.
KEYWORDS: Monte Carlo simulation, central nervous system infections, meropenem, pharmacodynamics, pharmacokinetics
INTRODUCTION
Hospital-acquired central nervous system (CNS) infections, such as meningitis, ventriculitis, and brain abscesses, are among the most serious, life-threatening nosocomial infections associated with a high degree of morbidity and mortality (1). While skin-derived Gram-positive bacteria account for up to 60% of these infections, there has been a shift toward an increasing prevalence of Gram-negative pathogens, including Pseudomonas spp., Escherichia coli, Klebsiella spp., and Acinetobacter baumannii (2, 3). Current challenges in the management of nosocomial CNS infections include the identification of an antimicrobial with activity against the suspected organism that also possesses the ideal pharmacokinetic/pharmacodynamic (PK/PD) characteristics to allow for rapid distribution across the blood brain barrier (BBB) and across the blood-cerebral spinal fluid (CSF) barrier to achieve therapeutic concentrations in the CSF and/or brain parenchyma and elicit its potent bactericidal effects.
Meropenem, in combination with vancomycin, is recommended for the empirical treatment of nosocomial CNS infections (4). Despite its favorable PK profile, recent data suggest variable penetration of meropenem into the CSF in the management of ventriculitis. In a group of neurosurgical patients treated with meropenem for ventriculitis, meropenem intermittent infusions dosed as 2 g IV every 8 h demonstrated poor CSF penetration, achieving a CSF/serum ratio of only 9% (5). In a retrospective analysis of 11 neurosurgical patients with ventriculitis that received therapeutic drug monitoring of serum and CSF concentrations to guide dose adjustments, a median meropenem dose of 8.8 g administered as a continuous infusion (CI) over 24 h was required to achieve a CSF concentration >1 mg/L in all but one patient (6). A prospective study investigating the blood versus CSF meropenem concentration in postneurosurgical meningitis patients found that more frequent and higher dosing of meropenem provided better penetration into the CSF versus lower doses at shorter intervals (7). The altered PK and the high incidence of augmented renal clearance (ARC) in neurologically injured patients present unique challenges and place this population at high risk for suboptimal drug exposure (8).
While the amount of data regarding drug concentration in the CSF is increasing, information regarding concentrations of meropenem within the brain tissue is limited. Drug concentration within the CSF may not reflect actual drug delivery into the brain tissue, raising a concern of whether standard dosing of meropenem is sufficient to treat CNS infections. Brain microdialysis is a technique that involves the insertion of a probe directly into the brain tissue to measure free drug concentration in the cerebral interstitial fluid (9). The purpose of this study was to describe the PK of meropenem in the CNS, using population PK and previously published raw plasma, CSF, and brain tissue concentrations obtained through cerebral microdialysis (CMD) (10).
RESULTS
Twelve patients met inclusion for enrollment in the study (Table 1). Eighty percent were females. The mean (SD) age was 57 years (9), weight 73 kg (14), and creatinine clearance (CrCl) 126 mL/min (38). The number of plasma, CSF, and brain microdialysate samples collected were 84, 51, and 66, respectively.
TABLE 1.
Patients’ demographicsa
| Characteristic | Mean (SD) or n (%) |
|---|---|
| Age, yrs | 57 (9) |
| Male | 2 (17) |
| wt, kg | 73 (14) |
| BMI, kg/m2 | 26 (4) |
| CrCl, mL/min | 126 (36) |
| CRP, mg/dL | 14 (8) |
| CSF glucose, mg/dL | 73 (21) |
| CSF lactate, mmol/L | 3.5 (1.2) |
| Brain glucose, mmol/L | 1.2 (0.5) |
| Brain lactate, mmol/L | 5.1 (3.2) |
BMI, body mass index; CrCl, creatinine clearance; CRP, C-reactive protein; CSF, cerebrospinal fluid.
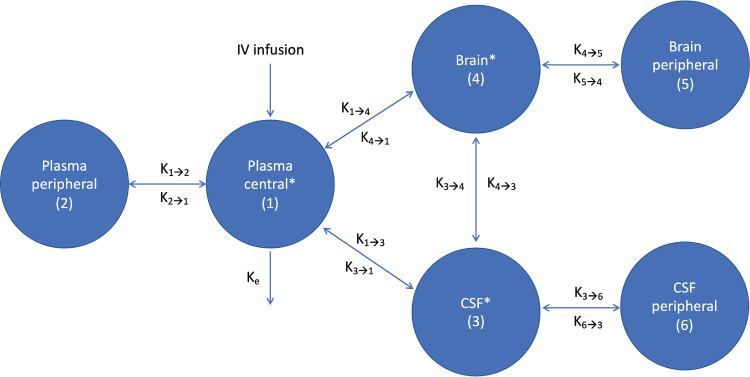
Meropenem was well-described by a six-compartment model: a central and a peripheral plasma compartment in addition to two CSF compartments and two brain compartments (Fig. 1). The normalized CrCl was added as a covariate on the rate of elimination (ke).
FIG 1.
Meropenem PK compartments. *, Compartments with measured meropenem concentration. CSF, cerebrospinal fluid; ke, rate of elimination; kx→y, rate of transfer from compartment x to y.
Also, the glucose concentration in the brain (glubrain) was centered to the median value (1 mmol/L) on the brain volume of distribution (Vbrain).
Table 2 summarizes the PK parameter estimates. Fig. 2 shows the observed versus population and individual predicted meropenem concentrations in the plasma, CSF, and brain microdialysate samples. Fig. 3 shows the visual predictive checks.
TABLE 2.
Summary of the meropenem population pharmacokinetic parameter estimatesa
| Parameters | Median | 95% credibility interval | Mean | SD | Shrinkage (%) |
|---|---|---|---|---|---|
| ke, hr−1 | 1.26 | 1.07, 1.56 | 1.33 | 0.36 | 0.001 |
| Vplasma, L | 5.38 | 3.98, 7.42 | 6.14 | 2.87 | 0.003 |
| VCSF, L | 0.55 | 0.08, 0.98 | 0.55 | 0.42 | 0.001 |
| Vbrain, L | 0.28 | 0.11, 0.71 | 0.57 | 0.70 | 0.000 |
| k12, hr−1 | 2.56 | 0.95, 3.81 | 2.43 | 1.56 | 0.000 |
| k21, hr−1 | 1.39 | 1.11, 1.86 | 1.44 | 0.46 | 0.009 |
| k13, hr−1 | 0.001 | 4 × 10⁻⁴, 0.01 | 0.003 | 0.004 | 0.007 |
| k31, hr−1 | 0.03 | 4 × 10⁻⁴, 0.08 | 0.04 | 0.03 | 0.001 |
| k14, hr−1 | 0.02 | 0.01, 0.03 | 0.02 | 0.01 | 0.004 |
| k41, hr−1 | 0.52 | 0.34, 1.20 | 0.75 | 0.55 | 0.001 |
| k34, hr−1 | 0.67 | 0.31, 0.81 | 0.57 | 0.31 | 0.001 |
| k43, hr−1 | 0.04 | 0, 0.11 | 0.08 | 0.13 | 0.000 |
CSF, cerebrospinal fluid; ke, elimination rate constant; kxy, rate of transfer from the compartment x to y, where compartment 1 is the plasma central, 2 is the plasma peripheral, 3 is the CSF, and 4 is the brain compartment; V, central volume of distribution.
FIG 2.
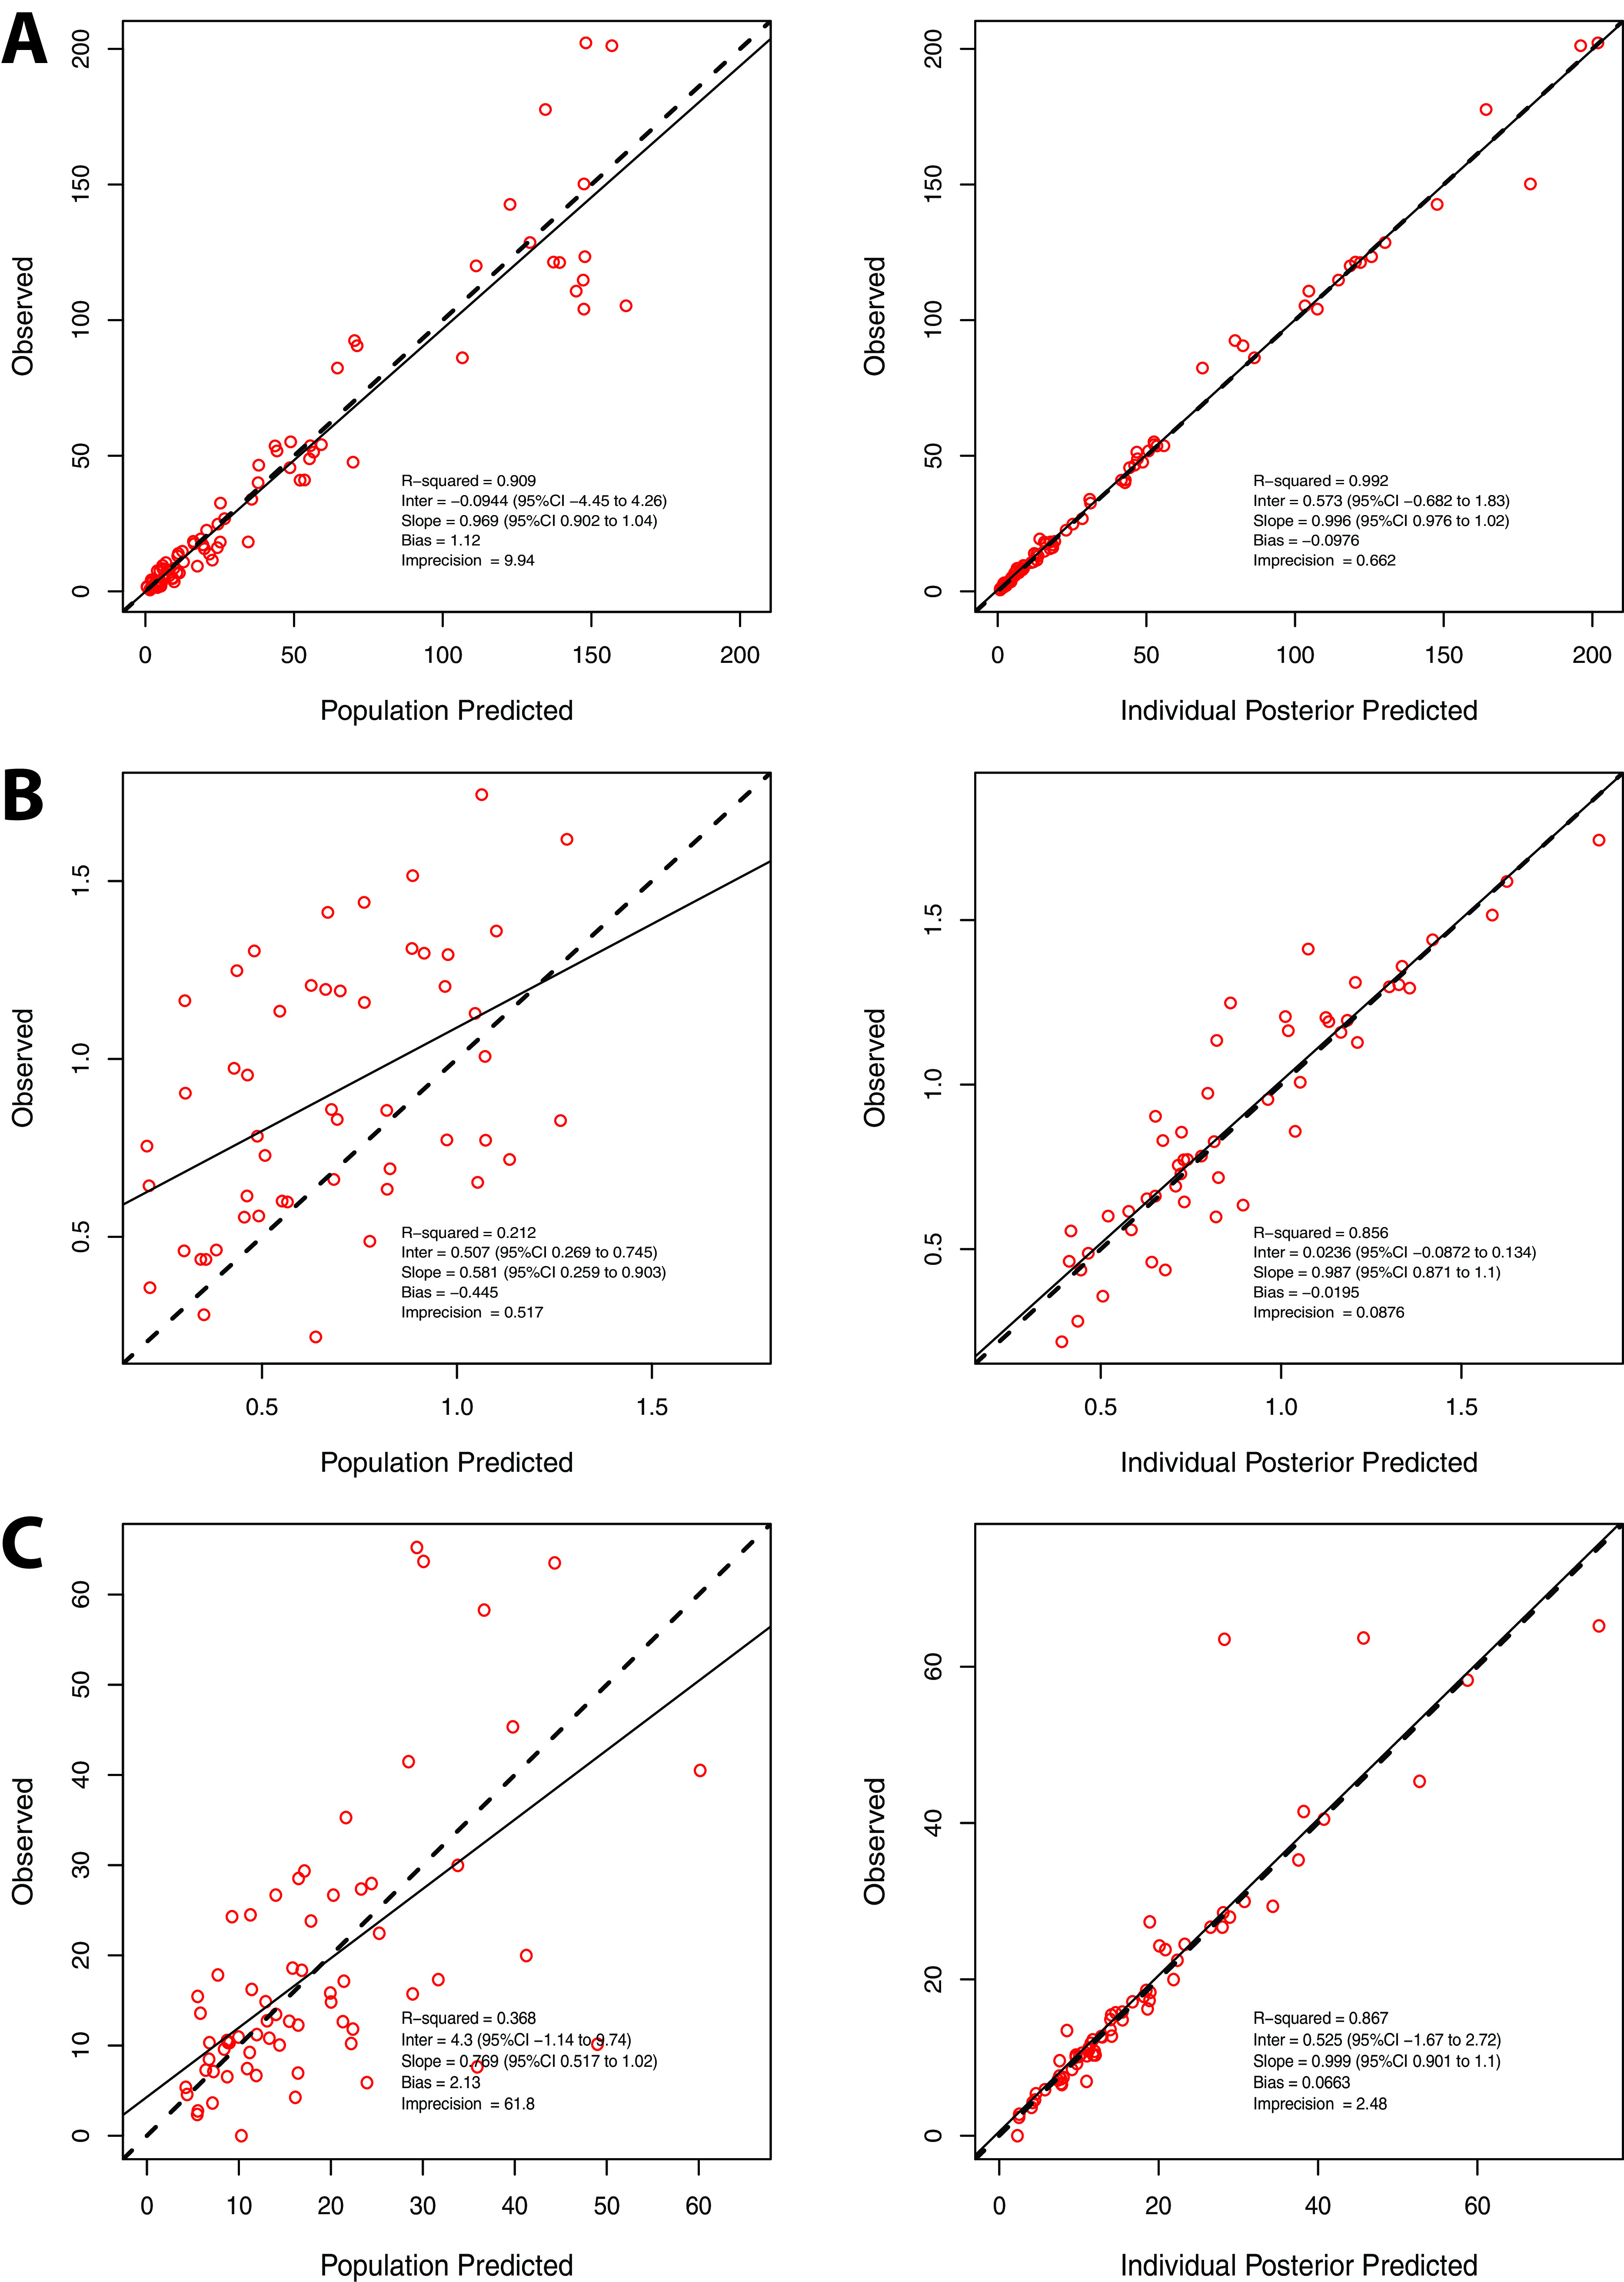
Observed versus population and individual predicted concentration for the meropenem pharmacokinetic model in (A) plasma, (B) CSF, and (C) brain.
FIG 3.
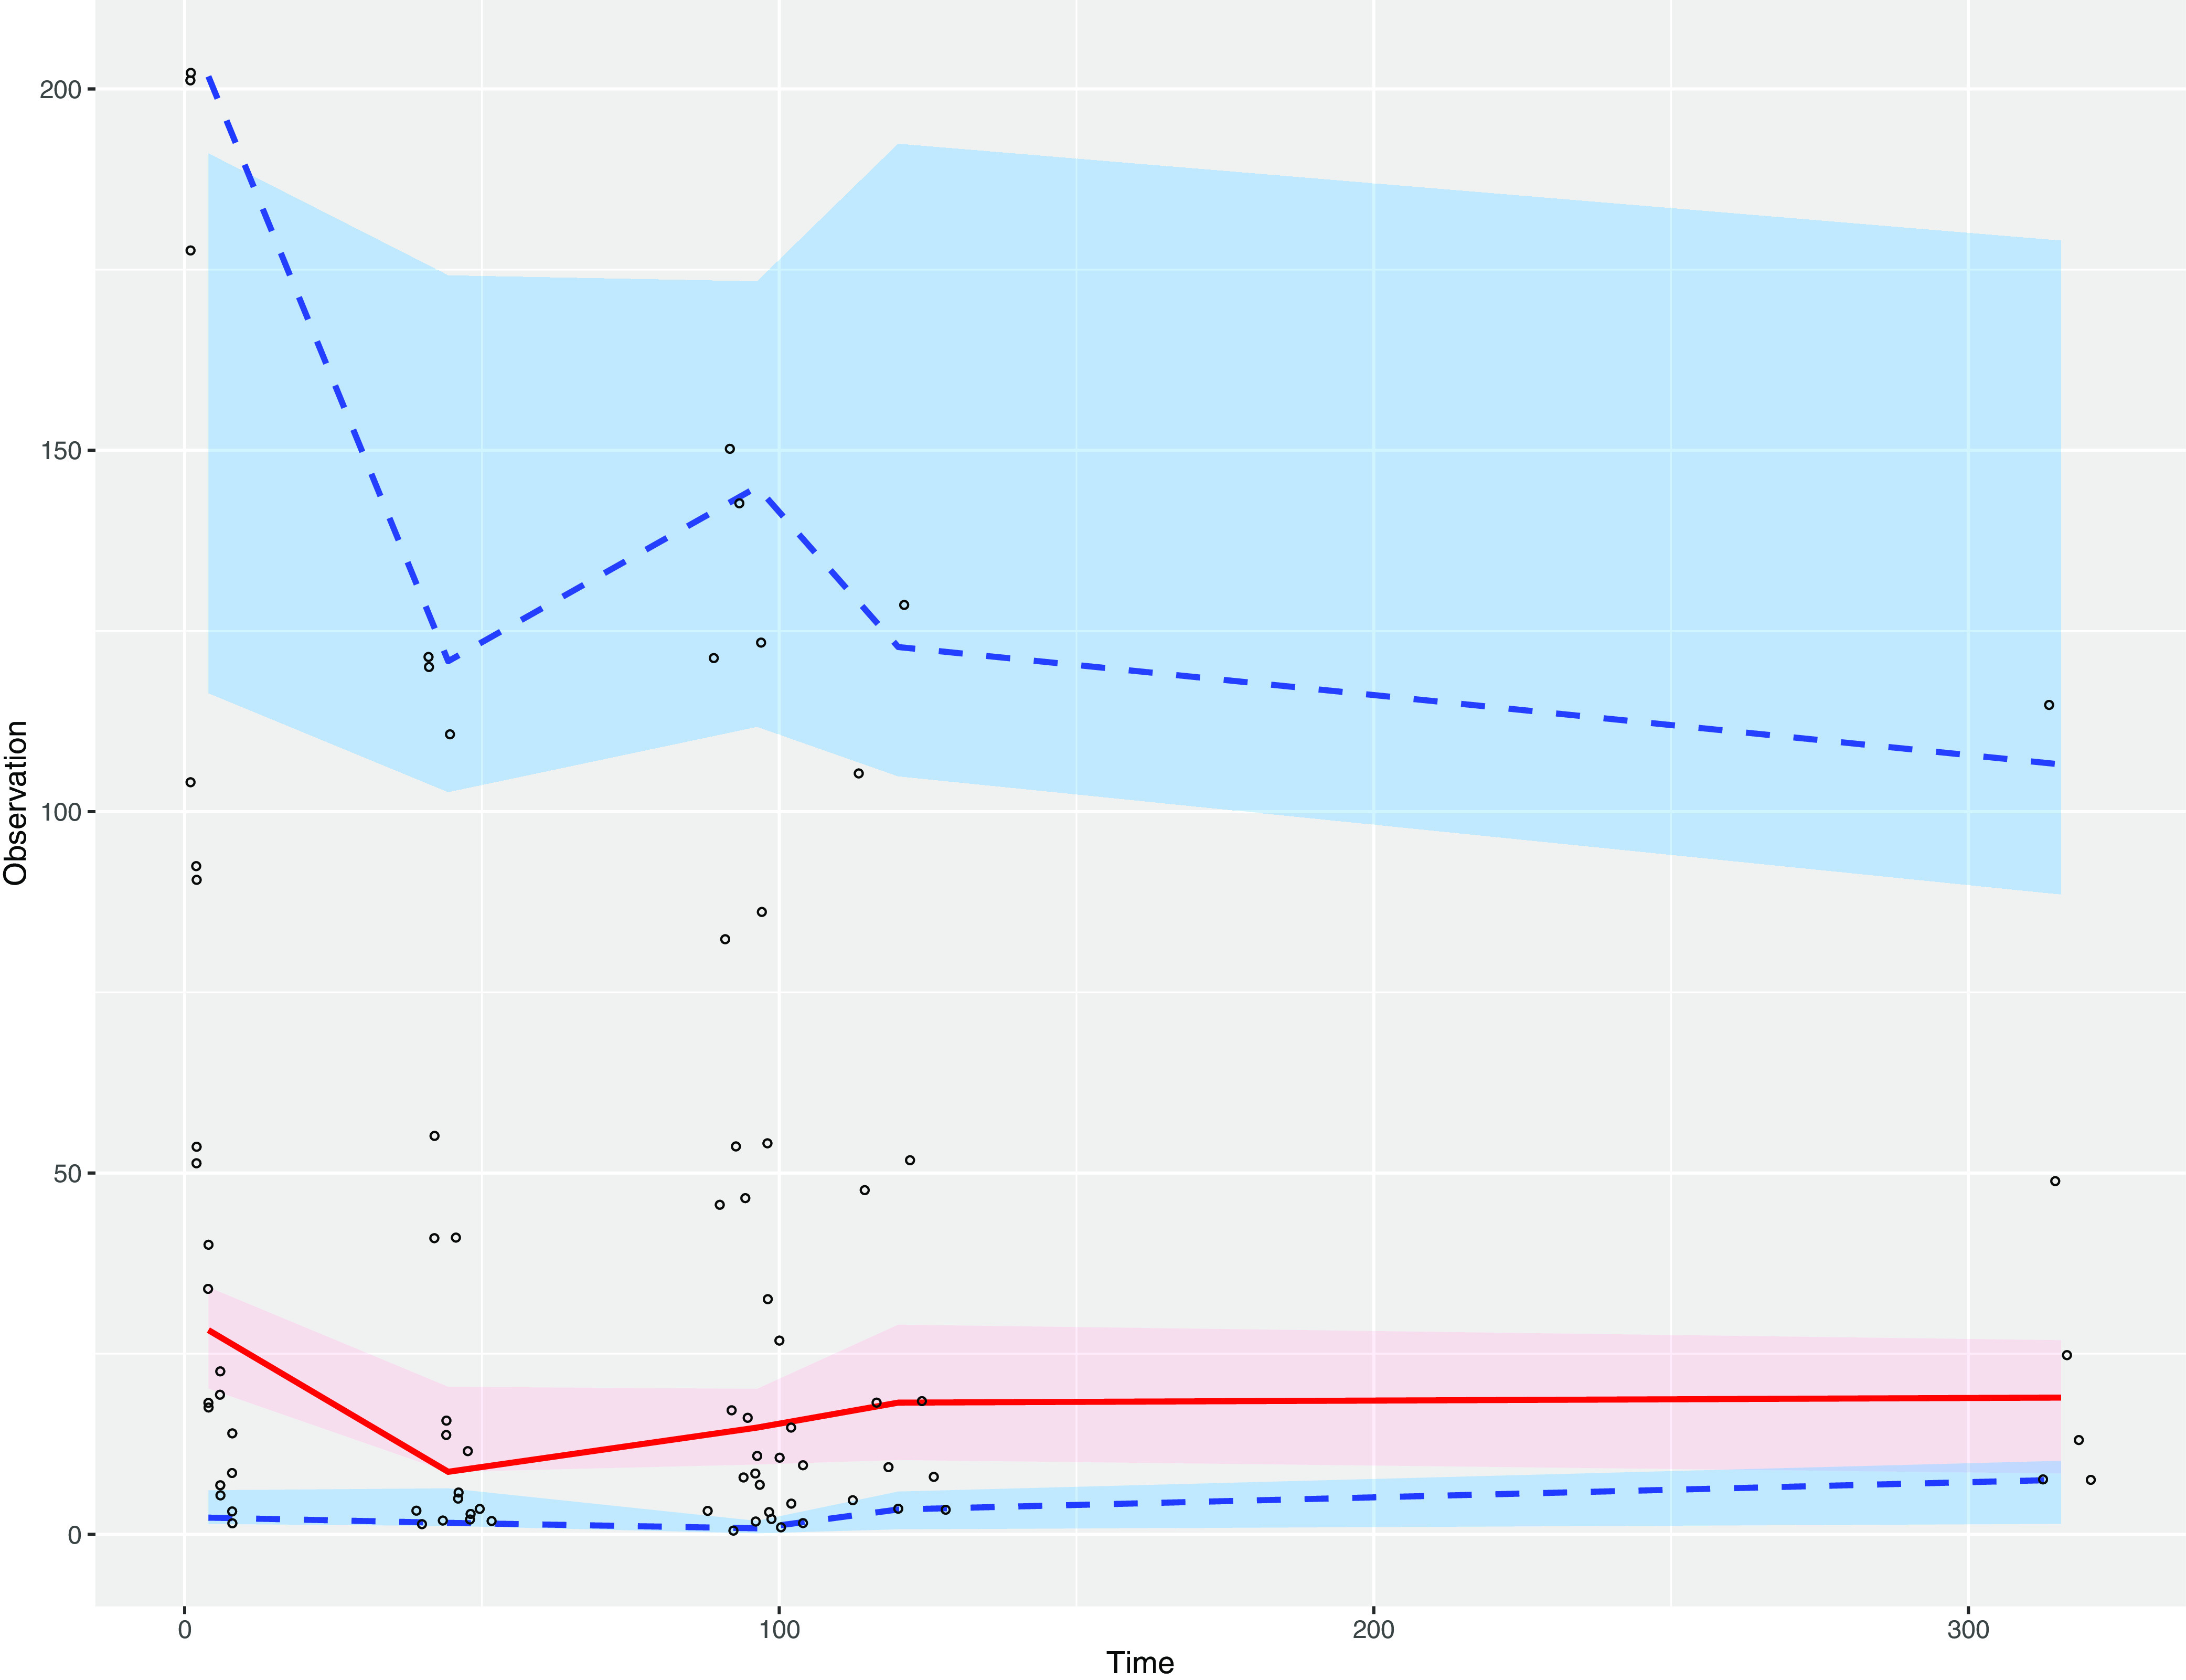
Plasma visual predictive checks. The 95% confidence intervals of the 2.5th, 50th, and 97.5th percentiles are shown. Circles are observed concentrations, and shaded areas are simulated data.
Probability of target attainment.
Fig. 4 shows the simulated meropenem regimens and the associated probability of target attainment (PTA) in the plasma, CSF, and brain tissue in the first 24 h and after 72 h of therapy.
FIG 4.
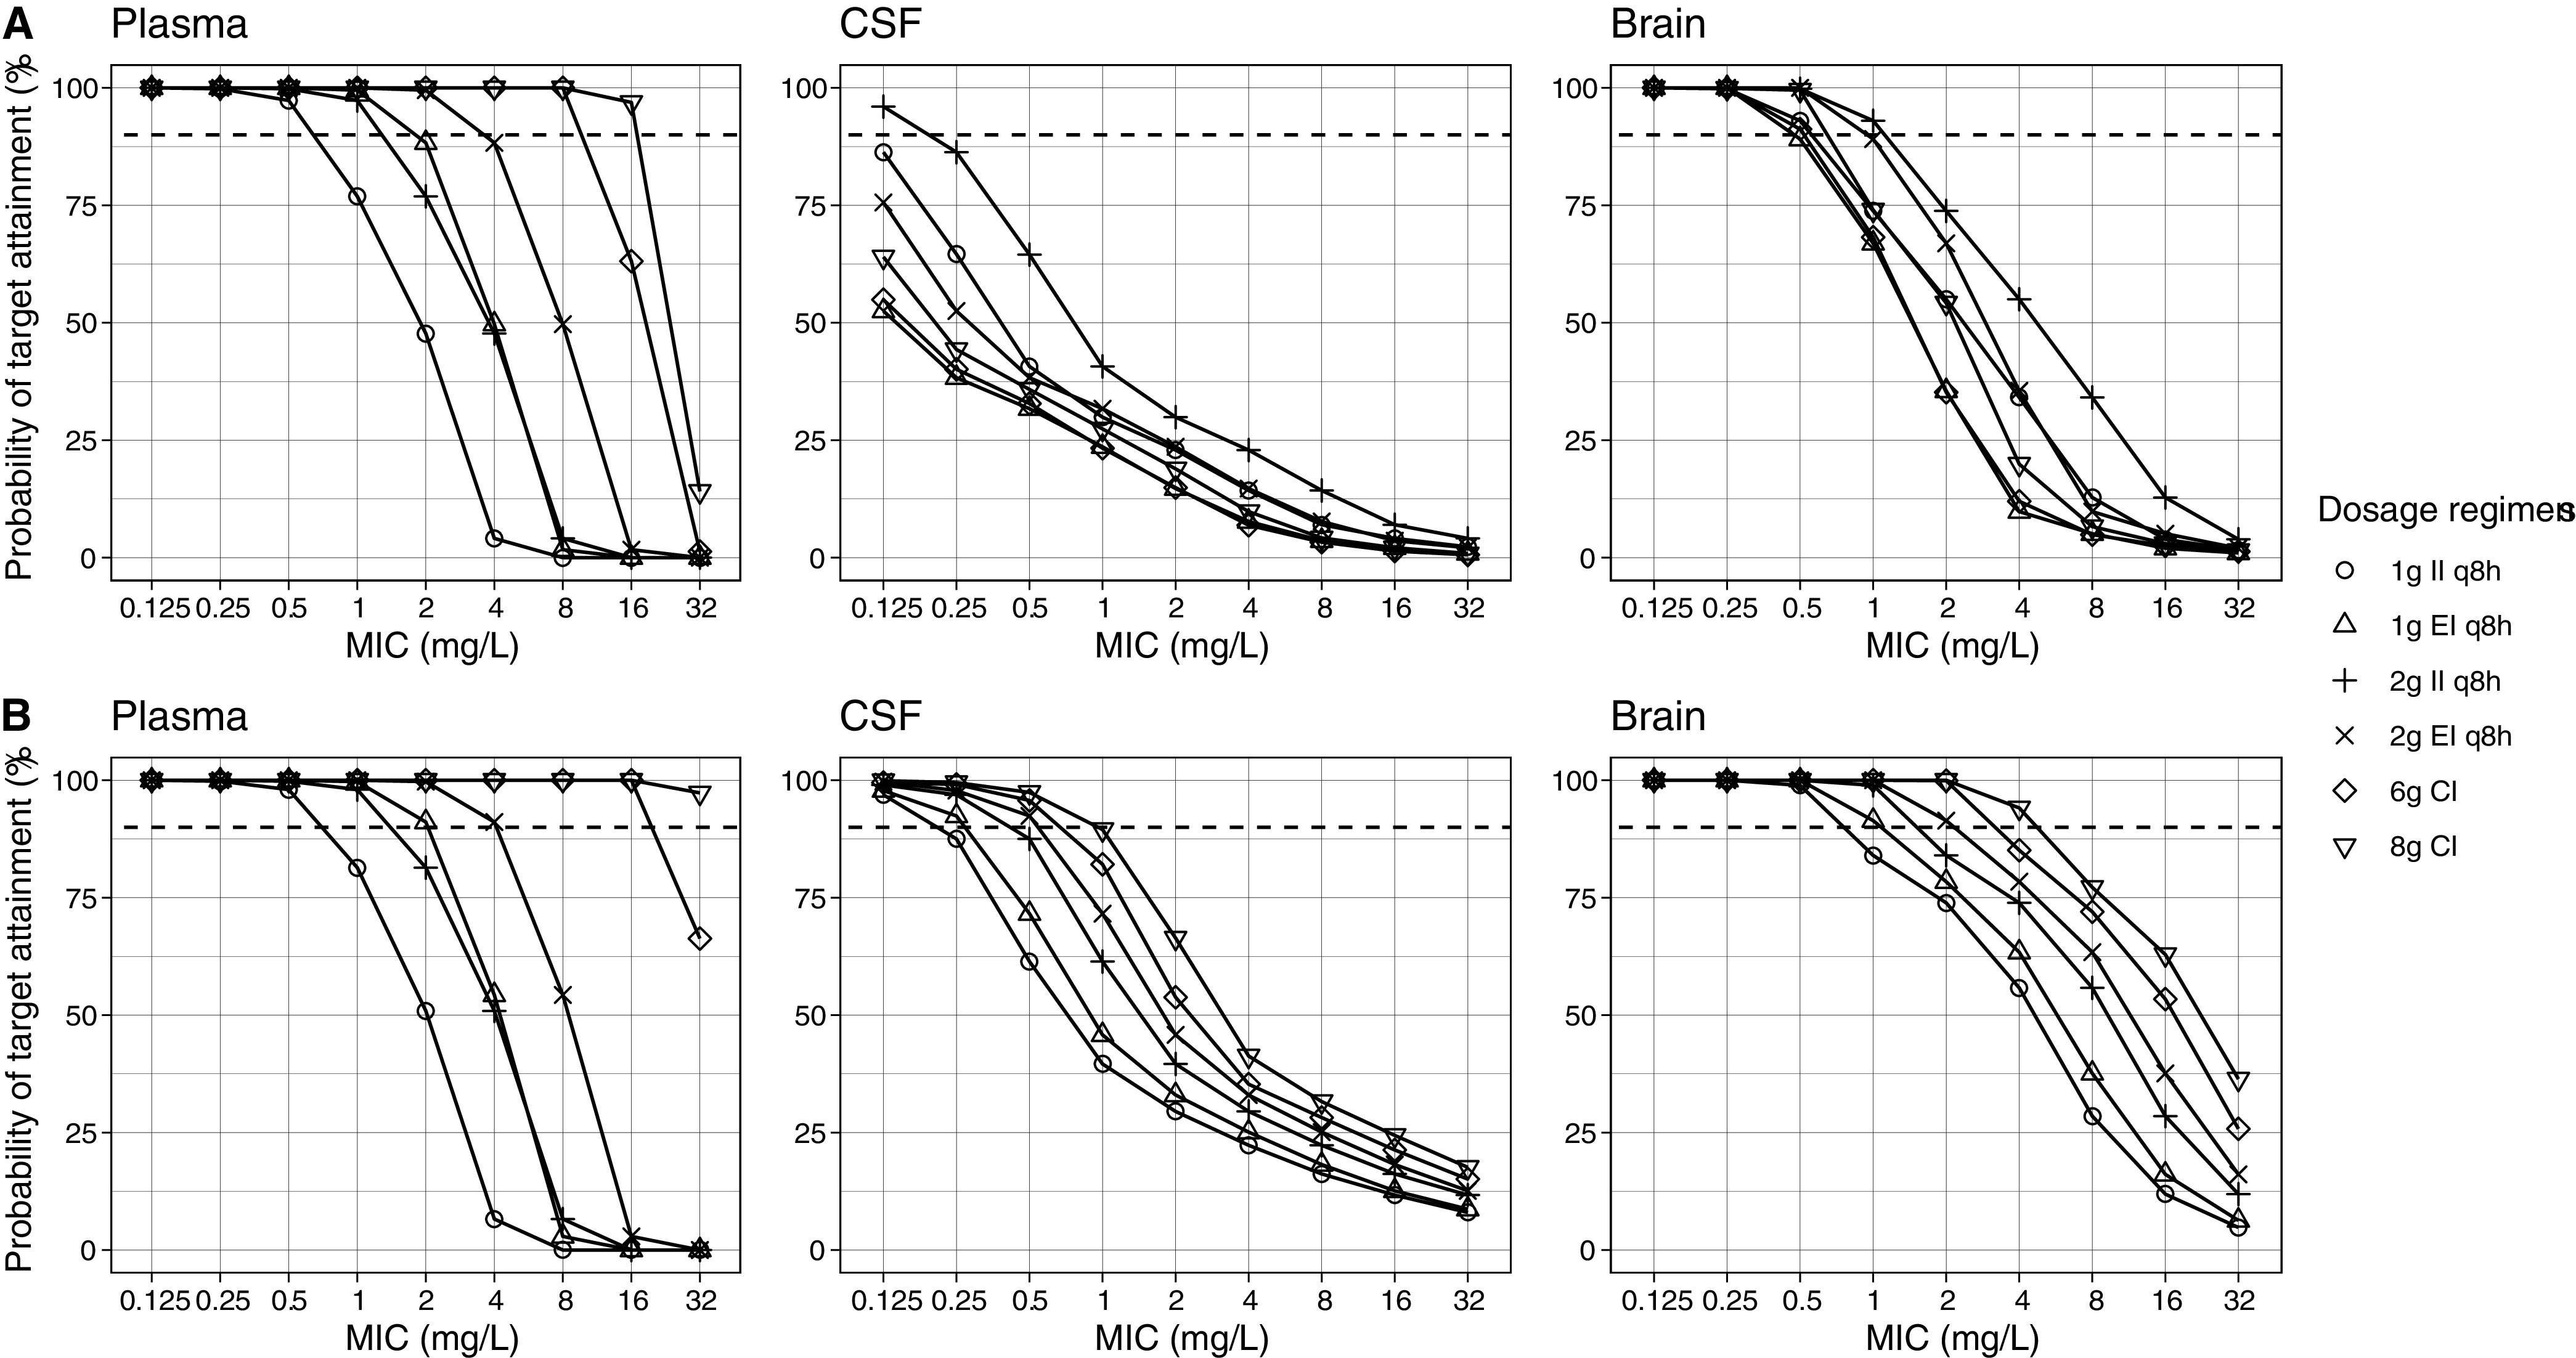
Simulated meropenem regimens and associated probability of target attainment in plasma, CSF, and brain (A) in the first 24 h and (B) after 72 h of therapy. Dashed lines denote the 90% probability of target attainment. CI, continuous infusion; CSF, cerebrospinal fluid; EI, extended infusion over 4 h; II, intermittent infusion over 1 h; MIC, minimum inhibitory concentration; q8h, every 8 h.
Meropenem target attainment in the plasma.
The PTA was the highest in plasma using extended infusion (EI) and CI. All of the regimens achieved PTA >90% at minimum inhibitory concentrations (MICs) between 0.125 and 0.5 mg/L. Similarly, all regimens except the 1 g intermittent infusion (II) every 8 h achieved >90% PTA at MIC 1 mg/L. At a MIC of 2 mg/L, extended infusion (EI) and CI were needed for adequate target attainment. Only 2 g EI and 6 g or 8 g CI regimens achieved >90% PTA at MIC 4 mg/L, while at MIC >4 mg/L, 6 or 8 g administered via CI were the only regimens that achieved adequate target attainment. PTA in the plasma up to a MIC of 16 mg/L was 100% for all loading dose (LD) regimens followed by a 6 g or 8 g CI (Fig. 5).
FIG 5.
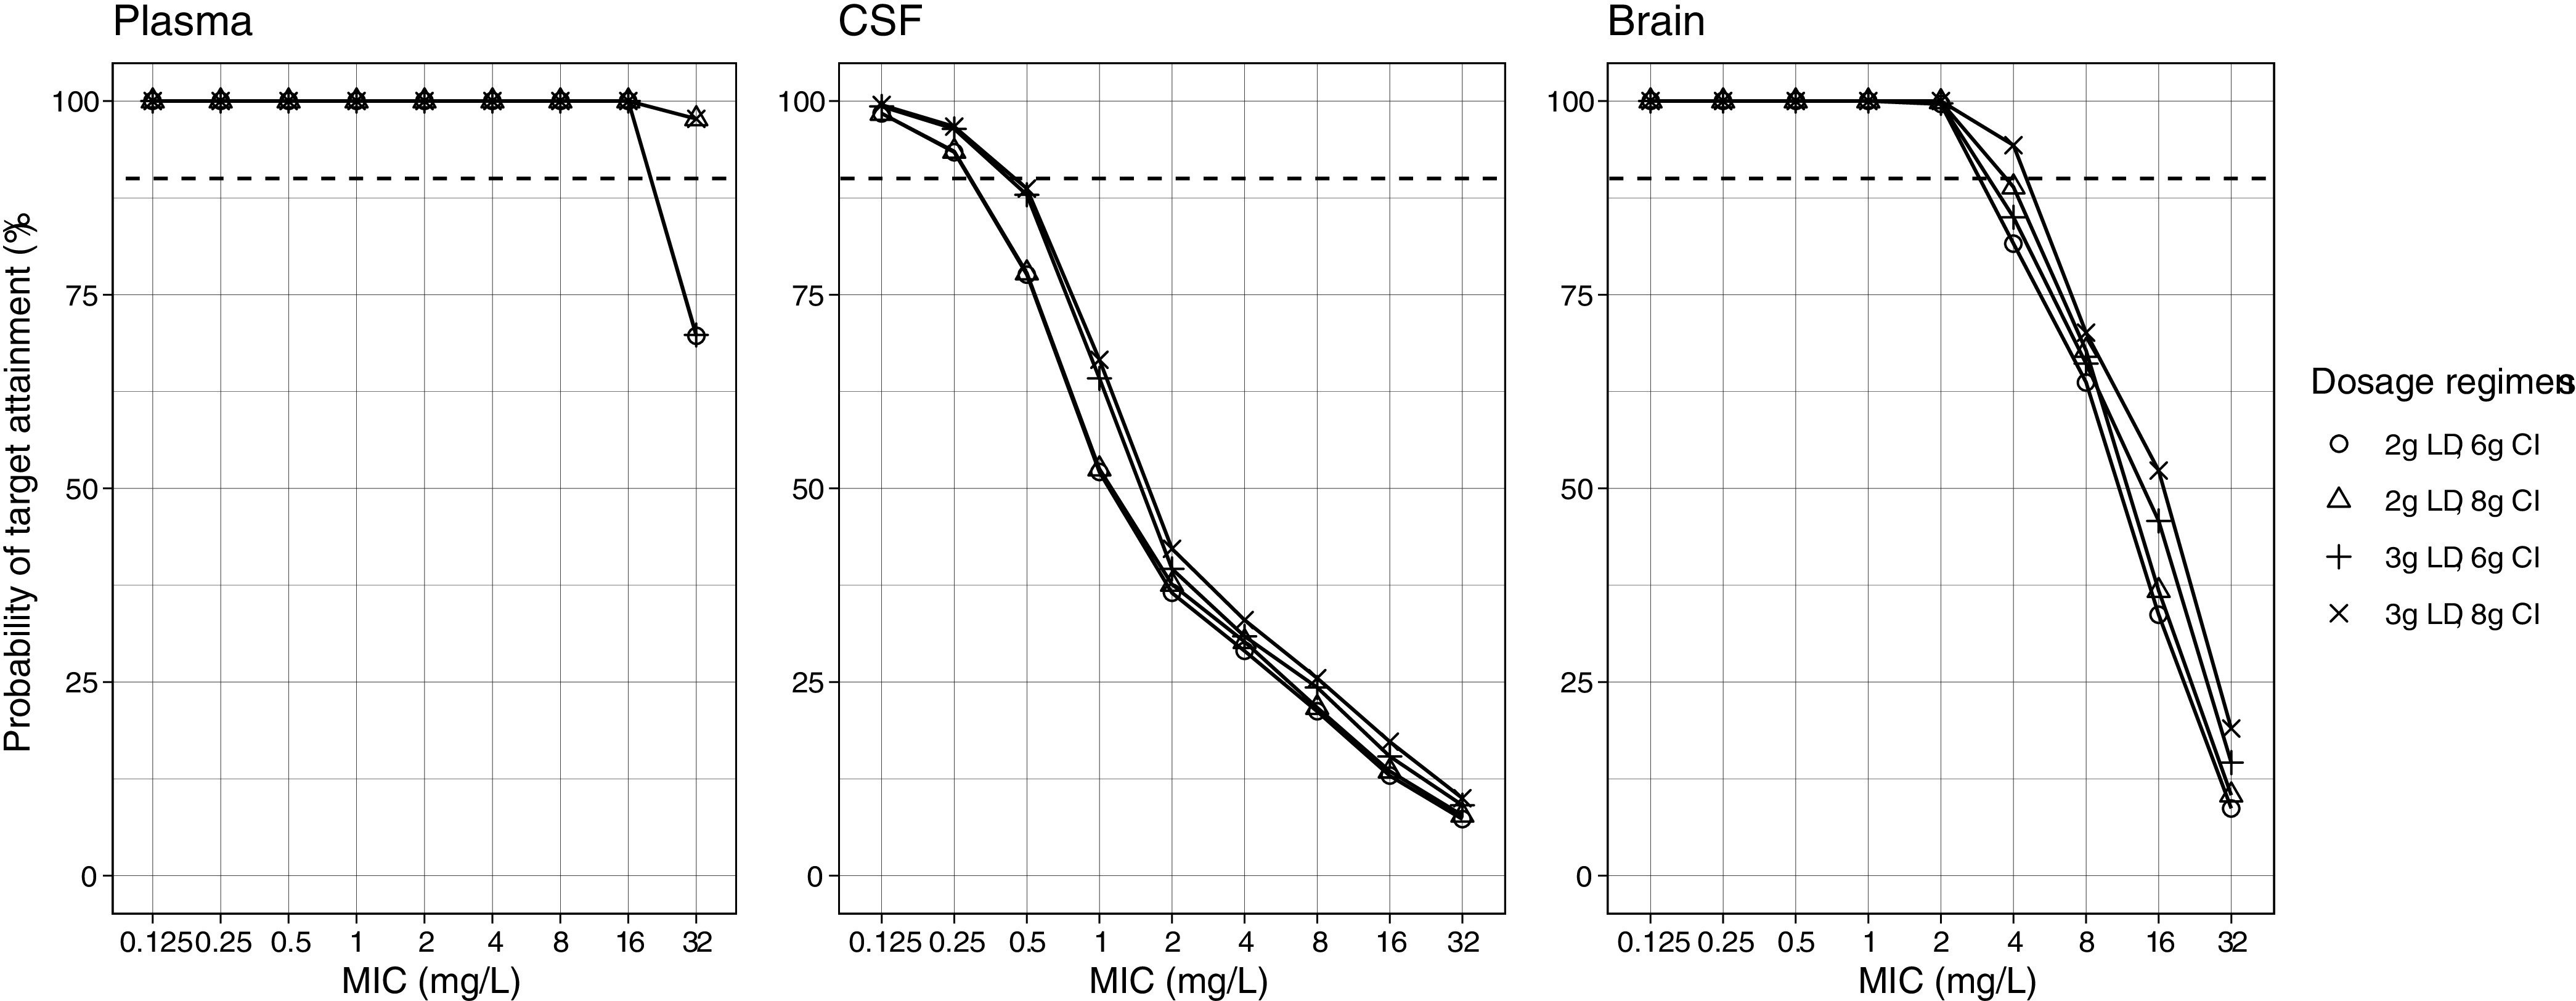
Probability of target attainment in the first 24 h with meropenem loading dose followed by continuous infusion. Dashed lines denote the 90% probability of target attainment. CI, continuous infusion; CSF, cerebrospinal fluid; LD, loading dose over 1 h; MIC, minimum inhibitory concentration.
Meropenem target attainment in the CSF.
In the CSF, the PTA was much lower than in the plasma. No regimen achieved adequate target attainment in the first 24 h except for 2 g II at MIC 0.125 mg/L. This improved after 72 h, by which point all regimens had achieved good target attainment at MIC 0.125 mg/L. Similarly, at MIC 0.25 mg/L, all regimens had >90% PTA except 1 g II, which was slightly below that target. At higher MICs, either 2 g EI (MIC 0.5 mg/L) or 6 g to 8 g CI (MIC 0.5 to 1 mg/L) was needed for good target attainment. When 2 g to 3 g LDs followed by CI regimens were simulated, 100% PTA was attained for all LDs and regimens at MICs between 0.125 and 0.25 mg/L, but PTA declined to <90% when the MIC increased to ≥0.5 mg/L. The higher LD of 3 g was more likely to achieve adequate target attainment.
Meropenem target attainment in the brain tissue.
In contrast to the plasma, the II and EI regimens had better target attainment in the brain compared to CI alone in the first 24 h. At MICs of 0.125 to 0.5 mg/L, all of the regimens achieved ≥90% PTA. At a MIC of 1 mg/L, only 2 g II or EI had good target attainment. No regimens achieved 90% PTA at MICs ≥2 mg/L. Similar to the first 24 h, all regimens had adequate target attainment at MICs from 0.125 to 0.5 mg/L after 72 h of therapy. At a MIC of 1 mg/L, all regimens achieved >90% PTA except 1 g II. At least 2 g EI, CI, or LD plus CI regimens were needed for adequate target attainment at a MIC of 2 mg/L, but only an 8 g CI with or without a 2 g or 3 g LD was able to achieve adequate concentrations at a MIC of 4 mg/L. Above a MIC of 4 mg/L, no regimens were successful.
DISCUSSION
We presented meropenem PK in the CNS using plasma, CSF, and brain tissue concentrations in 12 patients with subarachnoid hemorrhage (SAH). Although the CSF concentrations were low, the brain tissue had higher meropenem exposure, almost similar to that of the plasma. Glubrain was included as a covariate on Vbrain, which was not reported previously; however, adding it improved the fit, Akaike information criterion (AIC), bias, and imprecision in the model. The results of the simulations showed that although CI displayed a superior PTA at steady-state in both the plasma and the brain, II or LD plus CI had better target attainment in the brain tissue during the first 24 h of therapy. These findings emphasize the need for a LD before starting meropenem CI to achieve adequate brain concentrations in the first 24 h in patients with bacterial MICs up to 4 mg/L. Given that most infusion strategies failed to achieve adequate CSF concentrations when a MIC exceeding 1 mg/L was detected in the CSF, the use of adjunctive intrathecal antimicrobials for severe CNS infections may be considered, given that the current breakpoint for common Gram-negative bacteria causing a CNS infections is 2 mg/L (11).
Based on a PK study in mice which measured the carbapenems concentration in the plasma and the brain, the reported meropenem mean ± standard deviation maximum concentration (Cmax) and the area under the concentration-time curve (AUC) were 85.50 ± 10.81 mg/L and 70.52 ± 7.15 mg·hr/L in the plasma versus 0.41 ± 0.11 mg/L and 0.24 ± 0.02 mg·hr/L in the brain, respectively (12). Most of the studies in humans measured meropenem in the plasma and the CSF only. Zhang et al. enrolled 82 patients with postneurosurgical meningitis in a prospective PK study and measured meropenem in both the plasma and the CSF. The reported mean plasma and CSF AUCs were 48.6 and 6.9, 50.2 and 15.5, and 95.1 and 16.6 mg·hr/L for 1 g q8h, 1 g q6h, and 2 g q8h regimens, respectively (7). Previous meropenem population PK models used three-compartment models to describe meropenem PK, using a central, a peripheral, and a CSF compartment (5, 13, 14). The mean rate of transfer from the plasma to the CSF ranged from 0.04 to 0.08 h−1, which was higher than what we reported in this study. This might be due to the differences in the underlying infections (CNS versus non-CNS), which may have affected the permeability of the BBB. In addition, two models reported a high CSF volume of distribution (82 L) (5, 14), while a third model reported a fixed volume of 0.13 L with a ke parameter added to the CSF compartment to represent the CSF drainage (13). Since the meropenem PK in the CSF was best described by two CSF compartments, with the central compartment being connected to the brain compartment in our model, we reported a low CSF volume (0.55 L).
To understand the mechanism by which the distribution of meropenem is greater within the brain tissue compared to the CSF requires a critical understanding of drug transport into these distinct compartments. The two barriers that restrict drug transport into the CNS include the BBB and the blood-CSF barrier. The BBB is comprised of highly polarized endothelial cells and tight junctions that impair drug distribution in the normal brain (15). In the setting of inflammation, such as in the case of a CNS infection, increased drug penetration rates of meropenem have been demonstrated to be as high as 39% (16). In contrast, the blood-CSF barrier formed by the choroid plexus allows for an easier passage of drugs into the CSF (17). However, drug clearance from the CSF occurs through CSF outflow tracks with a CSF volume turnover frequency of 4 to 5 times per day, resulting in a more rapid clearance rate compared to clearance from the brain parenchyma (15). Drug penetration into the brain parenchyma from the CSF is minimal, and these compartments function independently and rely on the delivery of the drug from the plasma (17). This forms the basis of the PK model in this study. Furthermore, several medications used in the management of severe CNS infections may impair BBB permeability, which may prohibit drug distribution into the brain parenchyma. Corticosteroids specifically have been demonstrated to enhance endothelial tight junctions through the upregulation of zonula occludens, which reduces BBB permeability and leads to the efficacy of corticosteroids in reducing inflammation in the management of meningitis (18). While the impact of reducing inflammation remains advantageous, the potential negative impact on drug distribution across the BBB remains ill-defined.
Meropenem is near exclusively eliminated in the kidneys and requires dose adjustments in the setting of impaired renal function. Neurologically injured patients with SAH have been demonstrated to have an increased rate of ARC (19). While ARC was not specifically investigated in this study with the use of 24 h urine creatinine collection, the mean CrCl calculated in the current PK study was 126 mL/min. In patients with severe CNS infections compounded by impaired renal function, obtaining serum and CSF concentrations to ensure adequate target attainment should be considered.
There are several limitations of the current study. First, the sample size was small, which might have limited the ability to properly investigate the covariates in the model. None of the patients had a CNS infection. All included patients suffered from severe SAH. That is, measurements of cerebral meropenem concentrations were not performed in healthy brain tissue. Furthermore, the detection of brain tissue concentrations using CMD comes with limitations, given that the location of the microdialysis catheter and concentrations could vary, depending on the location observed. Invasive monitoring using CMD for drug concentration assessment is also not routinely performed in clinical practice, making the applicability of invasive monitoring for standard drug concentration assessment a challenge. Most of the patients had high CrCl values, and these results may not be generalizable to those with renal impairment. Finally, protein binding was considered to have a minimal impact on meropenem concentration (<2%). Thus, it was not accounted for in the PK model. Further studies in a larger, more diverse cohort are needed to confirm these findings and validate this PK model.
Conclusions.
We described meropenem PK using multiple samples from the blood, CSF, and brain microdialysate from neuro ICU patients with SAH. The simulations showed that meropenem 6 g to 8 g CI may be needed for good target attainment in the brain at a MIC of 2 mg/L. A LD prior to CI improved the early target attainment in the brain and the CSF. Therapeutic drug monitoring may guide meropenem dosing, especially when brain and/or CSF sampling is available.
MATERIALS AND METHODS
This was a prospective PK study of patients with an acute aneurysmal SAH and who were admitted to the neurosurgical ICU at the Medical University of Vienna between 2016 and 2019. Adult patients with an external ventricular drain (EVD), CMD for invasive neuromonitoring, and concomitant intravenous (IV) meropenem therapy were included. Meropenem was administered as a 2 g IV dose infused over 1 h every 8 h.
Methods were described in details elsewhere (10). Briefly, plasma meropenem samples were collected before and 1, 2, 4, 6, and 8 h after the start of the meropenem infusion. Similarly, 2 mL of CSF were drawn from the EVD catheter at the same time as the plasma samples. Baseline microdialysate was collected 1 h before the meropenem infusion and at 2, 4, 6, and 8 h after the start of the infusion to quantify the meropenem unbound concentration. The 70 MD Bolt microdialysis catheter (M Dialysis AB, Stockholm, Sweden) or 70 Brain MD catheter (M Dialysis AB) with 10-mm membrane length and 20,000 Da mass cutoff were used at a flow rate of 0.3 μL/min. The sampling occurred at two occasions; once at the initial dose (n = 5) and again at steady-state (n = 11) after the administration of three or more doses. All samples were stored at −65°C. The in vivo microdialysis probe recovery for meropenem was determined by retrodialysis in each patient. Accordingly, the meropenem concentration in microdialysate was corrected for the individual in vivo probe recovery to obtain true tissue concentrations.
The meropenem concentrations in the plasma, CSF, and microdialysate were determined using liquid chromatography with mass spectrometry assay. The limit of detection in the plasma and the CSF were 1 ng/mL, and the limit of detection in the microdialysate was 0.5 ng/mL. The coefficients of accuracy and precision were <8.4%.
Data collected included age, sex, weight, height, and blood, CSF, and microdialysate parameters, including glucose, lactate, pyruvate, glycerol, and glutamate. CrCl was calculated using the Cockcroft-Gault equation (20). Institutional review boards at both the Medical University of Vienna (EK1031/2015; Eudract 2015-000121-37) and the University of Florida (IRB202102995) reviewed and approved the study.
The nonparametric adaptive grid in the Pmetrics v1.9.7 R package was used for the population PK modeling and simulations (21). Plasma concentrations were evaluated first by one- and two-compartment models, and the best-fit model was chosen. Then, covariates, including body weight and CrCl, were tested for by adding these variables to the PK parameters in a forward stepwise fashion. After obtaining the best-fit plasma model, we added CSF and brain concentrations, each in a separate compartment, and evaluated the PK parameters’ ranges and the influence of the covariates. The final models were compared based on the AIC, coefficient of determination (R2) of the observed versus predicted concentration plots, bias, and imprecision. The assay error (SD) was accounted for using the error polynomial as a function of the observed concentration (SD = C0 + [C1 × observed concentration]) using C0 (intercept) and C1 (slope) values of 0.5 and 0.1, respectively. A gamma multiplicative error model value was set to 2 to estimate the magnitude of additional noise or model misspecification (error = SD × gamma) (22).
Meropenem 1 g and 2 g doses administered as II over 1 h and EI over 4 h every 8 h, and as a 6 g and 8 g CI over 24 h, with and without a 2 g or 3 g LD, were simulated using the population PK parameters and the covariates in the final model. A total of 10,000 patients were simulated, 1,000 for each regimen. The probability of achieving a target of 100% fT>MIC in the plasma, CSF, and brain was evaluated at MICs of 0.125, 0.25, 0.5, 1, 2, 4, 8, 16, and 32 mg/L. The percentage of meropenem protein binding was considered negligible (~2%), and, hence, it was not accounted for.
ACKNOWLEDGMENTS
We have no conflict of interest to disclose.
This work was supported by the Oesterreichische Nationalbank (Austrian Central Bank, Anniversary Fund, project number: 16446).
REFERENCES
- 1.Srihawan C, Castelblanco RL, Salazar L, Wootton SH, Aguilera E, Ostrosky-Zeichner L, Sandberg DI, Choi HA, Lee K, Kitigawa R, Tandon N, Hasbun R. 2016. Clinical characteristics and predictors of adverse outcome in adult and pediatric patients with healthcare-associated ventriculitis and meningitis. Open Forum Infect Dis 3:ofw077. 10.1093/ofid/ofw077. [DOI] [PMC free article] [PubMed] [Google Scholar]
- 2.Van de Beek D, Drake JM, Tunkel AR. 2010. Nosocomial bacterial meningitis. N Engl J Med 362:146–154. 10.1056/NEJMra0804573. [DOI] [PubMed] [Google Scholar]
- 3.Ramanan M, Lipman J, Shorr A, Shankar A. 2015. A meta-analysis of ventriculostomy-associated cerebrospinal fluid infections. BMC Infect Dis 15:3. 10.1186/s12879-014-0712-z. [DOI] [PMC free article] [PubMed] [Google Scholar]
- 4.Tunkel AR, Hasbun R, Bhimraj A, Byers K, Kaplan SL, Scheld WM, van de Beek D, Bleck TP, Garton HJL, Zunt JR. 2017. 2017 infectious diseases society of america’s clinical practice guidelines for healthcare-associated ventriculitis and meningitis*. Clin Infect Dis 64:e34–e65. 10.1093/cid/ciw861. [DOI] [PMC free article] [PubMed] [Google Scholar]
- 5.Blassmann U, Roehr AC, Frey OR, Vetter-Kerkhoff C, Thon N, Hope W, Briegel J, Huge V. 2016. Cerebrospinal fluid penetration of meropenem in neurocritical care patients with proven or suspected ventriculitis: a prospective observational study. Crit Care 20:343. 10.1186/s13054-016-1523-y. [DOI] [PMC free article] [PubMed] [Google Scholar]
- 6.Tiede C, Chiriac U, Dubinski D, Raimann FJ, Frey OR, Röhr AC, Wieduwilt A, Eibach M, Filmann N, Senft C, Zacharowski K. 2021. Cerebrospinal fluid concentrations of meropenem and vancomycin in ventriculitis patients obtained by TDM-guided continuous infusion. Antibiotics 10:1421. 10.3390/antibiotics10111421. [DOI] [PMC free article] [PubMed] [Google Scholar]
- 7.Zhang Y, Zhang J, Chen Y, Yu J, Cao G, Wu X, Chen M, Wu J, Zhao X. 2017. Evaluation of meropenem penetration into cerebrospinal fluid in patients with meningitis after neurosurgery. World Neurosurg 98:525–531. 10.1016/j.wneu.2016.11.040. [DOI] [PubMed] [Google Scholar]
- 8.Hefny F, Stuart A, Kung JY, Mahmoud SH. 2022. Prevalence and risk factors of augmented renal clearance: a systematic review and meta-analysis. Pharmaceutics 14:445. 10.3390/pharmaceutics14020445. [DOI] [PMC free article] [PubMed] [Google Scholar]
- 9.de Lange EC, Danhof M, de Boer AG, Breimer DD. 1997. Methodological considerations of intracerebral microdialysis in pharmacokinetic studies on drug transport across the blood-brain barrier. Brain Res Brain Res Rev 25:27–49. 10.1016/S0165-0173(97)00014-3. [DOI] [PubMed] [Google Scholar]
- 10.Hosmann A, Ritscher L, Burgmann H, Al Jalali V, Wulkersdorfer B, Wölfl-Duchek M, Sanz Codina M, Jäger W, Poschner S, Plöchl W, Reinprecht A, Rössler K, Gruber A, Zeitlinger M. 2021. Meropenem concentrations in brain tissue of neurointensive care patients exceed CSF levels. J Antimicrob Chemother 76:2914–2922. 10.1093/jac/dkab286. [DOI] [PubMed] [Google Scholar]
- 11.The European Committee on Antimicrobial Susceptibility Testing. 2022. Breakpoint tables for interpretation of MICs and zone diameters. Version 12.0. http://www.eucast.org.
- 12.Matsumoto K, Kurihara Y, Kuroda Y, Hori S, Kizu J. 2016. Pharmacokinetics and brain penetration of carbapenems in mice. J Infect Chemother 22:346–349. 10.1016/j.jiac.2015.11.010. [DOI] [PubMed] [Google Scholar]
- 13.Lu C, Zhang Y, Chen M, Zhong P, Chen Y, Yu J, Wu X, Wu J, Zhang J. 2016. Population pharmacokinetics and dosing regimen optimization of meropenem in cerebrospinal fluid and plasma in patients with meningitis after neurosurgery. Antimicrob Agents Chemother 60:6619–6625. 10.1128/AAC.00997-16. [DOI] [PMC free article] [PubMed] [Google Scholar]
- 14.Lodise TP, Nau R, Kinzig M, Drusano GL, Jones RN, Sörgel F. 2007. Pharmacodynamics of ceftazidime and meropenem in cerebrospinal fluid: results of population pharmacokinetic modelling and Monte Carlo simulation. J Antimicrob Chemother 60:1038–1044. 10.1093/jac/dkm325. [DOI] [PubMed] [Google Scholar]
- 15.Pardridge WM. 2012. Drug transport across the blood–brain barrier. J Cereb Blood Flow Metab 32:1959–1972. 10.1038/jcbfm.2012.126. [DOI] [PMC free article] [PubMed] [Google Scholar]
- 16.Nau R, Sorgel F, Eiffert H. 2010. Penetration of drugs through the bloodcerebrospinal fluid/blood-brain barrier for treatment of central nervous system infections. Clin Microbiol Rev 23:858–883. 10.1128/CMR.00007-10. [DOI] [PMC free article] [PubMed] [Google Scholar]
- 17.Pardridge WM. 2011. Drug transport in brain via the cerebrospinal fluid. Fluids Barriers CNS 8:7. 10.1186/2045-8118-8-7. [DOI] [PMC free article] [PubMed] [Google Scholar]
- 18.Salvador E, Shityakov S, Förster C. 2014. Glucocorticoids and endothelial cell barrier function. Cell Tissue Res 355:597–605. 10.1007/s00441-013-1762-z. [DOI] [PMC free article] [PubMed] [Google Scholar]
- 19.May CC, Arora S, Parli SE, Fraser JF, Bastin MT, Cook AM. 2015. Augmented renal clearance in patients with subarachnoid hemorrhage. Neurocrit Care 23:374–379. 10.1007/s12028-015-0127-8. [DOI] [PubMed] [Google Scholar]
- 20.Cockcroft DW, Gault H. 1976. Prediction of creatinine clearance from serum creatinine. Nephron 16:31–41. 10.1159/000180580. [DOI] [PubMed] [Google Scholar]
- 21.Neely M, van Guilder M, Yamada W, Schumitzky A, Jelliffe R. 2012. Accurate detection of outliers and subpopulations with Pmetrics, a non-parametric and parametric pharmacometric modeling and simulation package for R. Ther Drug Monit 34:467–476. 10.1097/FTD.0b013e31825c4ba6. [DOI] [PMC free article] [PubMed] [Google Scholar]
- 22.Jelliffe RW, Schumitzky A, Van Guilder M, Liu M, Hu L, Maire P, Gomis P, Barbaut X, Tahani B. 1993. Individualizing drug dosage regimens: roles of population pharmacokinetic and dynamic models, Bayesian fitting, and adaptive control. Ther Drug Monit 15:380–393. 10.1097/00007691-199310000-00005. [DOI] [PubMed] [Google Scholar]


