Associative memories guide behavioural adaptation by binding together outcome-predictive sensory stimuli1,2. However, in a feature-rich environment, only a subset of stimuli may predict a desired outcome3,4. How neural circuits enable behavioural adaptation by selectively and durably representing subsets of sensory stimuli that are pertinent to a specifc outcome is not known. We investigated this feature selection process in the hippocampus during memory acquisition and subsequent consolidation. Two-photon calcium imaging of CA3 axonal projections to CA1 combined with simultaneous local feld potential recordings revealed that CA3 projections that encode behaviourally informative sensory stimuli were selectively recruited during the memory replay events that underlie hippocampal memory consolidation5. These axonal projections formed sequential assemblies that conjunctively link sensory features to spatial location and thus reward proximity. By contrast, axons encoding uninformative, peripatetic sensory cues were notably suppressed during memory replay. Thus, while the hippocampus comprehensively encodes the real-time sensory environment, it implements a fexible fltering mechanism to maximize the utility of memories destined for long-term storage. We propose that utility-dependent recruitment of sensory experience during memory consolidation is a general coding principle for associative learning.
A fundamental challenge of learning in noisy environments is discerning task-relevant information for preferential long-term storage amidst a continuous barrage of sensory experiences. Selective attention3,4 has been shown to aid memory function by promoting the association of relevant information with outcome during memory encoding6,7, but this strategy alone is limited; salience does not necessarily equate to relevance. In many cases, selectively representing task-relevant sensory stimuli and updating these representations as the behavioural relevance of stimuli changes is a superior strategy. However, it is unknown whether such adaptive selection mechanisms operate during memory formation and, in particular, whether uninformative stimuli are preferentially excluded from consolidation. The hippocampus has a crucial role in associative learning1,2,8,9. In particular, associative memories are thought to be rapidly encoded and stored initially within its CA3 recurrent network10,11. During subsequent periods of awake immobility and sleep, CA3 has a key role in driving sharp wave ripples (SWRs), high-frequency events during which reactivation of recent associations supports long-term memory consolidation5,12–14. While a large body of work has shown that the CA3-to-CA1 Schaffer collateral (CA3SC) pathway is important for the encoding and consolidation of memories15–18, little is known about the content transmitted through this projection. Here we report that CA3SC activity during sensory experience and subsequent awake SWRs flexibly switches between two distinct modes of operation depending on the behavioural relevance of sensory stimuli. As mice explore an environment, CA3SC dynamics rapidly reorganize to represent novel stimuli. However, during subsequent SWRs, only activity patterns that convey task-relevant sensory–spatial associations are reinstated, while patterns without navigational utility are suppressed.
In vivo functional imaging of CA3 output
We monitored calcium activity dynamics of CA3SCs located in the CA1 region (Fig. 1a and Extended Data Fig. 1a, b) while simultaneously detecting SWRs during awake immobility. Regions of interest (ROIs) corresponding to putative axonal boutons (Extended Data Figs. 1c–i and 2a–i) were recorded while mice were head-fixed on a voluntary treadmill19,20. We delivered sensory cues with varying levels of behaviourally relevant spatial information (Fig. 1b, c, Extended Data Fig. 3a and Methods). In a random cue (RC) condition, cues were presented pseudo-randomly, independently of the mouse’s position on the treadmill, while in a fixed cue (FC) condition cues were presented when the animal entered fixed zones on the treadmill. These stimulation rules were combined with two types of treadmill belts: one without tactile cues (non-spatial, NS) and one with textured cues (spatial, S). The animals’ velocity profile around fixed cues indicated that mice used sensory-place associations during fixed (FC-S and FC-NS), but not in random (RC-S), sensory stimulation conditions to inform navigational behaviour (Extended Data Fig. 3b–e and Methods).
Fig. 1 |. Rapid reorganization of CA3SC activity during sensory experience.
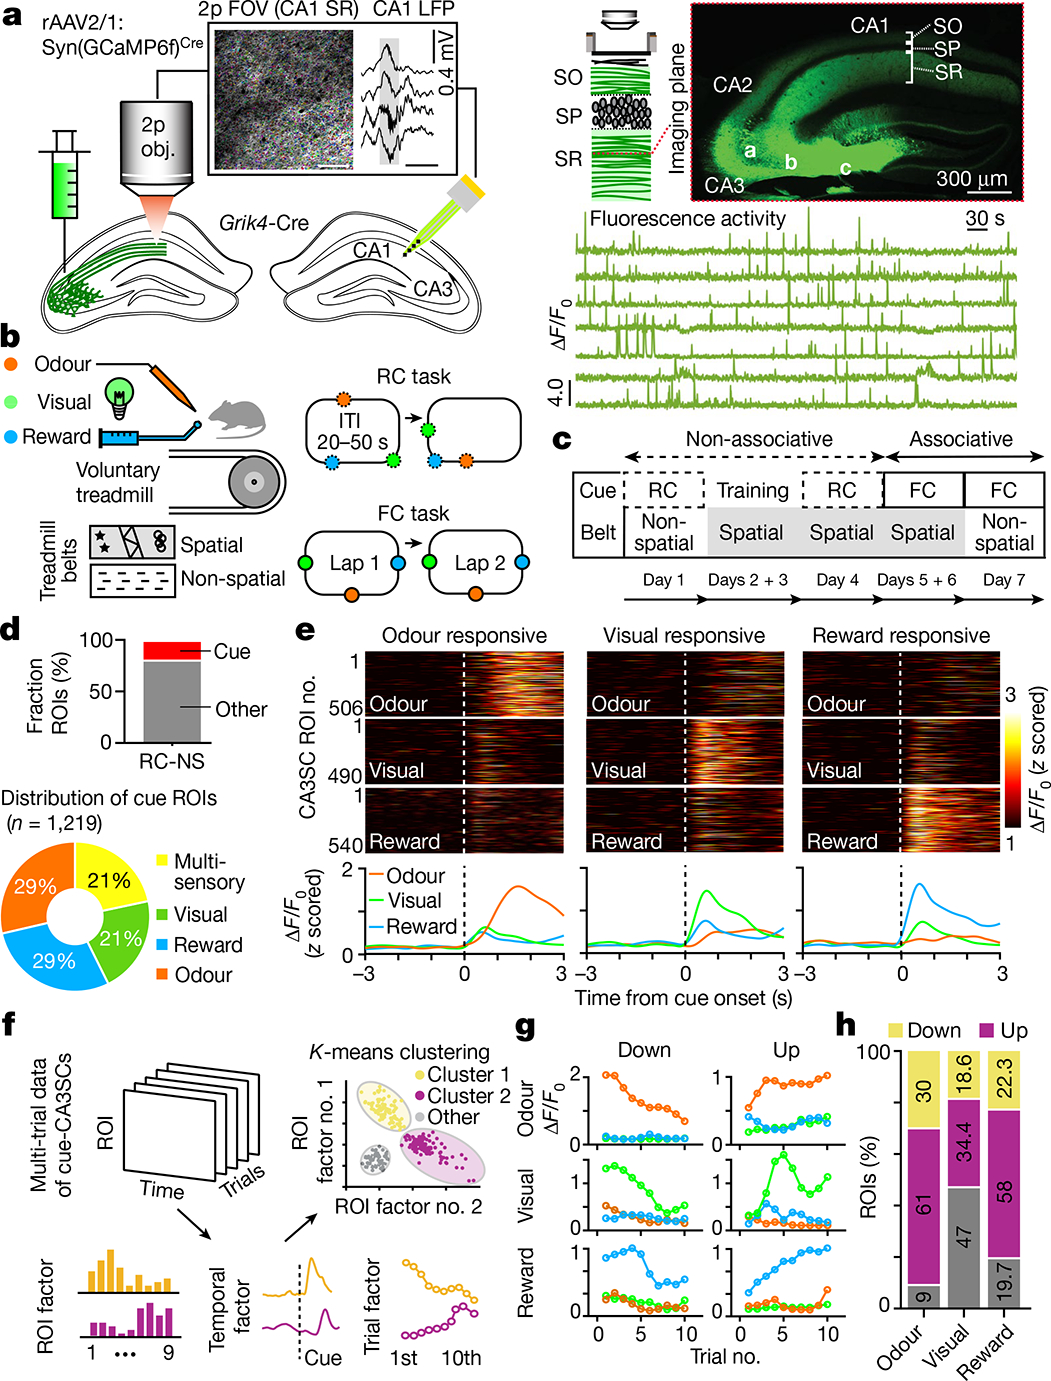
a, Left, schematic of axonal two-photon (2p) imaging of CA3SCs in CA1 and contralateral local field potential (LFP) recording. Box, example two-photon FOV with axonal bouton ROIs (coloured dots; scale bar, 50 μm) and an example CA1 SWR from one representative mouse (n = 6 in this study; scale bar, 200 ms). Top right, imaging schematic and example coronal section of a representative Grik4-Cre mouse (n = 6 in this study) dorsal hippocampus virally expressing GCaMP6f. Bottom right, example CA3SC fluorescence traces. ΔF/F0, relative fluorescence change; FOV, field of view; Obj., objective; SO, stratum oriens; SP, stratum pyramidale; SR, stratum radiatum. b, Left, schematic of the test conditions. Right, schematic of random (RC) and fixed (FC) sensory cue presentation (Methods). ITI, inter-trial interval. c, Behavioural experiment design. d, Top, fraction of cue-responsive and non-cue-responsive CA3SC ROIs in the RC-NS condition (n = 7,055 ROIs, n = 6 mice). Bottom, cue-responsive CA3SCs according to cue preference. e, Top, fluorescence responses of all identified cue-CA3SCs during the RC-NS condition for each cue modality. Bottom, average responses showing cue-specific activity. f, Schematic of dimensionality reduction with TCA followed by K-means clustering to identify cue-CA3SCs with adaptation. g, Summary of trial-by-trial dynamics for cue-CA3SC clusters showing negative (Down) and positive (Up) modulation of cue response (Methods and Extended Data Fig. 4). h, Fractions of cue-CA3SCs in the Up (purple), Down (yellow) and Other (grey) categories.
Fig. 2 |. Suppressed reactivation of task-irrelevant sensory information during SWRs.
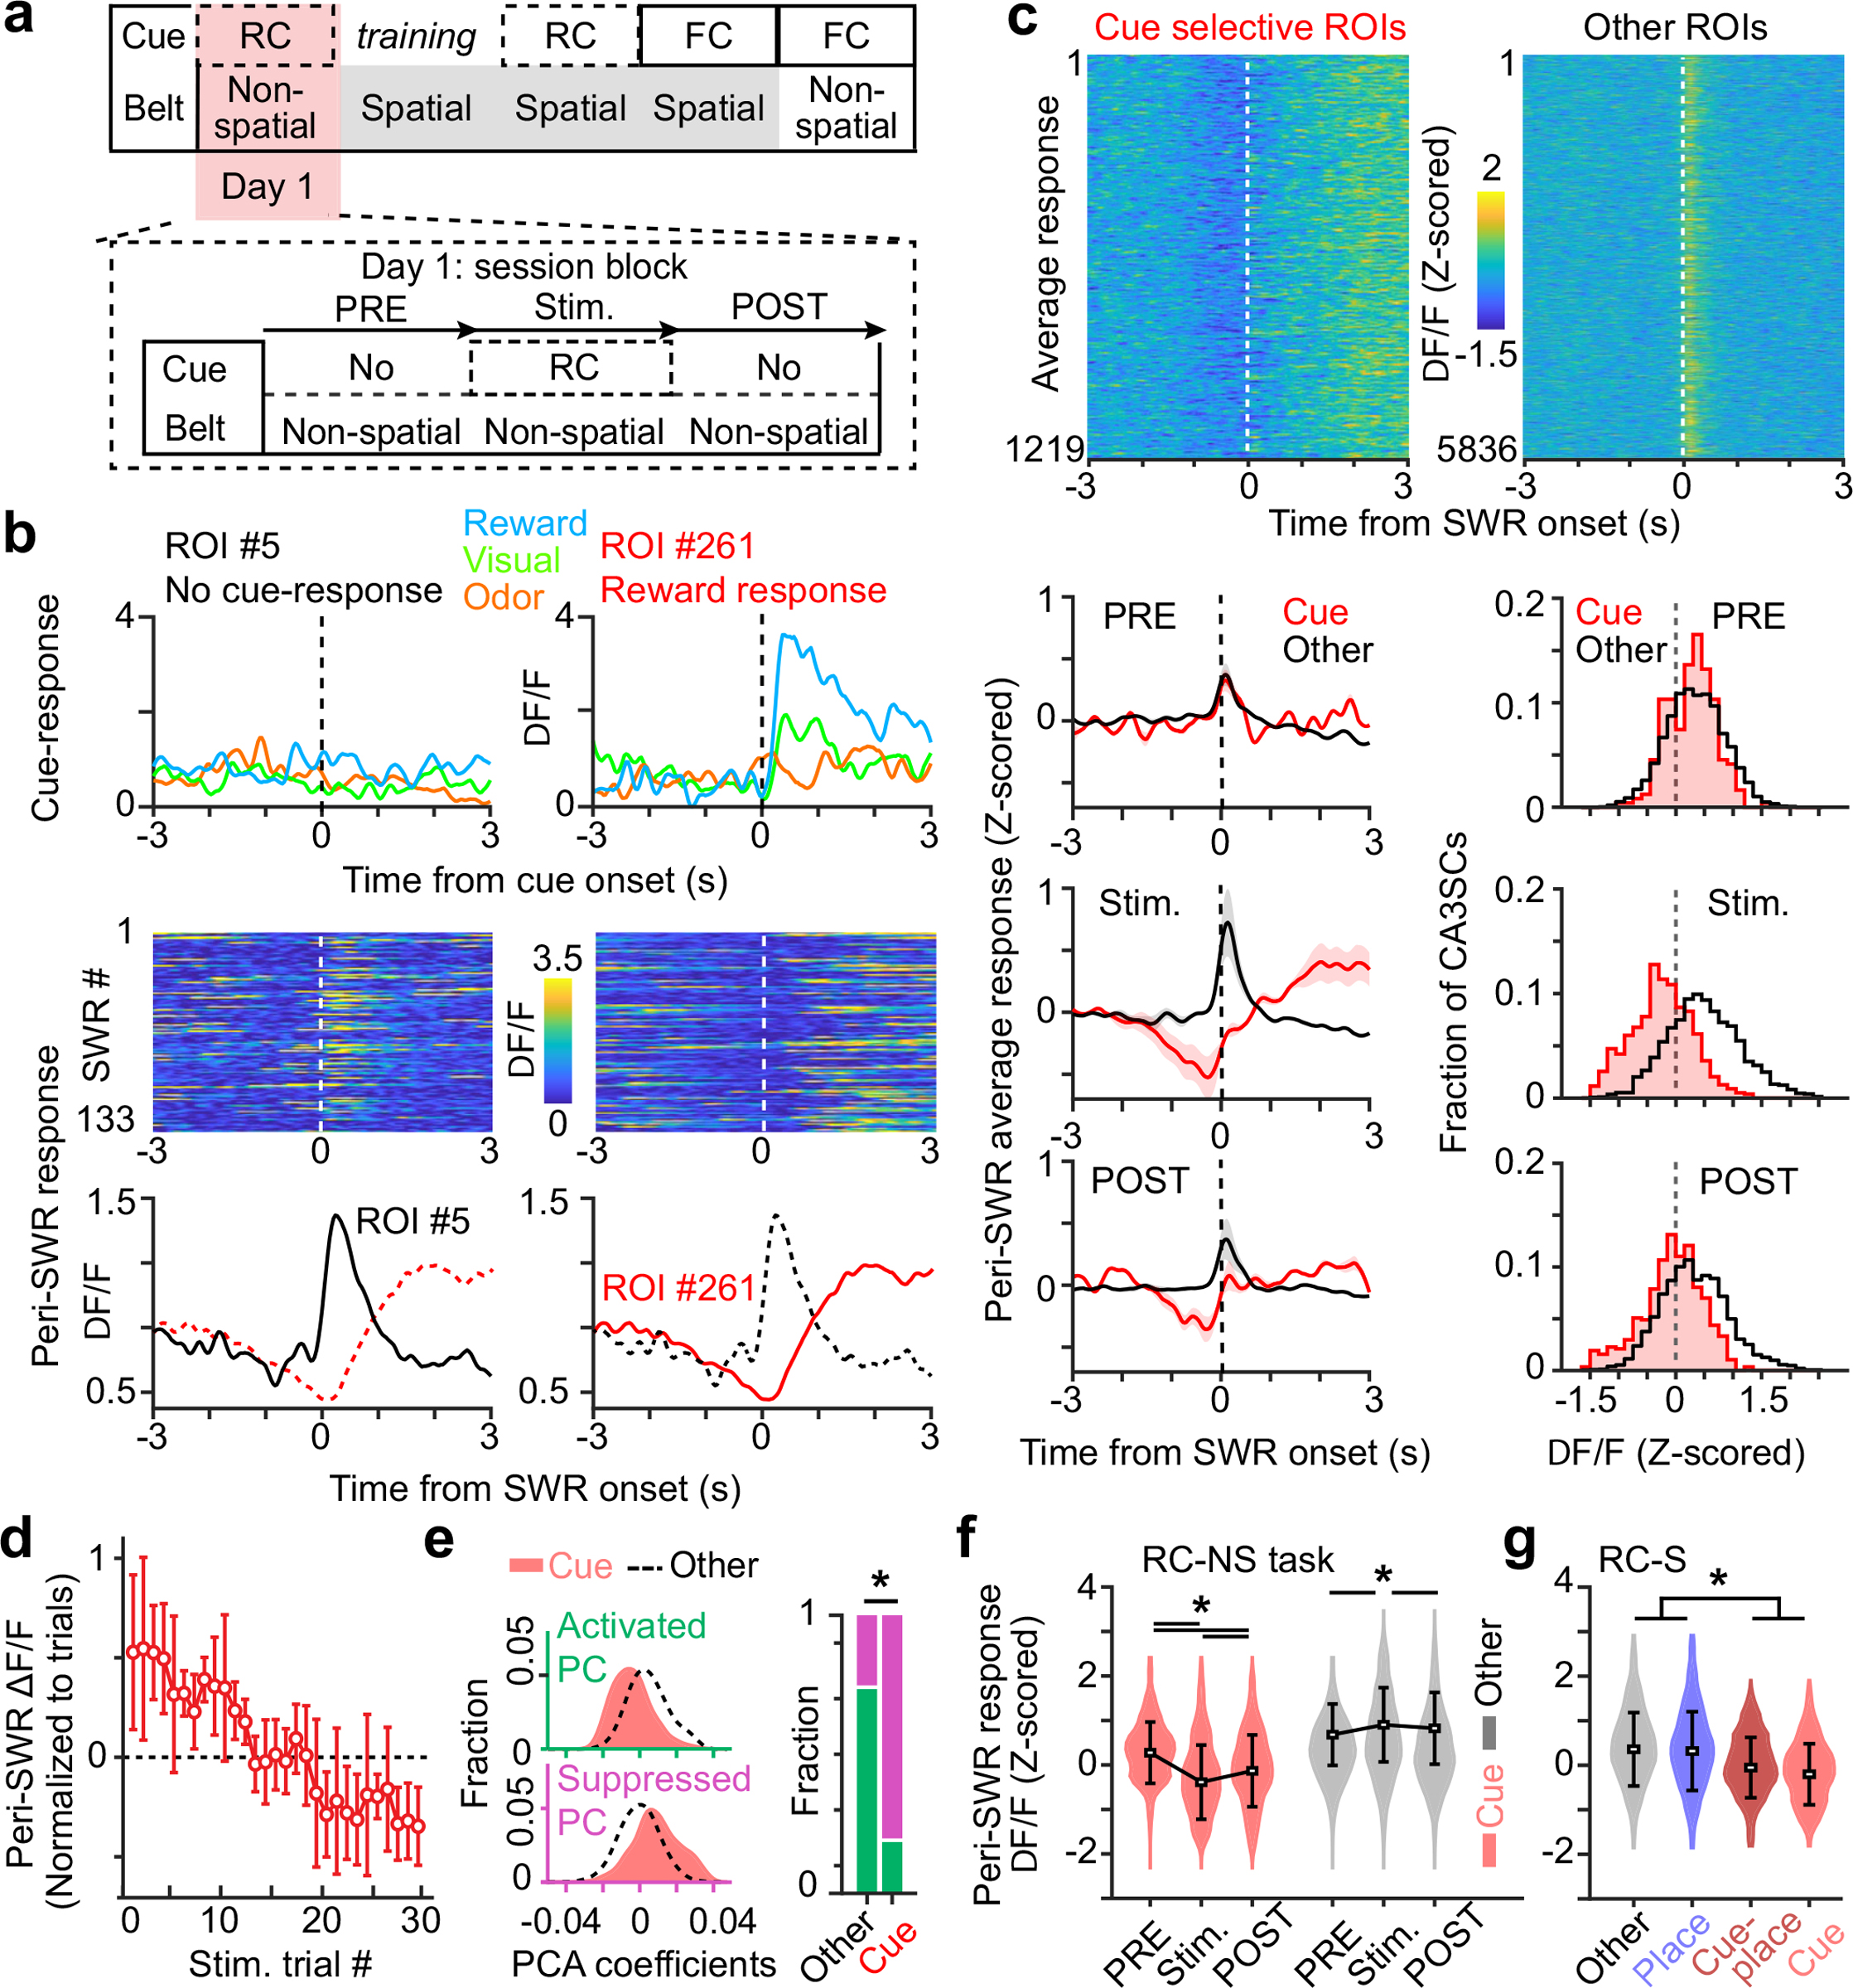
a, Random cue and non-spatial (RC-NS) paradigm. Pre and Post are stimulus-free periods before and after sensory stimulation (Stim.), respectively. b, Sensory- and SWR-related activity profiles of two representative CA3SC ROIs recorded simultaneously. Top, cue-evoked mean response during the RC-NS condition for each modality. Middle, peri-SWR activity during RC-NS inter-stimulus intervals. Bottom, average responses. c, Top, average responses of all cue-selective CA3SCs (Cue, red, n = 1,219) and other, non-cue-selective CA3SCs (Other, black, n = 5,836) centred on SWR onset during RC-NS inter-stimulus intervals (n = 6 mice). Bottom, peri-SWR responses (mean ± s.e.m.) for cue-responsive and other CA3SCs during the Pre, Stim. and Post trials. d, ΔF/F0 response (mean ± s.e.m.) of axons from cue-CA3SCs (all responses per ROI are averaged) indexed to inter-trial intervals (n = 17.76 ± 1.39 SWRs (mean ± s.e.m.) in each inter-trial interval, n = 6 mice). e, Left, distributions of factor loadings for each principal component (Methods) representing SWR-associated activation (green) and suppression (magenta) for cue-responsive and other CA3SCs in Stim. and Post trials. Right, a large fraction of axons from cue-responsive CA3SCs are suppressed (two-sided Fisher’s exact test with Bonferroni correction, P = 1.9 × 10⁻²⁶). *P < 0.05. f, Summary for cue-responsive and other CA3SCs in each session block (mean ± s.d.; in Pre only, n = 4 mice; Other, n = 3,226; Cue, n = 961; two-way ANOVA with Tukey’s post hoc test: Cue × Other, P = 2.8 × 10⁻¹⁷; Pre × Post, P = 4.4 × 10⁻¹⁶; interaction, P = 1.2 × 10⁻¹⁶). *P < 0.05. g, Peri-SWR response magnitude (mean ± s.d.) for all active CA3SCs in the RC-S task (Other, n = 3,371; Place, n = 1,644; Cue-Place, n = 198; Cue, n = 501; n = 4 mice; one-way ANOVA with Tukey’s post hoc test: main effect of ROI type, P = 2 × 10⁻¹⁶). Cue-CA3SCs with significant place fields are plotted separately from cue-CA3SCs (Cue-Place, crimson). *P < 0.05.
Random cues recruit and modulate CA3SCs
To understand how CA3 output encodes sensory experience independently of space, we first analysed trial-averaged CA3SC activity centred on random presentations of novel cues in the RC-NS condition. We found that a subset of CA3SC ROIs positively responded to sensory stimuli, mostly preferring a single cue modality (termed ‘cue-CA3SCs’; Fig. 1d, e). We observed that the magnitude and specificity of these sensory responses of CA3SCs often evolved monotonically over trials (Extended Data Fig. 3f) in a manner not readily explained by running behaviour (Extended Data Fig. 3g–j). To characterize these trial-by-trial changes in the response properties of cue-CA3SCs and identify subpopulations within the cue-specific CA3SCs, we used tensor decomposition of multidimensional time-series data (tensor component analysis, TCA) followed by K-means clustering (Fig. 1f and Extended Data Fig. 4). This analysis, in line with a similar principal-component analysis (PCA)-based analysis (Extended Data Fig. 5d–g), confirmed that the majority of cue-CA3SCs displayed amplification of response magnitude across trials (‘Up’ cluster) while a separate subpopulation showed gradually attenuating positive responses (‘Down’ cluster) (Fig. 1g, h). CA3SC cue specificity was stable across trials irrespective of whether the responses gradually increased or decreased (Extended Data Fig. 5a, c). Response latencies between clusters showed some change over trials as magnitudes evolved but were initially similar across modalities (Extended Data Fig. 5b). Thus, CA3 output undergoes rapid, within-session reorganization to represent novel sensory stimuli independently of spatial location.
Cue-CA3SCs are adaptively suppressed in SWRs
To explore the conditions under which recent sensory experiences are incorporated into lasting memories, we next sought to determine whether cue-CA3SCs during the RC-NS condition (Fig. 2a) were recruited to SWRs. We found that the majority of CA3SCs showed time-locked activation around awake SWR onset during inter-stimulus periods (Extended Data Fig. 6a, d). However, a smaller subset of CA3SCs were strongly suppressed during SWRs and showed delayed activation following SWR termination (Extended Data Fig. 6a). Strikingly, we found that these SWR-suppressed CA3SCs corresponded to cue-CA3SCs while other, non-cue-responsive CA3SCs were preferentially recruited to SWRs (Fig. 2b, c). This finding was reproduced across various CA3SC axonal ROI curation conditions (Extended Data Fig. 7a–k) as well as with direct imaging of CA3 cell bodies (Extended Data Fig. 7l–r). This SWR-associated suppression of cue-CA3SCs was also experience dependent: before exposure to sensory cues, cue-CA3SCs were indistinguishable from other, non-cue-responsive CA3SCs in their SWR responses, but, once acquired, SWR suppression persisted into poststimulation sessions (Fig. 2c–f and Extended Data Fig. 6f). A separate three-factor (ROI, peri-SWR time, trial) TCA analysis revealed that SWR-related suppression of cue-CA3SCs developed gradually over trials under the RC-NS condition (Extended Data Fig. 6e) and was present for all cue modalities and transition profiles (Up, Down, unclustered) (Extended Data Fig. 6b). TCA analysis of non-cue-responsive CA3SCs corroborated the observation that these CA3SCs are not suppressed around SWRs (Extended Data Fig. 6e). Finally, when mice ran on a spatially cued belt with random sensory cues that were now already familiar to the mice (RC-S condition on day 4; Fig. 2a), we found that a subset of non-cue-responsive CA3SCs showed spatially tuned (‘place cell’)21 activity and were reactivated during SWRs while cue-CA3SCs, together with the small subset of spatially tuned cue-CA3SCs, were suppressed to a similar extent as in the RC-NS condition (Fig. 2g and Extended Data Fig. 6c). Thus, while CA3SCs rapidly reorganize to encode novel sensory stimuli, the projections encoding these cues are selectively excluded from SWRs if the cues are not behaviourally relevant. At the same time, CA3SCs carrying potentially useful spatial information are reliably recruited to SWRs.
Flexible reactivation during SWRs
Given that CA3SCs encoding spatially uninformative cues were excluded from SWR events, we then asked whether cue-CA3SCs would be reactivated in a utility-dependent fashion if they carried navigationally useful information. To address this question, we imaged CA3SCs during the FC-S condition, i.e., with cues presented at fixed locations and in a fixed order on the treadmill and thus offering navigational value (day 5; Figs. 1b, c and 3a).
Fig. 3 |. Adaptive switch in reactivation of cue-CA3SCs during SWRs.
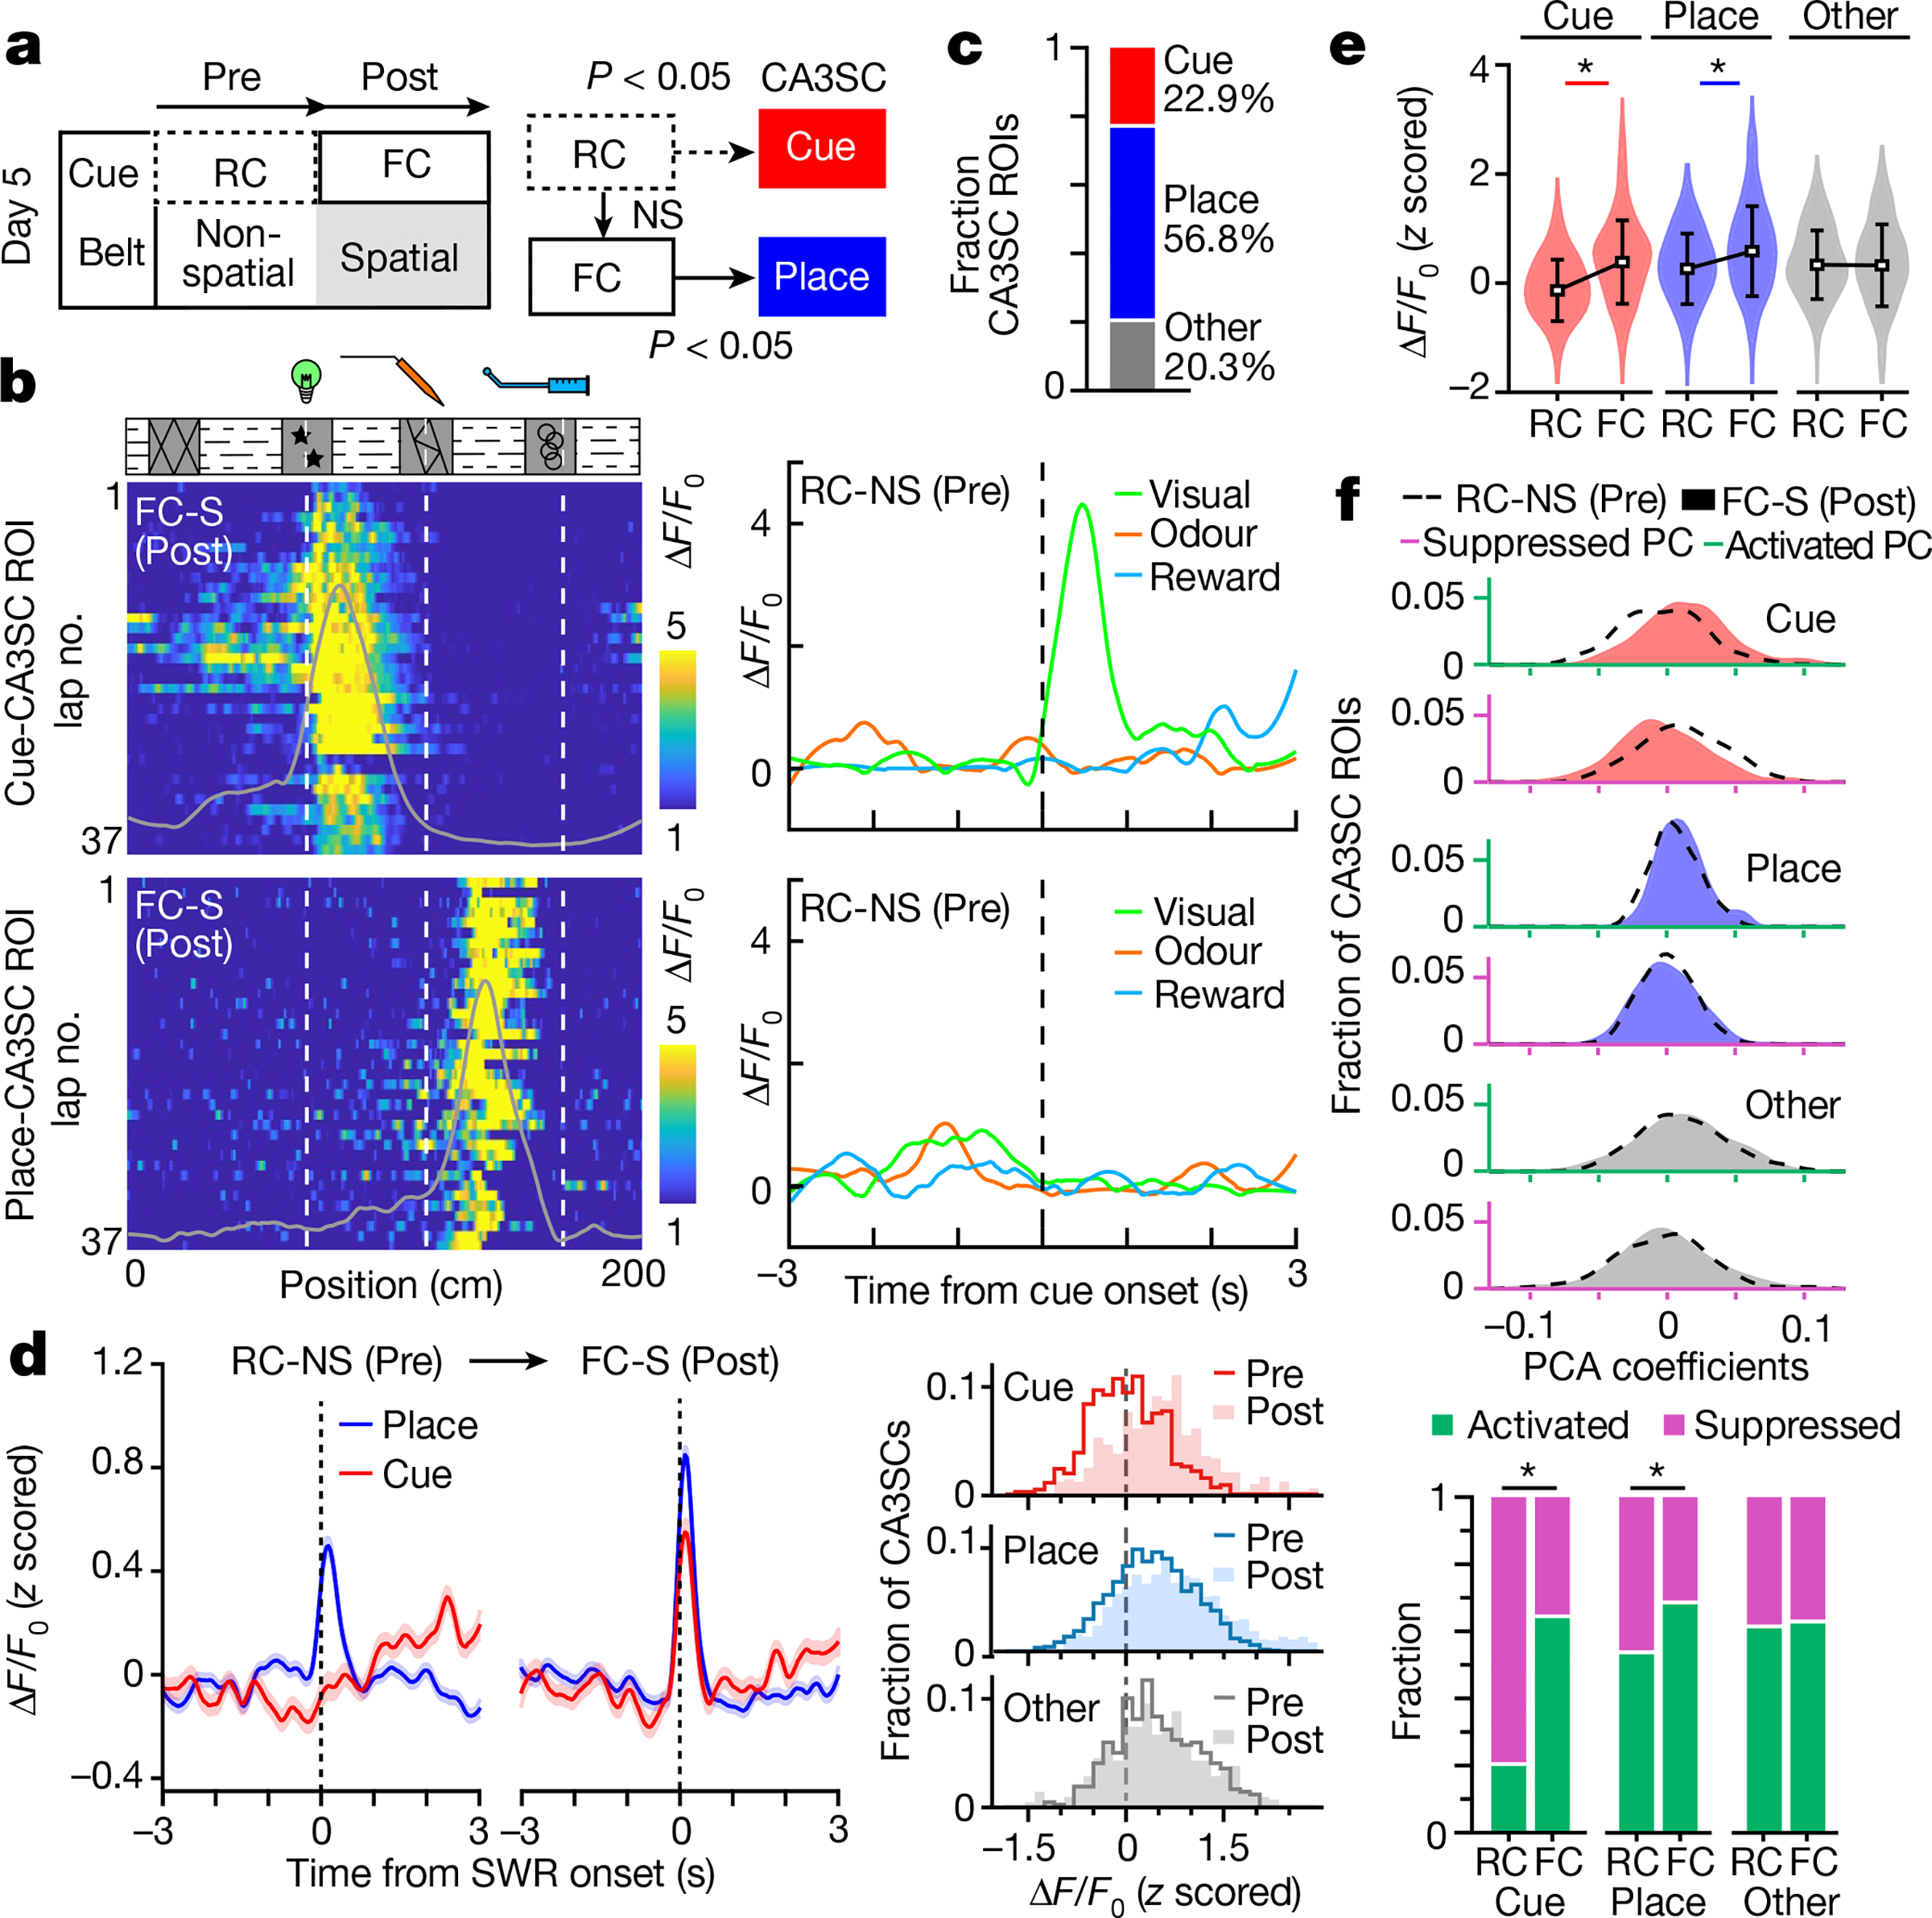
a, Left, design of the imaging session on day 5. Random sensory cues were presented on a non-spatial belt (RC-NS, Pre) before fixed cue and spatial (FC-S, Post) trials. Right, diagram of CA3SC ROI classification (Extended Data Fig. 8). NS, not significant. b, Left, lap-by-lap ΔF/F0 of a representative visual cue-CA3SC (top) and place-CA3SC (bottom) during the spatial task (Post). Right, average response of the same ROIs in the Pre trial. c, Fraction of cue-responsive (red), place-responsive (blue) and other (grey) CA3SCs. d, Left, comparison of peri-SWR response (mean ± s.e.m.) for cue- and place-CA3SCs from Pre and Post trials. Right, distributions of peak responses for cue-selective (top), place-selective (middle) and other (bottom) CA3SCs in the Pre (contour line) and Post (fill) trials. e, Summary (mean ± s.d.) of peri-SWR response magnitudes (Cue (red), n = 470; Place (blue), n = 1,170; Other (grey), n = 418; n = 3 mice; two-way ANOVA with Tukey’s post hoc test: RC × FC, P = 3.3 × 10⁻¹⁰; ROI type, P = 9.4 × 10⁻²⁶; interaction, P = 6.9 × 10⁻¹¹). *P < 0.05. f, Top, distributions of factor loadings for each principal component representing SWR-associated suppression and activation coefficients of all CA3SCs shown in c–e. Bottom, fraction of SWR recruitment of CA3SCs in the RC-NS and FC-S tasks (two-sided Fisher’s exact test: Cue, P = 1.1 × 10−43; Place, P = 1.9 × 10⁻¹³; Other, P = 0.72). *P < 0.05.
First, to differentiate between cue- and place-CA3SCs, we classified CA3SCs on the basis of their activity profiles during an RC-NS session (Pre) and a subsequent FC-S session (Post; Fig. 3a and Extended Data Fig. 8a, b). As expected, the majority of cue-CA3SCs in the RC-NS condition exhibited spatially selective firing fields in the FC-S condition, while another subset of CA3SCs had no cue response in the RC-NS condition but exhibited place fields in the FC-S condition (place-CA3SCs) and the rest of the CA3SCs showed neither place nor cue responses (Fig. 3b, c and Extended Data Fig. 8b, d). The place fields of cue-CA3SCs during the FC-S condition were enriched around the locations of their preferred cues with a spatial offset, although some cue-CA3SCs had additional firing fields away from their preferred cue; in contrast, the place fields of place-CA3SCs were more evenly distributed on the belt (Extended Data Fig. 8c).
We next examined changes in SWR recruitment of CA3SCs from RC-NS to FC-S (when the same set of sensory cues switched from being random to behaviourally relevant). Place-CA3SCs were already activated during SWRs in the RC-NS condition and were more robustly recruited during the FC-S condition (Fig. 3d, e). We found that cue-CA3SCs, which were suppressed during SWRs in the RC-NS condition, became strongly recruited to SWRs during the FC-S condition once the cues were fixed in space (Fig. 3d–f). Finally, we found that once cue–place associations had formed in FC-S, subsequent reversal to a random cue schedule did not suppress cue-CA3SC SWR recruitment; instead, it led to enhanced reactivation of cue-CA3SCs during SWRs (day 6; Extended Data Fig. 8e, f). Thus, SWR recruitment of CA3SCs reflects the behavioural utility of the sensory stimuli they encode. This estimate of behavioural relevance is dynamically updated: the SWR suppression of cue-CA3SCs encoding irrelevant stimuli progressively increases with experience. However, a cue-CA3SC tuned to a spatially uninformative stimulus can switch from being suppressed to being activated around SWRs if the stimulus switches from a random to a fixed presentation and thus gains behavioural utility.
Replay of cue-driven cognitive maps
The preceding results demonstrate that SWRs selectively recruit CA3SCs in accordance with their behavioural utility. However, whether previously suppressed cue stimuli are replayed in spatial order during these events remains unclear. To address this question, we assessed place coding within CA3SCs in FC-NS sessions where only the three fixed-position sensory cues provided spatial information for the animal on an otherwise un-cued belt (day 7; Fig. 4a and Methods). This paradigm uniquely allowed us to determine whether previously suppressed cue patterns can be reinstated by replay events when behaviourally required, in the absence of other spatial information. We found robust and reliable spatial tuning of CA3SCs (‘cue-place-CA3SCs’) during exploration in this task. The place fields of cue-place-CA3SCs spanned the environment as opposed to solely encoding cue locations and were organized in a small number of well-separated clusters according to place field centres (Fig. 4a). Thus, sensory cues tied to sparse fixed positions alone were sufficient to drive the formation of comprehensive spatial maps in the CA3.
Fig. 4 |. Replay of sensory cue-driven cognitive maps in CA3SCs.
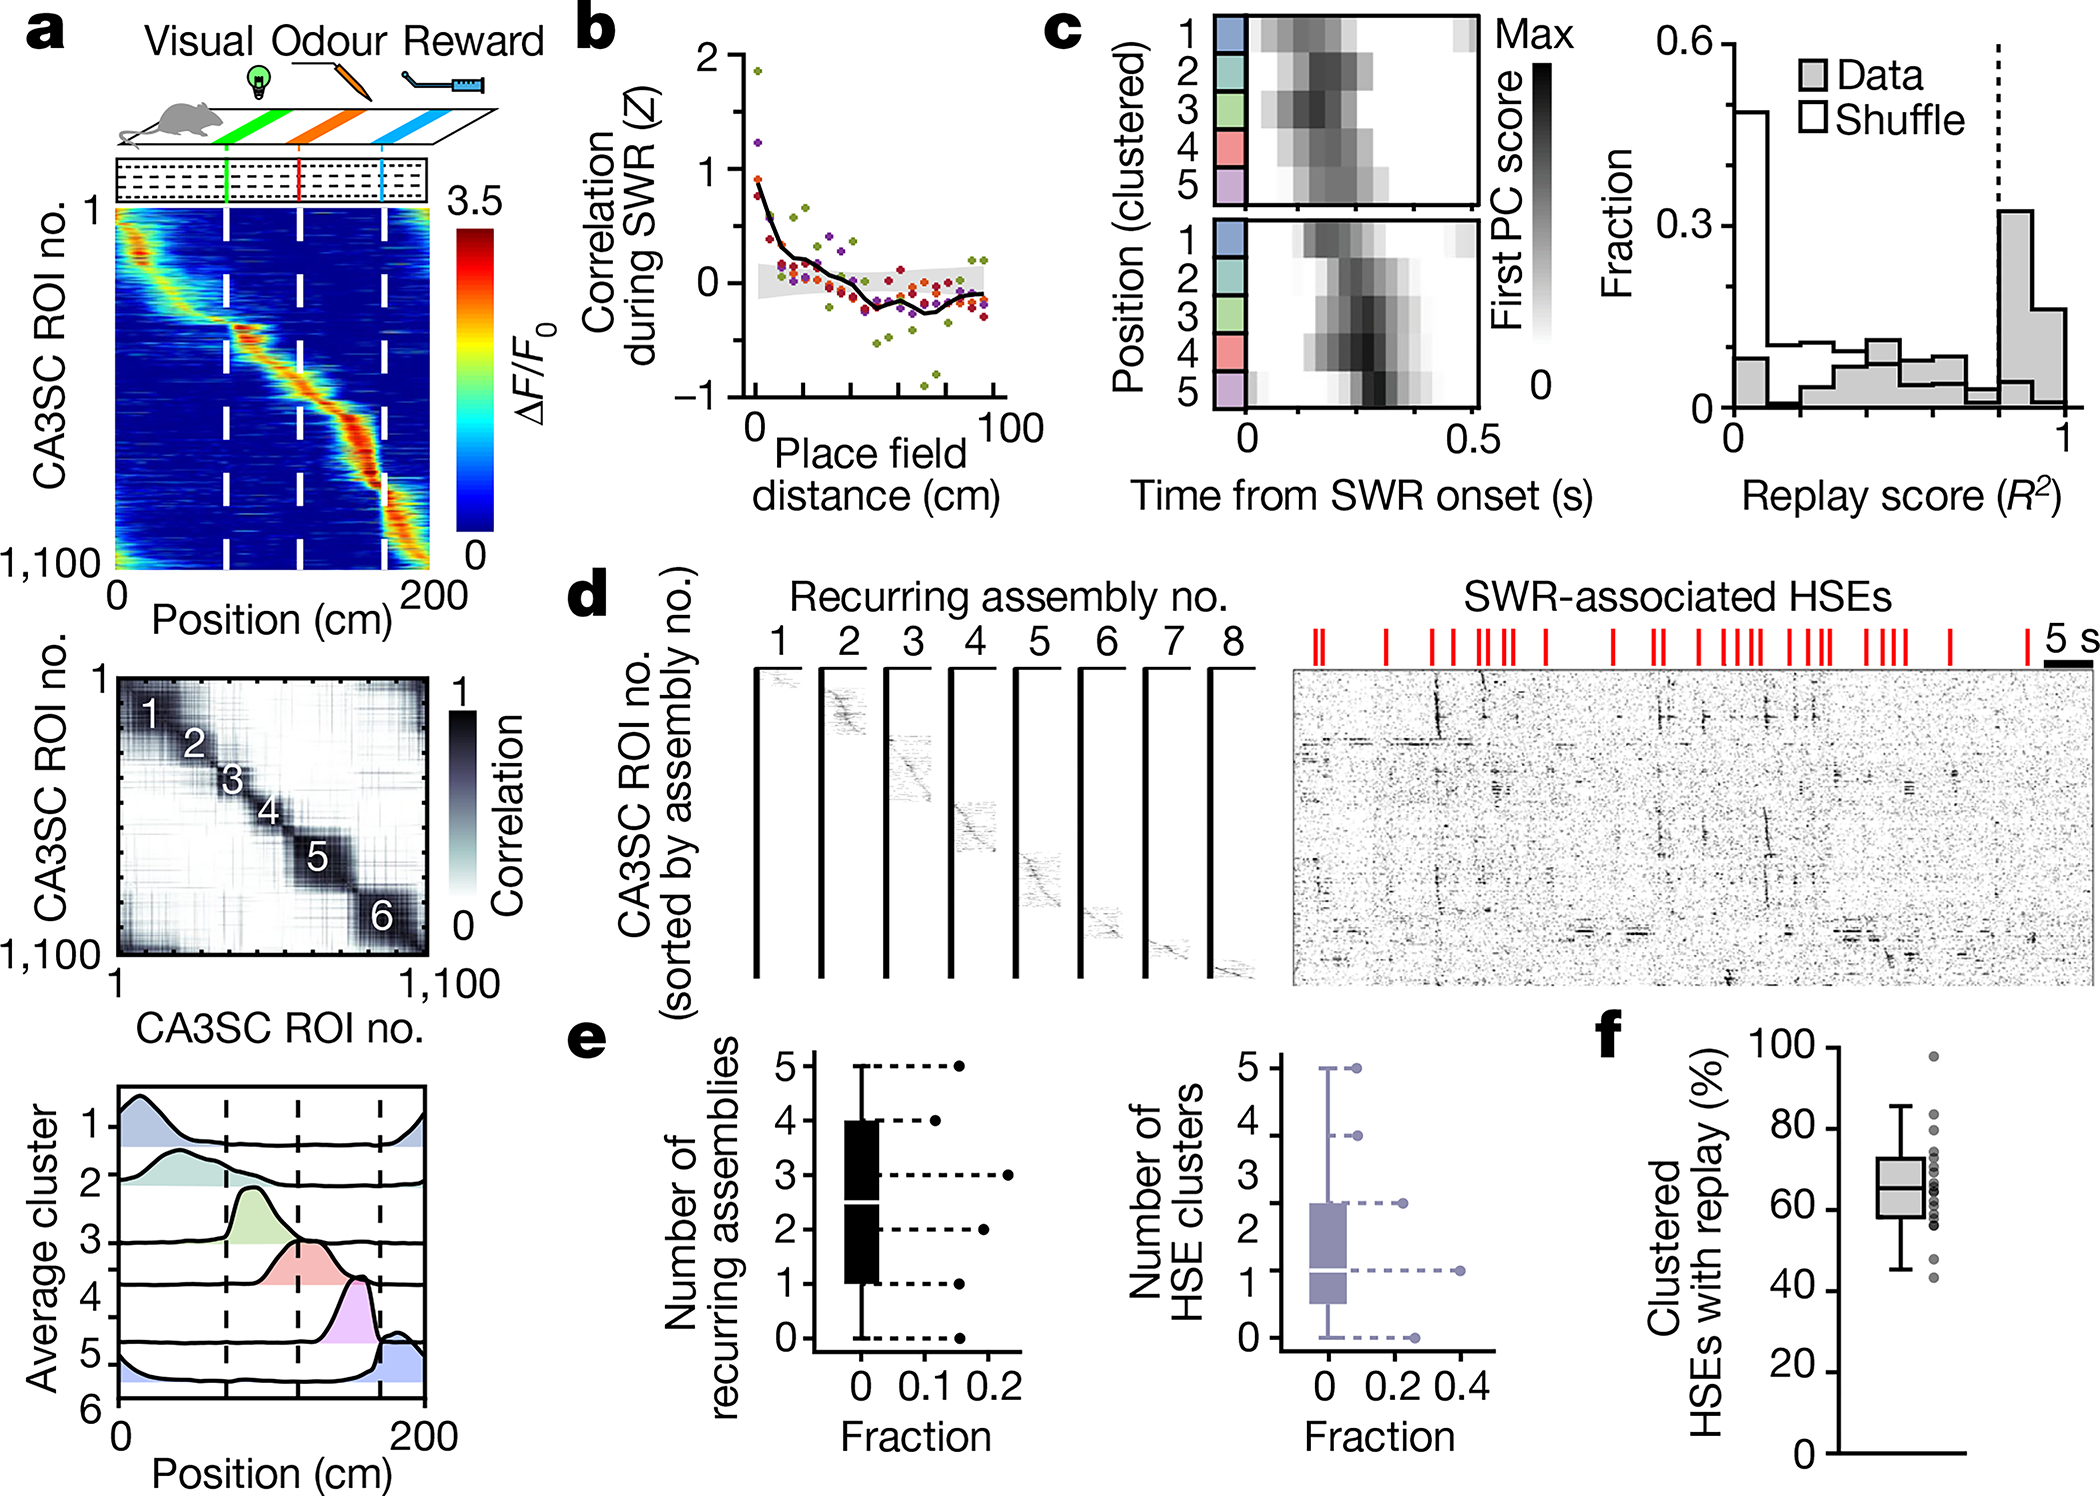
a, Top, schematic of the fixed cue and non-spatial (FC-NS) task with an activity heatmap in which CA3SC ROIs are sorted by peak activity as a function of position for CA3SC ROIs with place fields. Middle, correlation matrix of the same CA3SCs. Bottom, average place field profile for discrete clusters identified on the basis of similarities between cue-evoked place fields (Methods). b, Pairwise cross-correlation at zero-time lag during SWR-associated HSEs for all CA3SCs with a place field, plotted against their place field peak in bins of 5 cm (n = 1,666,282 pairs, n = 4 mice). Each colour corresponds to an individual mouse; the black line indicates the mean with the grey shaded area indicating the 97.5% confidence interval from shuffled pairs. c, Left, representative SWR-associated replay events. Colours correspond to the clustered places from a (bottom). Right, distribution of real (grey) and shuffled (white) replay scores. Dashed line, 95th percentile (shuffle). d, Recurring assemblies of cue-place-CA3SCs during HSEs. Left, eight recurring sequential factors detected by convNMF (Methods and Extended Data Fig. 10). Right, ΔF/F0 traces sorted by latency of peak activation within the assembly. e, Left, number of recurring assemblies in HSE clusters. The white line indicates the median; box edges correspond to 25th and 75th percentiles. Whiskers extend to the maxima and minima. Right, number of HSE clusters in which each recurring assembly participated (n = 28 HSE clusters, n = 4 mice). f, Box plot indicating the fraction of recurring assembly-containing HSEs in each cluster that also contained replay sequences (n = 19 HSE clusters with assemblies from four mice). Whiskers extend to the maxima and minima, with outliers excluded. Dots correspond to individual HSE clusters.
During periods of immobility, cue-place-CA3SCs were transiently activated with a high degree of synchrony around SWRs (Extended Data Fig. 9a–c). If these SWR-associated high-synchrony events (HSEs) represent bona fide memory replay events, cue-place-CA3SCs representing similar positions should be reactivated more closely together in time12,13. Indeed, pairs of CA3SCs with nearby place fields showed stronger correlations (Fig. 4b), indicating pairwise reactivation of cue-driven CA3SC place fields. We next assessed the sequential nature of these putative replay events18 (Fig. 4c and Methods) and found that 62% of SWR-associated HSEs contained structured replay sequences of place maps. Finally, we asked whether HSEs recruit discrete neuronal assemblies. To address this question, we first sought to identify distinct recurring assemblies within HSEs using convolutional non-negative matrix factorization (Methods and Extended Data Fig. 10). We found multiple recurring assemblies across SWR-associated HSEs (Fig. 4d). These events fell into clusters that consistently recruited weighted combinations of identified recurring assemblies (Fig. 4e and Extended Data Fig. 9e–g) and contained replay information (Fig. 4f). Thus, CA3SC spatial representations generated by task-relevant sensory cues are robustly replayed during SWRs.
Discussion
Here we demonstrate that recruitment or exclusion of cue-driven CA3SC activity patterns from awake, post-experience SWRs is determined adaptively by the behavioural utility of the sensory stimuli. These findings suggest that SWR recruitment encodes the animal’s internal estimate of the relevance of the encoded stimulus. We speculate that local circuit interactions22,23 may govern the dynamic recruitment of CA3 cells during SWRs. Parallel processing of spatial and sensory information by heterogeneous subcircuits may support flexible stimulus selection through plasticity of reciprocal inhibition24. The protracted suppression and subsequent delayed activation of cue-CA3SCs following SWRs strongly suggest a role for subtype-specific GABAergic input25 or subcortical neuromodulation in this phenomenon. Alternatively, stimulus selection may be implemented upstream of CA3 and mapped onto distinct CA3 subcircuits22,23.
Our findings further demonstrate that the representational content of SWR-related reactivation differs from that of sensory experience26,27 and establish adaptive exclusion of behaviourally irrelevant and potentially distracting sensory stimuli from reactivation. Standard models of associative learning assume that memory specificity is primarily supported by selective encoding of behaviourally relevant information through attentional and sensory gating mechanisms3,4. However, we find robust activity at the level of CA3 output encoding behaviourally uninformative cues, which, if repeatedly reactivated during awake SWRs, may impede consolidation of behaviourally informative associations. We propose that utility-dependent adaptive exclusion and recruitment of sensory experience during memory replay represents a general coding principle to minimize long-term consolidation of spurious associations, separate positive and negative reinforcers8,27,28 and organize complex conceptual representations and hierarchical associations during inferential reasoning2,9. Such a mechanism would complement attentional modulation that occurs during encoding3,4,6,7 to jointly support memory specificity in a dynamic environment.
We find that ‘distractor’ stimuli, even if salient in experience, are shunned from replay events; instead, the animal selectively consolidates only those representations that model the conserved underlying structure of its environment. Our work thus lends credence to the hypothesis that replay events reveal the organism’s working model of the deeper structure of its world29. Our results suggest that initial broad encoding of sensory information in the CA3–CA1 circuitry is followed by utility-dependent refinement during replay to promote selective access to and consolidation of relevant memory traces supporting adaptive behaviours.
Online content
Any methods, additional references, Nature Research reporting summaries, source data, extended data, supplementary information, acknowledgements, peer review information; details of author contributions and competing interests; and statements of data and code availability are available at https://doi.org/10.1038/s41586-021-04118-6.
Methods
All experiments were conducted in accordance with US National Institutes of Health guidelines and with the approval of the Columbia University Institutional Animal Care and Use Committee. No statistical methods were used to predetermine sample sizes, which were similar to those reported in previous publications30,31. The experiments were not randomized, and the investigators were not blinded to allocation during experiments and outcome assessment.
Mice
For all experiments, we used adult (8–16 weeks) male and female Grik4-cre transgenic mice (C57BL/6-Tg(Grik4-Cre)G32–4Stl/J, The Jackson Laboratory, Jax 006474; n = 6 mice for axonal imaging, n = 6 mice for somatic imaging). Mice were housed on a 12-h light/12-h dark cycle in groups of 2–5 mice (temperature, 22–23 °C; humidity, 40%) and individually after surgery for implantation.
Virus injections and imaging window/silicon probe implantation
Viral injections were performed with a Nanoject syringe, as previously described19,32,33. Briefly, mice were anaesthetized with isoflurane and treated with buprenorphine or meloxicam for analgesia and 200 nl of Cre-dependent recombinant adeno-associated virus (rAAV) expressing GCaMP6f under the control of the Syn1 promoter (rAAV1.Syn.FLEX. GCaMP6f.WPRE.SV4; Addgene, 100833; titre, 1 × 10¹³ viral genomes per ml; referred to as rAAV2/1:Syn(GCaMP6f)Cre) was injected into the left hippocampal CA3 (AP −2.2, ML −2.5, DV −2.4, −2.5 and −2.6 mm, with respect to the bregma). After 3–4 d for recovery, mice were implanted with an imaging window (diameter, 3.0 mm; height, 1.5 mm) over the left dorsal hippocampus as well as a steel head-bar for head fixation and a four-channel linear silicon probe in the right (contralateral) CA1 (AP −2.2, ML 2.75, DV −1.0) at a 45° angle. Mice recovered after surgery for 3–4 d before training sessions commenced. For somatic imaging of CA3 pyramidal cells, Cre-dependent rAAV expressing GCaMP7f (rAAV1. Syn-FLEX-jGCaMP7f-WPRE; Addgene, 104492) was injected into the left hippocampal CA3 at two locations (AP −1.3, ML −1.6, DV −2.1 and −1.9; AP −1.6, ML −1.9, DV −2.2 and −2.0; 30 nl for each DV step).
Sequential sensory–place associative paradigm
Mice were imaged during either an RC or FC condition on either a belt without textured segments or tactile cues (NS) or a belt decorated with various tactile cues (S). The S belt was constructed similarly to belts in previous studies19,20. In our case, the belt was composed of four textured segments of 20 cm each separated by a 30-cm segment of burlap belt. Each textured segment was made of a different fabric (such as felt or velvet, but not burlap) onto which small foam stickers were glued.
Both the NS belt and the S belt were 200 cm long. Imaging began after 2–3 d of head fixation and habituation to the experimental setup. In the RC condition, three sensory cues (odour, light and a non-operant water reward) were presented pseudo-randomly at 10 trials per cue. Cues were presented for 0.75 s, and each presentation was separated by a pseudo-random inter-stimulus interval of 20–50 s. In the FC condition, cues were presented for 0.75 s when mice entered fixed locations evenly spaced (every 30 cm) along the treadmill. The visual cue was presented in the first location, odour was presented in the second location and the reward was delivered in the third location. A blue-light LED flash was used as the visual cue, and one odour was selected from isoamyl acetate, I-(−)-limonene or I-(−)-carvone (Sigma-Aldrich) for each mouse. Odorants dissolved in mineral oil were passed through tubing in front of the mouse’s snout through a mineral oil-infused stream of compressed air that was evacuated by vacuum at the same speed it was delivered to avoid prolonged exposure. During spatial tasks, reward was delivered operantly, meaning that more licks triggered additional water drops (one additional drop for two licks, with a time-out of 1 s), which was necessary to motivate the animals to complete more laps.
On day 1, RC was carried out on an NS belt (RC-NS), which was made of burlap. The RC-NS session was interleaved between two 15-min resting sessions (Pre and Post) without sensory stimulation to record SWRs before and after sensory stimulation. After RC-NS (day 1), mice were trained to run on a treadmill with a textured S belt for 2–3 d. There were no novel stimuli in the environment in the following sessions (RC-S on day 4, FC-S on days 5 and 6, and FC-NS on day 7). On day 4, the mouse ran on a textured belt while sensory cues were randomly presented independently of the mouse’s location. On day 5, mice were imaged in the FC-S condition following an RC-NS Pre session. To remove any spatial confounding, the treadmill wheels were locked during the Pre session with mice positioned at a homogeneous and un-cued area on the S belt.
On day 6, FC-S was also carried out, first followed by an RC-NS session with the treadmill locked. Finally, we used an NS burlap belt in an FC session to remove spatial components from the treadmill while the sensory cues were presented at the same fixed locations (FC-NS, day 7). Thus, in this session, only the visual, odour and reward cues were presented and the belt did not contain any textured segments or tactile cues. This paradigm uniquely allowed us to answer questions regarding SWR-related replay for two reasons: first, the absence of other spatial information allowed us to definitively determine whether previously suppressed cue patterns can be reinstated by replay events when behaviourally required and, second, the sparsity of spatial cues allowed us to resolve and dissect the internal structure of these replay events.
To examine the relationship between behavioural performance and each sensory stimulation paradigm, we used a generalized linear model (GLM) to fit velocity with position bins as regressors (Extended Data Fig. 3a–e). GLM fitting was carried out for each 50 cm after the onset of visual stimulation as well as in the interval between odour stimulation and reward location. GLM coefficients represent the degree of velocity change (acceleration or deceleration) in response to sensory stimuli. We compared this sensory-driven behavioural control across each session. GLM-predicted velocity was normalized within each mouse. Behaviour data were collected using custom software implemented in Java via a microcontroller (Arduino DUE) on the treadmill.
In vivo two-photon imaging and data preprocessing
All imaging was conducted using a two-photon 8-kHz resonant scanner (Bruker) and ×40 or ×16 near-infrared (NIR) water-immersion objectives (Nikon, 0.8 NA, 3.5-mm and 3.0-mm working distance, respectively). For axonal imaging, we acquired images of 300 × 300 μm2 (512 × 512 pixels) at 30 Hz using a 920-nm laser (50–100 mW, Chameleon Ultra II, Coherent) from CA3SCs in the CA1 SR, 50–150 μm below the SP. For somatic imaging (Extended Data Fig. 7l–r), images of 450 × 450 μm2 (512 × 512 pixels) were acquired and the focal plane was located about 450 μm below the surface of the brain, in distal CA3. We adjusted the angle of the mouse’s head using two goniometers (±10° range; Edmund Optics) to align the SP with the horizontal two-photon imaging plane. Green (GCaMP) fluorescence was detected with a GaAsP PMT (Hamamatsu, model 7422P-40).
The preprocessing steps for acquired fluorescence signal using the SIMA software package were described in our previous work19,31–33. After SIMA-based motion correction, we detected CA3SC ROIs, extracted signals and calculated neuropil-decontaminated ΔF/F0 using the Suite2p software package with built-in neuropil subtraction34. Suite2p was chosen as it enables automatic ROI detection while imposing a minimum required decorrelation from surrounding pixels, thus mitigating signal contamination from neighbouring structures possibly emanating from the same CA3 cell body. The quality of automated ROI detection was validated by cross-checking key findings against alternative curation strategies: Suite2p-based detection with an increased decorrelation threshold (2.0 versus the default setting of 1.0) and manual ROI curation (Extended Data Fig. 7). All recordings were visually assessed for residual motion, and any data with uncorrected motion artefacts were discarded from further analysis. Subsequent image analysis was performed using custom-written routines in Matlab (MATLAB 2019a).
To quantify signal instability artefacts due to x, y or z drift or any other source that might have caused trial-to-trial changes in our imaging field, we computed the average FOV between the presentation of cue n −1 and cue n and then computed pixel-wise correlation coefficients between FOV time averages (Extended Data Fig. 2a–c). To address frame-by-frame uncorrected motion and its potential effect on computation of cue responsiveness, we calculated the mean squared error (MSE) between each imaging frame in an imaging session and the motion-corrected time average of that session. For each mouse, MSE was measured across all frames as well as between frames, corresponding to ±3 s surrounding stimulus presentation (‘Stim. trials’). To quantify any interaction between frame-by-frame and trial-by-trial stability, we chunked peri-stimulus MSE measurements into three bins according to trial number, computed peri-stimulus time histograms (PSTHs) of MSE and quantified whether the frame-by-frame stability of our recordings evolved over time in case, for example, the physical responses of animals to stimuli adapted with experience (Extended Data Fig. 2d–i). For all experiments, ROIs were tracked within but not across days.
Note that, while CA3 cell bodies are accessible with two-photon imaging, current instantiations of this approach are limited to relatively small FOVs and numbers of recorded neurons35–37. Our axonal imaging approach offers a more unbiased sampling of CA3 inputs to the CA1 with a larger overall number of units, but it also has shortcomings: it does not allow us to determine the precise number of independent cells imaged or to track them over multiple days. Furthermore, while axonal GCaMP–calcium dynamics are generally thought to serve as a reliable proxy for somatic activity38–40, it is in principle possible for axonal and somatic activity to become dissociated, for example, during fast network oscillations41.
Silhouette score
The silhouette value is a scalar between −1 and 1 that quantifies how well a point fits into a cluster under a given clustering. Intuitively, a point is well clustered if, under some distance metric d, it is highly cohesive with other points in its cluster and well separated from any other cluster. A clustering, i.e., a cluster labelling of the entire dataset, is of high quality if, on average, a point is cohesive with other points in its own cluster and well separated from points in other clusters. The silhouette method formalizes this intuition. The cohesion of a point i with respect to its cluster Ci is defined as
| (1) |
i.e., the mean distance of point i to points in its own cluster Ci; its separation from other clusters is defined as
| (2) |
i.e., the mean distance of i to the points in the ‘closest’ other cluster. The silhouette value of a point i with respect to cluster Ci is defined as
| (3) |
The silhouette score or silhouette coefficient is defined as the mean s(i) for all points under that clustering.
Identifying ROIs from the same axon
Ward’s hierarchical clustering was performed on the pairwise correlation matrix of ROIs from each FOV to identify instances where multiple ROIs represent different segments of the same axon. To estimate the number of unique CA3 units imaged, the hierarchical clustering result was flattened to K clusters for all values of K from 2 to 767 (the total number of ROIs). The ideal clustering would identify K* clusters where each cluster contains only segments from one axon and the K* different clusters correspond to the K* unique CA3 units imaged. Each clustering was evaluated through its silhouette values: the 25th, 50th and 75th percentiles of ROI silhouette values were plotted for each K. The value of K for which adding one additional cluster improved the median silhouette value the most was taken as the estimate of K*.
LFP recording and SWR detection
Wide-band LFP signals were recorded at 25 kHz using a digital acquisition system (RHD2000, Intan Technologies) and downsampled to 1.25 kHz. For each mouse, the recording site closest to SP from the four channels was identified based on the amplitude of ripple events and the prominent polarity of sharp waves in SR and SO. SWRs were detected from the wavelet spectrograms of bandpass-filtered (80–270 Hz) LFPs during awake immobile states (running periods were removed). Candidate SWRs were defined as high-frequency LFP events with wavelet power more than 2.5 s.d. above baseline and a duration of longer than 20 ms within the ripple frequency band (100–250 Hz). SWRs that occurred within 200 ms of one another were merged. Detection performance was visually assessed, and false-positive events were manually discarded. LFP signal analysis was performed using custom-written routines in Matlab (MATLAB 2019a).
Perfusion, tissue processing and confocal imaging
Proper virus confinement to hippocampal CA3 was confirmed after the completion of all imaging experiments. Mice were transcardially perfused with 40 ml of ice-cold PBS (Thermo Fisher Scientific), followed by 40 ml of ice-cold 4% paraformaldehyde (PFA, Electron Microscopy Sciences). Brains were stored overnight in 4% PFA at 4 °C. The next day, the 4% PFA was removed and the brains were rinsed three times for 5 min each in PBS. Coronal sections (75 μm) of the hippocampus were cut on a vibrating microtome (Leica, VT1200S) and washed three times for 15 min each in PBS. Sections were mounted on glass slides in Fluoromount-G aqueous mounting medium (Thermo Fisher Scientific) and coverslipped. The slides were allowed to dry at 4 °C for at least 1 h before confocal imaging. A Nikon A1 confocal microscope was used to acquire fluorescence images of the labelled tissue sections; several sections were imaged in each mouse to confirm appropriate viral expression. A 488-nm laser line was used for excitation. Tile scans of the dorsal hippocampus were acquired with a ×10 Plan Apo 0.45-NA objective (Nikon) at ×1 zoom. Images of 1,024 × 1,024 pixels were acquired every ~3 μm through the entire depth of the tissue sections, with the pinhole size set to ~1 Airy unit. Fluorescence was collected with a GaAsP PMT. The resulting z stacks were viewed in Fiji (NIH).
Shuffling test for cue preference and place field detection
Shuffling methods were used to identify the sensory cue preference of CA3SCs. The smoothed PSTH (15 temporal bins of 33.33 ms; Savitzky–Golay filter) was estimated from the onset of sensory cues with a time window of ±3 s. Then, the PSTH around cue presentation, Do(t), was computed:
| (4) |
where λaft(t) is averaged ΔF/F0 in the tth bin after cue onset and λbfr(−t) is that in the tth bin before onset. As a shuffling test, the onsets for PSTHs were randomly chosen from bins within a session and the PSTHs were recomputed. This resampling process was repeated 1,000 times to obtain the significance threshold of P < 0.05 (two-tailed test, α = 2.5% on each side) at each bin. To prevent type 1 error resulting from multiple comparisons, P values were adjusted by Bonferroni correction on the basis of the number of bins and cues tested. CA3SC ROIs with at least 10 consecutive temporal bins exceeding the threshold were defined as cue-CA3SCs.
For PSTHs used to calculate the spatial tuning of CA3SCs, λ(p) was computed as the averaged ΔF/F0 from the frames at each 1-cm position bin during running periods. Position bin assignments were randomly permuted across frames within each lap, and shuffled PSTHs were re-estimated 1,000 times using this strategy. Using these resampled PSTHs, a statistical threshold P value (5% for one side) at each position bin was computed. Bonferroni correction was performed to position bin size. Transients with at least five consecutive position bins (i.e., 5 cm) exceeding the threshold were identified as place fields.
Tensor component analysis
Overview.
The dataset collected in this study exhibits a natural tensor structure: the responses of N ROIs were recorded in S (=3) distinct cue conditions, with K trials per cue, each consisting of T temporal samples. The dataset X was thus arranged in an N × T × K × S tensor (Extended Data Fig. 6a). We wished to exploit this natural tensor structure to identify ROIs with similar intra- and inter-trial responses to each cue. TCA was used as a multi-axis dimensionality reduction tool to identify activity patterns shared across CA3SCs and across multiple animals. A non-negativity constraint was not used. The advantage of using TCA over PCA was that common within-trial trends, multitrial dynamics and cue preferences could be extracted jointly: one component may correspond, for instance, to a cluster of ROIs that exhibit a strong positive intra-trial response to odour cues, which increases over trials (‘Up’) (Fig. 1f–h). The ROI factor (analogous to loadings in PCA) of each component is a scalar measure of the strength of each ROI’s association with that component. The ROI factors of components that describe responsiveness to only one cue (i.e., >90% of the cue factor weight is concentrated in one cue) were selected as a natural feature space in which to cluster ROIs by their intra- and inter-trial dynamics with respect to that cue.
To better reflect how it is used in the present study, we reformulated the TCA objective described in ref. 42 in a slightly different but mathematically equivalent manner, as we detail below.
TCA as dimensionality reduction.
Consider an N × T matrix X, corresponding to N neurons simultaneously recorded in a single trial of T time points. It is natural to apply dimensionality reduction followed by clustering on this data matrix to identify meaningful subpopulations in the data. PCA (with R components) decomposes the matrix X as the product AB, where B is an R × T row matrix of orthogonal components that capture activity patterns in the data shared across many cells and A is an N × R column matrix of ‘loadings’ with entries Bnr corresponding to a neuron n’s association with component r. Written another way, PCA approximates X as
| (5) |
with bi ⊥ bj and i ≠ j, where ⨂ denotes the outer product, also known as the tensor product. Subsequent clustering is performed using the loadings as features; when R = 2, this corresponds to clustering on the first two principal components.
TCA generalizes this idea to the case where the data X is a higher-order tensor: suppose X is now an N × T × K × S tensor (i.e., ). We are still interested in decomposing X into ‘loadings’ αr (referred to as ‘ROI factors’ or ‘axon factors’) and ‘components’ Yr:
| (6) |
to cluster the cells on the tensor components. Here each component Yr is itself a rank – 1 T × K × S tensor, capturing not just within-trial responsiveness but also across-trial dynamics and cue preference. When these components are additionally constrained to be orthogonal, this procedure reduces to PCA (see ‘PCA comparison analysis’ in Extended Data Fig. 8). The main innovation of our TCA approach here is that we remove this orthogonality constraint, as neuronal activity patterns are not necessarily orthogonal. Each component Yr can be written as
| (7) |
giving the full factorization
| (8) |
where the vectors correspond to ROI factors as before, correspond to within-trial responsiveness (referred to as ‘temporal factors’), correspond to inter-trial dynamics (referred to as ‘trial factors’) and correspond to cue preference or ‘cue factors’ (Extended Data Fig. 6). Round brackets have been omitted as the tensor product is associative. Detailed algorithms for computing this tensor decomposition, such as canonical polyadic decomposition, have been described in previous studies42.
To perform model selection, i.e., the number of components, we examined extracted components and reconstruction errors across multiple N ranks and ultimately used the minimum N necessary to capture trends of interest for further interrogation. This approach was taken because of the fact that, unlike in PCA, the first K components learned in a K + 1-component TCA model are not guaranteed to be identical to the components learned in a K-component model. Thus, we explored TCA models of various ranks for each question (up to 15 components for the TCA described in Fig. 1; Extended Data Fig. 4) to ensure that increasing model rank no longer yielded components that were meaningfully distinct from those previously seen.
K-means clustering on TCA-derived ROI factors.
To classify cue-CA3SCs on the basis of the trial-by-trial changes in cue response, we first found selected tensor components for which one cue was dominant in the cue factor (Extended Data Fig. 4b–e). TCA was carried out as described above across multiple ranks to determine the number of components sufficient to capture modality-specific variance (Extended Data Fig. 4e). An important limitation of TCA is that different runs may yield different results, as the algorithm only approximates an NP-Hard decomposition, which impacts the generalizability of the components. To make our results more robust and interpretable, we used K-means clustering on these modality-specific components with K = 5, followed by quantitative interpretation of the resulting clusters, to aid in identifying the ROIs with up and down dynamics. Clusters whose trial-by-trial evolution fit into one of these categories were labelled ‘Up’ or ‘Down’, while clusters that did not were labelled ‘Other’ to avoid artificially binarizing the data. To validate our clustering method, we examined inter-subject variability as a quality-control metric: the clusters corresponding to trial transition patterns observed in all mice were deemed meaningful, while clusters dominated by animal-to-animal variance were pooled into an ‘unclassified’ cluster.
TCA for SWR-associated CA3SC dynamics.
A similar procedure was performed to characterize how SWR-associated CA3SC dynamics evolved over time for cue-responsive and non-cue-responsive (other) CA3SCs (Extended Data Fig. 6e). We first separated CA3SCs into cue- and non-cue-responsive axons as described in the shuffling test for cue preference and place field detection. We then organized the raw data into third-order tensors ntk representing the peri-SWR (±300 ms) activity of cue-responsive or other CA3SCs n at time t on SWR event k. For both CA3SC populations, model selection was performed by inspecting models of ranks 1–10, and we found that a single-component TCA was sufficient to capture the primary response (temporal factor; Extended Data Fig. 6e) when we ran TCA on a by-mouse basis to eliminate subject-to-subject variability (e.g., brightness corresponding to viral expression, subtle effects arising from animal behaviour). Higher-rank models yielded components with similar temporal factor patterns but low tensor component scores for the trial factor, indicating that little additional insight was gained.
Information value
To characterize CA3SC populations by task condition-related activity, we computed the mutual information value between ΔF/F0 and the task condition types (FC or RC) using the following formula43:
| (9) |
where λi is the average ΔF/F0 at the ith position or time bin, λ is the overall mean ΔF/F0 and Pi is the probability density for the location or time spent (for example, 1/number of bins). We used the Kruskal–Wallis test to compare the information value between each CA3SC population.
Detection of HSEs
We smoothed and averaged (15-bin window; Savitzky–Golay filter) the ΔF/F0 values of all CA3SC ROIs to identify candidate HSEs associated with CA1 SWRs (Extended Data Fig. 9a–c). Frames associated with locomotion were removed, and HSEs were defined as transients on the population average that exceeded the mean by at least 3 s.d. HSE duration was computed as the number of frames from the first frame exceeding the threshold to the first frame in which the transient amplitude fell below 1.2 s.d. above the mean. Only candidate events within 0.5 s of SWRs were used for subsequent analyses.
To compute the latency of individual CA3SCs in HSEs, we extracted principal components of the population in each HSE within windows of ±3 s centred on HSE onset. A CA3SC was determined to have been ‘reactivated’ by an HSE if its peak cross-correlation with the first principal component was >0.5, and the CA3SC recruitment latency was defined as the ΔF/F0 correlation lag between each CA3SC and the first principal component within the peri-HSE window. Latency was calculated as the time of peak covariance between the normalized ΔF/F0 value of single ROIs and the first principal component of the population, relative to SWR onset (Extended Data Fig. 9c). Three local peaks can be seen at +0.03 s (1-frame delay), +0.25 s (5- to 8-frame delay) and +0.5 s (12- to 17-frame delay), suggesting sequential recruitment of ROIs by SWRs on a timescale of 0.5 s (20 frames).
Hierarchical clustering of place fields
To make subsequent analyses of reactivation order more robust, each CA3SC’s place field, a continuous variable, was converted into a scalar categorical variable (place cluster) via hierarchical clustering. CA3SCs with place fields were sorted into discrete clusters using Ward’s hierarchical agglomerative clustering algorithms on the basis of the similarity of place fields. The similarity metric for place fields was computed as the squared Euclidian distance between columns of the correlation matrix.
| (10) |
In Ward’s method, pairs of clusters to merge are chosen to minimize the error of squares in the merged cluster, which was iterated until the number of clusters equalled 30. The average silhouette value was computed to decide the optimal number of clusters with the following formula:
| (11) |
| (12) |
| (13) |
where ai is the average dissimilarity of the ith CA3SC ROI xi with all others in its cluster and bi is the average dissimilarity with others in the nearest other cluster. We estimated the number of clusters in each FOV by minimizing the averaged silhouette score over clusterings on each correlation map (Fig. 4a).
Reactivation analysis
We computed the ΔF/F0 cross-correlation for every pair of reactivated CA3SCs in each HSE to measure population synchronicity in SWRs. Pairs were binned by the distance between their place field peaks in 5-cm increments (bin range was from 0–5 cm to 95–100 cm), and the synchronicity values in each bin were averaged to construct a cross-correlogram. We then recalculated the mean cross-correlation after shuffling place field distances 1,000 times and estimated 97.5% confidence intervals. To avoid ROIs originating from a common cell, highly correlated ROIs (R > 0.8 on a lap-by-lap basis) were merged and pairs with zero distance were removed (Extended Data Fig. 9d).
To assess the temporal sequence of reactivated place information in each HSE, we extracted the first principal component from each cluster of CA3SCs inferred by the above-described hierarchical clustering method. Only clusters containing at least five reactivated CA3SCs were included as ‘reactivated’ clusters for each HSE; at least four clusters were required for the following analysis. Both of these criteria were necessary for robust sequence detection. Next, the temporal order of these clusters during each HSE was determined on the basis of the time bin in which the first principal component of the cluster, which summarizes the activity of the cluster, reached its peak, and we computed correlations with the mean place sequence. The maximum R values are reported as the ‘replay score’ for the candidate HSE (negative sign for reverse order). To generate a null distribution of replay scores, we applied this scoring method to shuffled place clusters under the same shuffling procedure used to identify significant CA3SC clusters. We defined significant replay events as HSEs having replay scores outside the 97.5% confidence interval of this shuffle distribution. To prevent contamination from in-field activity, cue-place-CA3SCs with place fields near SWR locations were excluded (e.g., cluster 6 in Fig. 4c).
Detection of recurring assemblies
We used the convNMF package to extract recurring sequences of CA3SC activation using convolutional non-negative matrix factorization (convNMF) as described in ref. 44. Briefly, an ROI × time data matrix X of CA3SC activity during immobility was approximated as a sum of K matrices generated as the convolution of two components: a non-negative matrix wk of dimensions N × L representing the sequential pattern of N CA3SCs at L time lags and a vector of temporal loadings hk, encoding the onset times of each sequential pattern and the relative amplitude of this activity:
| (14) |
where Xnt is the (nt)th element of matrix X, which is the activity of CA3SC n at time t. W is a tensor of activity patterns, and H is its corresponding temporal loading. Index l (1 to L) indicates each time lag within the pattern (wk). The convolutions were zero-padded for lags (t – l) < 0.
To reduce the occurrence of correlated factors in convNMF, a penalty term R, penalizing the correlations between patterns, was added to the squared-error cost function:
| (15) |
A previous study reported that CA1 pyramidal cells form functionally orthogonal assemblies that recur across sharp-wave ripple events45. We thus assumed that HSEs of CA3SCs would also comprise multiple discrete assemblies. Therefore, we used a penalty term that strongly penalizes correlation in W, but not H, which Mackevicius et al.44 refer to as ‘parts-based’ factorization.
| (16) |
| (17) |
Note that this approach encourages the learned CA3SC sequences W to be orthogonal while H may be strongly correlated. This parts-based factorization is particularly useful for separating CA3SCs into ensembles. The skewness of the distribution of overlaps of the extracted recurring patterns across time bins was then compared with that of the null case distribution, which is based on zero temporal relationship between recruited CA3SCs. We included recurring patterns for subsequent analysis if their skewness was significantly greater than the distribution of skewness values for the null factor overlaps (Bonferroni-corrected P value, 0.01).
Note that convNMF was run on the raw ΔF/F0 data, without explicitly annotating HSEs. To determine whether the recurring sequential patterns learned by convNMF are consistent with network activity within HSEs, we computed the correlation between each recurring assembly and the first principal component of each HSE. Although there was variability between individual HSEs, we asked whether certain subsets of HSEs consistently reactivated the patterns inferred by convNMF. To test this, Ward’s hierarchical agglomerative clustering was carried out on the assembly × HSE principal component correlation matrix. Each cluster obtained by this method corresponds to a ‘match’ of putative replay events (identified on the basis of population synchrony at each time point) with their putative internal sequences (learned from all time points via convNMF). The number of clusters was estimated by silhouette values. If an identified HSE cluster included fewer than five HSE events or the average correlation within the cluster was lower than 0.3, the cluster was considered to lack any recurring patterns.
Generating synthetic CA3 replay data.
Synthetic CA3 replay epochs were sampled using a recently described CA3 network model46 (Extended Data Fig. 10). Network weights during place field traversal in the network were first learned via spike-timing-dependent plasticity in a randomly recurrently connected network of 8,000 leaky integrate-and-fire pyramidal neurons. The network, with 150 inhibitory interneurons added, was then presented with random Poisson spiking input, which gave rise to spontaneous replay events. This process was repeated with random initialization 100 times, giving 100 networks with distinct connectivity and replay patterns. Spike times for each neuron were recorded with a simulation time step of 100 μs for 10 s. Further details on the model and the detection of replay events are provided in ref. 46.
Validation of convNMF for replay detection on the synthetic dataset.
Spike rasters during ‘rest’ were recorded from each simulated network (Extended Data Fig. 10). These simulated spike rasters were re-binned to the calcium sampling rate (30 Hz) and then used as input for an AR(1) time-series model with g = 0.95. This is equivalent to convolving the spike signal with a calcium kernel with tau = 0.65 s to generate a simulated CA3 replay calcium imaging dataset. White Gaussian noise (sigma = 0.3 ΔF/F0) was added to simulate experimental conditions. convNMF was then used to detect sequential reactivation events and reconstruct the simulated calcium signals, as described above.
To evaluate the accuracy of detected replay trajectories, a slope and intercept were fitted to each reactivation sequence inferred by convNMF. These values were then compared to the ground-truth slope and intercept computed from the raw spiking data. This simulation also validated the reliability of distinguishing forward and reverse events with convNMF.
To generate receiver operating characteristic (ROC) curves of the sensitivity and specificity of replay event detection by convNMF, a sweep was performed over thresholds on the convNMF temporal factors. A ‘frame’ was classified as ‘in replay’ (also known as ‘positive’) if any temporal factor exceeded the threshold in that frame47. Frames that contained any part of a ground-truth replay event were considered true positives. This provides a conservative measure of detection accuracy: we quantify the sensitivity and specificity of classifying each imaging frame correctly as replay or non-replay.
Reporting summary
Further information on research design is available in the Nature Research Reporting Summary linked to this paper.
Data availability
Datasets included in this study are available from the corresponding author upon reasonable request. Source data are provided with this paper.
Code availability
Custom Matlab code supporting this study is available at https://github.com/losonczylab/Terada_Nature2021. Source data is provided with this paper.
Extended Data
Extended Data Fig. 1 |. Labeling of CA3 Schaffer Collaterals for in vivo two-photon calcium imaging and identification of ROIs.
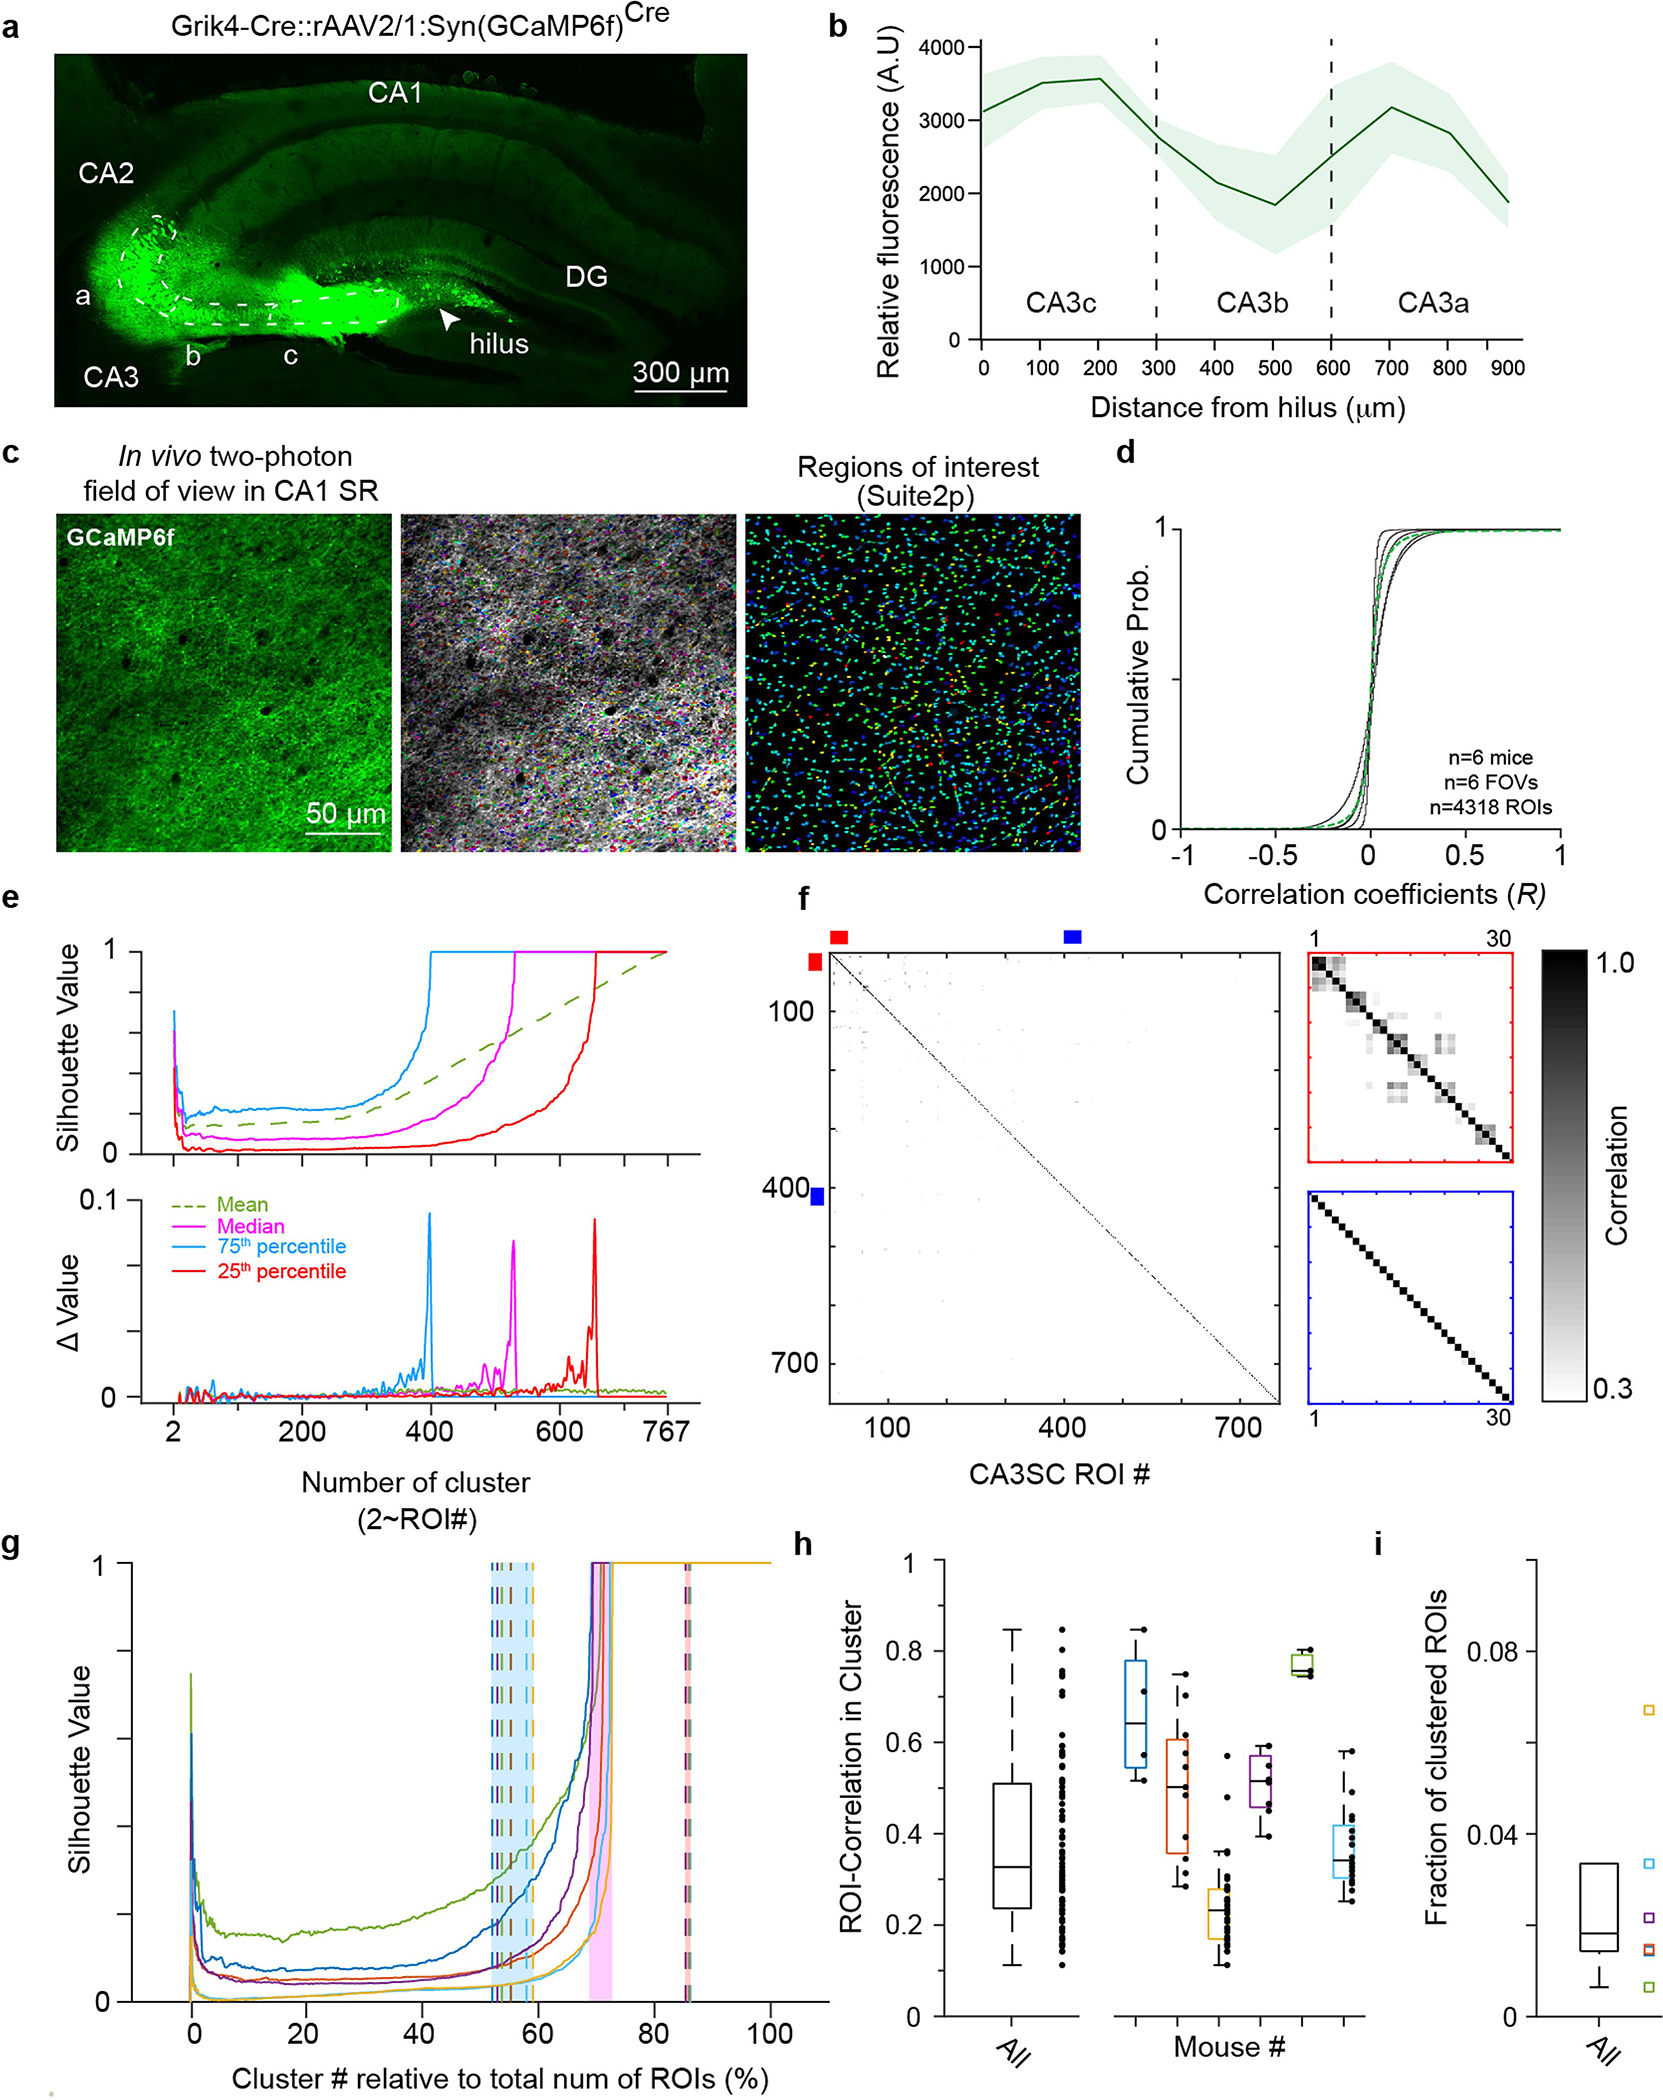
a, Representative coronal slice of the dorsal hippocampus of a Grik4-Cre mouse showing Cre-dependent rAAV-driven GCaMP6f expression restricted to CA3. The CA3 pyramidal cell layer is outlined with the dotted white contour, and the approximate locations of the CA3 subregions (CA3a-c) are shown. b, Quantification of relative fluorescence intensity along the pyramidal cell layer of CA3 subregions (mean±s.e.m.). Fluorescence intensity at 10 locations along the CA3 pyramidal cell layer was measured, starting from the hilus of the dentate gyrus (x=0 μm) to the approximate CA2/3 border (x=900 μm). c, Example in vivo two-photon field of view (FOV) in CA1 SR from one representative mouse (n=6 in this study). Imaging focal plane was located 50–150 μm below CA1 SP. Right, the same FOV after ROI segmentation with the Suite2p analysis package (middle, overlapping display). d, Distributions of correlation coefficients between pairs of CA3SC ROIs during spontaneous activity for each individual mouse (black lines) and mean for all mice (green). e, Estimation of number of unique CA3 units recorded using hierarchical clustering and silhouette score (Methods). Top, silhouette values as number of clusters K (to the total number of detected ROIs) in an example FOV (green: average, pink: median, light blue: 75th percentile, red: 25th percentile). Bottom, marginal change in silhouette values each time K is incremented by 1. The estimated number of unique CA3 units recorded on each FOV was defined as the number of clusters that maximized the rate of change (528 clusters in this case, and 644±91 clusters, mean ± s.e.m.). f, Left, correlation matrix of ROI signals from the example FOV shown in (c). Right top, zoom: example clusters of putative same-axon ROIs (red), and non-clustered ROIs, likely recorded from distinct axons (blue). g, Median silhouette values over percentage of putative distinct CA3 axons as a proportion of total number of ROIs detected in the FOVs (color scheme as in e). The pink shaded area indicates the ranges between the mice. Dashed lines indicate the cluster numbers that maximized rate of change in 25th (red shaded area on right) and 75th percentiles (blue shaded area on left). h, Boxplots of within-cluster correlations of ROI signals all together (left, n=175 ROIs) and by mouse (right, 29.17±9.5 ROIs, mean±s.e.m.). The whiskers indicate maxima and minima. i, Fraction of ROIs putatively originating from the same cell across mice (n=6810 ROIs from 6 mice). The whiskers indicate maxima and minima, outliers excluded.
Extended Data Fig. 2 |. Stability of two-photon imaging.
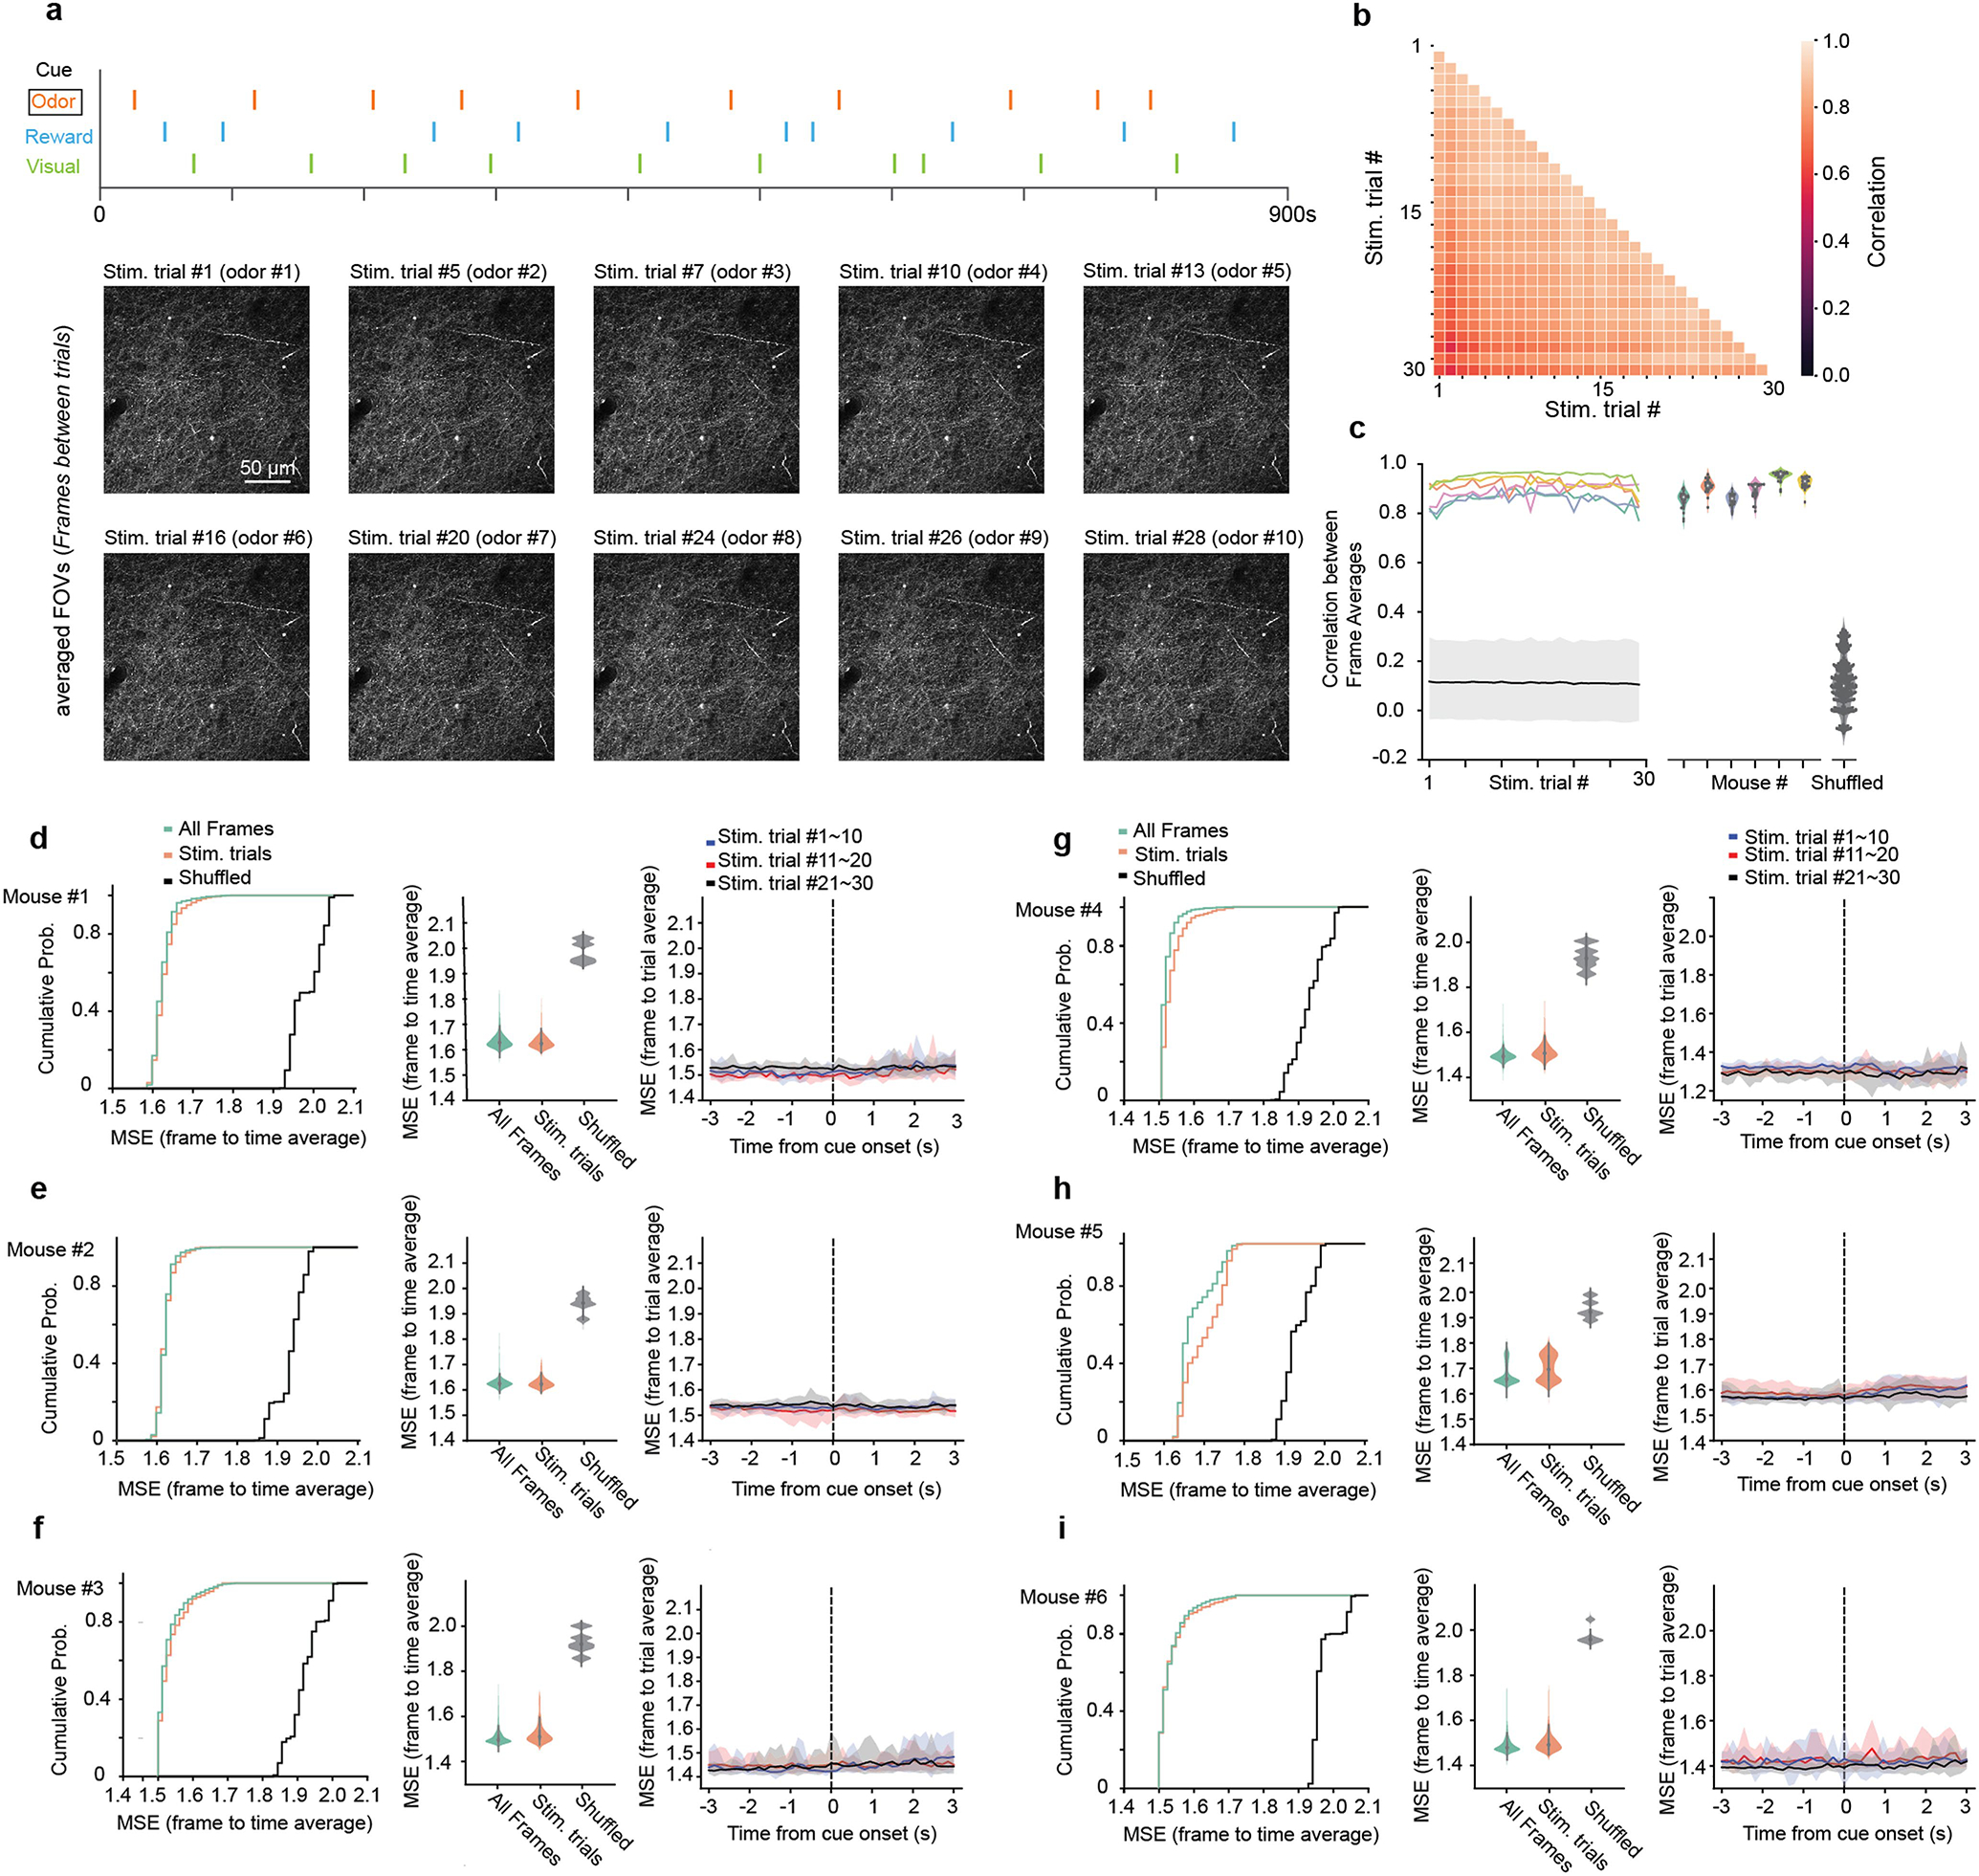
a, Top, cue onsets in a representative RC-NS session (orange: odor; green: visual; light blue: reward). Bottom, trial-averaged FOVs corresponding to each odor trial from one representative mouse (n=6 in this study). Trial averages were computed from the frame of odor stimulus onset through the last frame 5 s prior to the next stimulus onset. b, Mean pixel-wise correlations between all pairs of trial-averaged FOVs from the above session. c, Mean pixel-wise correlations of trial-averaged FOVs with whole-session time-averaged FOVs in RC-NS sessions. Colors correspond to individual mice. Correlations were recalculated with whole-session time-averaged FOVs on different mice (shuffled) and plotted in black (mean, shaded area: 90% confidence interval). d, Left, empirical cumulative distribution function (CDF) of mean squared error (MSE) between each frame and time-averaged FOVs from corresponding sessions (green: all frames, orange: intra-trial frames, black: comparison to other FOVs). Middle, violin plot of data shown in CDFs. Right, MSEs between each frame and trial-averaged FOVs. MSEs were averaged every 10 trials and shaded areas indicate percentiles from 5% to 95%. e–i, Same as (a) for each individual mouse.
Extended Data Fig. 3 |. Reward-predictive behavior during sensory-place associative paradigm.
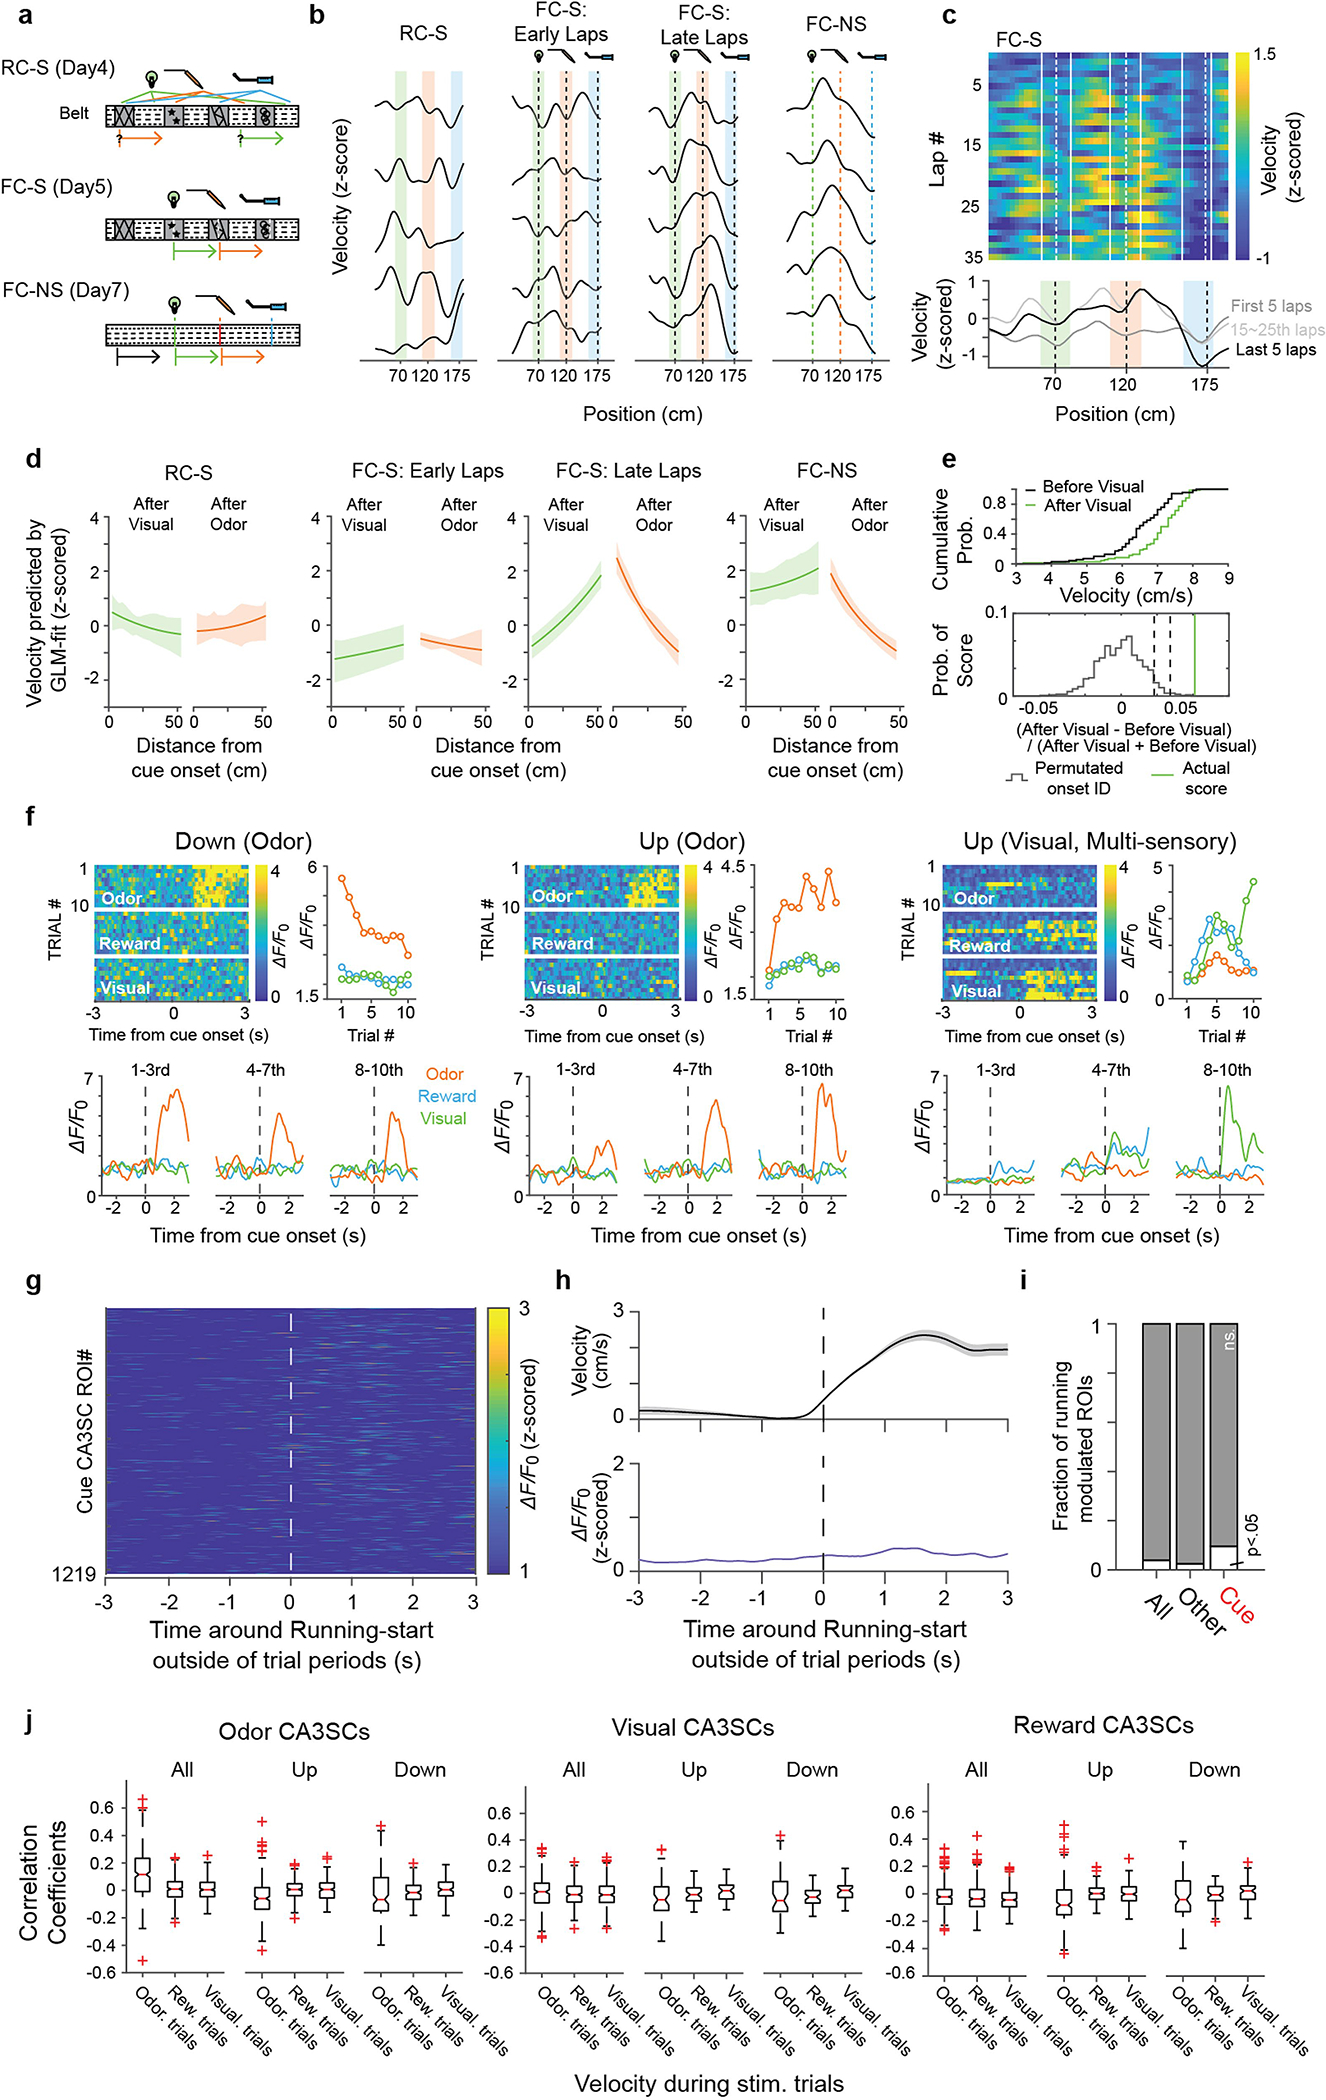
a, Schematic of sensory stimulation paradigm and belt types (Methods). b, Examples of velocity in individual laps under different conditions. Each shaded color area corresponds to textural elements of the spatial belt where the sensory stimulations were presented and dashed lines indicate cue onsets. c, Representative lap-by-lap (top) and mean (bottom) velocity during FC-S. d, Velocity as predicted by generalized linear model (GLM, Method). Lines indicate mean GLM-predicted velocity and shaded areas indicate 25th and 75th percentiles across mice. e, Comparison of velocities before (black) and after (green) the onset of visual stimulus. Top, cumulative histograms of mean velocities 50 cm before and after visual stimulus. Bottom, velocity modulation by visual stimulus calculated with real pairs of velocities (green line) vs null distribution of scores calculated on 1000 random permutations of the onset ID (black histogram). Dotted lines indicate significance thresholds corresponding to p-values of 0.05 and 0.01. f, Examples of cue-CA3SC ROIs showing the different trial-by-trial transitions (left and middle; odor-, right; multi-sensory CA3SC ROIs). Heatmap shows ΔF/F0 by trial, chunked by cue modality and centered on cue onset with mean values plotted on right. PSTHs calculated on subsets of trials are shown below. g, Heatmap of mean cue-CA3SC activity centered on running bout initiations during random cue/non-spatial paradigm. h, Top, velocity (mean±s.e.m.) from all running bout initiations. Bottom, mean cue-CA3SC activity shown in (a). i, Fraction of significantly running-modulated CA3SCs during RC-NS (Other: n=5,836; Cue: n=1,219 ROIs from 6 mice). 1000-time shuffling test with Bonferroni correction was used to obtain significance thresholds for P < 0.05 in each ROIs (two-tailed test, α=2.5% on each side). j, Correlation between cue response and running speed during trial periods represented as boxplots with median and interquartile range (Up: n=276 odor, n=143 visual, n=203 reward; Down: n=136 odor, n=77 visual, 78 reward; Other: n=41 odor, n=196 visual, n=69 reward). The whiskers indicate maxima and minima, outliers excluded. The red plus symbols indicate outliers.
Extended Data Fig. 4 |. Multi-axis dimensionality reduction of trial-by-trial changes in cue-CA3SC activity via Tensor Component Analysis.
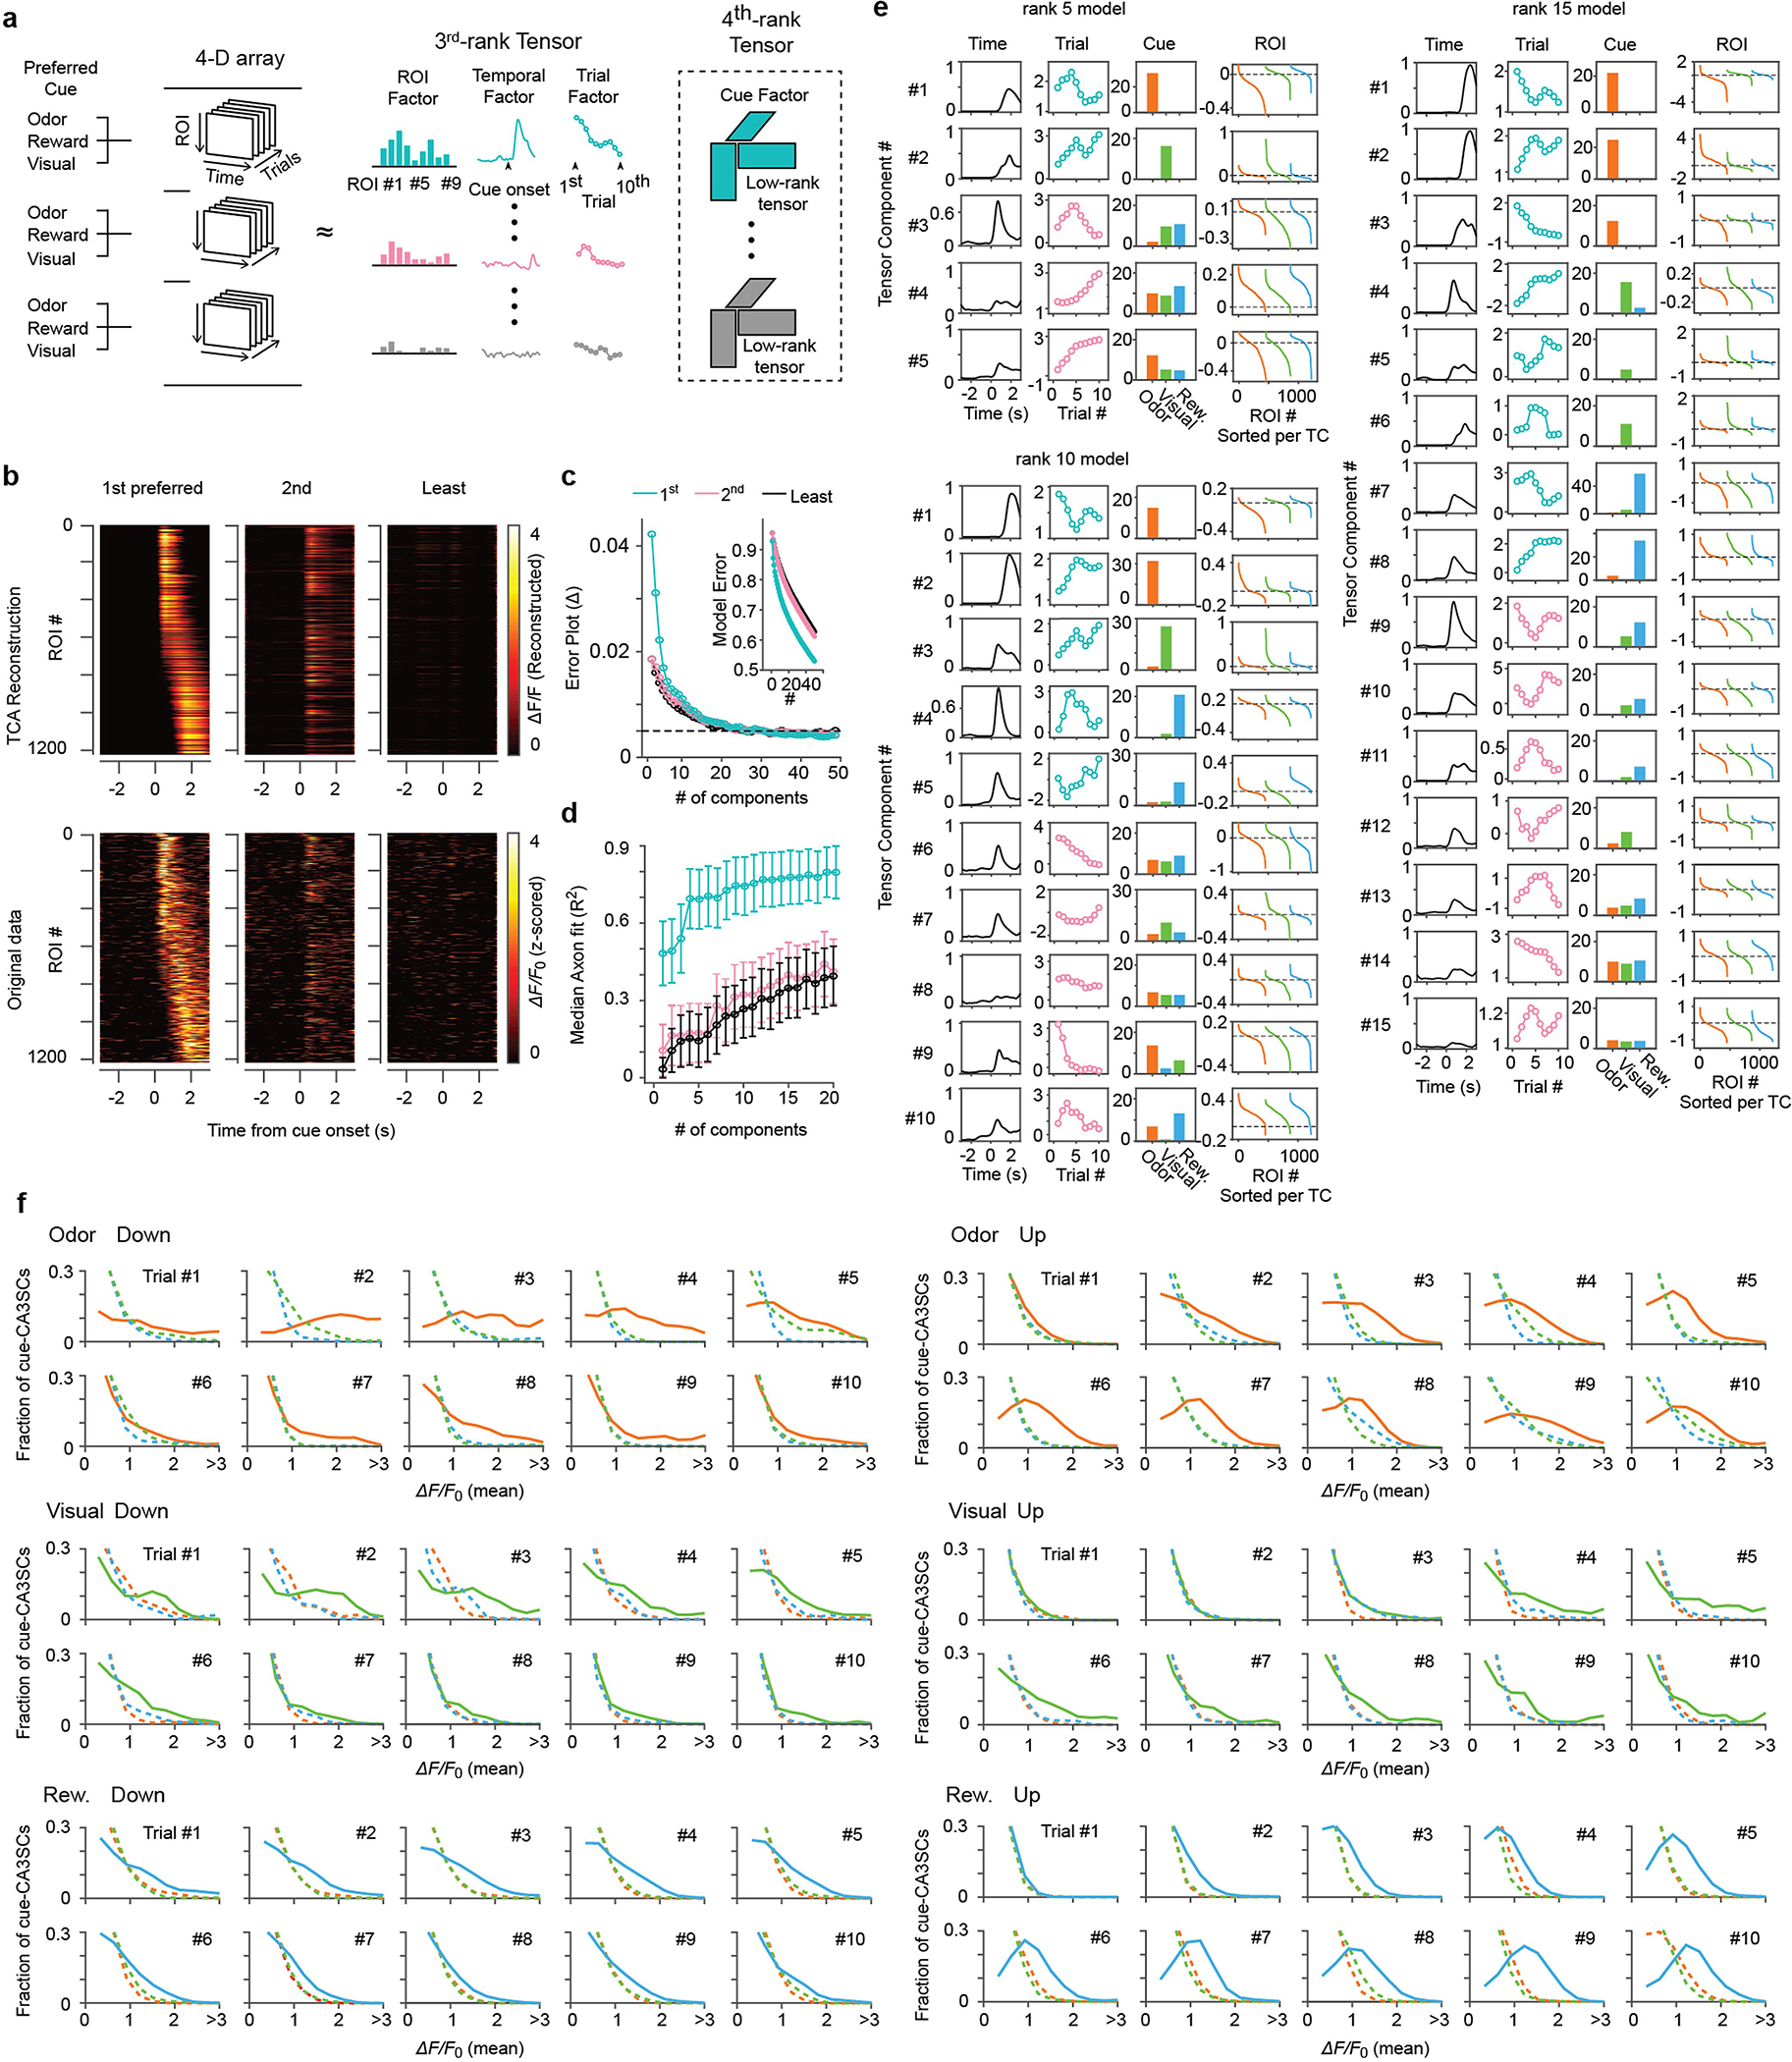
a, Schematic of tensor component analysis (TCA). Imaging data were arranged into a 4th order tensor with dimensions N×T×K×C where axes correspond to the number of CA3SC ROIs, within-trial temporal dynamics, evolution over multiple trials, and cue modality. b, Reconstructed (top) and original (bottom) ΔF/F0 heatmaps, centered on cue onset, for cue-CA3SCs in response to their respective 1st preferred (left), 2nd preferred (middle), and least preferred (right) cues. A 10-component TCA model, shown in (e), was used for reconstruction. c, Error plot showing normalized reconstruction error for TCA (inset) and reduction in error with each additional component until 50 for 1st preferred (cyan), 2nd preferred (pink), and least preferred (black) cue. d, Median coefficients (R2)±s.d. of reconstruction for each cue-CA3SC with the number of components for TCA ranging from 1 to 20 (n=1219 ROIs from 6 mice). e, Extracted tensor components (TCs) from the 5, 10, 15-component models. Columns show temporal factor (left), trial factor (middle left), cue factor (middle right), and ROI factor (right). Cyan trial factor: TCs dominated by a single sensory modality (#1–5) Pink trial factor: multimodal TCs (#6–10). Unimodal TCs strongly contributed to reconstructed responses to their 1st preferred cues shown in (b) and represent modality-specific features within and across trials. f, Distributions of averaged ΔF/F0 response after cue onsets, by trial, in each cue-CA3SC cluster.
Extended Data Fig. 5 |. Latency and reliability of cue-CA3SC activity across trials.
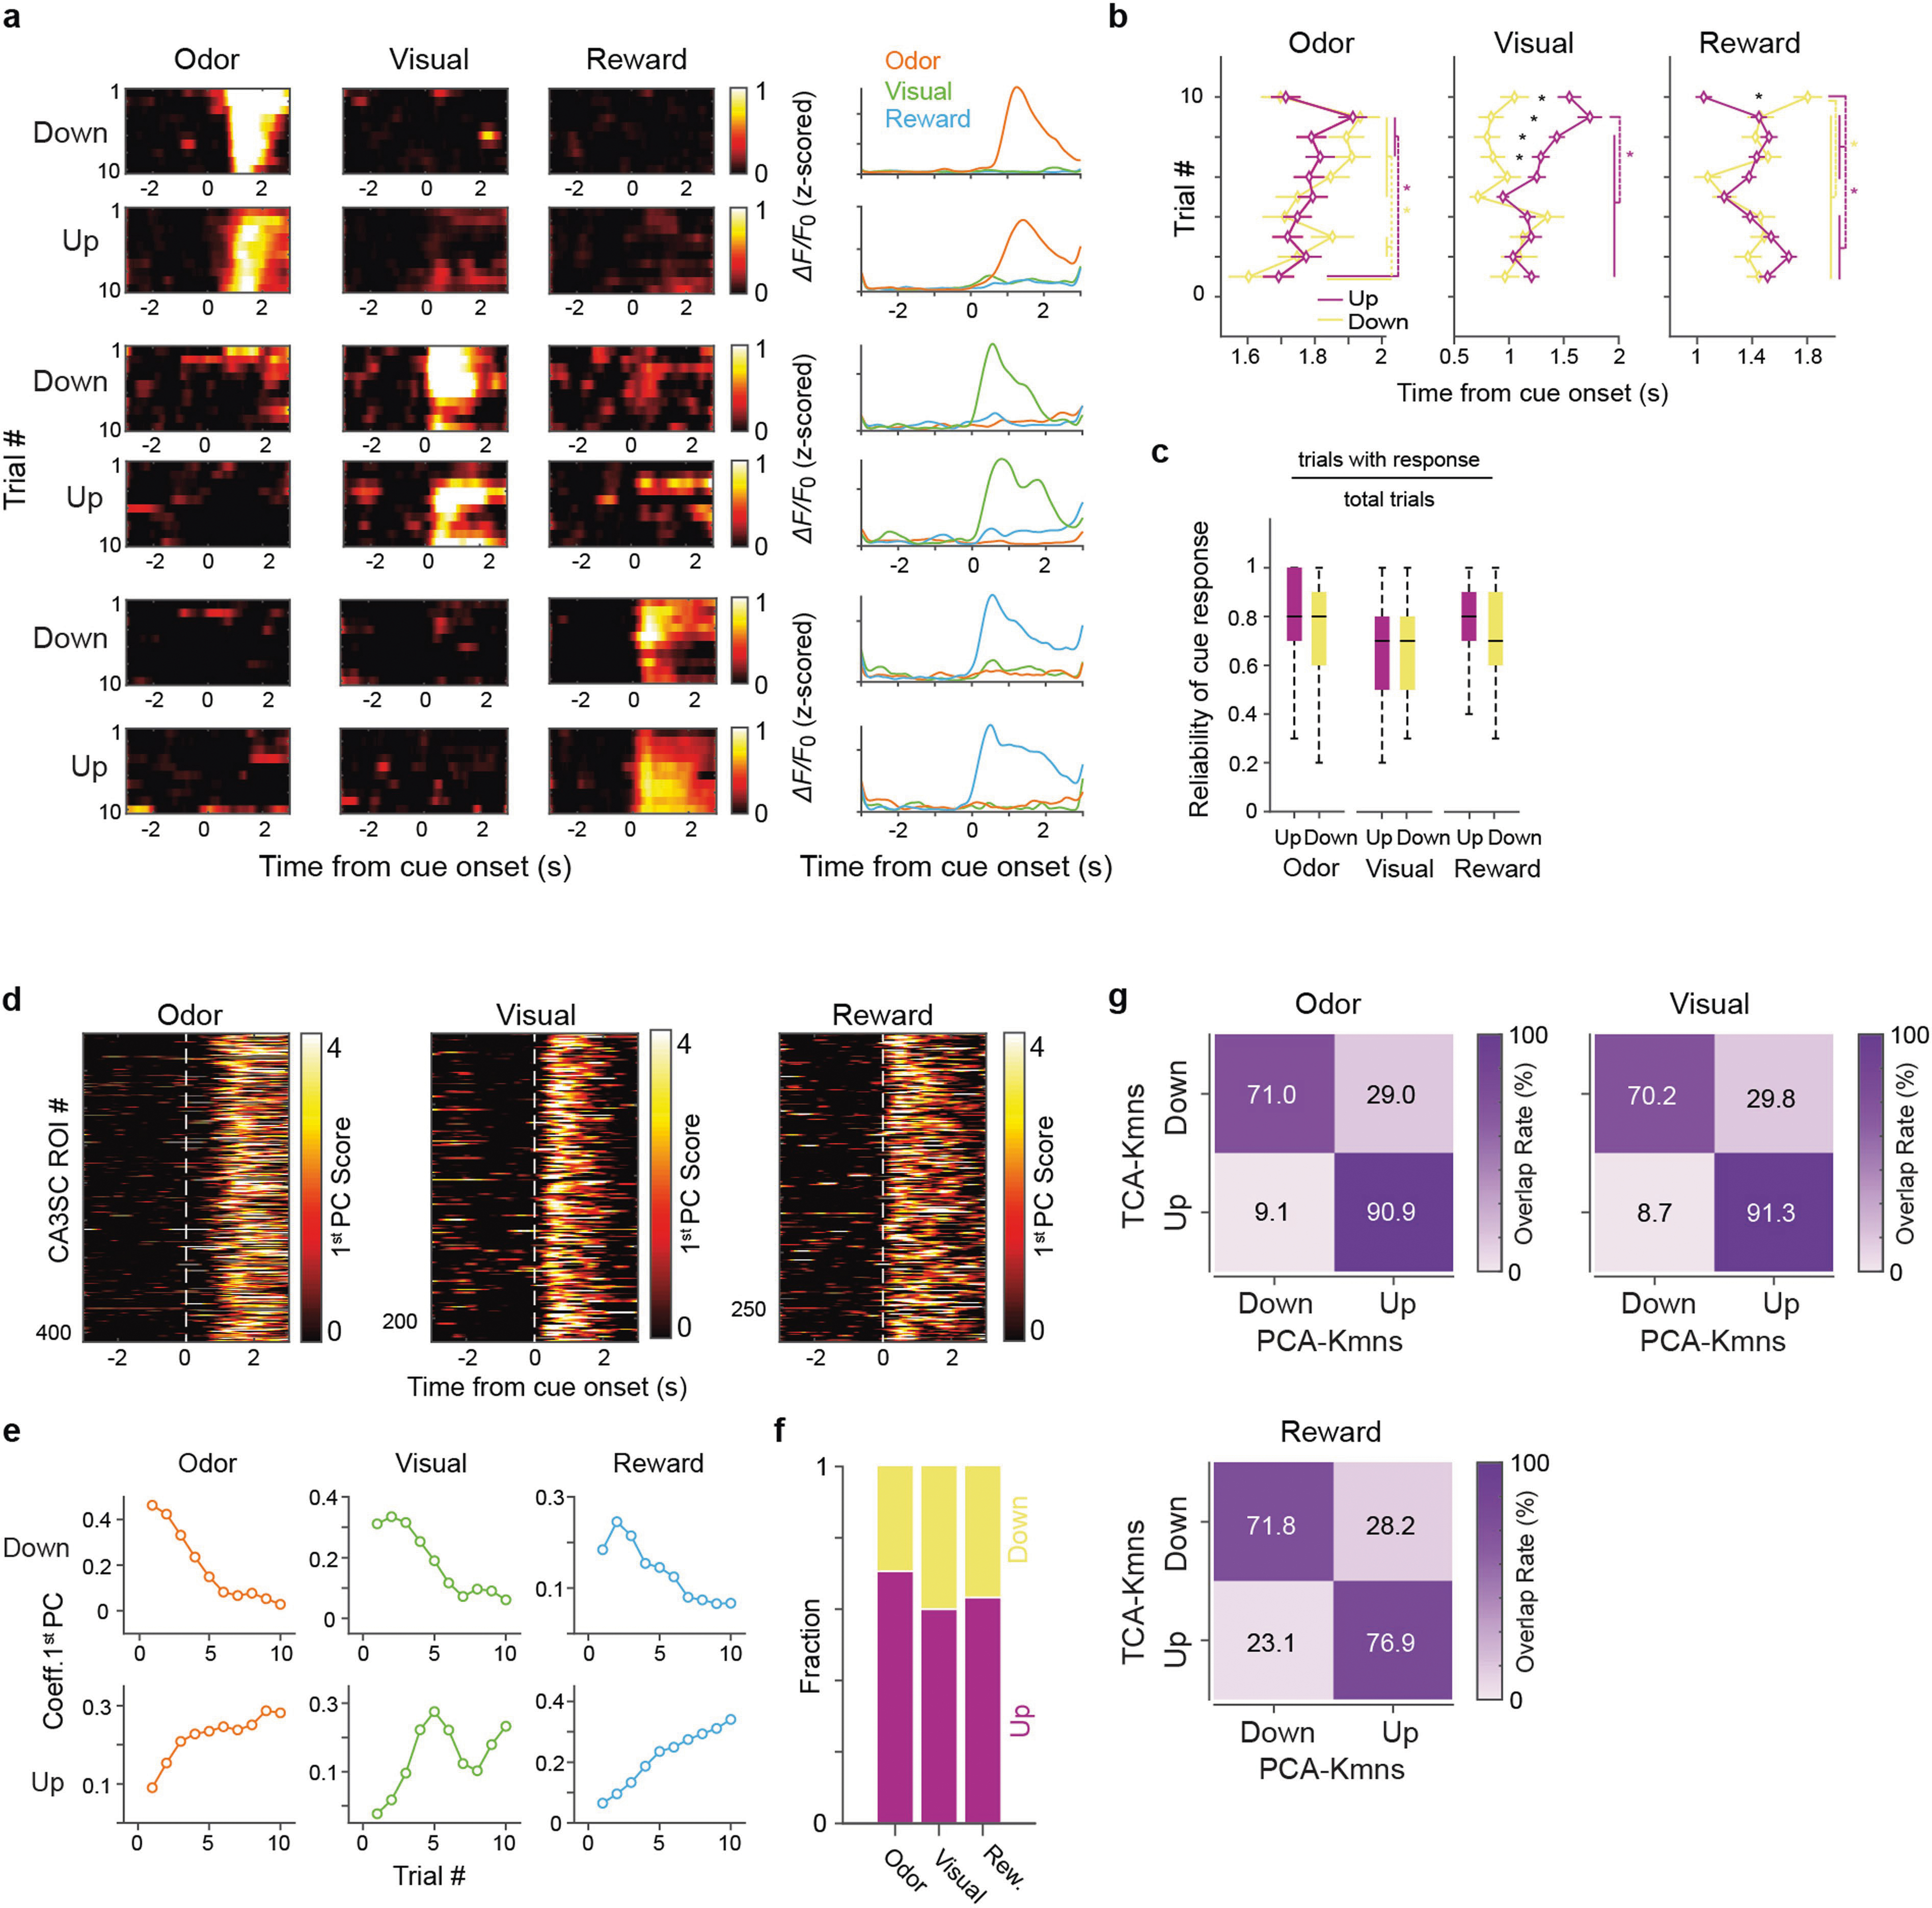
a, Left, Heatmap activity showing responses triggered by all cue onsets across ROIs from each cluster (Up and Down). Row indicates individual trial. Right, response profiles of each cluster. b, Latency between cue onset and peak time of cue-CA3SC response in each trial. Each symbol indicates mean response latency of all cue-CA3SCs in each cluster (Up (purple): n=276 odor, n=143 visual, n=203 reward; Down (yellow): n=136 odor, n77 visual, 78 reward. Two-way ANOVA with post-hoc Tukey’s tests. For odor-CA3SCs: Up × Down: P =0.74.; main effect of trial: P=3.6×10⁻¹⁴; interaction: P=1.8×10⁻⁵; for visual-CA3SCs, Up × Down: P=0.62; main effect of trial: P=5.7×10⁻⁵; interaction: P=2×10⁻⁴; for reward-CA3SCs, Up × Down: P=0.74; main effect of trial: P=9.6×10⁻⁶; interaction: P=0.0193). c, Reliability of cue response, defined as the number of trials with response divided by the total number of trials (10 trials per modality) represented as boxplots with median and interquartile range. Whiskers denote minimum and maximum values. d, Extracted 1st principal component (PC) of the cue response of individual cue-CA3SCs assigned to Up and Down clusters using the TCA/K-means approach. To validate TCA and K-means classification, PCA was applied to K × T (trial × trial time) arrays of individual cue-CA3SCs. The 1st PC of each CA3SC robustly captured the initially-identified cue response. Note that 1st PC coefficients across individual trials represent the trial-by-trial evolution in the cue response of each CA3SC. e, Using K-means clustering, coefficient trends across trials were assigned to Up or Down clusters. Mean coefficients are plotted across trials of classified cue-CA3SCs. f, Fraction of cue-CA3SCs in inferred clusters. g, Overlap rates between TCA and PCA classifications of trial-by-trial trends.
Extended Data Fig. 6 |. Additional data on SWR recruitment of cue-CA3SCs in random cue conditions.
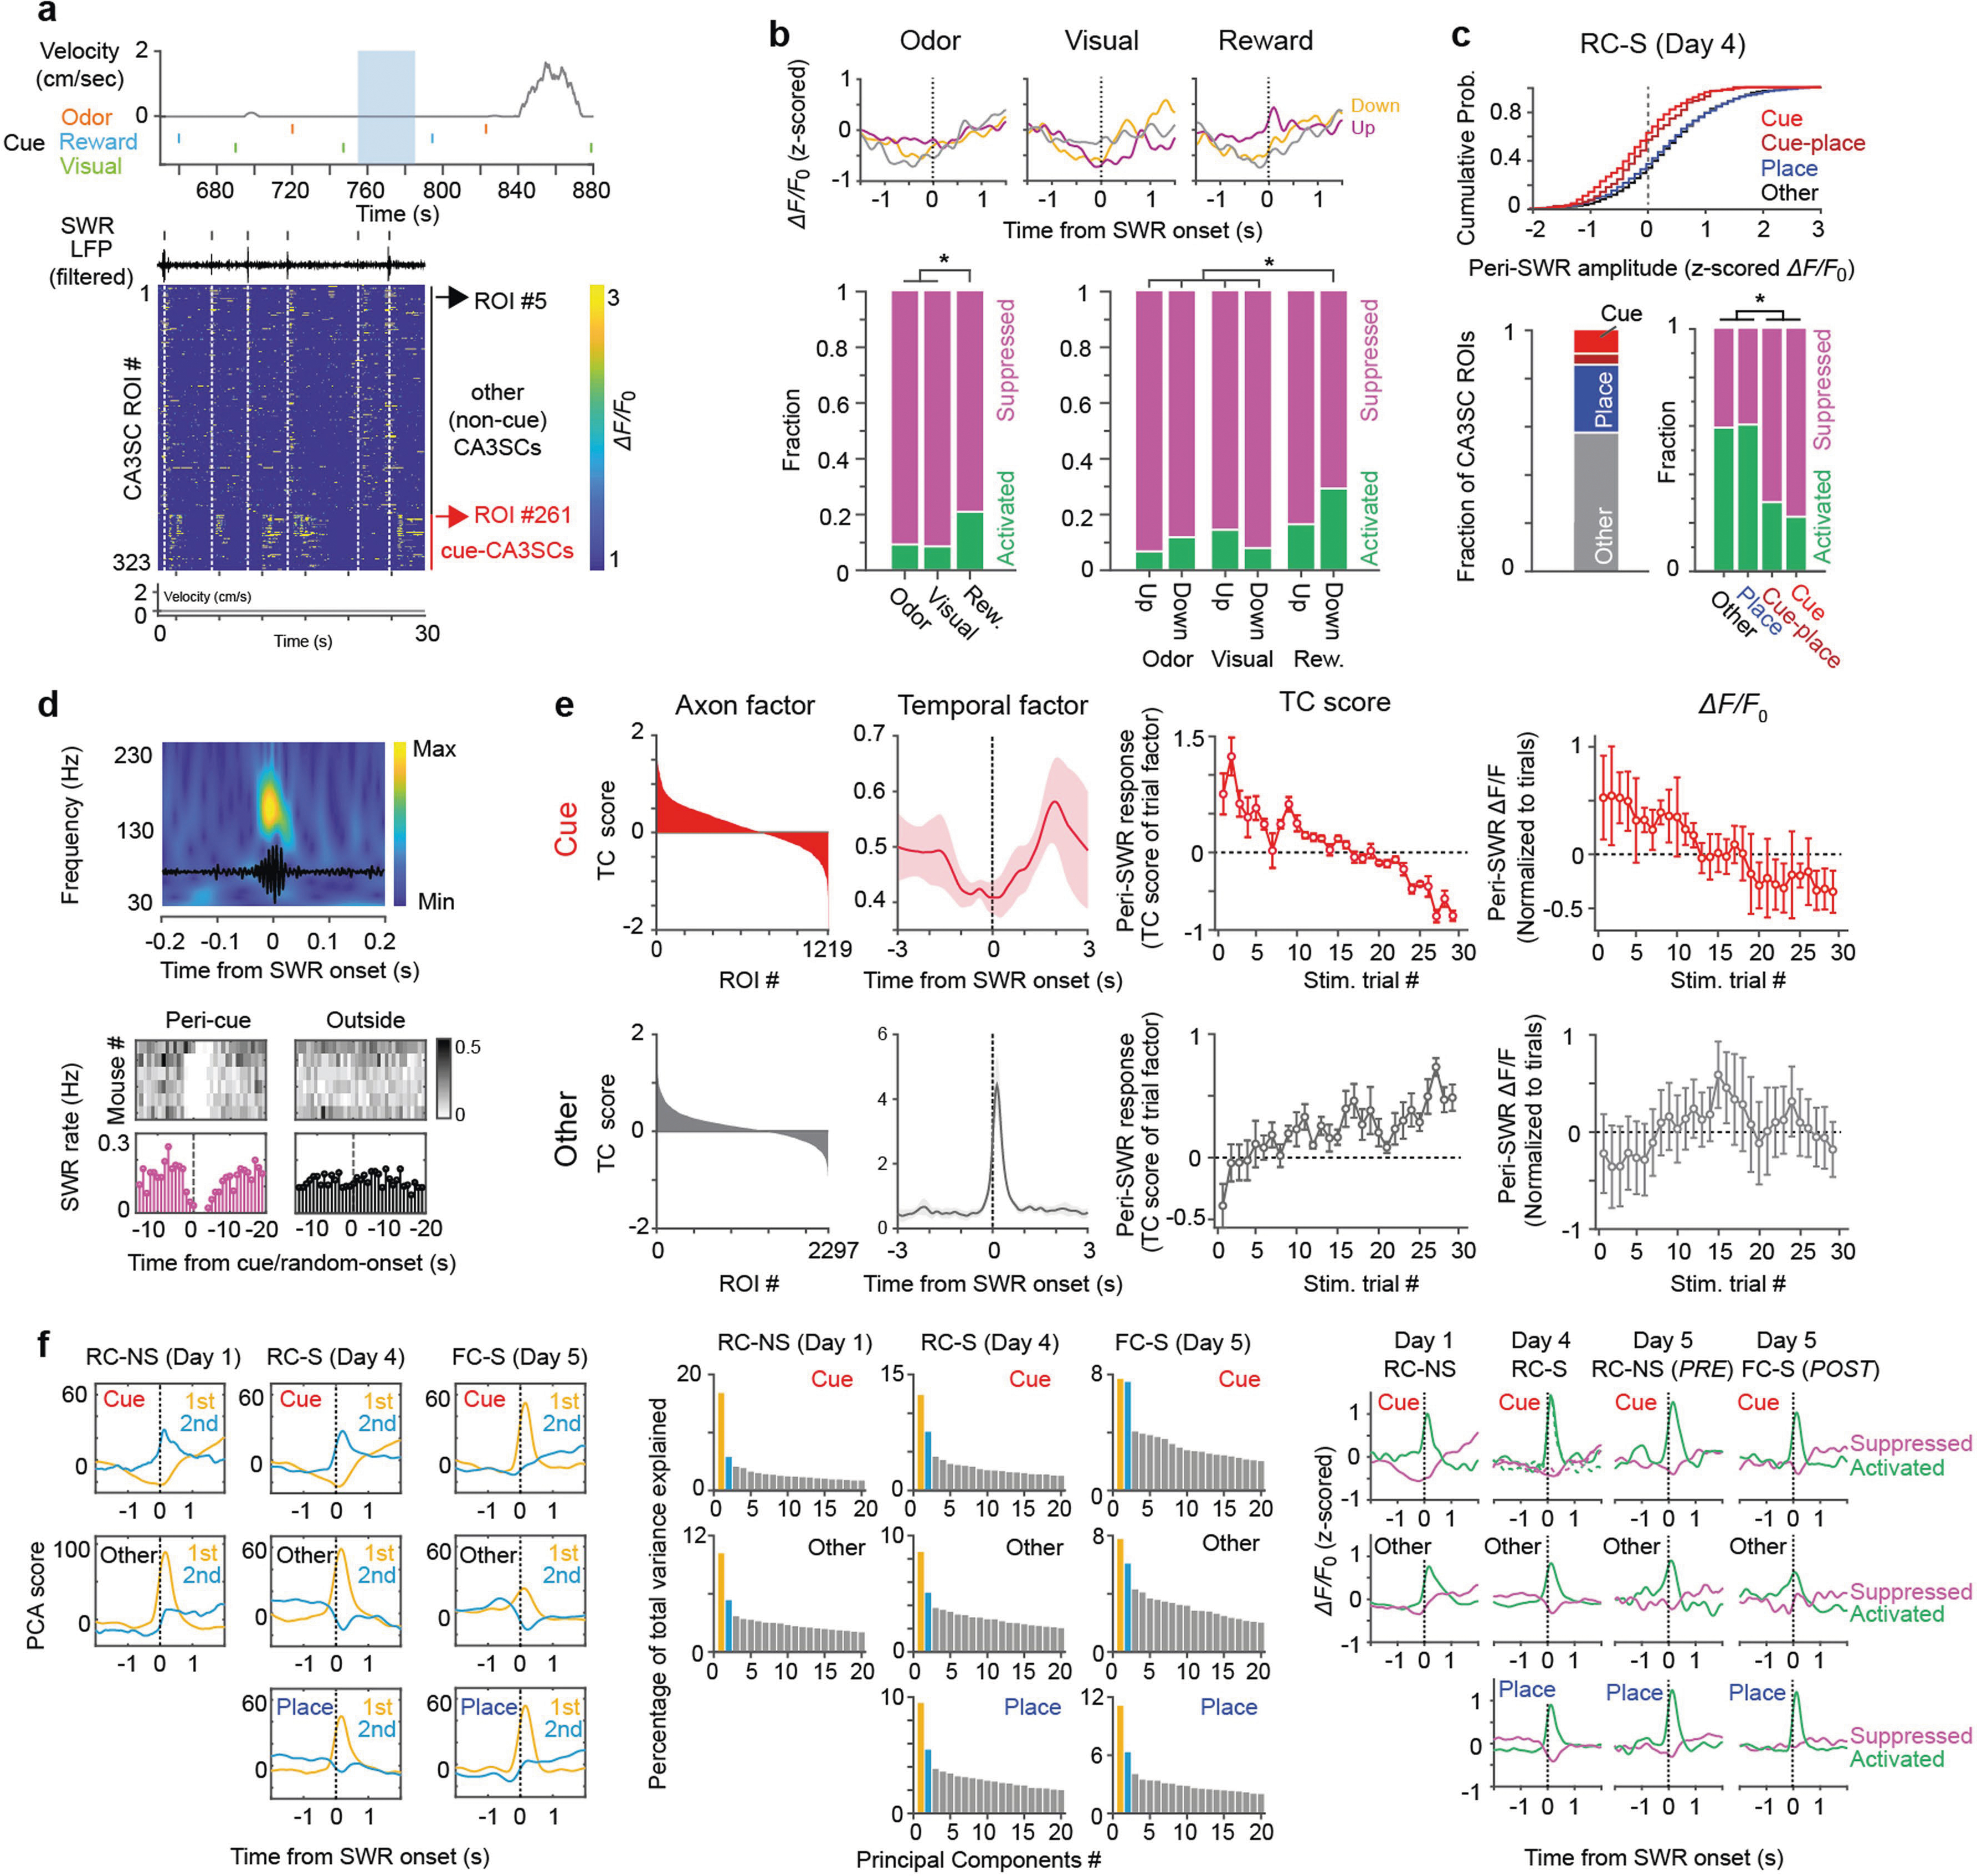
a, Top, Example period of velocity and cue onsets. Blue shaded area corresponds to time window in the below heatmap showing examples of peri-SWR CA3SC activity. Bottom: SWR band-filtered LFP is plotted on top with detected CA1 SWRs indicated by black ticks and white dashed lines. b, Top, Average peri-SWR response in each group shown in Fig. 1 for cue-CA3SCs. Bottom, Fraction of SWR recruitments of cue-CA3SCs. Number of ROIs for single-modality: odor: 349, visual: 256, reward: 350. Multi-modality ROIs, n=264; with odor-visual: 74, odor-reward: 30, visual-reward: 107, all-modalities: 53 (two-sided Fisher’s exact test with Bonferroni correction. P=3.7×10⁻⁶ for Odor-vs-Reward. P=1.5×10⁻⁵ for Visual-vs-Reward. P=0.8967 for Odor-vs-Visual. P=3.7×10⁻⁶ for down-Reward-vs-down-Odor, -vs-up-Odor (P=1.6×10⁻⁷), vs-down-Visual (P=3.6×10⁻⁵), vs-up-Visual (P=3.4×10⁻⁵). P=0.0033 for up-Reward-vs-down-Odor, and -vs-up-Odor (P=3.7×10⁻⁵). P=0.2418 for up-Reward-vs-down-Visual. P = 0.0985 for up-Reward-vs-up-Visual. c, Top, Cumulative histograms of peri-SWR z-scored ΔF/F0 of all CA3SCs shown in Fig. 2g (RC-S, Day 4. Other: n=3,371; Place: n=1,644; Cue-Place: n=198, Cue: n=501 from 4 mice). Bottom left, fraction of cue-, cue-place, place-, and non-responsive CA3SC ROIs-. Bottom right, fraction of SWR recruitments of CA3SCs (One-way ANOVA with post-hoc Tukey’s test. ROI-type: P<1.3×10⁻¹⁶. d, Left, mean SWR-triggered power spectrogram of contralateral CA1 LFP (black line: an example filtered LFP trace). Right, peri-cue onset time histogram of SWR rate for all mice and average rate stem plot juxtaposed to random, non-cue-centered onset times (‘outside’). Dashed line indicates onset of cue presentation. While SWR events around cue onset were excluded in the following analysis. e, Top, a single-component TCA model fit to cue-CA3SC peri-SWR suppression over individual SWR events in each mouse (n=17.76±1.39 SWRs in each inter-trial-interval, mean ± s.e.m. from 6 mice). Left, sorted ROI factor for each CA3SC. Middle-left and middle-right, temporal factor and trial factor (mean±s.e.m.). Trial factor TC scores were extracted in each SWR event and indexed to inter-trial intervals where these events were observed. Right, ROI-averaged ΔF/F0 indexed to inter-trial intervals (mean±s.e.m.). Bottom, a single-component TCA model of other-CA3SC peri-SWR activation over SWR events. The trial factor TC score is likely to correlate with synchronicity of all ROIs to SWR events. To more clearly isolate any trend in the trial factor other-CA3SCs, we included only other-CA3SCs with strong responses to SWRs for model fitting (exceeding average amplitude shown in Fig. 2c). The error bars indicate s.e.m. f, Left, extracted PCs representing CA3SC suppression and activation driven by SWRs during different task conditions in each class of CA3SCs (cue, place, and other). K-means clustering was applied to the PCA loadings to classify ROIs as “activated” or “suppressed”. Middle, percentages of variance accounted for by each PC (up to 20). Right, mean peri-SWR response of classified CA3SCs (dark green: activated, magenta: suppressed).
Extended Data Fig. 7 |. Reproducibility of SWR suppression of cue-responsive CA3SCs with automated and manual sparse ROI segmentation and cell body ROI.
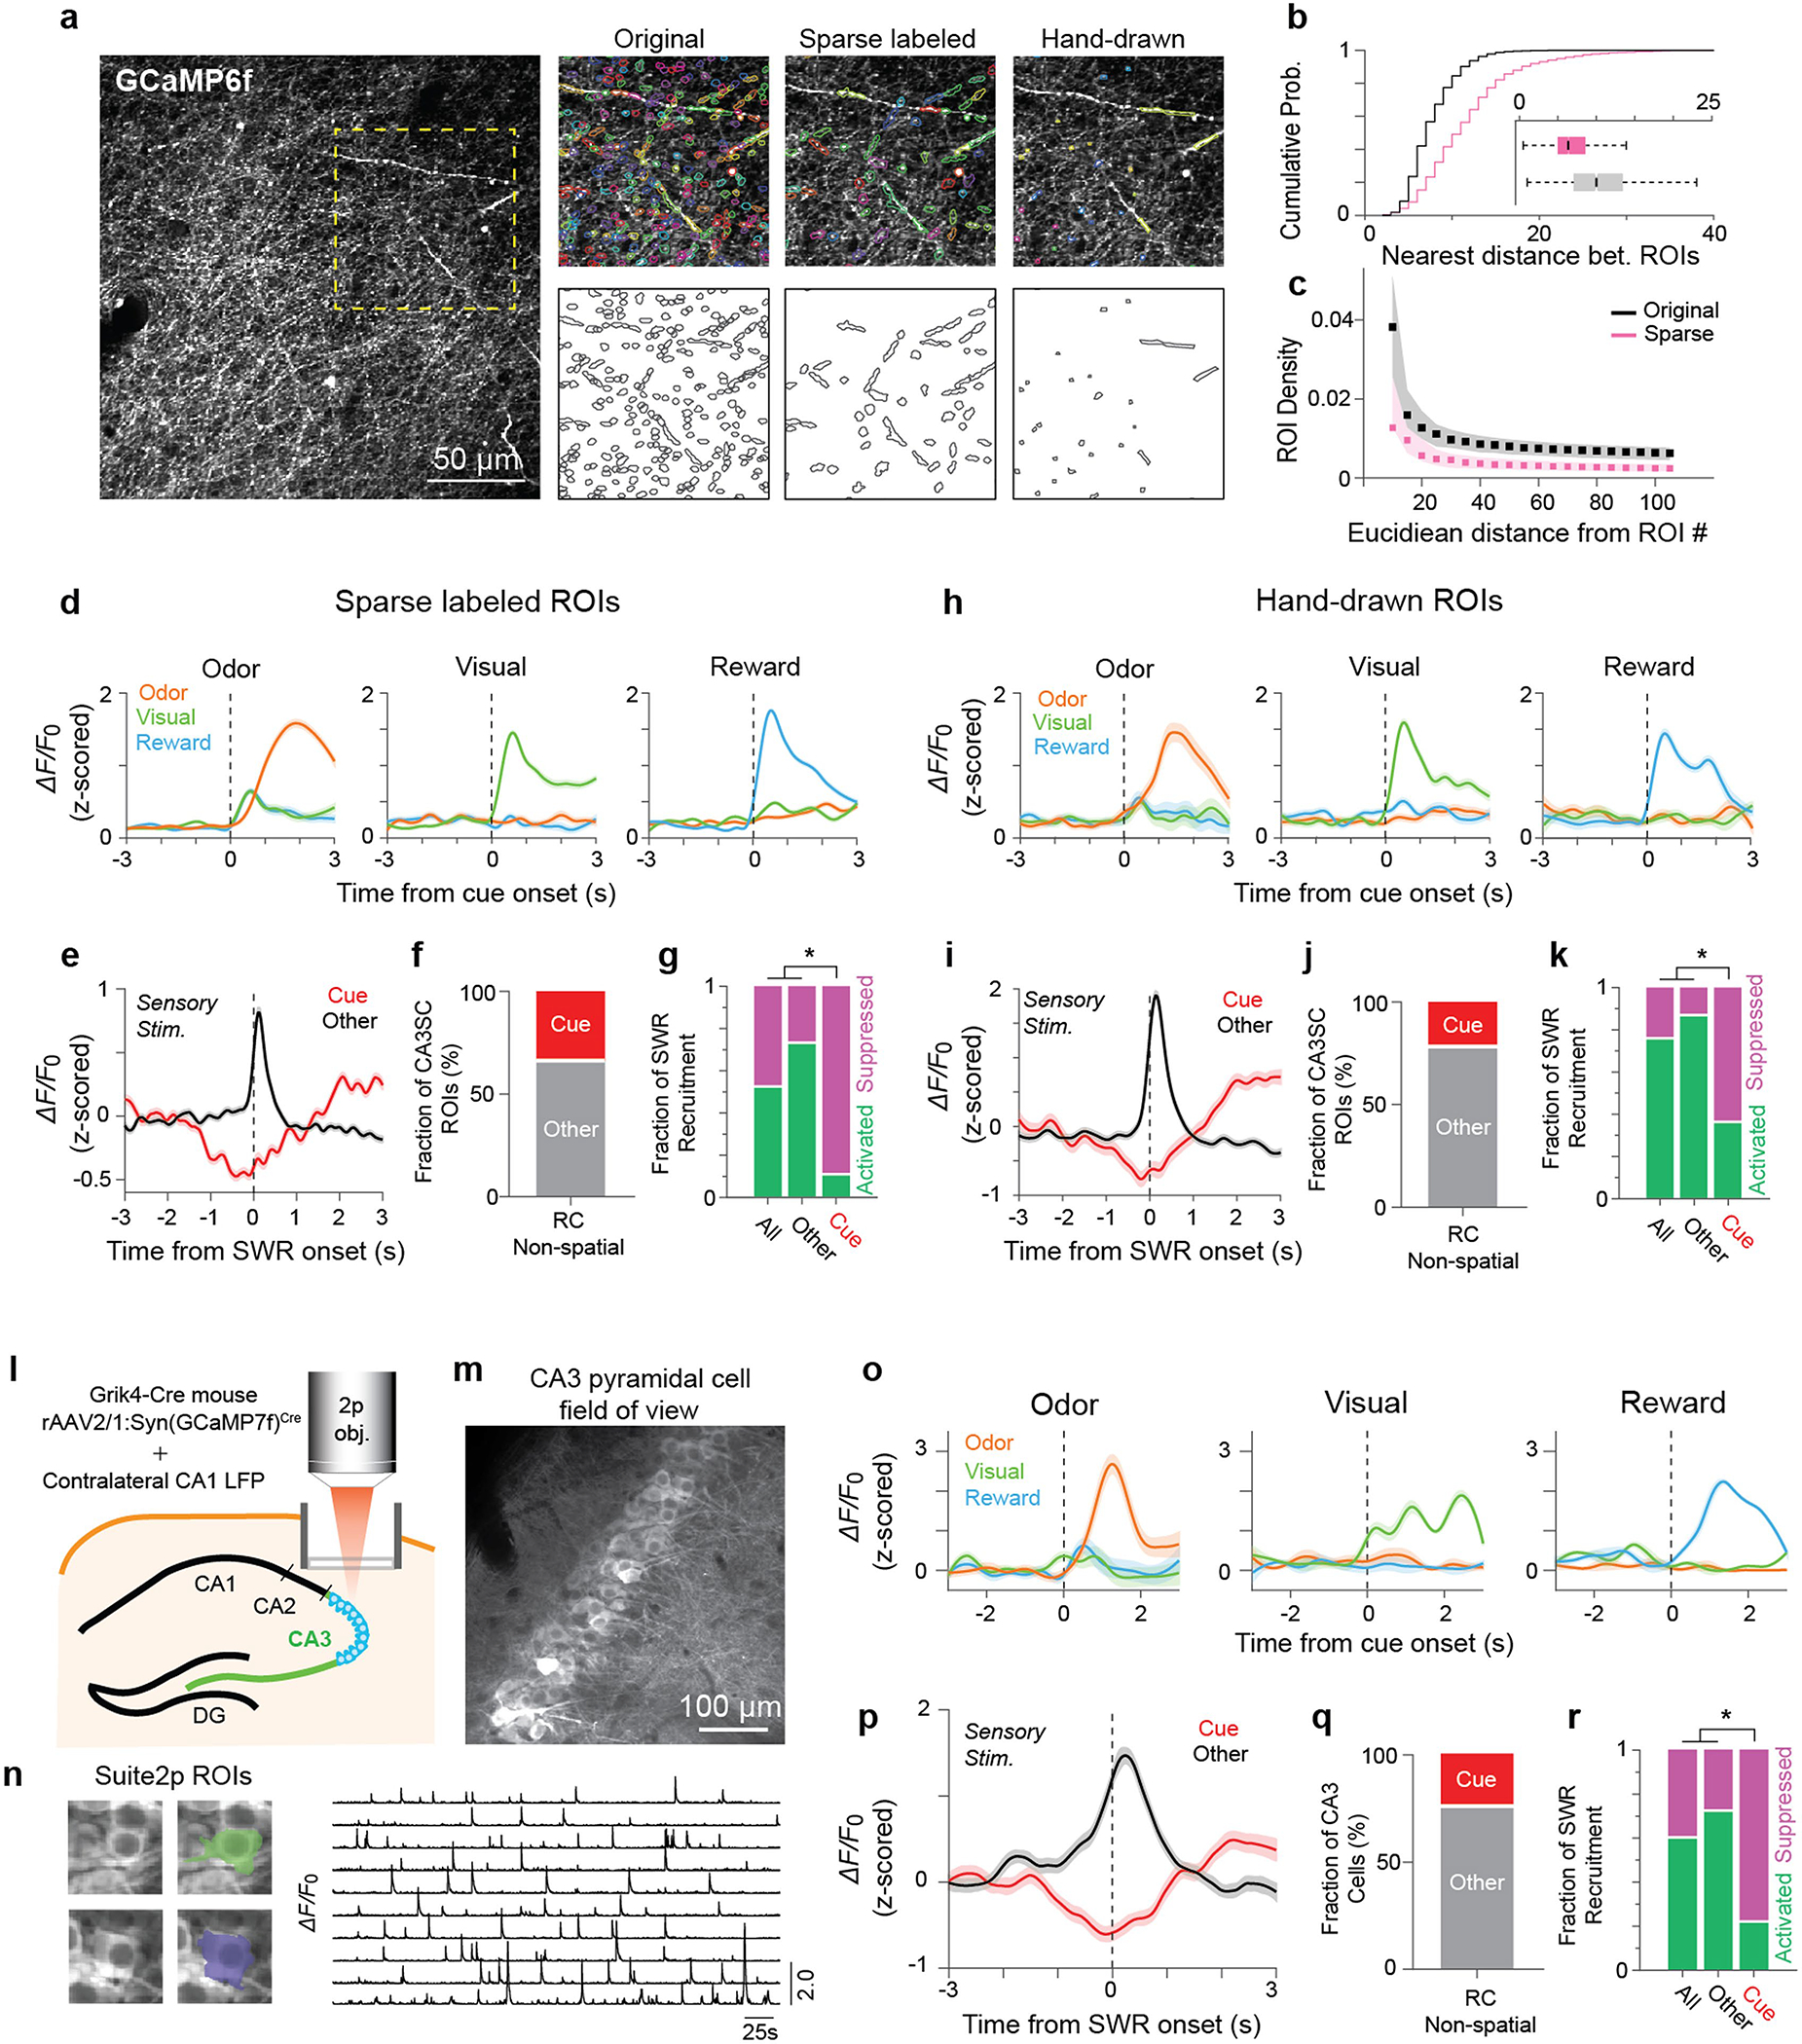
a, Left, representative time-averaged FOV from one representative mouse (n=6 in this study). Right, zoomed-in patches of FOV on left (yellow dashed square) showing original (default Suite2p performance), sparse automated, and sparse manual segmentation (Methods). ROIs overlaid onto FOV in random transparent colors at top with ROI outlines plotted below. b, Cumulative histogram of Euclidean distance between each ROI and its nearest neighboring ROI (black: n=7055 original ROIs; pink: n=2945 sparse automated ROIs). Median values±s.d. are shown in bar plot (inset). c, Density of surrounding ROIs calculated for each ROI as a function of distance. d–g, Analysis of automatically-detected CA3SC ROIs including mean cue responses±s.e.m. of cue-CA3SCs during RC-NS (d), mean peri-SWR response±s.e.m. of all cue-CA3SCs (Cue, red) and non-cue CA3SCs (Other, black) recorded (e), fraction of cue-responsive and non-cue CA3SCs (910 cue-CA3SC ROIs from 6 mice) (f), and fraction of SWR recruitment of CA3SCs during RC-NS and POST (Other: n=1,945; Cue: n=910 ROIs from 6 mice. two-sided Fisher’s exact test with Bonferroni correction. P=2.6×10⁻²⁴ for Cue-vs-All and Cue-vs-Other) (g). h–k, Analysis of manually-curated sparse CA3SC ROIs plotted as in (d-g) (Other: n=1,083; Cue: n=255 ROIs from 6 mice. Fisher’s exact test with Bonferroni correction. P=1.2×10⁻⁷ for Cue-vs-All and Cue-vs-Other). Fraction of hand-drawn cue-responsive and non-cue CA3SC ROIs. k, Fraction of SWR recruitment. l, Schematic of window implantation above CA3 stratum pyramidale and CA3 pyramidal cells injected with rAAV2/1:Syn(GCaMP7f)Cre in Grik4-Cre mice. A 4-channel linear silicon probe was implanted in contralateral CA1. m, Example motion-corrected, time-averaged two photon imaging FOV from one representative mouse (n=6 in this study). Scale bar=100 μm n, Left, two example Suite2p-detected ROIs from (b). Right, representative GCaMP calcium signals (ΔF/F0) extracted from CA3 pyramidal cell ROIs. o, Mean cue responses±s.e.m. of identified cue-CA3 cells during RC-NS in n=6 mice. p, Mean peri-SWR response±s.e.m. of cue- and non-cue-CA3 cells recorded during RC-NS. q, Fraction of cue-responsive and non-cue CA3 cells in RC-NS. r, Fraction of SWR recruitment during RC-NS and POST (Other: n=238; Cue: n=76 ROIs from 6 mice. two-sided Fisher’s exact test with Bonferroni correction. P=2.7×10⁻⁹ for Cue-vs-All and Cue-vs-Other).
Extended Data Fig. 8 |. Spatial coding profiles of CA3SCs in FC-S.
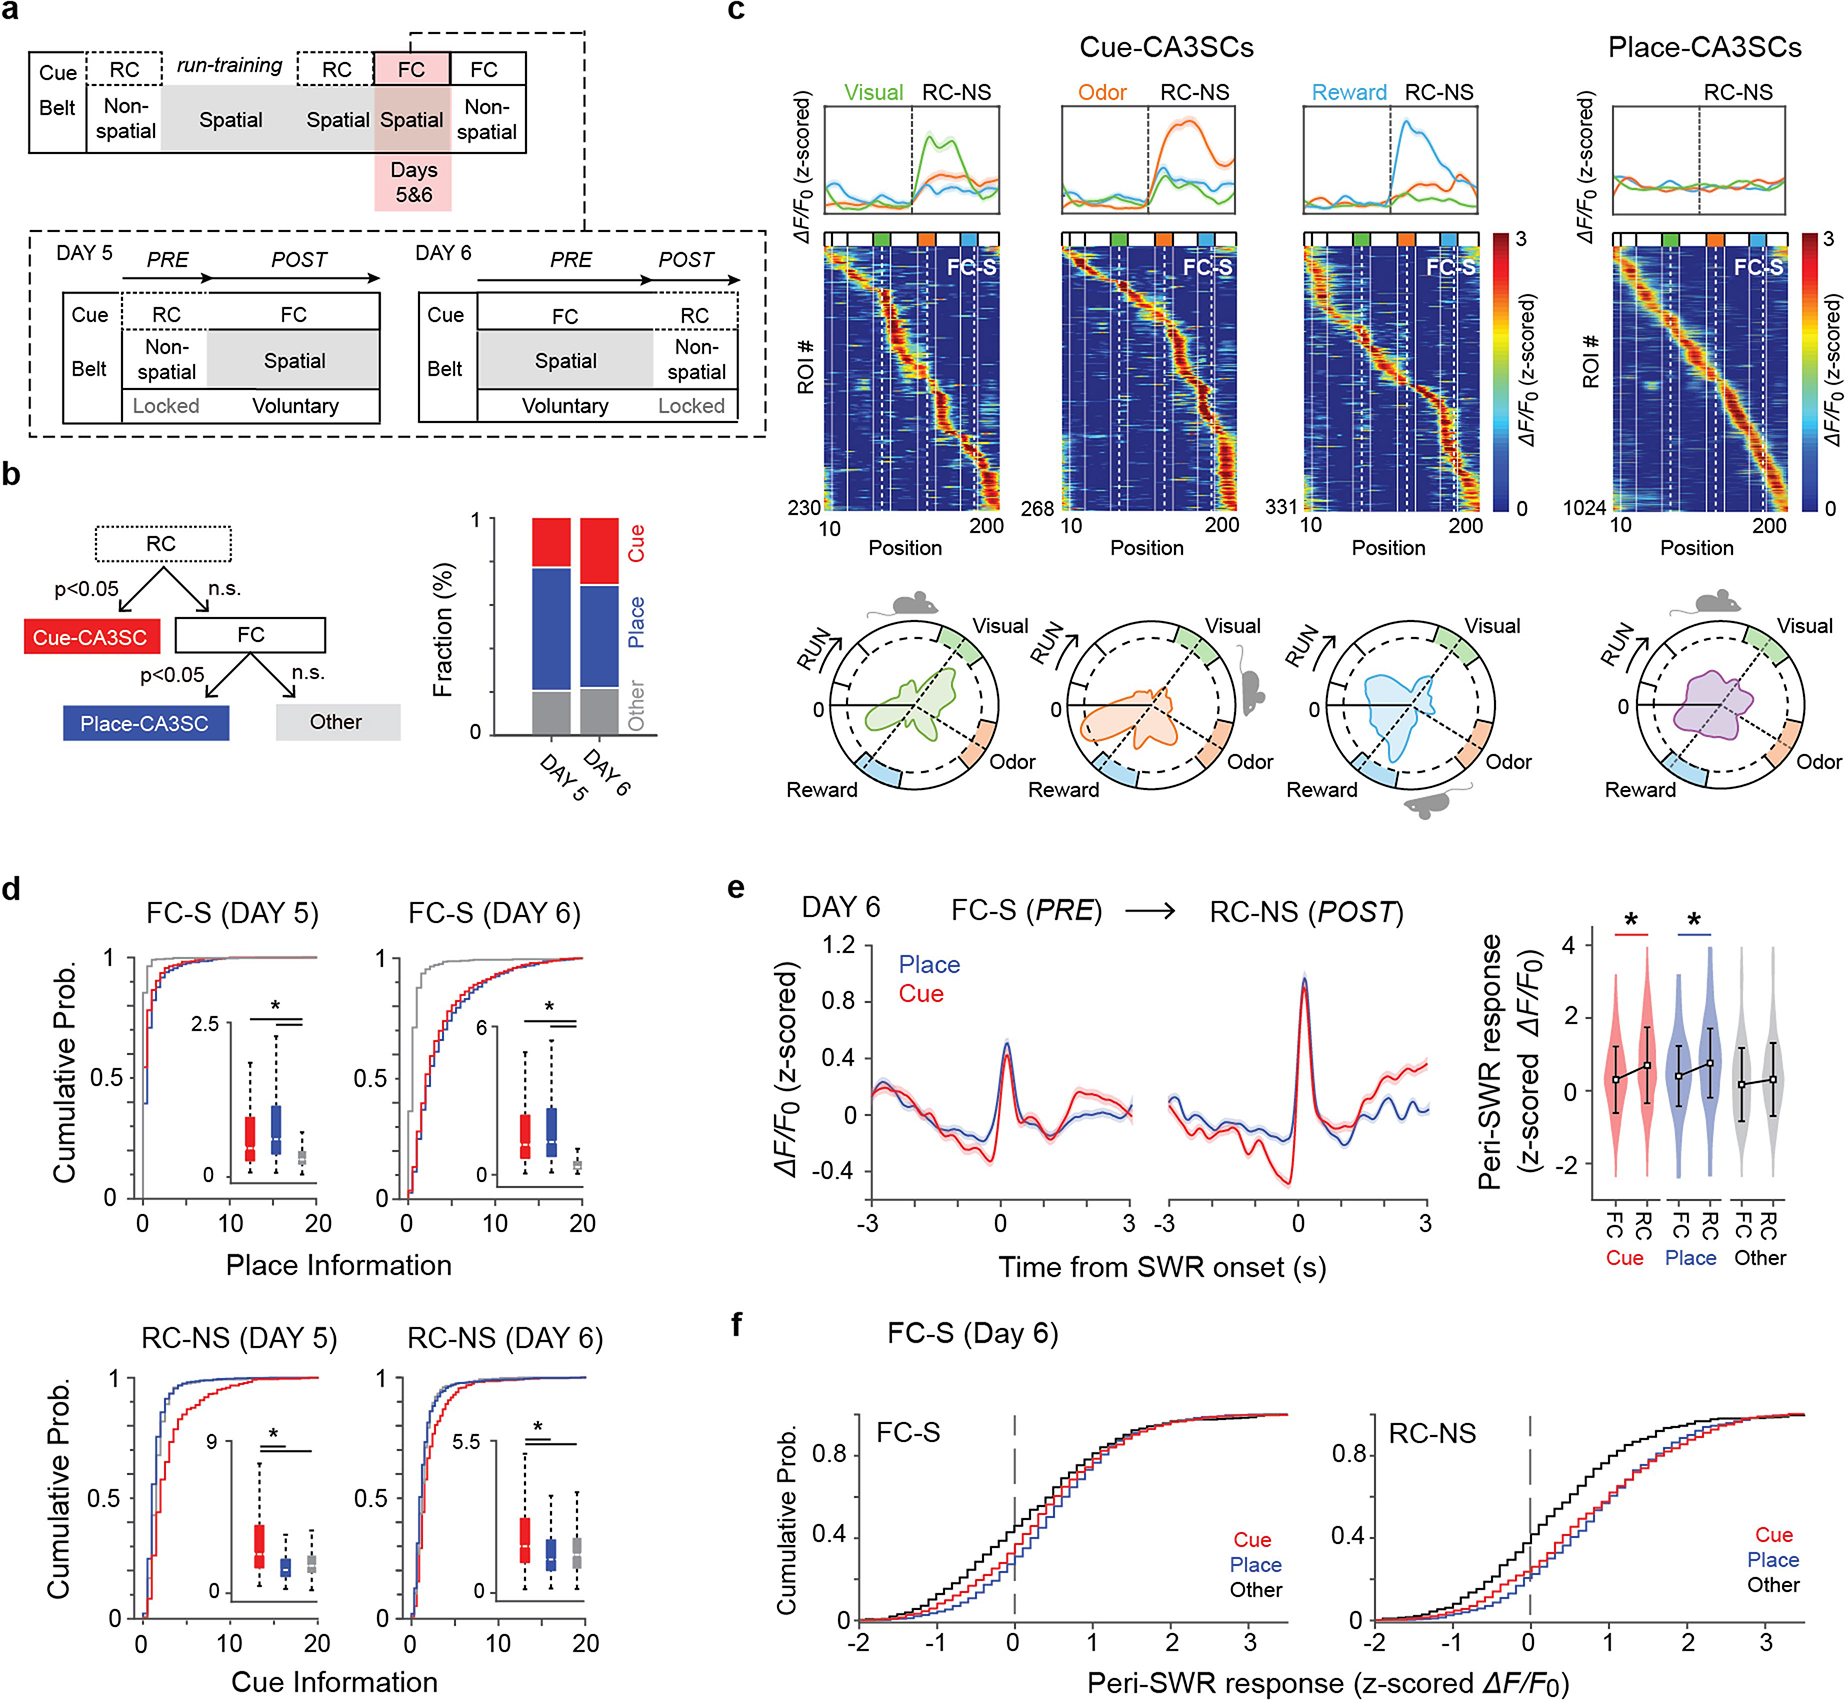
a, Design of session block on Days 5 and 6 (Methods). b, Left, diagram of CA3SC ROI classification scheme on Days 5 and 6. Right, Fraction of active CA3SCs on Days 5 and Day 6. Each color indicates classified CA3SCs (Cue: n = 661, Place: n = 1,024, Other: n = 459 from 3 mice). c, Mean responses during RC-NS. Middle, Heatmap of place fields of individual cue-CA3SCs during FC-S with ROIs sorted according to location of peak activity to illustrate place coding (bottom). d, Cumulative histograms of cue-related and spatial information (bits). Mean±s.d. information values are shown in the insets. Cue- (red) and place- (blue) CA3SCs showed higher place information than other- (gray) CA3SCs on Day 5 (Cue: n=470, Place: n=1,170, Other: n = 418 from 3 mice). One-way ANOVA with post-hoc Tukey’s test. Main effect of ROI-type for both FC-S and RC-NS: P =4.6×10⁻⁹) and on Day 6 (Cue: n=661, Place: n=1,024, Other: n=459 from 3 mice. One-way ANOVA with post-hoc Tukey’s test. Main effect of ROI-type for both FC-S and RC-NS: P=1.5×10⁻⁵). e, peri-SWR activity in PRE and POST (left, mean±s.e.m.) summary of peri-SWR peak activity (right, mean±s.d.) for cue-, place- and other-CA3SCs on Day 6 (Two-way ANOVA with post-hoc Tukey’s test, main effect of RC-vs-FC: P=8.7×10⁻¹²; main effect of ROI-type: P=2.3×10⁻¹²; interaction: P=7.9×10⁻¹⁰). f, Cumulative distribution plots of peri-SWR, z-scored ΔF/F0 for all CA3SCs shown in (e).
Extended Data Fig. 9 |. SWR-associated high-synchrony events containing recurring CA3SC assemblies.
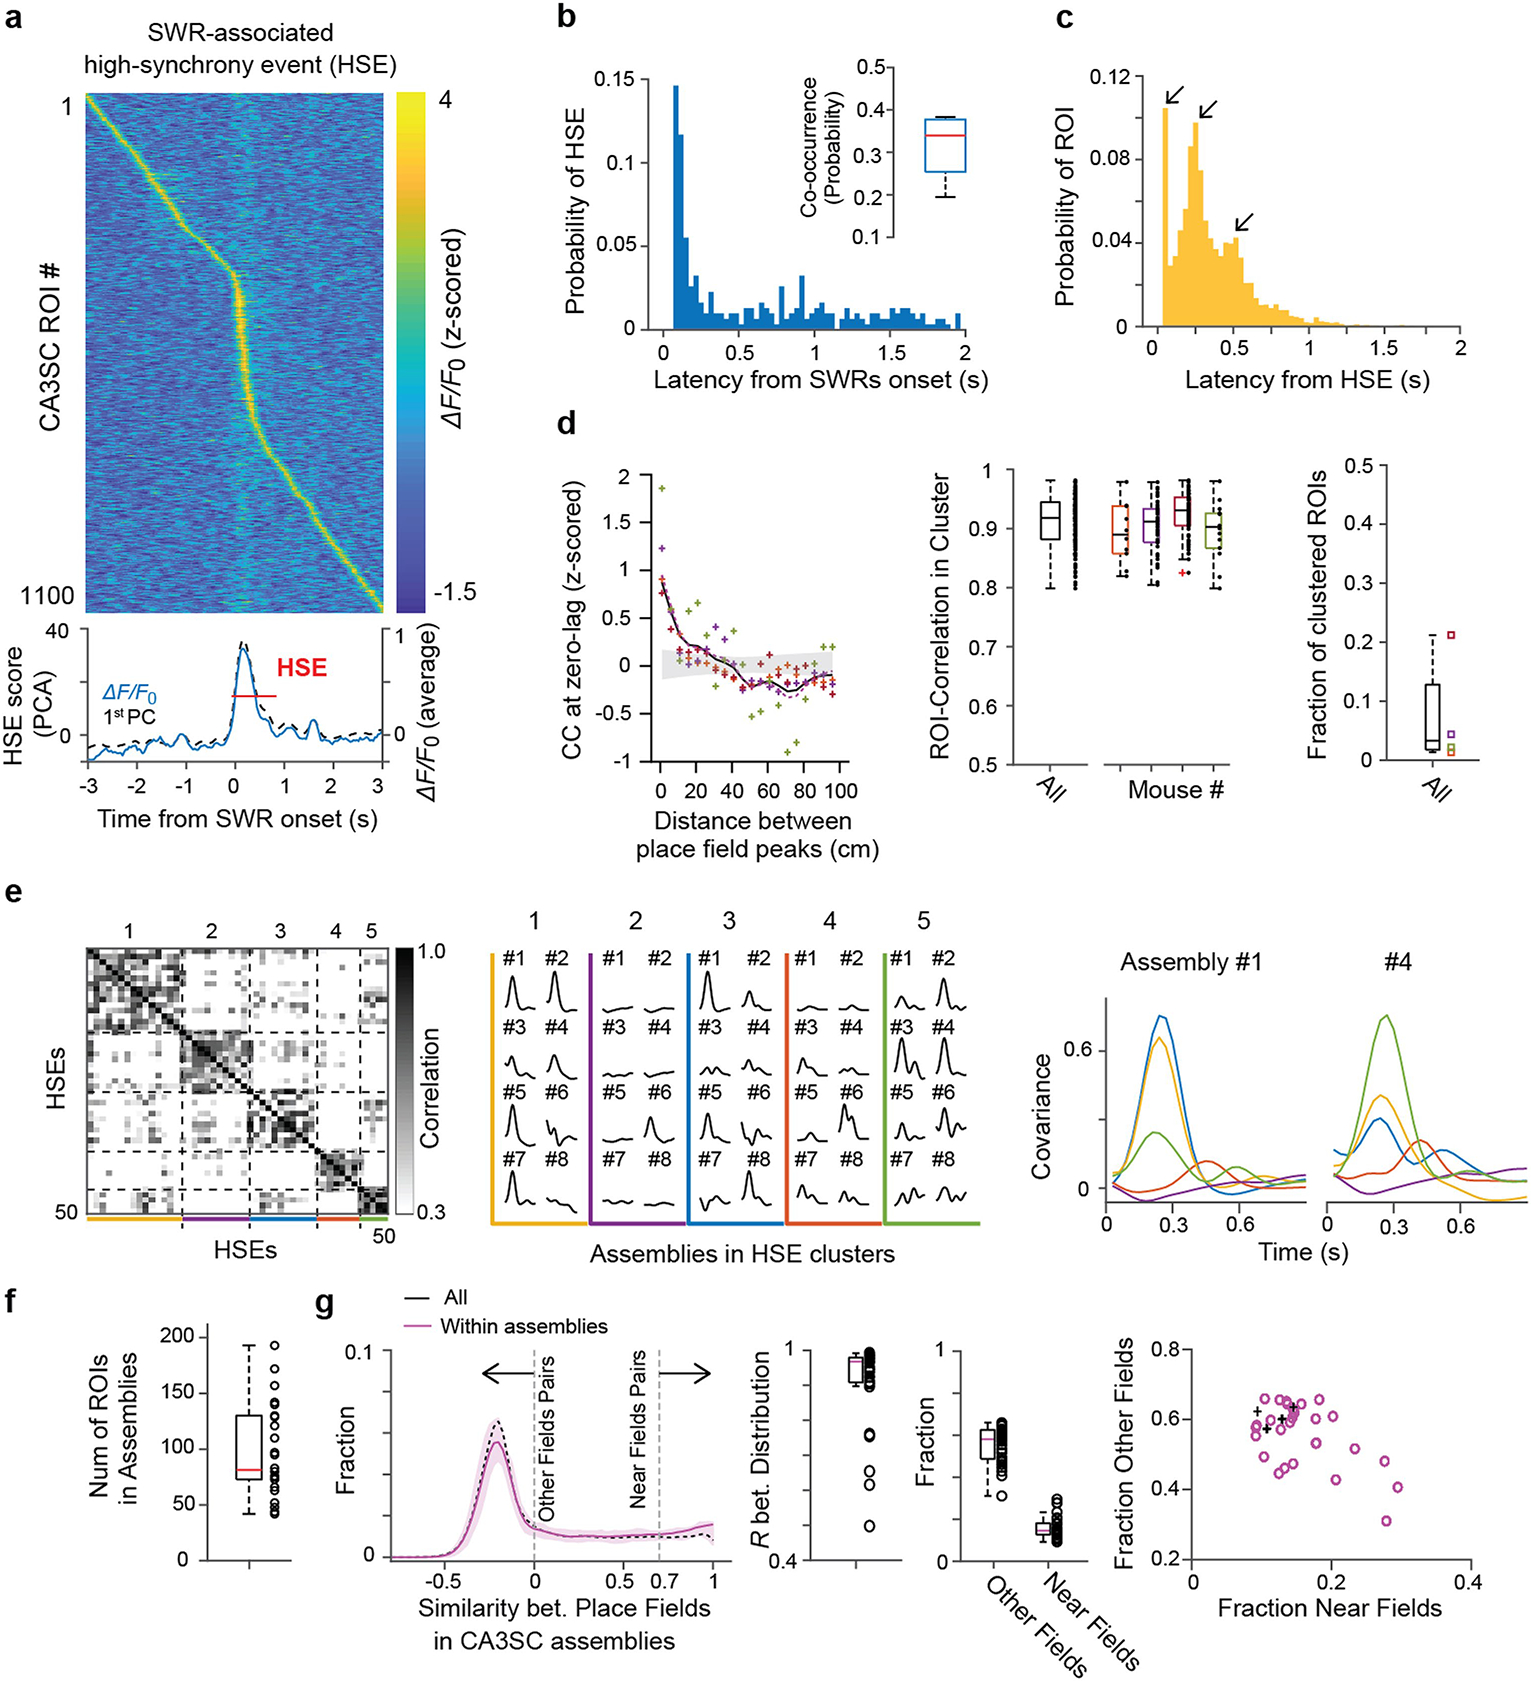
a, Example SWR-associated high-synchrony event (HSE). Top, heatmap showing ΔF/F0 of individual CA3SC ROIs with place fields. Bottom, mean ΔF/F0 and the first principal component (PC) of these ROIs (bottom). 0 point indicates onset of an SWR event. Red line indicates duration of the detected HSE with threshold (Methods). b, Distribution of HSE peak latencies and co-occurrence rate (inset) with SWRs (n=500 HSEs from 4 mice). Red center line in the box plot indicates the median, bottom and top edges of the box denote 25th and 75th percentiles. The whiskers indicate maxima and minima. c, Distribution of individual CA3SC latencies within SWR-associated HSEs. d, Left, normalized cross-correlation (CC) at zero lag between all pairs of CA3SC ROIs replotted from Fig. 4b. Purple dashed line denotes result including all detected ROIs for comparison. Middle, distribution of correlation coefficients between ROIs putatively from the same cells (black: n=139 ROIs, all together; each color: n = 34.75±13.84 clustered ROIs, Mean±s.e.m, individual mice). Red center line in the box plot indicates the median, bottom and top edges of the box denote 25th and 75th percentiles. The whiskers indicate maxima and minima. Right, fraction of clustered ROIs putatively originating from common cells (n=3315 ROIs from 4 mice, Methods). Red center line in the box plot indicates the median, bottom and top edges of the box denote 25th and 75th percentiles. The whiskers indicate maxima and minima. e, Left, similarity matrix of all HSEs containing recurring assemblies in a representative session. Middle, assembly recruitment for each identified HSE cluster. Colored lines and traces with ID numbers correspond to identified HSE clusters and recurring assemblies in the similarity map, respectively. Right, example plots showing participation of 2 recurring assemblies across identified HSE clusters in Fig. 4d (activation quantified as normalized covariance; clusters represented by different colors). f, Boxplot of the number of CA3SC ROIs in each identified recurring assembly (median with 25th and 75th percentiles from n=4 mice). The whiskers indicate maxima and minima. g, Distribution of correlation coefficients between place fields within the recurring assemblies (magenta, mean with 25th and 75th percentiles), and all cue-place CA3SC ROIs in a field of view (black, mean of 4 mice). Pairs with coefficients >0.7 are considered as ‘Near’ fields, and coefficients <0 are considered as ‘Other’ field pairs. Middle, boxplots of correlation coefficients between the distribution within assemblies (n=28 HSE clusters from 4 mice, median with 25th and 75th percentiles). Right, fractions of ‘Other’ fields and ‘Near’ fields pairs within assemblies. Right, scatter plot based on these fractions (magenta circles for each assembly, black cross for mean value of all ROIs from each mouse). Notably, the lack of bias for recurring assemblies to comprise CA3SCs representing similar spatial locations suggests that individual structured replay sequences of CA3SC activity represent past experience in a relatively unbiased manner. Red center lines in the box plots indicate the median, bottom and top edges of the boxes denote 25th and 75th percentiles. The whiskers indicate maxima and minima, outliers excluded.
Extended Data Fig. 10 |. Validation of convNMF on simulated CA3 replay sequences.
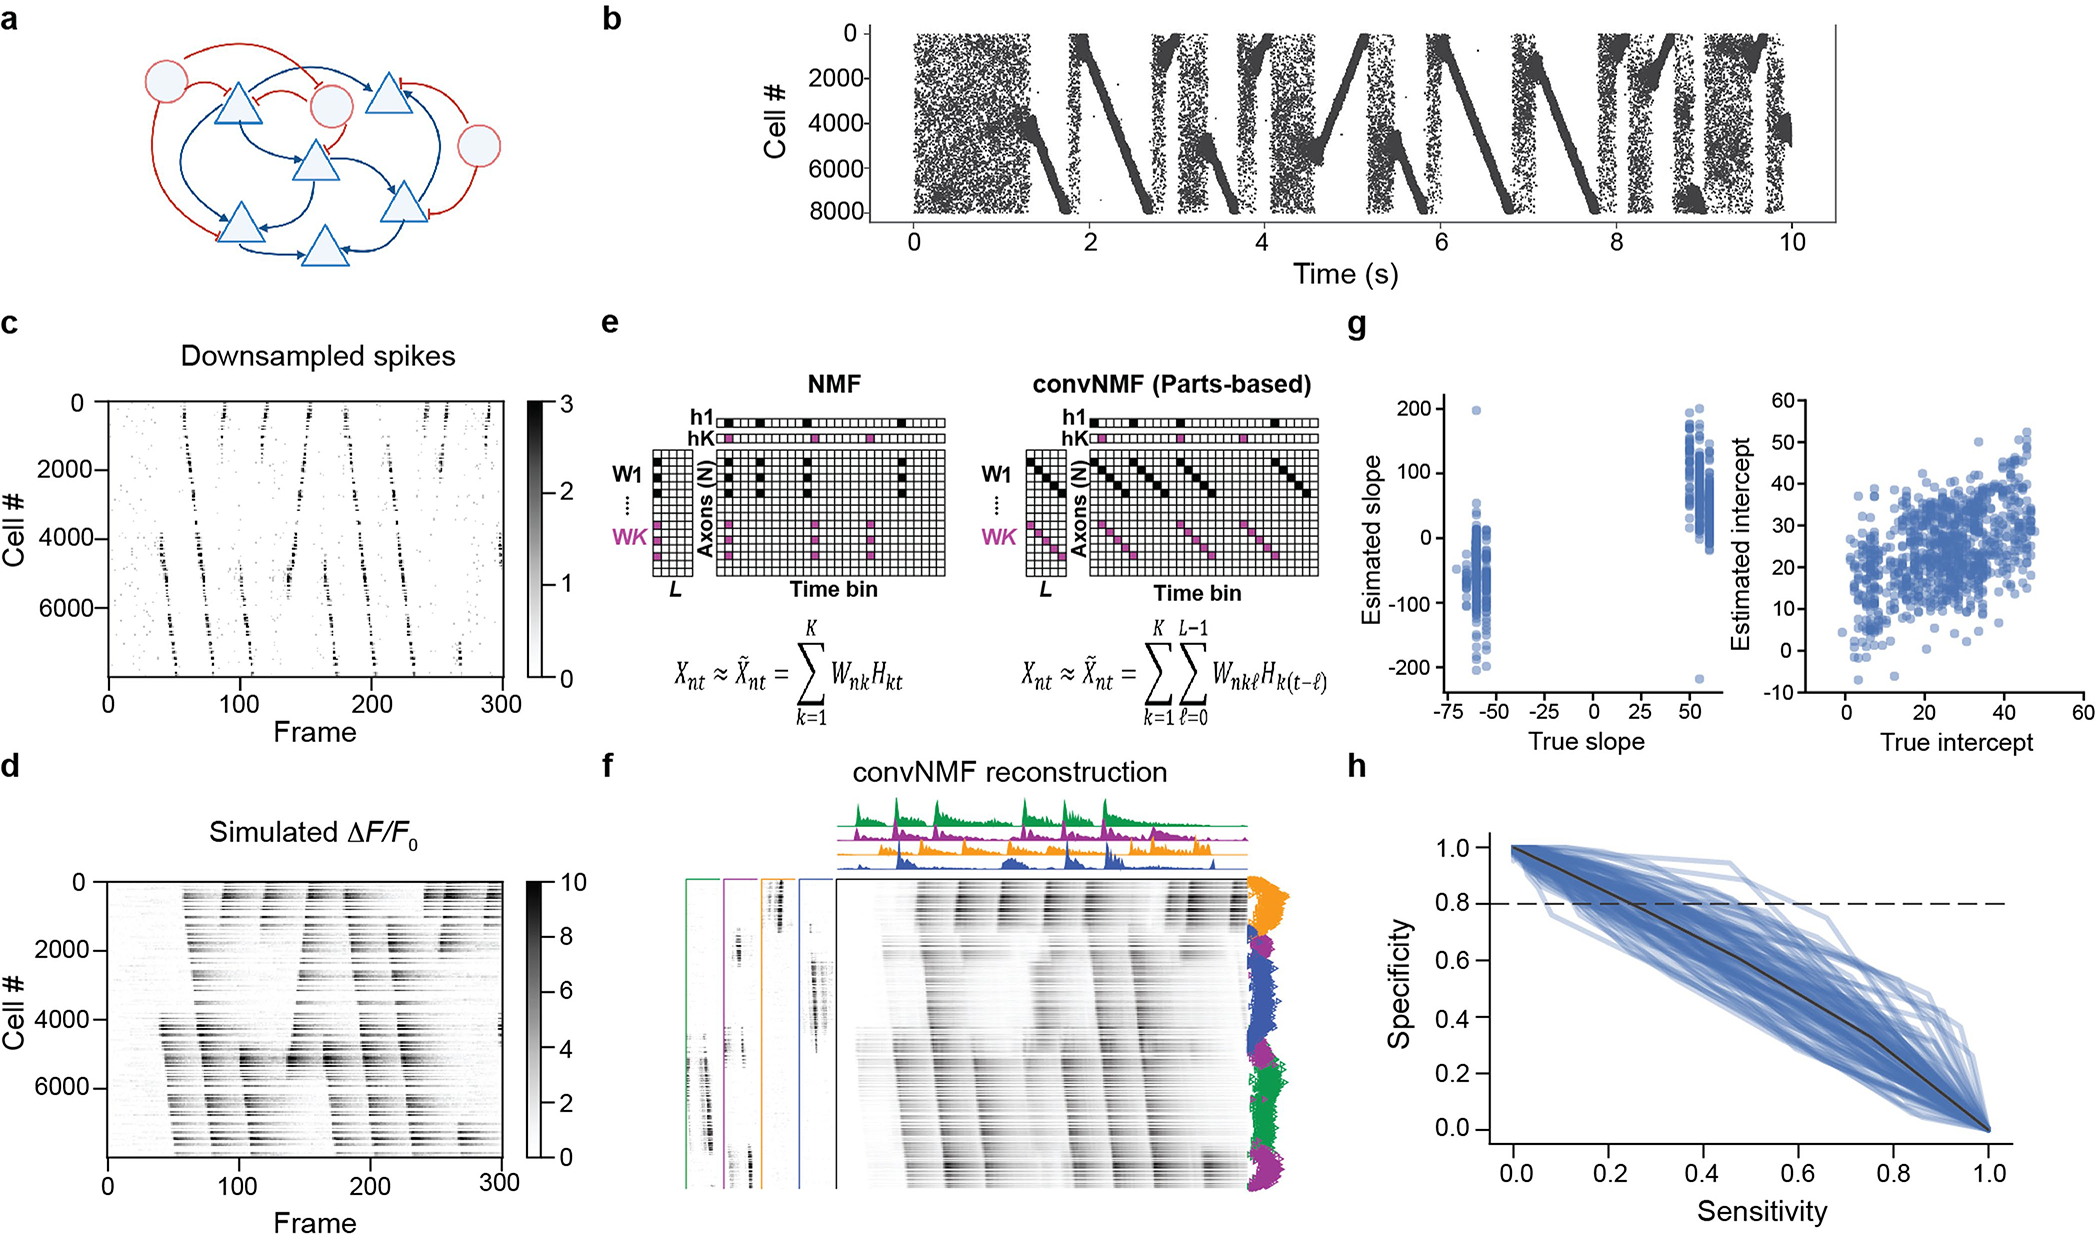
a, Randomly, recurrently-connected spiking network model (pyramidal cells, blue triangles; interneurons, red circles) of CA3 used to generate synthetic replay sequences (Methods). b, Replay occurs spontaneously at rest in the simulated CA3 network (n=8000 simulated pyramidal cells, 150 inhibitory interneurons): 10 s simulation epoch, sampled at 10 kHz. Cell × time raster. c, Simulated spike rasters from (b) are re-binned to the calcium sampling rate (30 Hz). d, Re-binned spikes are then convolved with a calcium kernel (tau=0.65 s), with added white Gaussian noise to simulate experimental conditions. e, Schematic of convNMF technique used to detect sequential reactivation events, vs standard NMF (Methods). The convNMF approximates the cell × time raster as the sum of K matrices, each which can be decomposed into the convolution of a rank-1 temporal component with cell × lag matrix. Unlike standard NMF, convNMF extracts recurring, localized sequential activity patterns. f, High-fidelity reconstruction of the simulated replay/calcium dataset in (b) is achieved using the convNMF-identified replay ensembles (left panels) and temporal factors (top traces). Each cell-component (left panel) represents a recurring sequential pattern of cell activations detected in the network. g, Slopes and intercepts were calculated for inferred replay events which were then compared to ground truth. ConvNMF accurately identifies replay events and extracted sequences of replaying cells. Left, scatterplot of true (x-axis) vs inferred (y-axis) replay slopes (a.u.). Note that this simulation also demonstrates that forward and reverse replay events are reliably differentiated by convNMF. Right, distribution of true (x-axis) vs inferred (y-axis) replay intercepts. h, ROC curve of sensitivity/specificity of replay event detection by convNMF. Specificity is prioritized over sensitivity. 20–60% of “true” replay events were detected at an 80% specificity threshold.
Acknowledgements
S.T. is supported by a JSPS Overseas Fellowship. A.L. is supported by National Institute of Mental Health (NIMH) 1R01MH124047 and 1R01MH124867, National Institute of Neurological Disorders and Stroke (NINDS) 1U19NS104590 and 1U01NS115530, and the Kavli Foundation. B.V. is supported by grants (NIH) T32GM007367 and (NIMH) F30MH125628, J.O. is supported by F32MH118716. Z.L. is supported by NINDS F31NS120783–01 and NIH T32GM007367. We thank S. Fusi, M. Shadlen, J. Gottlieb, F. Polleux and I. Soltesz, as well as members of the Losonczy laboratory and D. Hadjiabadi (Soltesz laboratory), for their invaluable comments on previous versions of the manuscript.
Footnotes
Competing interests The authors declare no competing interests.
Supplementary information The online version contains supplementary material available at https://doi.org/10.1038/s41586-021-04118-6.
Peer review information Nature thanks Aman Saleem and the other, anonymous, reviewer(s) for their contribution to the peer review of this work.
Reprints and permissions information is available at http://www.nature.com/reprints.
References
- 1.Eichenbaum H A cortical–hippocampal system for declarative memory. Nat. Rev. Neurosci. 1, 41–50, (2000). [DOI] [PubMed] [Google Scholar]
- 2.Whittington JCR et al. The Tolman–Eichenbaum machine: unifying space and relational memory through generalization in the hippocampal formation. Cell 183, 1249–1263, (2020). [DOI] [PMC free article] [PubMed] [Google Scholar]
- 3.Desimone R & Duncan J Neural mechanisms of selective visual attention. Ann. Rev. Neurosci. 18, 193–222, (1995). [DOI] [PubMed] [Google Scholar]
- 4.Knudsen EI Fundamental components of attention. Ann. Rev. Neurosci. 30, 57–78, (2007). [DOI] [PubMed] [Google Scholar]
- 5.Buzsaki G Hippocampal sharp wave-ripple: a cognitive biomarker for episodic memory and planning. Hippocampus 25, 1073–1188, (2015). [DOI] [PMC free article] [PubMed] [Google Scholar]
- 6.Kentros CG, Agnihotri NT, Streater S, Hawkins RD & Kandel ER Increased attention to spatial context increases both place field stability and spatial memory. Neuron 42, 283–295 (2004). [DOI] [PubMed] [Google Scholar]
- 7.Rowland DC & Kentros CG Potential anatomical basis for attentional modulation of hippocampal neurons. Ann. N.Y. Acad. Sci. 1129, 213–224, (2008). [DOI] [PubMed] [Google Scholar]
- 8.Aronov D, Nevers R & Tank DW Mapping of a non-spatial dimension by the hippocampal–entorhinal circuit. Nature 543, 719–722, (2017). [DOI] [PMC free article] [PubMed] [Google Scholar]
- 9.Constantinescu AO, O’Reilly JX & Behrens TEJ Organizing conceptual knowledge in humans with a gridlike code. Science 352, 1464–1468, (2016). [DOI] [PMC free article] [PubMed] [Google Scholar]
- 10.Kesner RP & Rolls ET A computational theory of hippocampal function, and tests of the theory: new developments. Neurosci. Biobehav. Rev. 48, 92–147, (2015). [DOI] [PubMed] [Google Scholar]
- 11.Nakazawa K et al. Hippocampal CA3 NMDA receptors are crucial for memory acquisition of one-time experience. Neuron 38, 305–315 (2003). [DOI] [PubMed] [Google Scholar]
- 12.Kudrimoti HS, Barnes CA & McNaughton BL Reactivation of hippocampal cell assemblies: effects of behavioral state, experience, and EEG dynamics. J. Neurosci. 19, 4090–4101 (1999). [DOI] [PMC free article] [PubMed] [Google Scholar]
- 13.Wilson MA & McNaughton BL Reactivation of hippocampal ensemble memories during sleep. Science 265, 676–679 (1994). [DOI] [PubMed] [Google Scholar]
- 14.Jadhav SP, Kemere C, German PW & Frank LM Awake hippocampal sharp-wave ripples support spatial memory. Science 336, 1454–1458, (2012). [DOI] [PMC free article] [PubMed] [Google Scholar]
- 15.Nakashiba T, Buhl DL, McHugh TJ & Tonegawa S Hippocampal CA3 output is crucial for ripple-associated reactivation and consolidation of memory. Neuron 62, 781–787, (2009). [DOI] [PMC free article] [PubMed] [Google Scholar]
- 16.Nakashiba T, Young JZ, McHugh TJ, Buhl DL & Tonegawa S Transgenic inhibition of synaptic transmission reveals role of CA3 output in hippocampal learning. Science 319, 1260–1264, (2008). [DOI] [PubMed] [Google Scholar]
- 17.Csicsvari J, Hirase H, Mamiya A & Buzsaki G Ensemble patterns of hippocampal CA3–CA1 neurons during sharp wave-associated population events. Neuron 28, 585–594, (2000). [DOI] [PubMed] [Google Scholar]
- 18.Diba K & Buzsaki G Forward and reverse hippocampal place-cell sequences during ripples. Nat. Neurosci. 10, 1241–1242, (2007). [DOI] [PMC free article] [PubMed] [Google Scholar]
- 19.Danielson NB et al. Sublayer-specific coding dynamics during spatial navigation and learning in hippocampal area CA1. Neuron 91, 652–665, (2016). [DOI] [PMC free article] [PubMed] [Google Scholar]
- 20.Zaremba JD et al. Impaired hippocampal place cell dynamics in a mouse model of the 22q11.2 deletion. Nat. Neurosci. 20, 1612–1623, (2017). [DOI] [PMC free article] [PubMed] [Google Scholar]
- 21.O’Keefe J & Dostrovsky J The hippocampus as a spatial map. Preliminary evidence from unit activity in the freely-moving rat. Brain Res. 34, 171–175 (1971). [DOI] [PubMed] [Google Scholar]
- 22.Hunt DL, Linaro D, Si B, Romani S & Spruston N A novel pyramidal cell type promotes sharp-wave synchronization in the hippocampus. Nat. Neurosci. 21, 985–995, (2018). [DOI] [PubMed] [Google Scholar]
- 23.Soltesz I & Losonczy A CA1 pyramidal cell diversity enabling parallel information processing in the hippocampus. Nat. Neurosci. 21, 484–493, (2018). [DOI] [PMC free article] [PubMed] [Google Scholar]
- 24.Mysore SP & Knudsen EI Reciprocal inhibition of inhibition: a circuit motif for flexible categorization in stimulus selection. Neuron 73, 193–205, (2012). [DOI] [PMC free article] [PubMed] [Google Scholar]
- 25.Geiller T et al. Large-scale 3D two-photon imaging of molecularly identified CA1 interneuron dynamics in behaving mice. Neuron 108, 968–983, (2020). [DOI] [PMC free article] [PubMed] [Google Scholar]
- 26.Gupta AS, van der Meer MA, Touretzky DS & Redish AD Hippocampal replay is not a simple function of experience. Neuron 65, 695–705, (2010). [DOI] [PMC free article] [PubMed] [Google Scholar]
- 27.Wu CT, Haggerty D, Kemere C & Ji D Hippocampal awake replay in fear memory retrieval. Nat. Neurosci. 20, 571–580, (2017). [DOI] [PMC free article] [PubMed] [Google Scholar]
- 28.Ahmed MS et al. Hippocampal network reorganization underlies the formation of a temporal association memory. Neuron, 10.1016/j.neuron.2020.04.013 (2020). [DOI] [PMC free article] [PubMed] [Google Scholar]
- 29.Liu Y, Mattar MG, Behrens TEJ, Daw ND & Dolan RJ Experience replay is associated with efficient nonlocal learning. Science 372, 10.1126/science.abf1357 (2021). [DOI] [PMC free article] [PubMed] [Google Scholar]
- 30.Grosmark AD & Buzsaki G Diversity in neural firing dynamics supports both rigid and learned hippocampal sequences. Science 351, 1440–1443, (2016). [DOI] [PMC free article] [PubMed] [Google Scholar]
- 31.Kaufman AM, Geiller T & Losonczy A A role for the locus coeruleus in hippocampal CA1 place cell reorganization during spatial reward learning. Neuron 105, 1018–1026, (2020). [DOI] [PMC free article] [PubMed] [Google Scholar]
- 32.Kaifosh P, Lovett-Barron M, Turi GF, Reardon TR & Losonczy A Septo-hippocampal GABAergic signaling across multiple modalities in awake mice. Nat. Neurosci. 16, 1182–1184, (2013). [DOI] [PubMed] [Google Scholar]
- 33.Lovett-Barron M et al. Dendritic inhibition in the hippocampus supports fear learning. Science 343, 857–863, (2014). [DOI] [PMC free article] [PubMed] [Google Scholar]
- 34.Pachitariu M et al. Suite2p: beyond 10,000 neurons with standard two-photon microscopy. Preprint at bioRxiv, 061507, 10.1101/061507 (2016). [DOI] [Google Scholar]
- 35.Hainmueller T & Bartos M Parallel emergence of stable and dynamic memory engrams in the hippocampus. Nature 558, 292–296, (2018). [DOI] [PMC free article] [PubMed] [Google Scholar]
- 36.Dong C, Madar AD & Sheffield MEJ Distinct place cell dynamics in CA1 and CA3 encode experience in new environments. Nat. Commun. 12, 2977, (2021). [DOI] [PMC free article] [PubMed] [Google Scholar]
- 37.Rajasethupathy P et al. Projections from neocortex mediate top–down control of memory retrieval. Nature, 10.1038/nature15389 (2015). [DOI] [PMC free article] [PubMed] [Google Scholar]
- 38.Ali F & Kwan AC Interpreting in vivo calcium signals from neuronal cell bodies, axons, and dendrites: a review. Neurophotonics 7, 011402, (2020). [DOI] [PMC free article] [PubMed] [Google Scholar]
- 39.Cox CL, Denk W, Tank DW & Svoboda K Action potentials reliably invade axonal arbors of rat neocortical neurons. Proc. Natl Acad. Sci. USA 97, 9724–9728, (2000). [DOI] [PMC free article] [PubMed] [Google Scholar]
- 40.Petreanu L et al. Activity in motor-sensory projections reveals distributed coding in somatosensation. Nature 489, 299–303, (2012). [DOI] [PMC free article] [PubMed] [Google Scholar]
- 41.Dugladze T, Schmitz D, Whittington MA, Vida I & Gloveli T Segregation of axonal and somatic activity during fast network oscillations. Science 336, 1458–1461, (2012). [DOI] [PubMed] [Google Scholar]
- 42.Williams AH et al. Unsupervised discovery of demixed, low-dimensional neural dynamics across multiple timescales through tensor component analysis. Neuron 98, 1099–1115, (2018). [DOI] [PMC free article] [PubMed] [Google Scholar]
- 43.Skaggs WE, Mcnaughton BL, Markus EJ & Gothard KM in Advances in Neural Information Process Systems (eds Hanson S et al.) Vol. 5, 1030–1037 (Morgan Kaufmann, 1993). [Google Scholar]
- 44.Mackevicius EL et al. Unsupervised discovery of temporal sequences in high-dimensional datasets, with applications to neuroscience. eLife 8, 10.7554/eLife.38471 (2019). [DOI] [PMC free article] [PubMed] [Google Scholar]
- 45.Malvache A, Reichinnek S, Villette V, Haimerl C & Cossart R Awake hippocampal reactivations project onto orthogonal neuronal assemblies. Science 353, 1280–1283, (2016). [DOI] [PubMed] [Google Scholar]
- 46.Ecker A et al. Hippocampal sharp wave-ripples and the associated sequence replay emerge from structured synaptic interactions in a network model of area CA3. Preprint at bioRxiv, 2021.2002.2018.431868, 10.1101/2021.02.18.431868 (2021). [DOI] [PMC free article] [PubMed] [Google Scholar]
- 47.Friedrich J, Zhou P & Paninski L Fast online deconvolution of calcium imaging data. PLoS Comput. Biol. 13, e1005423, (2017). [DOI] [PMC free article] [PubMed] [Google Scholar]
Associated Data
This section collects any data citations, data availability statements, or supplementary materials included in this article.
Data Availability Statement
Datasets included in this study are available from the corresponding author upon reasonable request. Source data are provided with this paper.


