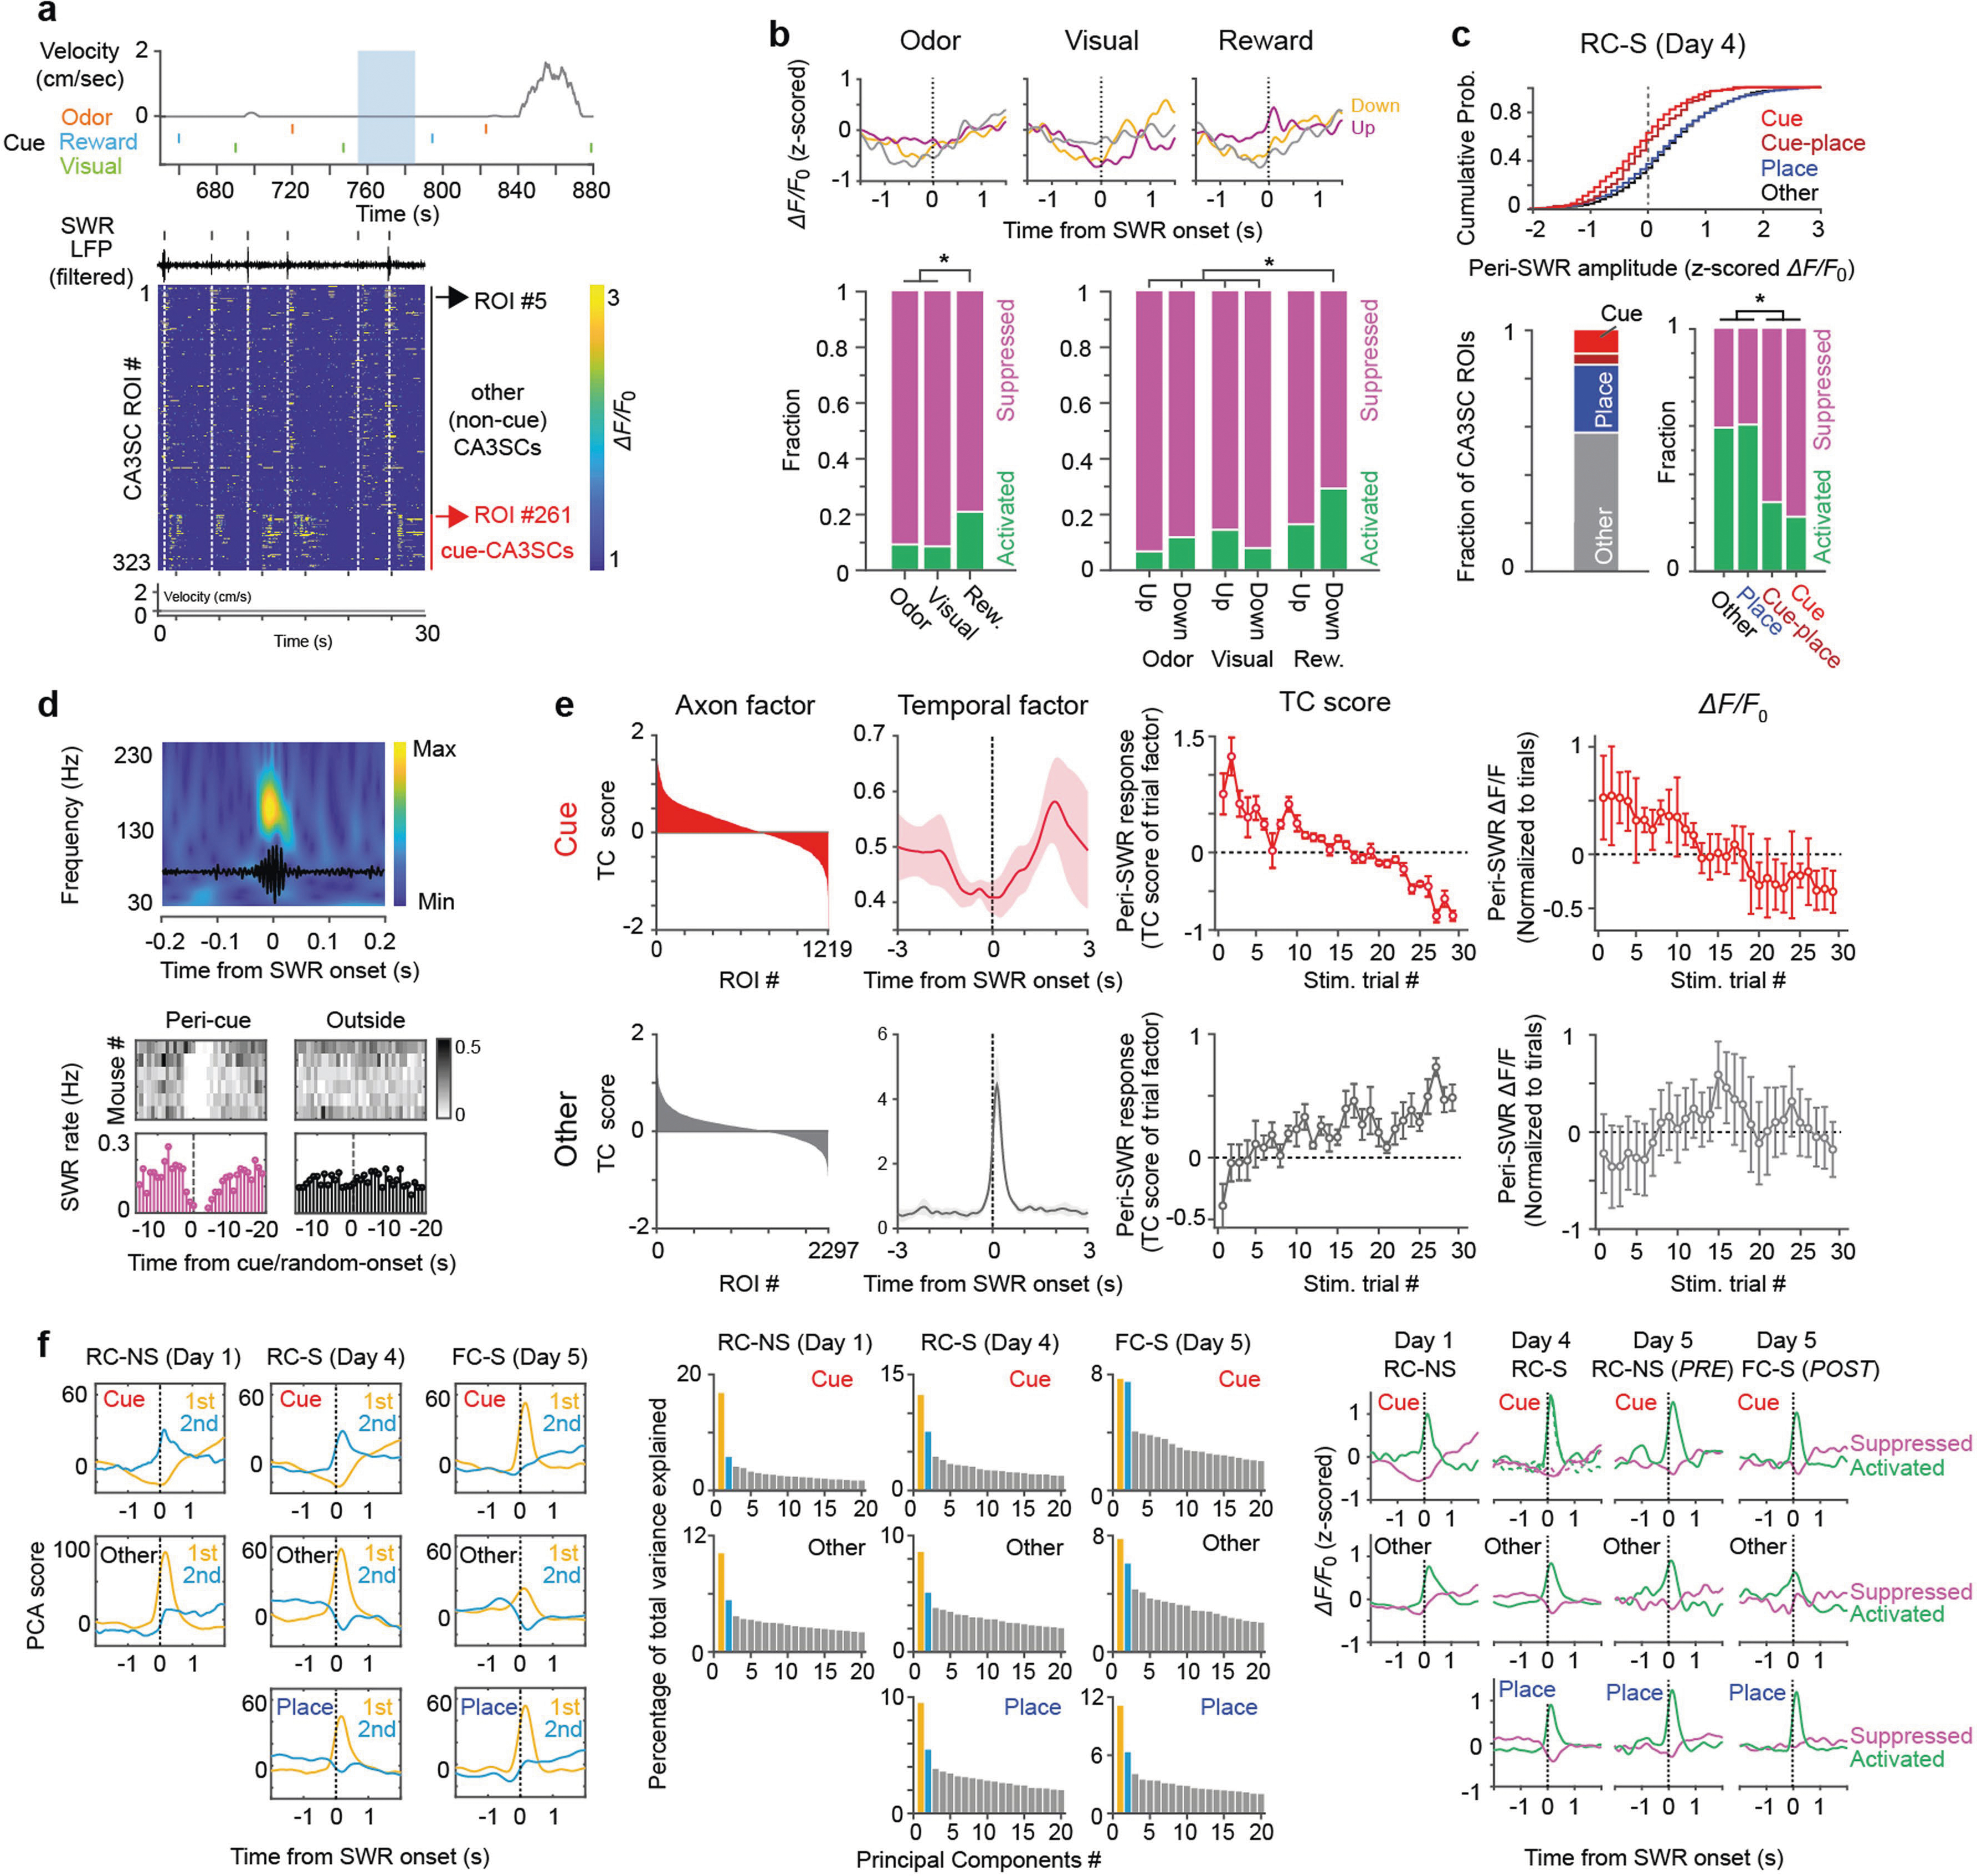
Extended Data Fig. 6 |. Additional data on SWR recruitment of cue-CA3SCs in random cue conditions.

a, Top, Example period of velocity and cue onsets. Blue shaded area corresponds to time window in the below heatmap showing examples of peri-SWR CA3SC activity. Bottom: SWR band-filtered LFP is plotted on top with detected CA1 SWRs indicated by black ticks and white dashed lines. b, Top, Average peri-SWR response in each group shown in Fig. 1 for cue-CA3SCs. Bottom, Fraction of SWR recruitments of cue-CA3SCs. Number of ROIs for single-modality: odor: 349, visual: 256, reward: 350. Multi-modality ROIs, n=264; with odor-visual: 74, odor-reward: 30, visual-reward: 107, all-modalities: 53 (two-sided Fisher’s exact test with Bonferroni correction. P=3.7×10⁻⁶ for Odor-vs-Reward. P=1.5×10⁻⁵ for Visual-vs-Reward. P=0.8967 for Odor-vs-Visual. P=3.7×10⁻⁶ for down-Reward-vs-down-Odor, -vs-up-Odor (P=1.6×10⁻⁷), vs-down-Visual (P=3.6×10⁻⁵), vs-up-Visual (P=3.4×10⁻⁵). P=0.0033 for up-Reward-vs-down-Odor, and -vs-up-Odor (P=3.7×10⁻⁵). P=0.2418 for up-Reward-vs-down-Visual. P = 0.0985 for up-Reward-vs-up-Visual. c, Top, Cumulative histograms of peri-SWR z-scored ΔF/F0 of all CA3SCs shown in Fig. 2g (RC-S, Day 4. Other: n=3,371; Place: n=1,644; Cue-Place: n=198, Cue: n=501 from 4 mice). Bottom left, fraction of cue-, cue-place, place-, and non-responsive CA3SC ROIs-. Bottom right, fraction of SWR recruitments of CA3SCs (One-way ANOVA with post-hoc Tukey’s test. ROI-type: P<1.3×10⁻¹⁶. d, Left, mean SWR-triggered power spectrogram of contralateral CA1 LFP (black line: an example filtered LFP trace). Right, peri-cue onset time histogram of SWR rate for all mice and average rate stem plot juxtaposed to random, non-cue-centered onset times (‘outside’). Dashed line indicates onset of cue presentation. While SWR events around cue onset were excluded in the following analysis. e, Top, a single-component TCA model fit to cue-CA3SC peri-SWR suppression over individual SWR events in each mouse (n=17.76±1.39 SWRs in each inter-trial-interval, mean ± s.e.m. from 6 mice). Left, sorted ROI factor for each CA3SC. Middle-left and middle-right, temporal factor and trial factor (mean±s.e.m.). Trial factor TC scores were extracted in each SWR event and indexed to inter-trial intervals where these events were observed. Right, ROI-averaged ΔF/F0 indexed to inter-trial intervals (mean±s.e.m.). Bottom, a single-component TCA model of other-CA3SC peri-SWR activation over SWR events. The trial factor TC score is likely to correlate with synchronicity of all ROIs to SWR events. To more clearly isolate any trend in the trial factor other-CA3SCs, we included only other-CA3SCs with strong responses to SWRs for model fitting (exceeding average amplitude shown in Fig. 2c). The error bars indicate s.e.m. f, Left, extracted PCs representing CA3SC suppression and activation driven by SWRs during different task conditions in each class of CA3SCs (cue, place, and other). K-means clustering was applied to the PCA loadings to classify ROIs as “activated” or “suppressed”. Middle, percentages of variance accounted for by each PC (up to 20). Right, mean peri-SWR response of classified CA3SCs (dark green: activated, magenta: suppressed).
