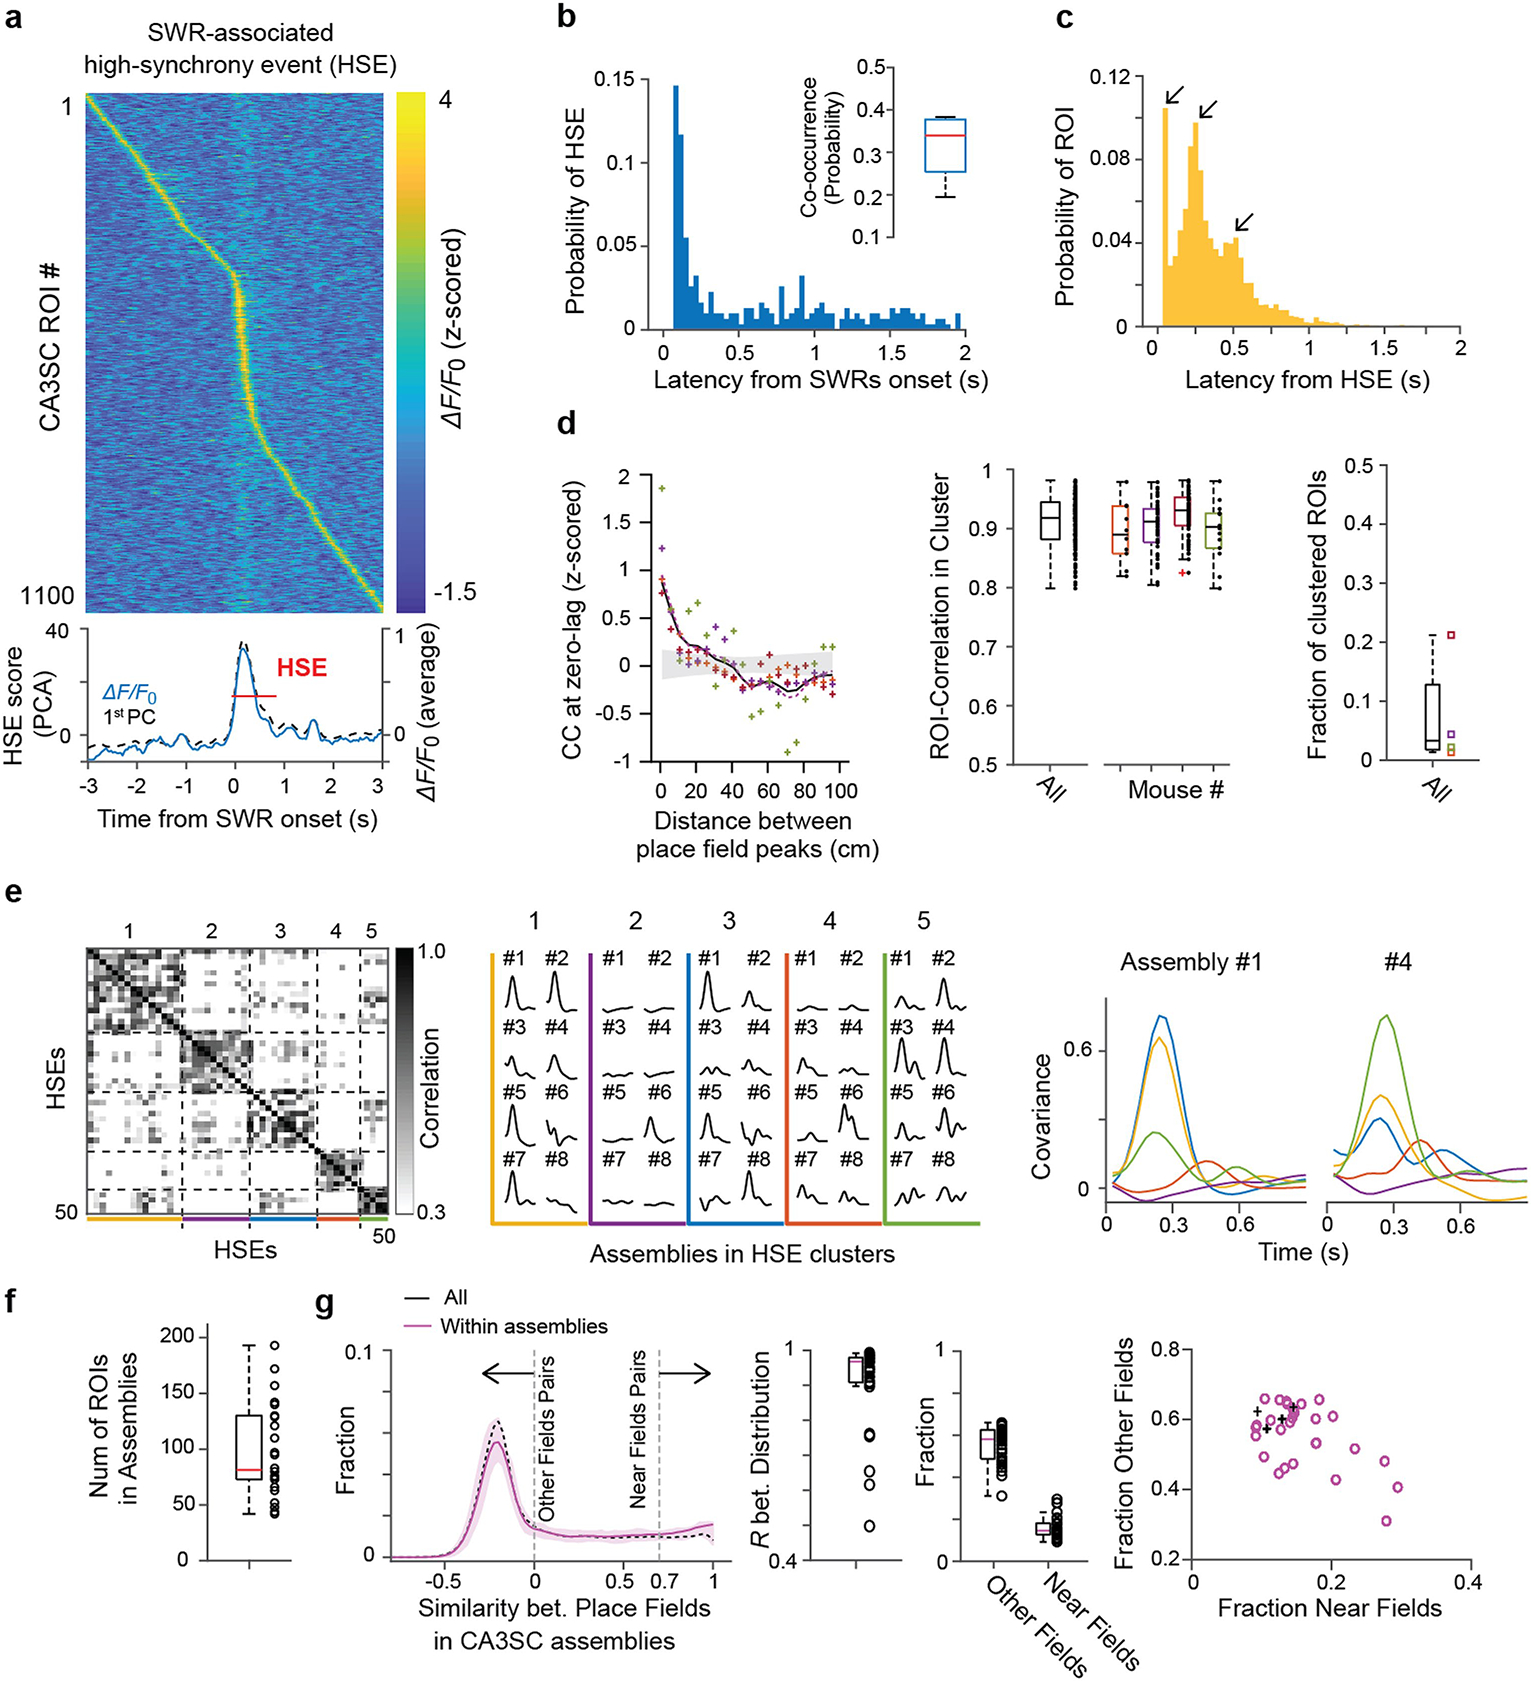
Extended Data Fig. 9 |. SWR-associated high-synchrony events containing recurring CA3SC assemblies.

a, Example SWR-associated high-synchrony event (HSE). Top, heatmap showing ΔF/F0 of individual CA3SC ROIs with place fields. Bottom, mean ΔF/F0 and the first principal component (PC) of these ROIs (bottom). 0 point indicates onset of an SWR event. Red line indicates duration of the detected HSE with threshold (Methods). b, Distribution of HSE peak latencies and co-occurrence rate (inset) with SWRs (n=500 HSEs from 4 mice). Red center line in the box plot indicates the median, bottom and top edges of the box denote 25th and 75th percentiles. The whiskers indicate maxima and minima. c, Distribution of individual CA3SC latencies within SWR-associated HSEs. d, Left, normalized cross-correlation (CC) at zero lag between all pairs of CA3SC ROIs replotted from Fig. 4b. Purple dashed line denotes result including all detected ROIs for comparison. Middle, distribution of correlation coefficients between ROIs putatively from the same cells (black: n=139 ROIs, all together; each color: n = 34.75±13.84 clustered ROIs, Mean±s.e.m, individual mice). Red center line in the box plot indicates the median, bottom and top edges of the box denote 25th and 75th percentiles. The whiskers indicate maxima and minima. Right, fraction of clustered ROIs putatively originating from common cells (n=3315 ROIs from 4 mice, Methods). Red center line in the box plot indicates the median, bottom and top edges of the box denote 25th and 75th percentiles. The whiskers indicate maxima and minima. e, Left, similarity matrix of all HSEs containing recurring assemblies in a representative session. Middle, assembly recruitment for each identified HSE cluster. Colored lines and traces with ID numbers correspond to identified HSE clusters and recurring assemblies in the similarity map, respectively. Right, example plots showing participation of 2 recurring assemblies across identified HSE clusters in Fig. 4d (activation quantified as normalized covariance; clusters represented by different colors). f, Boxplot of the number of CA3SC ROIs in each identified recurring assembly (median with 25th and 75th percentiles from n=4 mice). The whiskers indicate maxima and minima. g, Distribution of correlation coefficients between place fields within the recurring assemblies (magenta, mean with 25th and 75th percentiles), and all cue-place CA3SC ROIs in a field of view (black, mean of 4 mice). Pairs with coefficients >0.7 are considered as ‘Near’ fields, and coefficients <0 are considered as ‘Other’ field pairs. Middle, boxplots of correlation coefficients between the distribution within assemblies (n=28 HSE clusters from 4 mice, median with 25th and 75th percentiles). Right, fractions of ‘Other’ fields and ‘Near’ fields pairs within assemblies. Right, scatter plot based on these fractions (magenta circles for each assembly, black cross for mean value of all ROIs from each mouse). Notably, the lack of bias for recurring assemblies to comprise CA3SCs representing similar spatial locations suggests that individual structured replay sequences of CA3SC activity represent past experience in a relatively unbiased manner. Red center lines in the box plots indicate the median, bottom and top edges of the boxes denote 25th and 75th percentiles. The whiskers indicate maxima and minima, outliers excluded.
