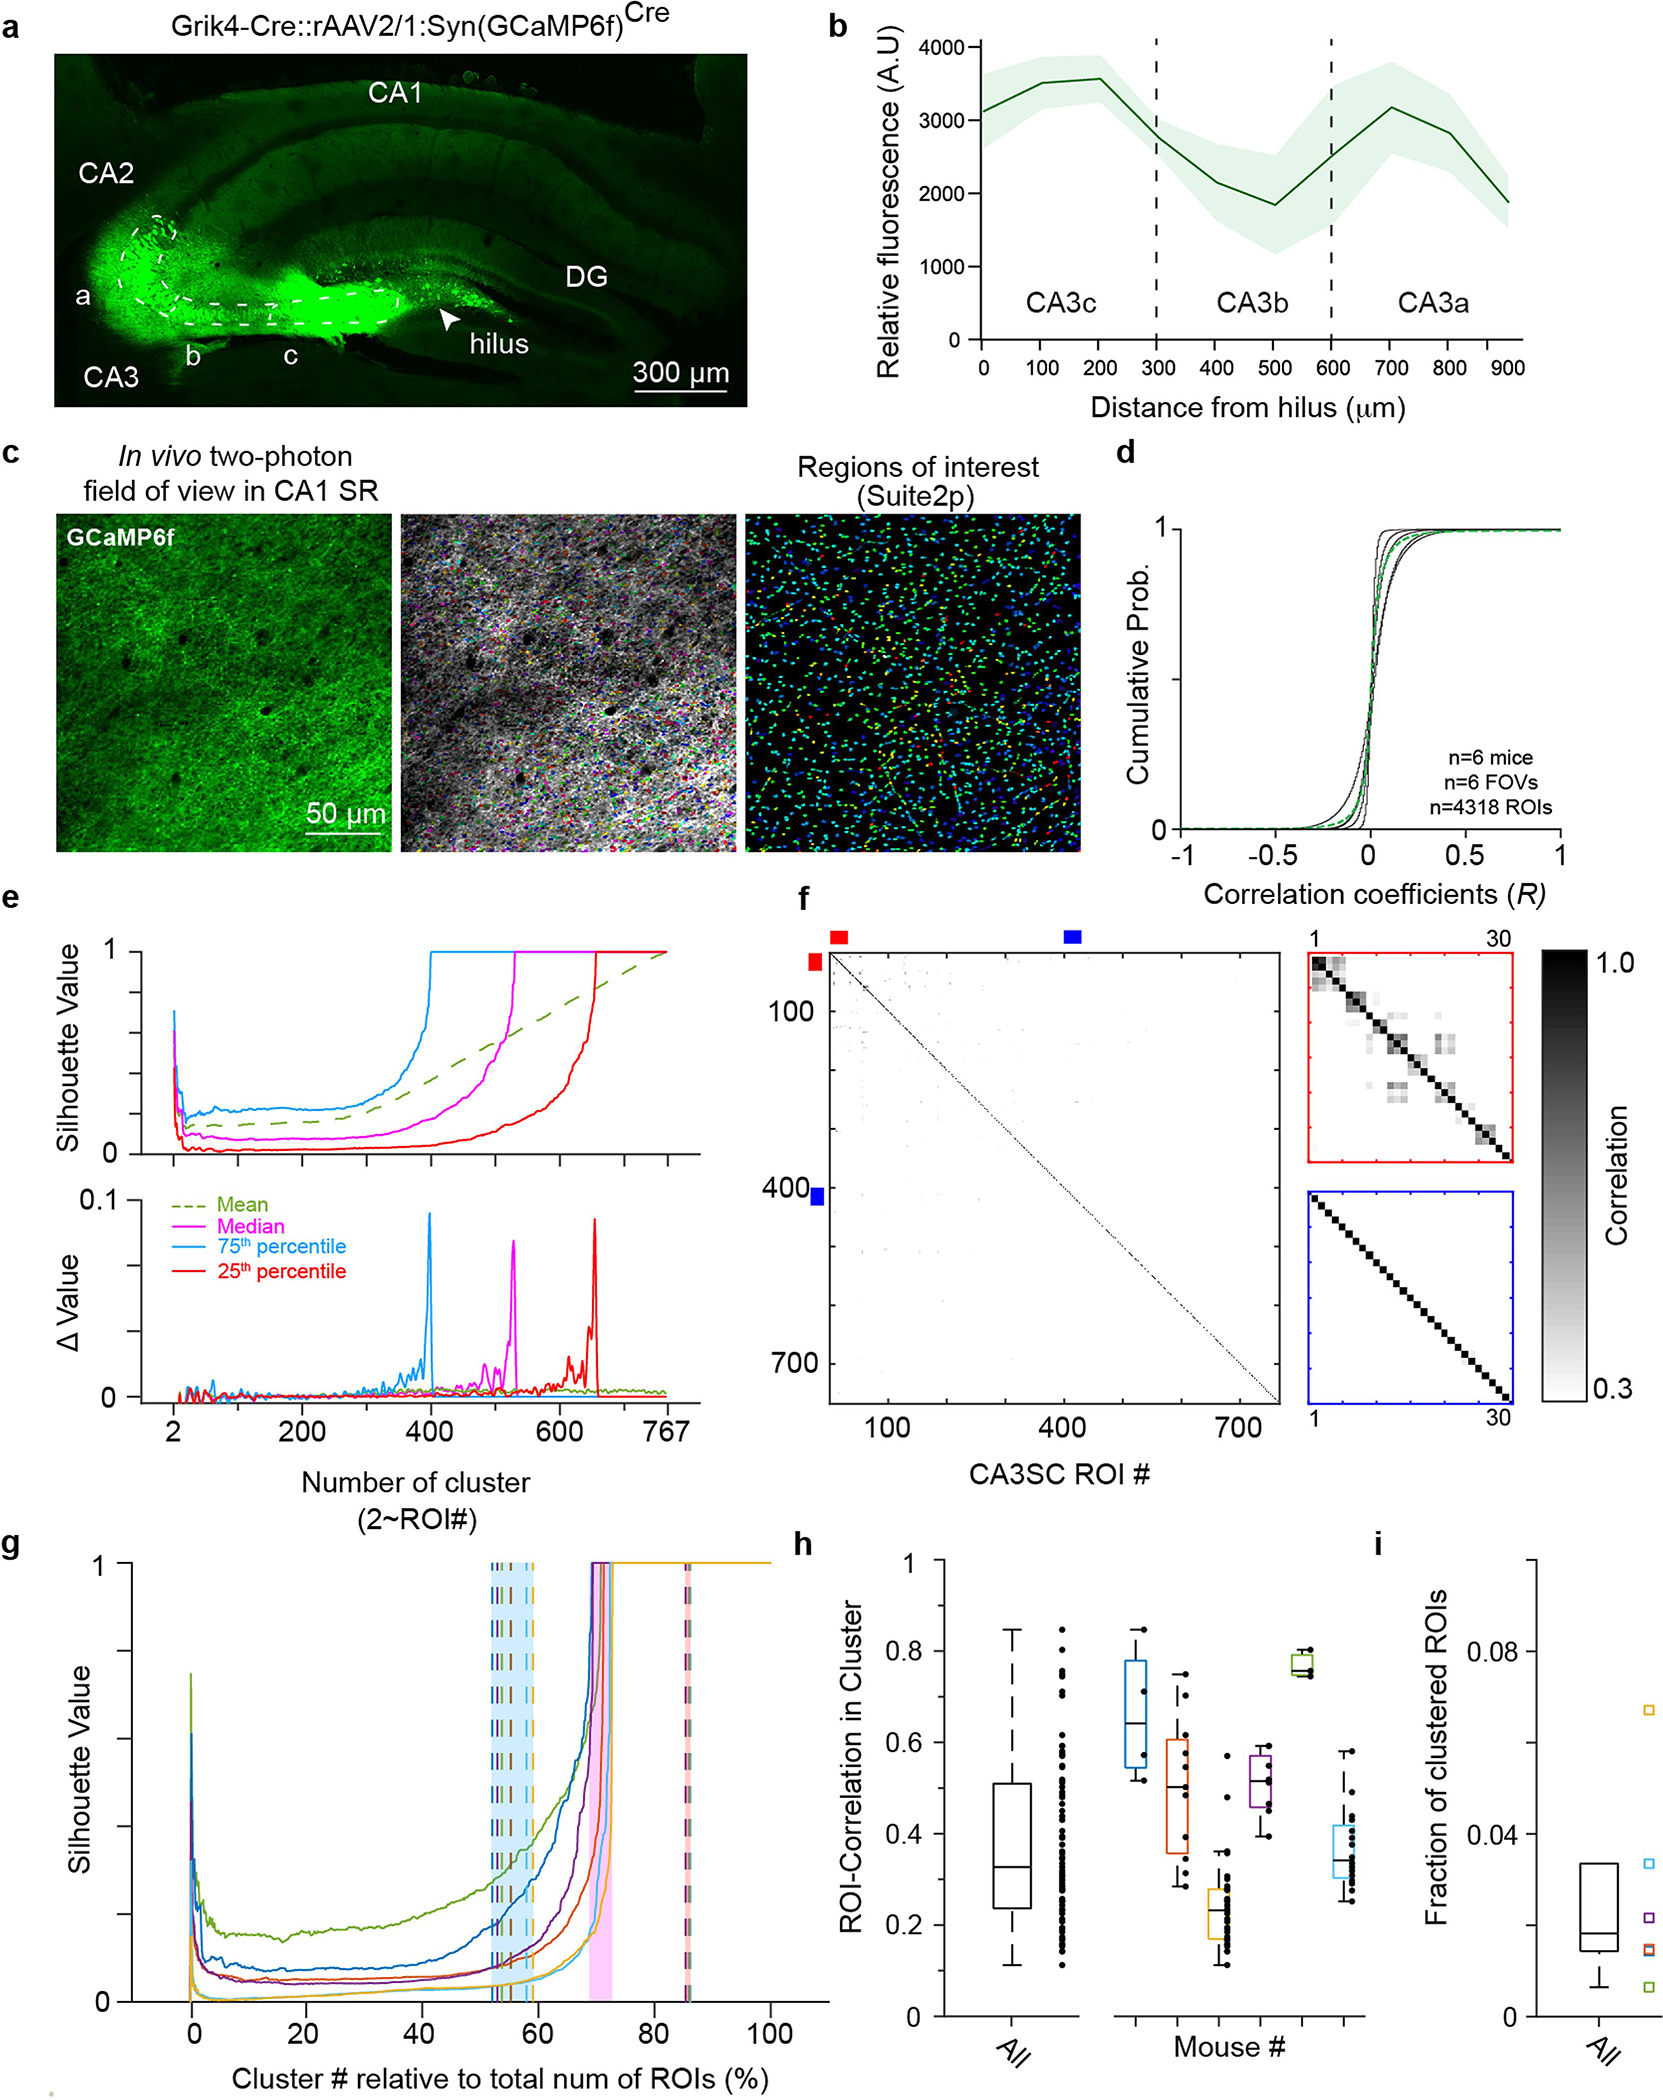
Extended Data Fig. 1 |. Labeling of CA3 Schaffer Collaterals for in vivo two-photon calcium imaging and identification of ROIs.

a, Representative coronal slice of the dorsal hippocampus of a Grik4-Cre mouse showing Cre-dependent rAAV-driven GCaMP6f expression restricted to CA3. The CA3 pyramidal cell layer is outlined with the dotted white contour, and the approximate locations of the CA3 subregions (CA3a-c) are shown. b, Quantification of relative fluorescence intensity along the pyramidal cell layer of CA3 subregions (mean±s.e.m.). Fluorescence intensity at 10 locations along the CA3 pyramidal cell layer was measured, starting from the hilus of the dentate gyrus (x=0 μm) to the approximate CA2/3 border (x=900 μm). c, Example in vivo two-photon field of view (FOV) in CA1 SR from one representative mouse (n=6 in this study). Imaging focal plane was located 50–150 μm below CA1 SP. Right, the same FOV after ROI segmentation with the Suite2p analysis package (middle, overlapping display). d, Distributions of correlation coefficients between pairs of CA3SC ROIs during spontaneous activity for each individual mouse (black lines) and mean for all mice (green). e, Estimation of number of unique CA3 units recorded using hierarchical clustering and silhouette score (Methods). Top, silhouette values as number of clusters K (to the total number of detected ROIs) in an example FOV (green: average, pink: median, light blue: 75th percentile, red: 25th percentile). Bottom, marginal change in silhouette values each time K is incremented by 1. The estimated number of unique CA3 units recorded on each FOV was defined as the number of clusters that maximized the rate of change (528 clusters in this case, and 644±91 clusters, mean ± s.e.m.). f, Left, correlation matrix of ROI signals from the example FOV shown in (c). Right top, zoom: example clusters of putative same-axon ROIs (red), and non-clustered ROIs, likely recorded from distinct axons (blue). g, Median silhouette values over percentage of putative distinct CA3 axons as a proportion of total number of ROIs detected in the FOVs (color scheme as in e). The pink shaded area indicates the ranges between the mice. Dashed lines indicate the cluster numbers that maximized rate of change in 25th (red shaded area on right) and 75th percentiles (blue shaded area on left). h, Boxplots of within-cluster correlations of ROI signals all together (left, n=175 ROIs) and by mouse (right, 29.17±9.5 ROIs, mean±s.e.m.). The whiskers indicate maxima and minima. i, Fraction of ROIs putatively originating from the same cell across mice (n=6810 ROIs from 6 mice). The whiskers indicate maxima and minima, outliers excluded.
