

Abstract
Background:
Repeated exposures to chronic stress can lead to long lasting negative behavioral and metabolic outcomes. Here, we aim to determine the impact of chronic stress and chronic low-level inflammation on behavior and synaptosomal metabolism.
Methods:
Male (n = 31) and female (n = 32) C57Bl/6 mice underwent chronic repeated predation stress or daily handling for two rounds of 15 consecutive days of exposure during the adolescent and early adult timeframes. Subsequently, mice were exposed to repeated lipopolysaccharide (LPS; 7.5 × 10⁵ EU/kg) or saline injections every third day for eight weeks. Exploratory and social behaviors were assessed in the open field and social interaction tests prior to examination of learning and memory with the Barnes Maze. Mitochondrial function and morphology were assessed in synaptosomes post-mortem using the Cell Mito Stress test and Seahorse XFe24 analyzer, TEM, and western analysis, respectively. In addition, expression of TNF-α, IL-1ß, and ROMO1 were examined in the hippocampus and prefrontal cortex with Taqman qPCR. Circulating pro- and anti-inflammatory cytokines in the periphery were assessed using the MSD V-plex Proinflammatory Panel 1 following the first and last LPS injection as well as at the time of tissue collection. Circulating ROMO1 was assessed in terminal samples via ELISA.
Results:
Exposure to repeated predatory stress increased time spent in the corners of the open field, suggestive of anxiety-like behavior, in both males and females. There were no significant group differences in the social interaction test and minimal effects were evident in the Barnes maze. A history of chronic stress interacted with chronic LPS in male mice to lead to a deficit in synaptosomal respiration. Female mice were more sensitive to both chronic stress and chronic LPS such that either a history of chronic stress or chronic LPS exposure was sufficient to disrupt synaptosomal respiration in females. Both stress and chronic LPS were sufficient to increase inflammation and reactive oxygen in males centrally and peripherally. Females had increased markers of peripheral inflammation following acute LPS but no evidence of peripheral or central increases in inflammatory factors or reactive oxygen following chronic exposures.
Conclusion:
Collectively, these data suggest that while metrics of inflammation and reactive oxygen are disrupted in males following chronic stress and chronic LPS, only the combined condition is sufficient to alter synaptosomal respiration. Conversely, although evidence of chronic inflammation or chronic elevation in reactive oxygen is absent, females demonstrate profound shifts in synaptosomal mitochondrial function with either a history of chronic stress or a history of chronic inflammation. These data highlight that different mechanisms are likely in play between the sexes and that sex differences in neural outcomes may be precipitated by sex-specific effects of life experiences on mitochondrial function in the synapse.
1. Introduction
Posttraumatic Stress Disorder (PTSD) is a unique psychiatric condition requiring exposure to a life-threatening stressor for diagnosis (Shalev, 2009). PTSD co-occurs with inflammatory disorders yet the mechanisms of this relationship are not fully defined (Neigh and Ali, 2016). In addition, metabolic disorders are more prevalent among people living with PTSD than among the general population (Lihua et al., 2020; Michopoulos et al., 2017). While the impact of PTSD on neural metabolism, and specifically mitochondrial function, remain unknown, it is evident that PTSD is a risk factor for dementia and related disorders (Bonanni et al., 2018; Clouston et al., 2019; Desmarais et al., 2020). One critical factor in determining whether or not PTSD will manifest, is age – with adolescents much more likely to develop PTSD compared to adults exposed to similar traumatic stressors (Van Der Kolk, 1985). In addition, repeated victimization increases risk for PTSD and comorbidities (Macdonald et al., 2010). Repeated trauma is common as 25–38% of adults have a history of multiple traumas (Green et al., 2000; Kessler et al., 1995) and approximately 55% of youth with trauma history report multiple traumatic events (Macdonald et al., 2010).
Although it is not possible to model a complex neuropsychiatric condition like PTSD in a rodent, the impact of a history of life-threatening traumas can be assessed in rodent models while controlling confounding variables present in the human population (i.e. diet, tobacco, drugs, alcohol). Predator based stressors have been used in the literature to study trauma-related manifestations in adult male rodents (Richter-Levin et al., 2019; Zoladz et al., 2018, 2012) but minimal work has extended these examinations in females. An important area of study is determining the extent to which life-threatening stressors can alter the relationship between inflammatory stimuli and the neural metabolic response. Previous work has demonstrated in both humans and rodents that trauma can precipitate peripheral metabolic compromise and deficits in the management of inflammation (Mellon et al., 2019; Preston et al., 2018; Seo et al., 2019). Less is known about the influence of a history of traumatic stress and inflammation on neural metabolic function, specifically in the realm of synaptic mitochondrial function. To model increased inflammation, lipopolysaccharide, an endotoxin isolated from E.coli, is most commonly used in the literature to elicit global inflammation in the animal at both acute and chronic exposures (Barnum et al., 2012; Bekhbat et al., 2019). Here we determined the extent to which repeated traumatic events interacted with exogenous chronic peripheral inflammation to alter neural metabolism and behavior. The use of a design that includes traumatic stressors over multiple life phases is critical because chronic developmental stress can create a susceptibility not evident until the system is again challenged in adulthood (Bourke et al., 2013; Pyter et al., 2013).
We focus on mitochondrial integrity because it is an essential component of neuronal health and function that, when compromised, leads to impaired activity, decreased synaptic connectivity, and eventual apoptosis (Adiele and Adiele, 2019; Allen et al., 2018; Smith et al., 2016; Turkson et al., 2019). Traumatic stress may translate to neural metabolic dysfunction through oxidative damage that can impair neuronal integrity (Clark et al., 2017; Fang et al., 2012) and modulate mitochondrial function (Hunter et al., 2016; Khalifa et al., 2017; Lapp et al., 2019) inducing a global change in neural metabolism (Picard et al., 2018; Turkson et al., 2019). To this end, a recent study reported metabolic signatures consistent with compromised mitochondrial function in male combat veterans, even when controlling for common confounding variables (Mellon et al., 2019). In addition, repeated shock, proposed as a model of PTSD, has caused acute alterations in mitochondrial function of hippocampal tissue of adult male rats (Seo et al., 2019).
Oxidative stress alters neuronal mitochondria trafficking (Fang et al., 2012) and can be a consequence of chronic psychological stress (for full reviews, see Bouayed et al., 2009; Salim, 2016, 2014; Smaga et al., 2015). Of particular relevance to stress-induced disorders, is evidence of sex differences in the regulation of oxidative stress, mitochondrial phenotype, and mitochondrial metabolism (Khalifa et al., 2017); however, most mitochondrial studies related to stressor exposure have focused predominantly on male subjects and endpoint measures proximate to stressor exposure. Here we report that a history of traumatic life stress interacts with both sex and chronic inflammation to alter mitochondrial bioenergetics at the synapse. An understanding of the impact of traumatic stress on neural mitochondrial function may help to define targeted mechanistic interventions to mitigate the impact of traumatic stress on neural function.
2. Materials and Methods
2.1. Animals
Male (n = 31) and female (n = 32) C57Bl/6 mice were purchased from Taconic Laboratories and arrived at our facilities at postnatal day (PND) 22 (FIGURE 1). Upon arrival, mice were pair housed with a same-sex cage-mate and housed in ventilated rack cages in a temperature and humidity-controlled room on a 12:12 light:dark cycle. Mice were given free access to food and nesting material was provided. All facilities were AAALAC approved. All animal protocols were approved by the Animal Care and Use Committee at Virginia Commonwealth University.
Figure 1: Overview of Experimental Methods.
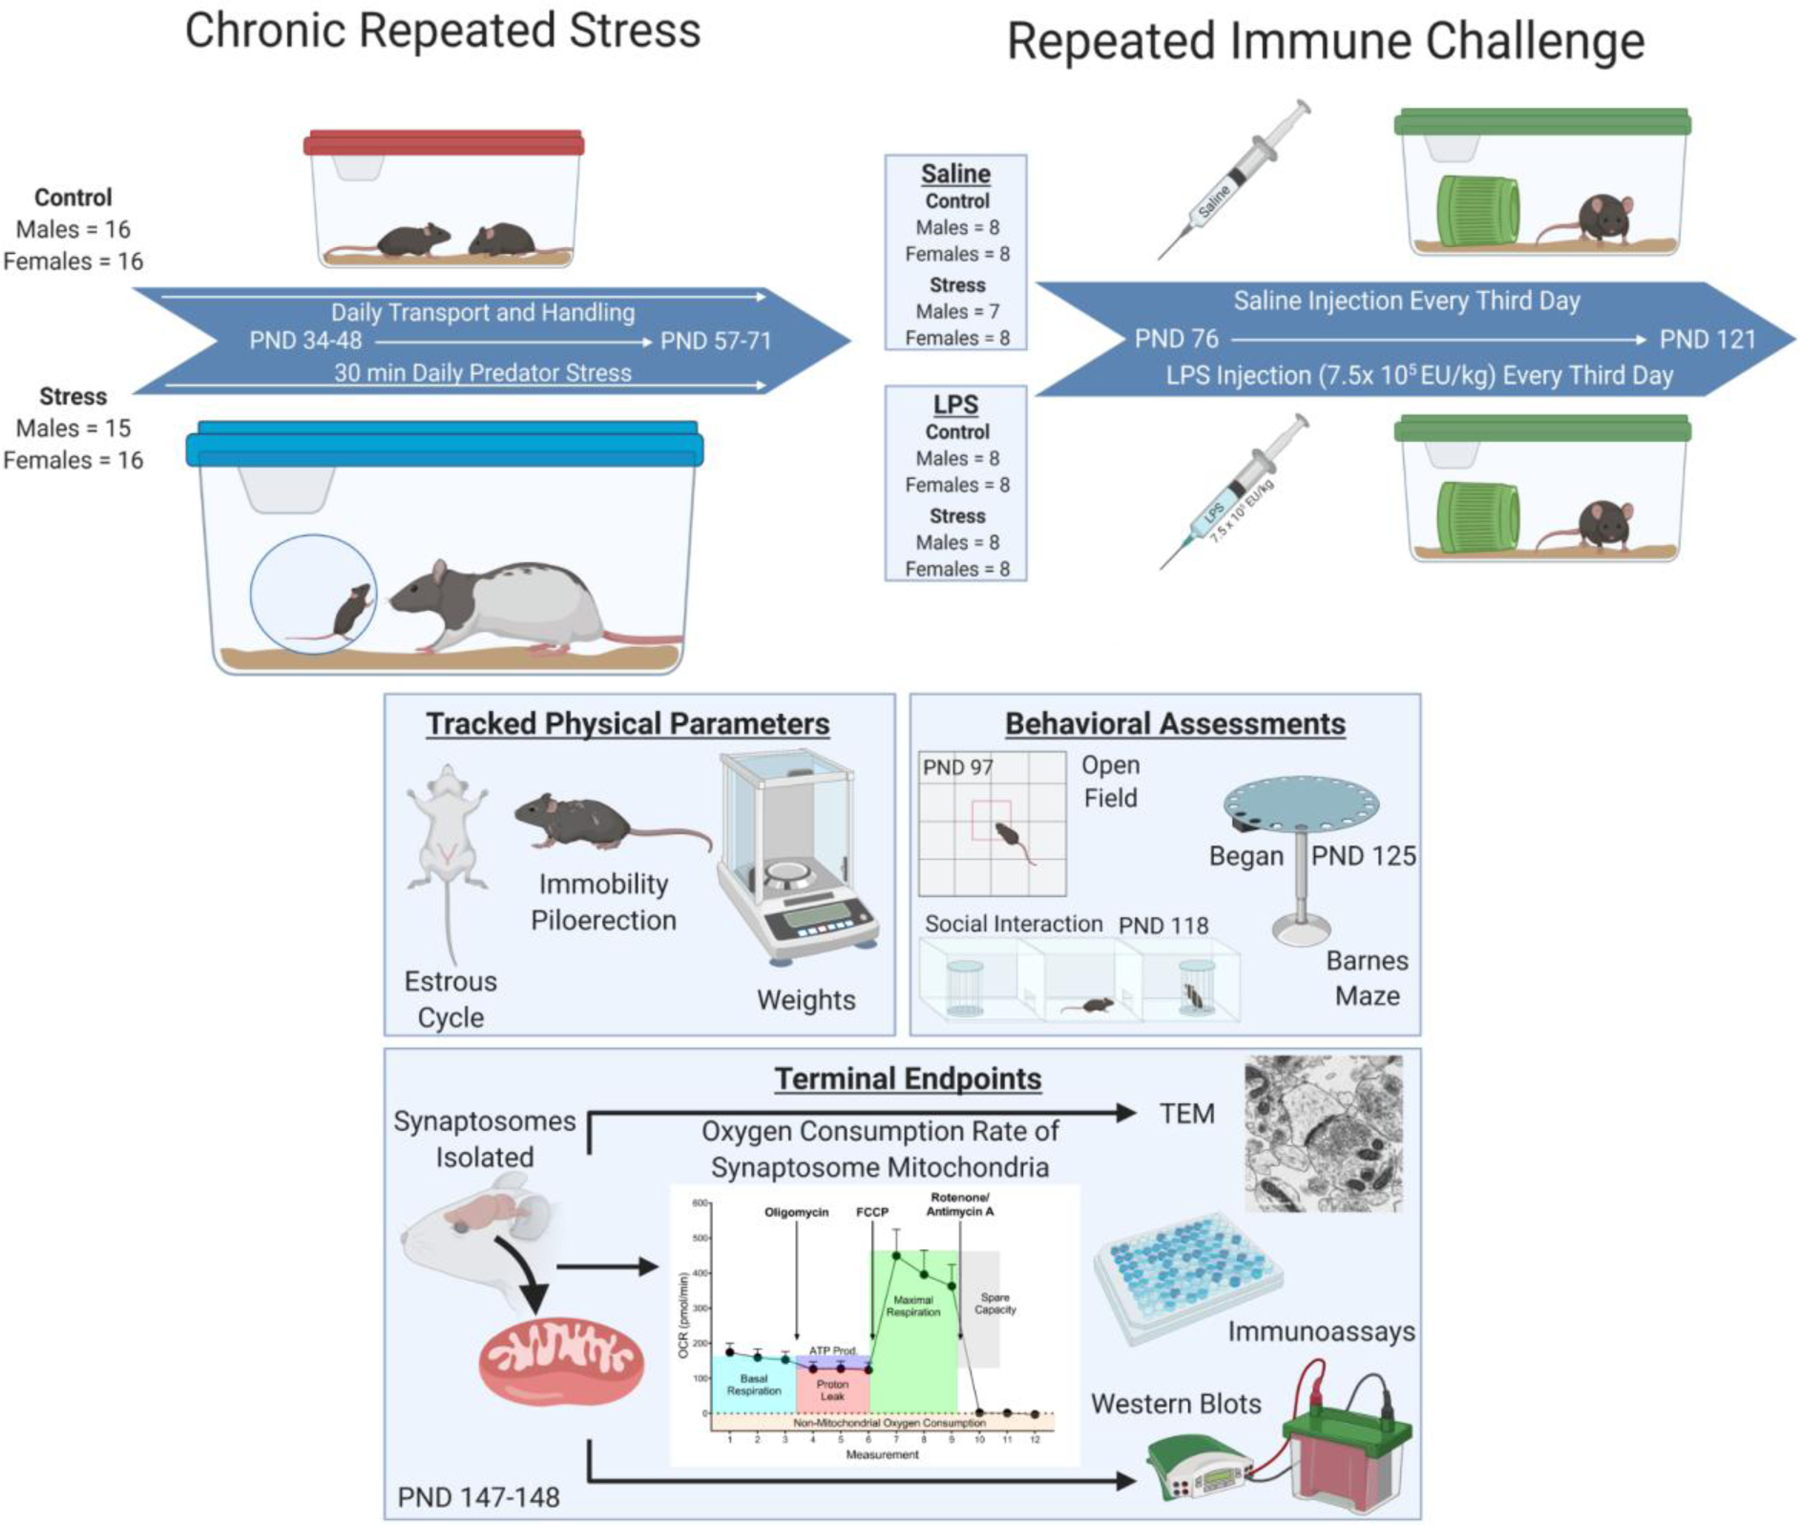
Experimental design and timeline. Mice began daily predation stress or daily handling beginning at PND 34, as al mice, both male and female, have fully entered the adolescent timepoint at this age. Adult predation stress occurred beginning on PND 57, encompassing the very start of adulthood for both males and females. Mice were then subject to saline of LPS injections administered IP every third day beginning on PND 76 and ending on PND 121. During the injection stage, mice were regularly assessed for mobility, piloerection, and weight to monitor physical health throughout the treatment cycle. Open field was done on PND 97 and social interaction was completed on PND 118, both occurring before their injections for the day. Following the chronic injections, mice were subject to the Barnes maze beginning on PND 125 to assess long term changes in cognition. Tissue was harvested on PND 147–148 and various endpoints were assessed.
2.2. Chronic Repeated Predation Stress (CRPS)
Chronic repeated predation stress protocol was conducted similarly to previous reports (Burgado et al., 2014; Shaw et al., 2020). At PND 34, mice were randomly chosen to either undergo chronic repeated predation stress (CRPS; male n = 15, female n = 16) or remain in the non-stress group (male n = 16, female n = 16). CRPS occurred for 30-minutes a day over 15 consecutive days during two time periods (PND 34–48 and PND 57–71). Mice chosen to undergo CRPS were isolate housed and deprived of nestlet enrichment beginning on PND 34 and throughout stress. Immediately following isolation and removal of enrichment, CRPS mice began exposure to daily predation stress, which involved protected exposure to an adult male Long Evans rat. Mice were placed in a clean dwarf hamster ball (Lee’s Aquarium & Pet Products, San Marcos, CA, USA, Cat. #20198) and subsequently placed in the home cage of the predator, who were all adult male Long Evans rats previously used for breeding. Non-stress mice remained pair housed with enrichment and were handled daily. After the final stressor exposure on PND 71, CRPS mice received nesting material for the remainder of the study. Additionally, the non-stress mice were isolate housed on PND 71 for the remainder of the study to control for the effects of isolation housing on stress and sickness behavior (Eisenberger et al., 2017; Hennessy et al., 2014).
2.3. Chronic LPS Administration
Lipopolysaccharide (LPS; E.coli O11:B4; Sigma-Aldrich, Cat. # L4391) or saline (Hospira Inc., Lake Forest, IL, USA) was administered at a concentration of 7.5 × 10⁵ EU/kg via intraperitoneal injection (IP) to induce chronic low-level inflammation (Barnum et al., 2012). Injections were given every third day from PND 76 – 121 during the light cycle. A total of 16 injections were administered. An additional injection of LPS or saline was administered at PND 140, with subsequent physical assessments on PND 141 to assess the somatic reaction to an immunological challenge and any acute changes in cognition (via Barnes Maze). Assessments of weight (g), mobility (graded scale: 1 = normal mobility, 2 = mobile if disturbed, and 3 = immobile), and piloerection (graded scale, zero = none, 0.5 = only around neckline, 1 = full coat) were taken 24 and 48 hours after each injection.
2.4. Plasma Collection
In addition to terminal samples, minimum volume blood samples were collected via retro-orbital bleeds at three time points: two hours after the first injection (PND 76), two hours after the 16th injection (PND 121), and two hours after the LPS trigger injection (PND 141). For retro-orbital samples, mice were anesthetized via isoflurane inhalation and blood collected using a 100µL capillary tube. Approximately 50µL of blood was collected from each retro-orbital bleed. Samples were placed in two-mL EDTA coated tubes and spun at 1800xg for 20 minutes. Terminal blood samples were collected following rapid decapitation into EDTA coated tubes. Plasma was isolated, placed in an eight-tube strip and stored at −80°C until further use.
2.5. Behavioral Assessments
To assess exploratory and anxiety-like behavior (Burgado et al., 2014; Carola et al., 2002; Choleris et al., 2001; Prut and Belzung, 2003), all mice were subject to the open field test the morning before their eighth injection (PND 97), 72 hours after the seventh LPS exposure. Mice were permitted ten minutes of exploration in a 31.75 cm x 31.75 cm open field four to nine hours into their light cycle. Behaviors were recorded using an overhead camera and EthoVision XT 14.0 software (Noldus Technologies, Leesburg, VA, USA). Time spent in the center of the arena, as well as velocity and distance traveled, were assessed via overhead camera and EthoVision XF 14.0. Social interaction and learning and memory via the Barnes Maze were also assessed. Methods for these assays are presented in the Supplemental Methods.
2.6. Tissue Collection
Mice were euthanized via rapid decapitation on PND 147–148. This timepoint is seven to eight days following the final LPS trigger injection. Samples had to be collected across two days due to the temporal dynamics of the mitochondrial assay. All groups were balanced between collection days. Immediately following decapitation brains were extracted on ice and rinsed with isotonic sucrose solution (0.32 M sucrose, 1mM EDTA, 5mM Tris, pH 7.4) to remove excess blood. Brains were then bisected along the midsagittal plane. The hippocampus and prefrontal cortex were dissected from the right hemisphere and flash frozen on dry ice and stored at −80°C. The remainder of the right hemisphere and the entire left hemisphere were diced and homogenized in a seven-mL glass Dounce Homogenizer in isotonic homogenizing buffer (five up-and-down strokes of the loose plunger followed by five up-and-down strokes of the tight plunger) in preparation for synaptosomal isolation (concentrations for ‘homogenizing buffer’ and subsequent Percoll layers can be found in (Dunkley et al., 2008)).
2.7. Synaptosomal Isolation
Synaptosome isolation was adapted from (Dunkley et al., 2008). After the initial homogenization, samples were spun at 3600 RPM at 4°C for ten-minutes. The supernatant (approximately 4mL) was transferred to a clean, sterile 15mL conical tube and diluted to 7mL using homogenizing buffer. 6mL of the diluted supernatant was then carefully laid atop a five-layer discontinuous Percoll gradient in a 26mL polycarbonate ultracentrifuge tube. Gradients were spun at 32500xg for 15 minutes to separate synaptosomes from other neural fragments. Synaptosomes were extracted from the interface between the 15% and 23% Percoll layers and placed in a clean polycarbonate tube with 20mL of ionic media (20mM HEPES, 10mM D-Glucose, 1.3mM Na2HPo4, 1mM MgCl2, 5mM NaHCO3, 5mM KCl, 140 mM NaCl, pH 7.4; adopted from (Choi et al., 2009)) and spun for 35 min at 15000xg. Synaptosomal pellets were collected and measured via Nanodrop for protein content. Synaptosomal pellets were diluted to 40µg/100µL in Ionic Media in a new microcentrifuge tube. Remaining synaptosome pellets were saved at −20°C for Western blots or pelleted and stored in glutaraldehyde for imaging analysis. 100µL of diluted synaptosomes were plated in triplicate on a Seahorse XFe24 cell plate (Agilent Technologies, Santa Clara, CA) coated with poly-D lysine. The plate was spun for 30 minutes at 3400 RPM at 4°C to allow synaptosomes to adhere to the bottom of the well. Ionic media was aspirated out of each well and replaced with 500µL of freshly made assay media (prepared according to the manufacturer’s instructions). Plates were incubated at 37°C in a non-CO2 incubator for 30 minutes before measurement in the Seahorse XFe24 Analyzer (Agilent Technologies).
2.8. Mitochondrial Respiration
Mitochondrial respiration was measured using Agilent’s Cell Mitochondrial Stress Test kit (Agilent Technologies, PN: 103015–100) and Seahorse XFe24 Analyzer. Drugs that were injected into the assay were prepared according to manufacturer instructions at 2.0µM Oligomycin, 1.0µM FCCP, and 0.5µM Rotenone/Antimycin A. Oxygen consumption rates (OCR) were determined by sequential measurement cycles consisting of a 30 second mixing time followed by a two-minute wait time and then a three-minute measurement period (three measurements following each reagent addition). Reagents were added to SeahorseXFe24 FluxPak in dilutions according to manufacturer’s recommendation (2.0μM Oligomycin, 1.0μM carbonyl cyanide-p-trifluoromethox-yphenyl-hydrazon (FCCP), 0.5μM Rotenone/antimycin A per well). The first three measurements of OCR occur prior to addition of mitochondrial reagents and indicates basal respiration. Oligomycin is a complex V inhibitor and OCR following this addition indicates ATP-linked respiration (subtraction of baseline OCR) and proton leak respiration (subtraction of non-mitochondrial respiration). FCCP is a protonophore and adding it will collapse the inner membrane gradient and push the electron transport chair to the maximal rate. Inhibition of complex III and I is achieved through addition of antimycin A and rotenone which will terminate electron transport chain function and demonstrate non-mitochondrial respiration. Mitochondrial reserve is calculated by subtraction of basal respiration from maximal respiration (Rose et al., 2014). Due to failed readings from the assay, sample sizes were reduced (SUPPLEMENTARY TABLE 1). Data were recorded in Agilent’s Wave Software and subsequently exported via Excel document for further analysis.
2.9. Western Blots
Western blots were used to assess the relative mitochondrial content from the synaptosomal isolations. Antibodies for presynaptic terminals (SNAP-25; ThermoFisher Scientific, Waltham, MA; Cat. # PA1–9102), and mitochondria (Hexokinase I; ThermoFisher Scientific, Cat. # MA5–5680) assess mitochondrial concentration and relative presence of presynaptic terminals within synaptosomal preparations. Samples were pooled according to group to assure adequate protein amounts for loading. 20µg of protein, assessed via BCA assay (ThermoFisher Scientific, Cat. # 23225), was loaded and run using a Criterion XT 10% Bis-Tris midi gel (BioRad Laboratories, Hercules, CA, USA; Cat. # 3450113) and XT-MOPS running buffer (BioRad Laborotories, Cat. # 161–0788). Protein was transferred onto a PVDF midi membrane (BioRad Laborotories) using the TransBlot Turbo (BioRad Laboratories) system for dry transfers. Total protein levels within the gel were assessed using Revert 700 Total Protein stain (LI-COR Biosciences, Lincoln, NE, USA; Cat. # 926–11010) to normalize the gel and immediately imaged at 700nm using a LI-COR Odyssey system. The membrane was cut at 70kDa and 38kDa to allow separate incubation of each target. Total protein stain was stripped off the membrane according to manufacturer’s instructions and membrane was blocked with LI-COR Intercept Blocking Buffer (LI-COR Biosciences) for 40 minutes. Primary antibody was added and incubated at 4°C overnight on a shaker. Secondary antibody was added (LI-COR Biosciences; 800CW Goat anti-mouse IgG1 Cat. # 926–32350; 680LT Donkey anti-goat IgG Cat. # 926–68024) and incubated at room temperature for 90 minutes on a shaker. Membranes were imaged on a LI-COR Odyssey Imaging system (LI-COR Biosciences) and analyzed using Image Studio Lite Version 5.2 (LI-COR Biosciences).
2.10. Transmission Electron Microscopy
To confirm sample enrichment and synaptosomal integrity, remaining pellets from the final ultracentrifugation step of the synaptosomal isolation were transferred to a 1.5mL microcentrifuge tube and spun at 4°C for ten-minutes at max speed. Supernatant was removed and pellets spun a second time to assure all remaining ionic media was removed. Pellets were then resuspended with 500mL 2% glutaraldehyde in 0.1M sodium cacodylate buffer with 0.1M sucrose at room temperature and allowed to sit undisturbed for ten-minutes. Samples were then spun at 4°C for ten-minutes at max speed to create a synaptosomal pellet. Pelleted samples were stored at 4°C until further processing.
Samples were rinsed in 0.1M cacodylate buffer a total of three times each. 2% osmium tetroxide in 0.1M cacodylate buffer was added as fixative and incubated for one-hour. Samples were rinsed again in 0.1M cacodylate buffer a total of three times. Fixed pellets were subsequently dehydrated in a graded ethanol series for five to ten minutes each, followed by three changes of 100% ethanol incubations for five to ten minutes each. Propylene oxide was then added in three successive changes followed by a 50/50 mix of propylene oxide and PolyBed 812 resin (Polysciences, Inc., Warrington, PA, USA, Cat. # 08791–500) in an overnight incubation. PolyBed 812 resin was then added in embedding molds and placed in a 60°C oven overnight. Embedded synaptosomal pellets were then sectioned at 700nm on a Leica EM UC6i ultramicrotome (Leica Microsystems, Buffalo Grove, IL, USA). Sections were subsequently stained with 5% uranyl acetate and Reynold’s lead citrate.
Samples were imaged on a JEM-1400Plus transmission electron microscope (JEOL USA, Peabody, MA, USA) with a Gatan UltraScan 4000SP 4k x 4k CCD camera (Gatan, Inc., Pleasanton, CA, USA). Representative images of synaptosomes were obtained at a voltage of 100kV using a 15,000x magnification and 2.0 second exposure time. Images were obtained at a voltage of 100kV using a 4000x magnification and 2.0 second exposure.
2.11. Mitochondrial Assessment
Following Transmission Electron Microscopy (TEM; see Supplemental Methods for procedural details), mitochondrial phenotype was assessed using the Flaming scoring system (Flameng et al., 1980; Hawong et al., 2015; Li et al., 2018). Mitochondrial phenotype was scored on a scale of one to five, with five signifying healthy mitochondria, four signifying agranular mitochondria, three signifying inflamed mitochondria with intact membranes and cristae, two signifying mitochondria with intact membranes but broken cristae, and one signifying mitochondria with broken membranes and cristae. Scores were assessed using TEM images taken at 4000x magnification by a blind counter.
2.12. Peripheral Inflammation
Plasma samples collected from three time points: 1) two hours after the first chronic injection (acute), 2) two hours after the final chronic injection (chronic), and 3) from trunk blood at the time of tissue collection (terminal; seven to eight days after a trigger LPS injection used for cognitive testing) to assess markers of peripheral inflammation. Circulating concentrations of IFN-γ, IL-1ß, IL-2, IL-4, IL-5, IL-6, IL-10, IL-12p70, KC/GRO, and TNF-α were assessed using the MSD V-Plex Proinflammatory Panel 1 Mouse Kit (Meso Scale Diagnostics, Rockville, MD, USA; Cat. #: K15048D-2) and read using the MESO QuickPlex SQ 120 (Meso Scale Diagnostics). A standard curve was completed to determine the required dilutions for analysis. Based on results from the standard curve, samples from saline treated mice were diluted 1:8 for both the acute and chronic time points. Samples from LPS treated mice were diluted 1:20 and 1:30 for acute and chronic time-points respectively. All terminal time points regardless of treatment history were diluted 1:2. MSD workflow was completed according to manufacturer instructions.
2.13. ROMO-1 ELISA
Circulating ROS was assessed via enzyme linked immunosorbent assay (ELISA) for ROMO1 (MyBioSource, San Diego, CA; Cat # MBS3805476) on plasma isolated from trunk blood samples. All plasma samples were diluted 1:5 for analysis in sample diluent as suggested by the manufacturer. ELISA workflow was completed according to manufacturer’s instructions.
2.14. Quantitative Polymerase Chain Reaction (qPCR)
Relative transcript levels of the inflammatory cytokines IL-1ß (ThermoFisher Scientific, Cat. # Mm00434228_m1), and TNFα (Cat. # Mm00443258_m1), and the reactive oxygen species modulator ROMO1 (Cat. # Mm01246687_g1), were assessed via TaqMan qPCR in both the hippocampus and prefrontal cortex of each mouse. Two housekeeping genes, GAPDH (Cat. # Mm99999915_g1), and ß-actin (Cat. # Mm01205647_g1) were used for normalization of each sample. All samples were run in triplicate.
2.15. Statistical Analysis
All statistical data was analyzed within each sex using GraphPad Prism 8.2.0 for Windows (GraphPad Software, La Jolla, CA). Physical Assessments were measured with a categorical scoring system and thus analyzed using the Generalized Liner Mixed Model Effects analysis option to account for the multinomial, longitudinal data. Behavioral data from the open field and qRT-PCR were analyzed using two-way analysis of variance (ANOVA) with the factors of stress and LPS. Synaptosomal respiration data was normalized according to previously published methods (Choi et al., 2009) such that non-mitochondrial respiration (measurements ten through twelve) were set to an average OCR of zero for each subject. Normalized OCR data was analyzed using a three-way ANOVA with the factors stress, LPS, and measurement. Western blot data was analyzed using a two-way ANOVA with the factors stress and LPS. The Flameng score and MSD data were analyzed by two-way ANOVAs with the factors of stress and LPS. Intra-assay coefficient of variation (%CV) for MSD data was 10.8±0.287 (mean ± SEM). TaqMan PCR data were analyzed using a two-way ANOVA of the 2ΔΔct values with the factors stress and LPS. Data from the ROMO1 ELISA (%CV = 5.16 ±0.530) was analyzed using a two-way ANOVA with the factors of stress and LPS. Peripheral cytokine data were analyzed using a three-way ANOVA with the factors stress, LPS, and time point. For all three-way ANOVAs, when significant interactions were observed, two-way ANOVAs and appropriate post hoc comparisons were conducted to determine factors driving group differences. All data was assessed for normality and uniformity of variance using QQ and homoskedasticity plots respectively. No datasets fell outside the bounds of these assessments. All statistical tests were run with a significance level (α) set to 0.05.
3. Results
3.1. Physical Assessments
Body mass increased over the duration of the study for male subjects regardless of stress or LPS exposure (F(1,27) = 63.87, p < 0.0001; FIGURE 2A). However, there were timepoint specific group differences in body mass (F(1,27) = 10.84, p = 0.0028). Specifically, body mass of males treated with LPS was lower than saline injected counterparts following the first exposure to LPS (p = 0.0225). Mobility was similarly impacted such that mobility increased over time (F(1,27) = 5.841, p = 0.0227), but was differentially impacted by LPS versus saline treatment (F(1,27) = 5.841, p = 0.0227) in a time-specific manner (F(1,27) = 5.841, p = 0.0227). Post hoc analysis isolated this effect to the initial LPS exposure (p = 0.0019; FIGURE 2C), with males treated with saline showing a higher mobility score than males treated with LPS. Last, in terms of piloerection, males exhibit a main effect of time (F(1,27) = 9.833, p = 0.0041), stress (F(1,27) = 5.849, p = 0.0226), and treatment (F(1,27) = 6.692, p = 0.0154; FIGURE 2E) with no interactions such that both LPS and chronic stress precipitated increased piloerection over time.
Figure 2: Physical Changes Following Chronic Stress and Chronic LPS.
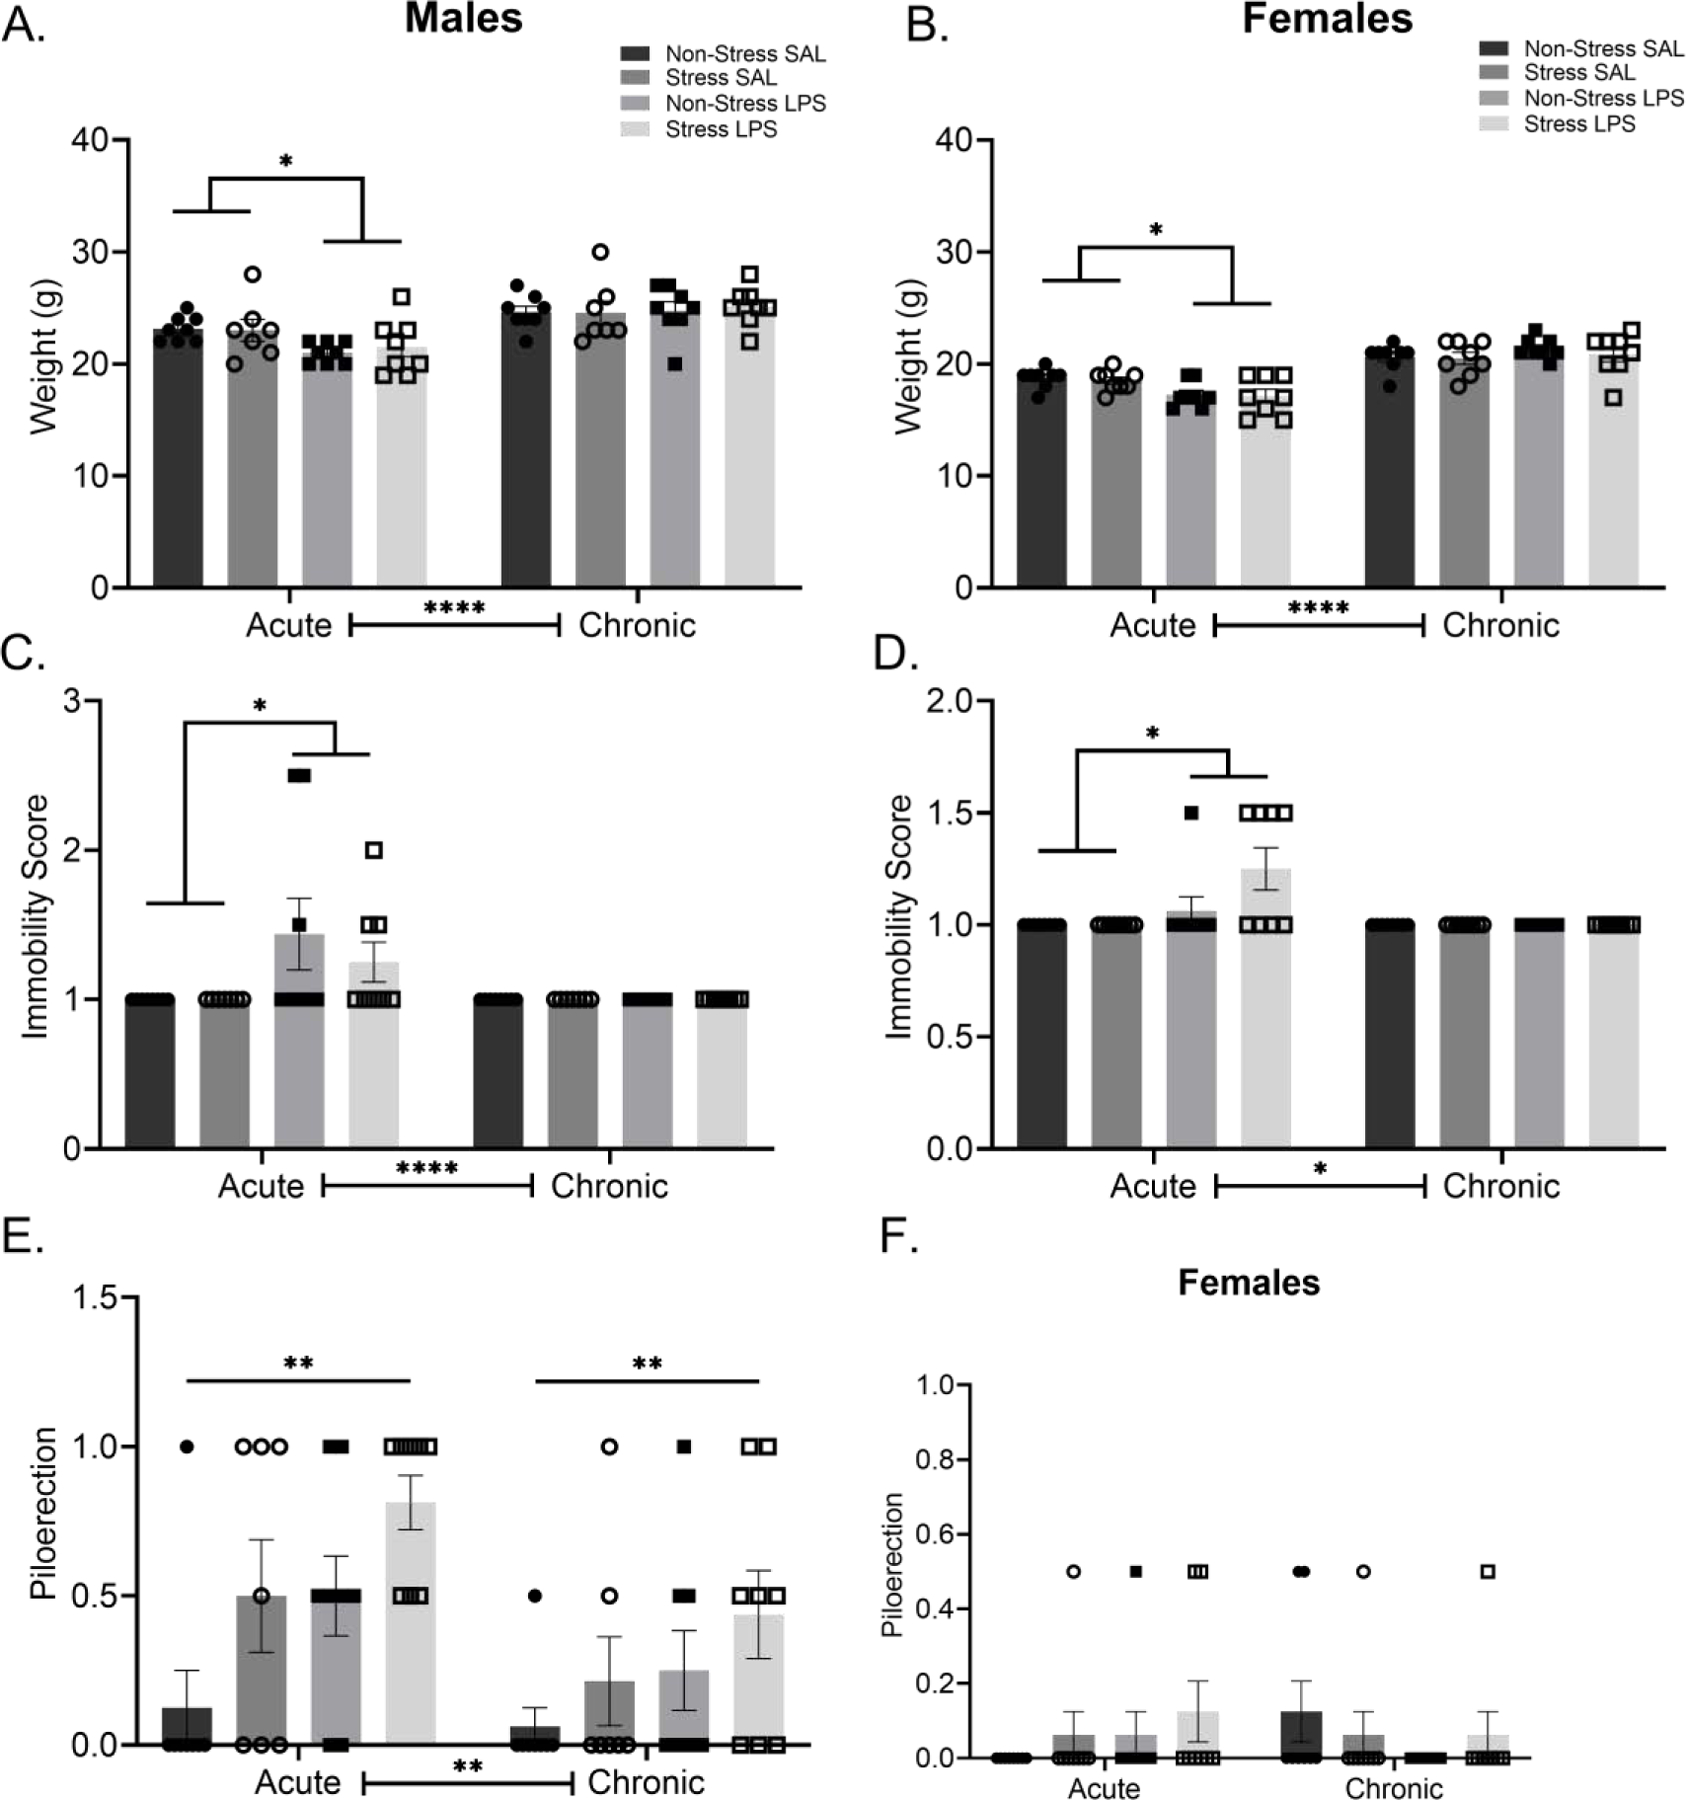
A) Acute, but not chronic, LPS reduced body mass in male and, B) female mice. C) Acute LPS reduced mobility in males but this reduction was no longer evident after chronic LPS exposure. D) LPS treated females also show decreased mobility 24 hours following the initial treatment injection which was no longer present at the final injection. E) Piloerection was elevated in males following either LPS or chronic stress. F) Female piloerection showed no significant differences at either the acute of chronic treatment time points.
Reported values depict mean ± SEM. *p < 0.05, **p < 0.01, ****p < 0.0001.
Within the females, body mass increased over time (F(1,28) = 219.3, p < 0.0001) and this effect was modified by exposure to LPS interaction (F(1,28) = 25.42, p < 0.0001; FIGURE 2B). Post hoc analysis identified that, like the males, LPS treated females had lower body mass following the first LPS injection than did saline exposed controls (p = 0.0051). Mobility scores differed as a function of time (F(1,28) = 7.609, p = 0.0101), LPS treatment (F(1,28) = 7.609, p = 0.0101) with evidence of an interaction (F(1,28) = 7.609, p = 0.0101; FIGURE 2D). This difference was specific to decreased mobility after the first LPS injection compared to saline injected controls (p = 0.0010). Piloerection differed by time and LPS exposure (F(1,28) = 4.308, p = 0.0472; FIGURE 2F), but post hoc analysis did not isolate this difference to a specific set of comparisons (p > 0.05).
3.2. Open Field
Time in the center of the open field was not different among males regardless of a history of stress or LPS exposure (p > 0.05; FIGURE 3A). A history of stress exposure did lead to increased time in the corners of the open field regardless of LPS exposure (F(1,27) = 5.857, p = 0.0225; FIGURE 3B). Female mice with a history of stress exposure spend less time in the center of the open field than controls, regardless of LPS exposure (F(1,28) = 4.166, p = 0.0508). In addition, a history of stress caused an increase in the time spent in the corners of the arena for females (F(1,28) = 7.256, p = 0.0118). Distance traveled in the open field was increased for both male and female mice with a history of chronic stress as compared to their respective controls (males: F(1,27) = 7.413, p = 0.0112; females: F(1,28) = 7.628, p = 0.0100; FIGURE 3C).
Figure 3: A History of Stress Increases Anxiety-Like Behaviors in the Open Field.
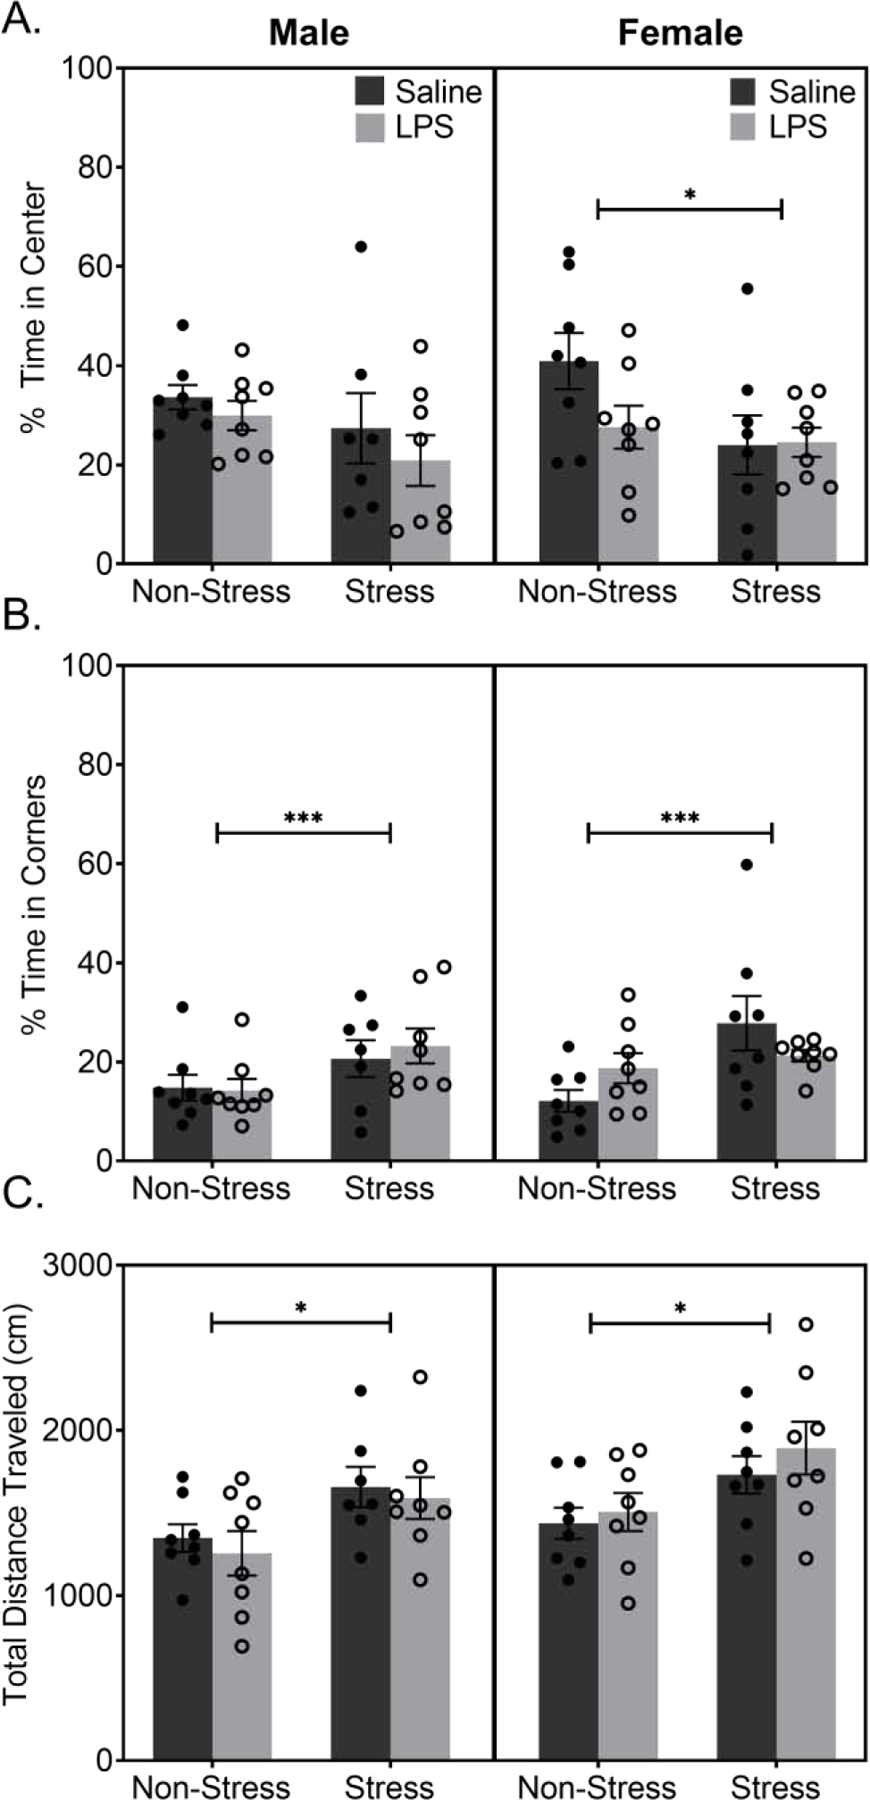
A) Male data show no significant difference in the percent of time spent in the center of the arena. Female data show a main effect of stress in time spent in the center of the arena, with females with a history of stress spending less time in the center suggesting increased anxiety-like behavior. B) Both males and females show a significant difference in time spent in the corners of the arena, with mice with a history of stress spending increased time in the corners. C) Analysis of movement patterns suggested mice with a history of stress, regardless of sex, appear to be more hyperactive than their sex matched controls.
Reported values depict mean ± SEM. *p < 0.05, ***p < 0.001.
3.3. Synaptosomal Respiration
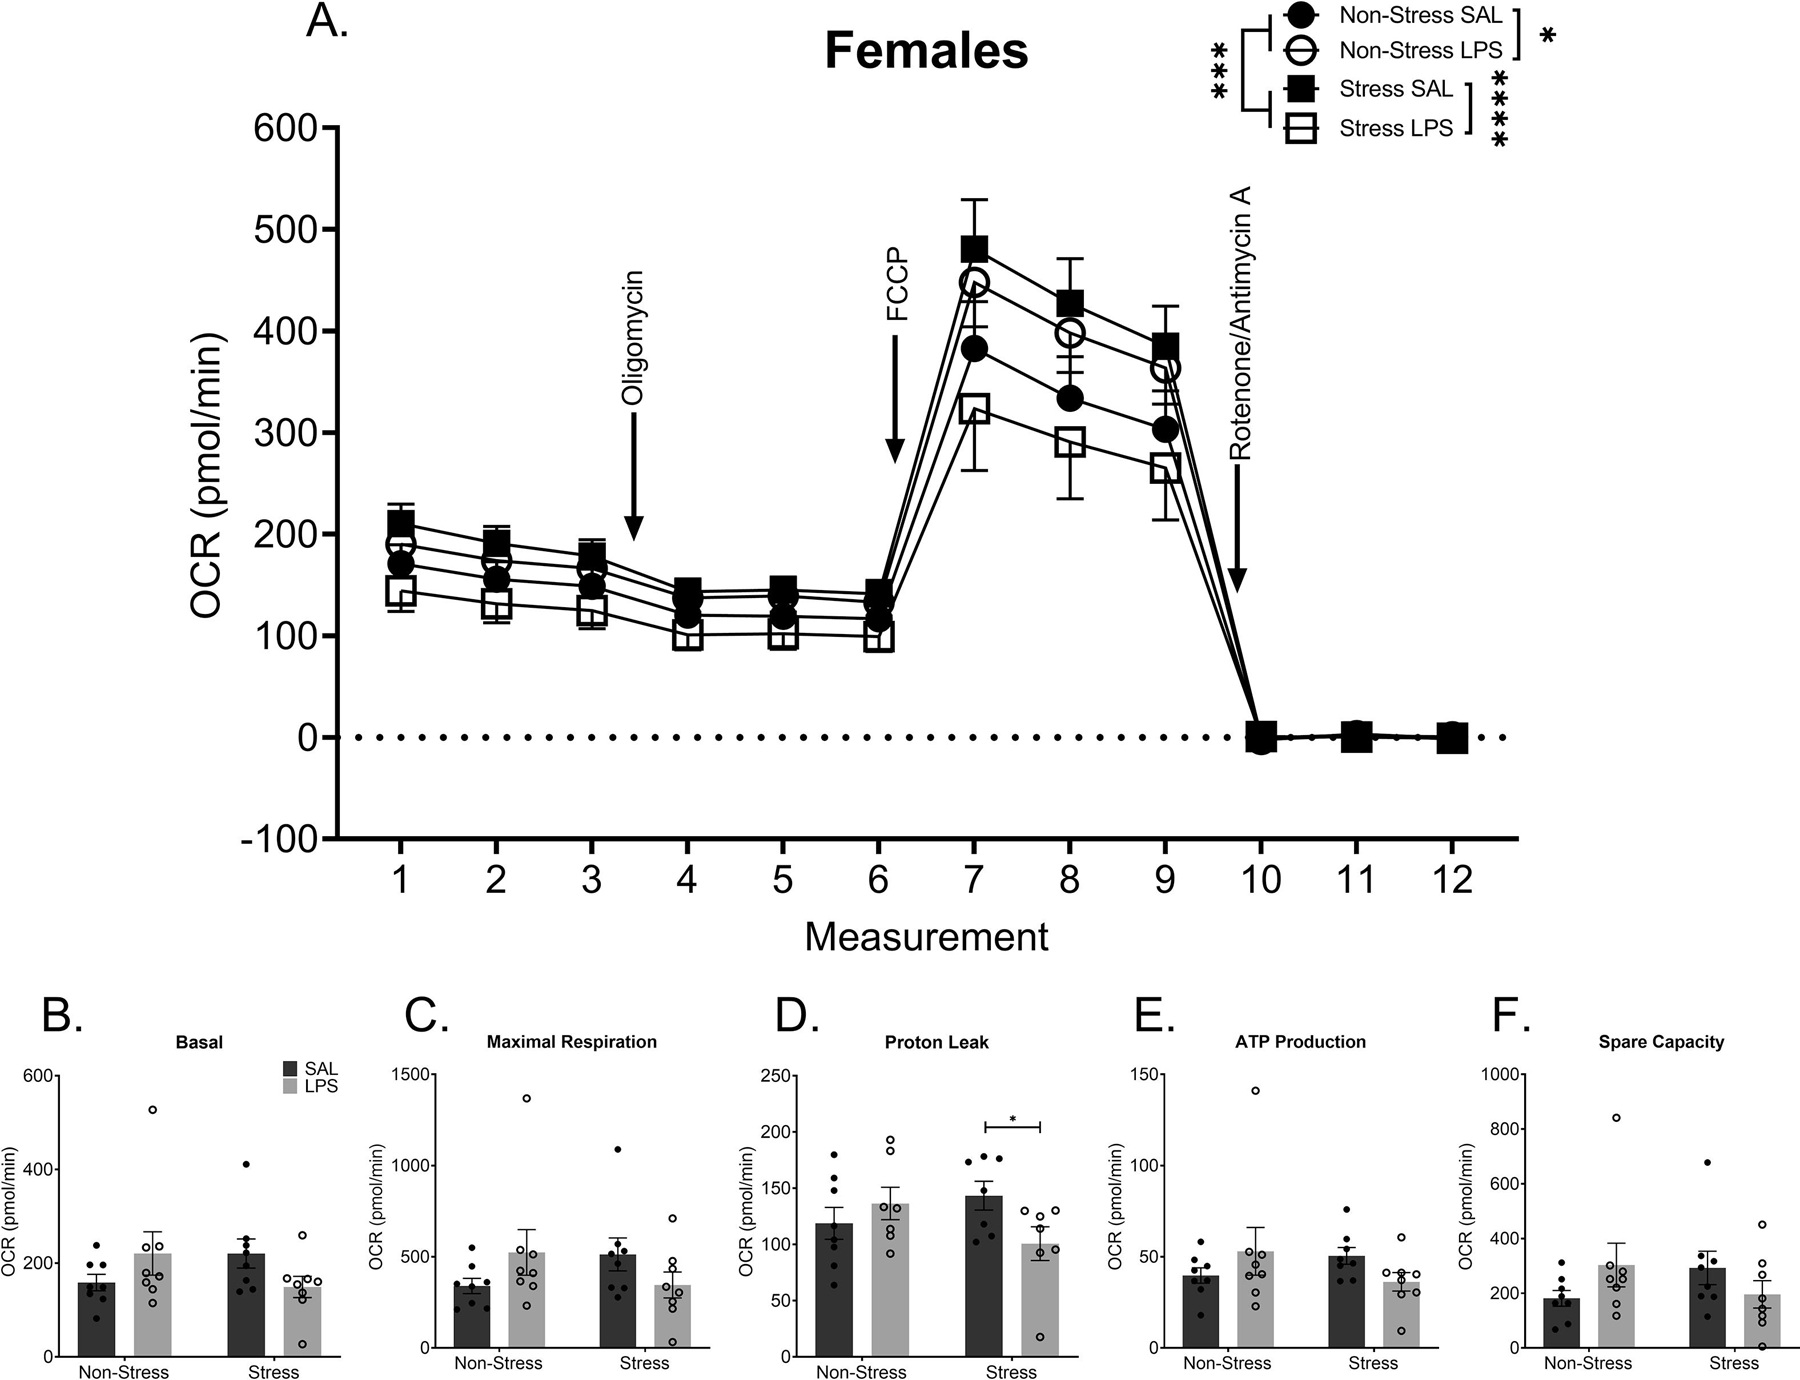
Although a history of chronic stress did not alter mitochondrial synaptosomal respiration in samples from male rats (p > 0.05), synaptosomal respiration was altered by chronic LPS treatment within males (F(1,276) = 13.72, p = 0.0003). In addition, a history of chronic stress interacted with chronic LPS to further exacerbate the impact of LPS alone (F(1,276) = 3.959, p = 0.0476; FIGURE 4A). Specifically, significant group differences existed between LPS treated males with no stress history and LPS treated males with a history of stress (p = 0.0011) and between saline treated males with no stress history and LPS treated males with no stress history (p < 0.0001). This indicates that the LPS treated males with a history of stress had a significant decrease in overall OCR when compared to all other groups. A breakdown of each individual component of the OCR waveform showed no significant differences in basal respiration (p > 0.05, FIGURE 4B), maximal respiration (p > 0.05, FIGURE 4C), proton leak (p > 0.05, FIGURE 4D), ATP production (p > 0.05, FIGURE 4E), or spare respiratory capacity (p > 0.05, FIGURE 4F). Collectively, these results indicated an overall impact on mitochondrial respiration that is not specific to any one part of the electron transport chain.
Figure 4: Chronic Stress Combined with Chronic LPS Alters Synaptosomal Respiration in Male Mice.
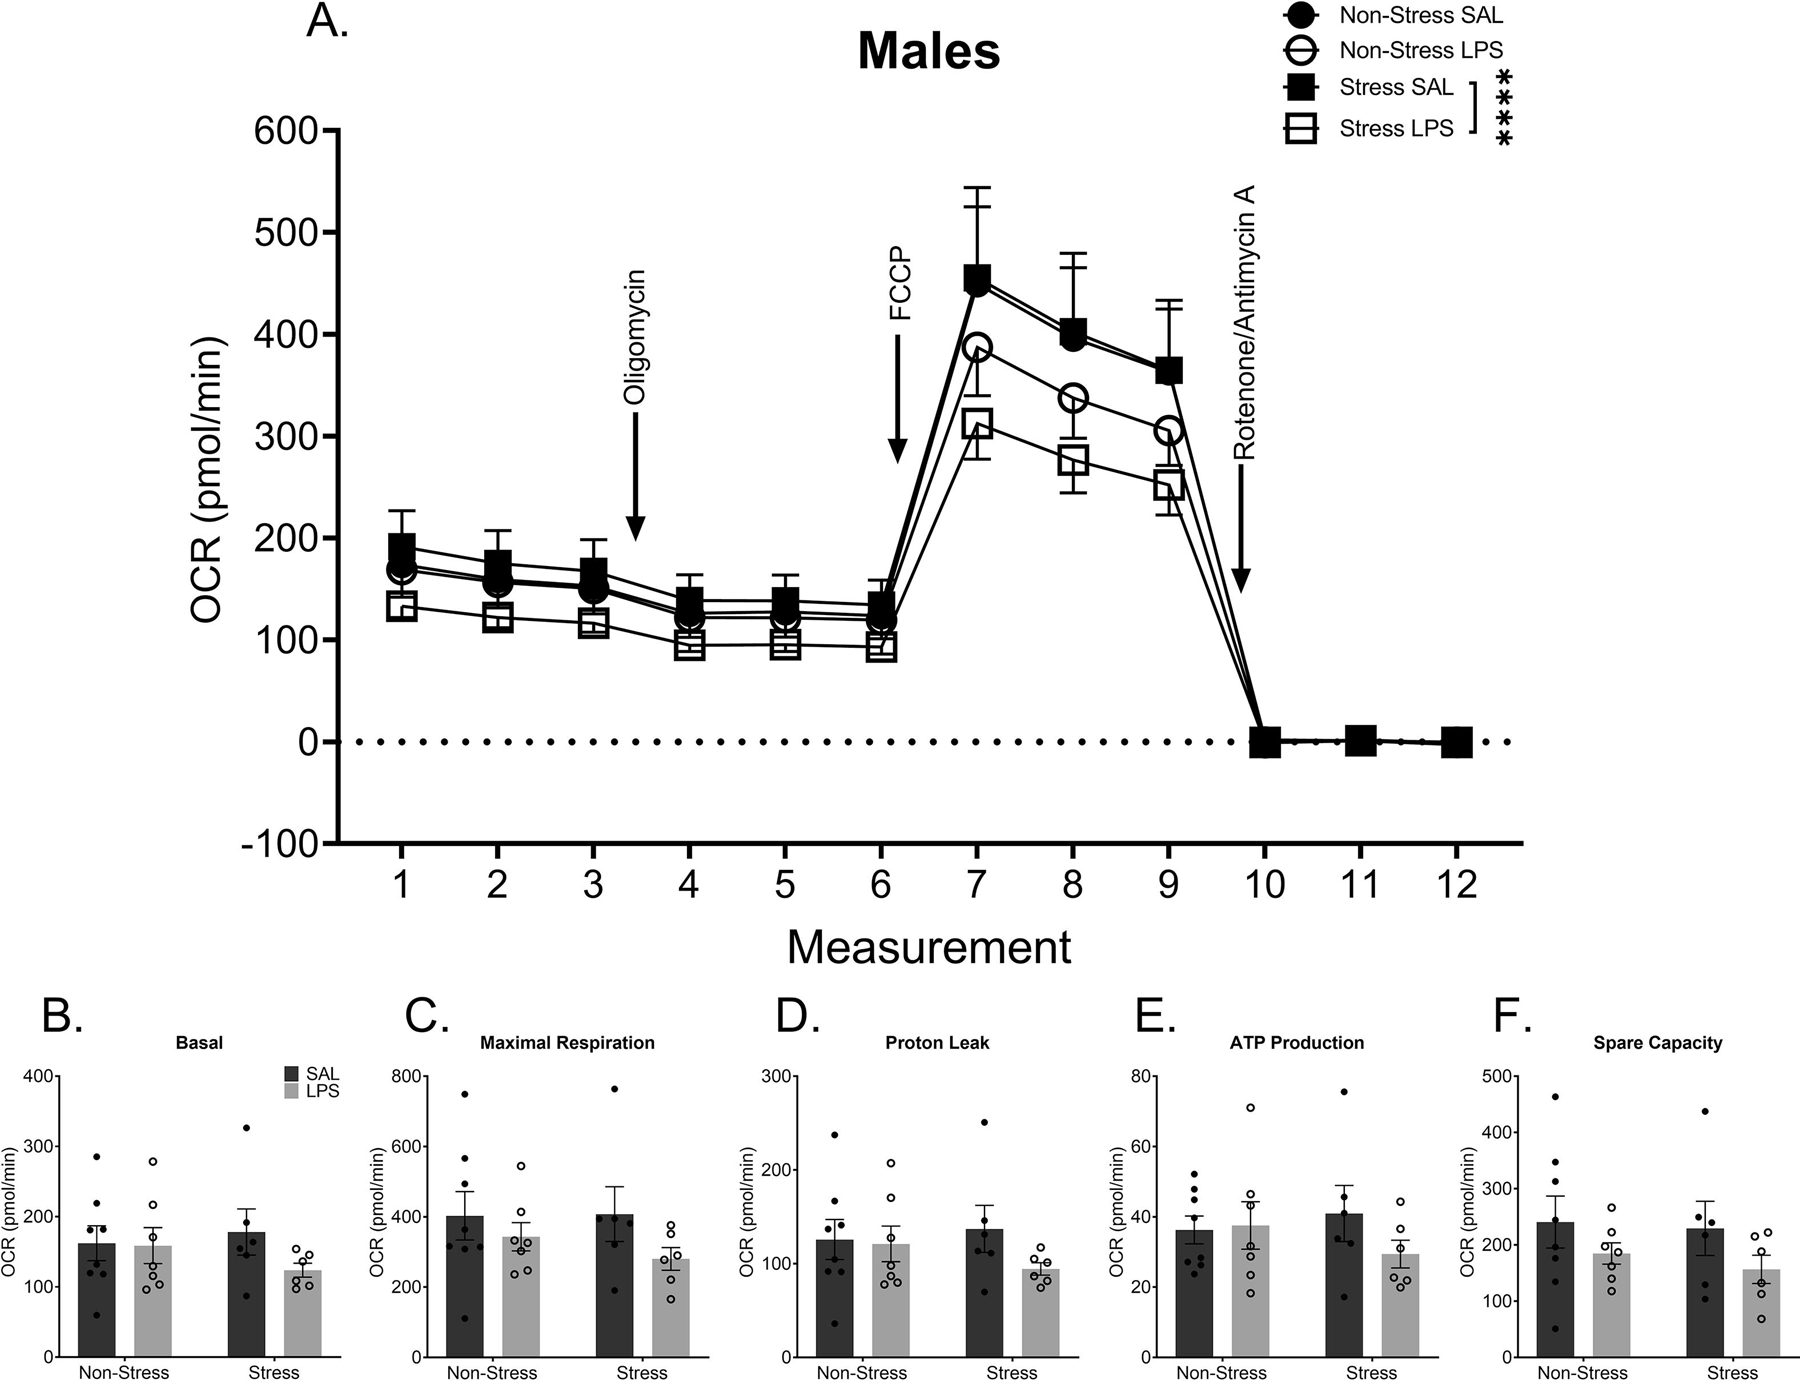
A) Metabolic data display a significant decrease in synaptosomal respiration in males with a history of stress and LPS treatment when compared to males with a history of stress alone. Despite this overall difference, there are no significant differences in basal respiration (B), maximal respiration (C), proton leak (D), ATP production (E), or spare capacity (F).
Reported values depict mean ± SEM. ****p < 0.0001.
Mitochondrial synaptosome respiration was altered by a history of chronic life stress (FIGURE 5A) or a history of chronic LPS treatment (F(1,300) = 5.725, p = 0.0173) or the combination of the two (F(1,300) = 33.16, p < 0.0001). Furthermore, differences were somewhat dependent on which aspect of the electron transport chain was being probed, as evidenced by a measurement by LPS treatment by stress interaction (F(11,300) = 2.269, p = 0.0114). Measurement refers to timepoints in the mitochondrial assay and which portion of the electron transport chain is being inhibited or stimulated. A history of chronic life stress increased mitochondrial respiration as compared to controls without stress exposure (p = 0.0002). Chronic LPS treatment also increased mitochondrial respiration as compared to saline treated controls, when no history of stress was present (p = 0.0104). When both a history of chronic stress and chronic LPS were present, synaptosomal respiration was reduced compared to stress alone (p < 0.0001) or LPS alone (p < 0.0001), but this group was not different than controls (p > 0.05). Isolation of each individual component of the OCR waveform show a significant difference in proton leak within females with a history of stress (p = 0.0468), with saline treated females exhibiting decreased proton leakage compared to females that were exposed to both chronic stress and chronic LPS (FIGURE 5D). There were no significant differences in basal respiration (p > 0.05, FIGURE 5B), maximal respiration (p > 0.05, FIGURE 5C), ATP production (p > 0.05, FIGURE 5E), or spare respiratory capacity (p > 0.05, FIGURE 5F).
Figure 5: Chronic Stress and Chronic LPS Independently Alter Synaptosomal Respiration in Female Mice.
A) Metabolic data display a stress and treatment dependent change in overall synaptosomal respiration. Chronic stress increased synaptosomal respiration even 11 weeks removed from the final stressor. In addition, chronic LPS treatment increased overall synaptosomal respiration in mice with no history of stress. Conversely, females that had both a history of chronic stress and were exposed to chronic LPS treatment demonstrated reduced overall synaptosomal respiration compared to the other groups. Although effects were not specific to basal respiration (B), maximal respiration (C), ATP production (E), or spare capacity (F), the combination of stress and LPS caused a decrease in proton leak (D) in females.
Reported values depict mean ± SEM. *p < 0.05, ****p < 0.0001.
3.4. Western Blot
Pooled synaptosomal preparations were probed for mitochondria (via Hexokinase I) and pre-synaptic terminals (via SNAP-25; SUPPLEMENTARY FIGURE 3). Within both males and females, there was no significant fold change difference in mitochondrial presence as a function of either stress or LPS treatment, as measured via Hexokinase I compared to same sex controls (p > 0.05; FIGURE 6A-B). Within the males, there was no significant difference in pre-synaptic terminal presence due to either stress or LPS (p > 0.05; FIGURE 6A). Conversely, within the females, data show a significant interaction among stress history and LPS exposure (F(6,24) = 3.421, p = 0.0139). Post hoc analysis demonstrated that LPS treatment, regardless of stress history, led to an increase in pre-synaptic terminal presence as compared to controls (p = 0.0214 and p = 0.0168 respectively; FIGURE 6B).
Figure 6: Female Mice Display Synaptosomal Composition and Mitochondrial Phenotype Differences.
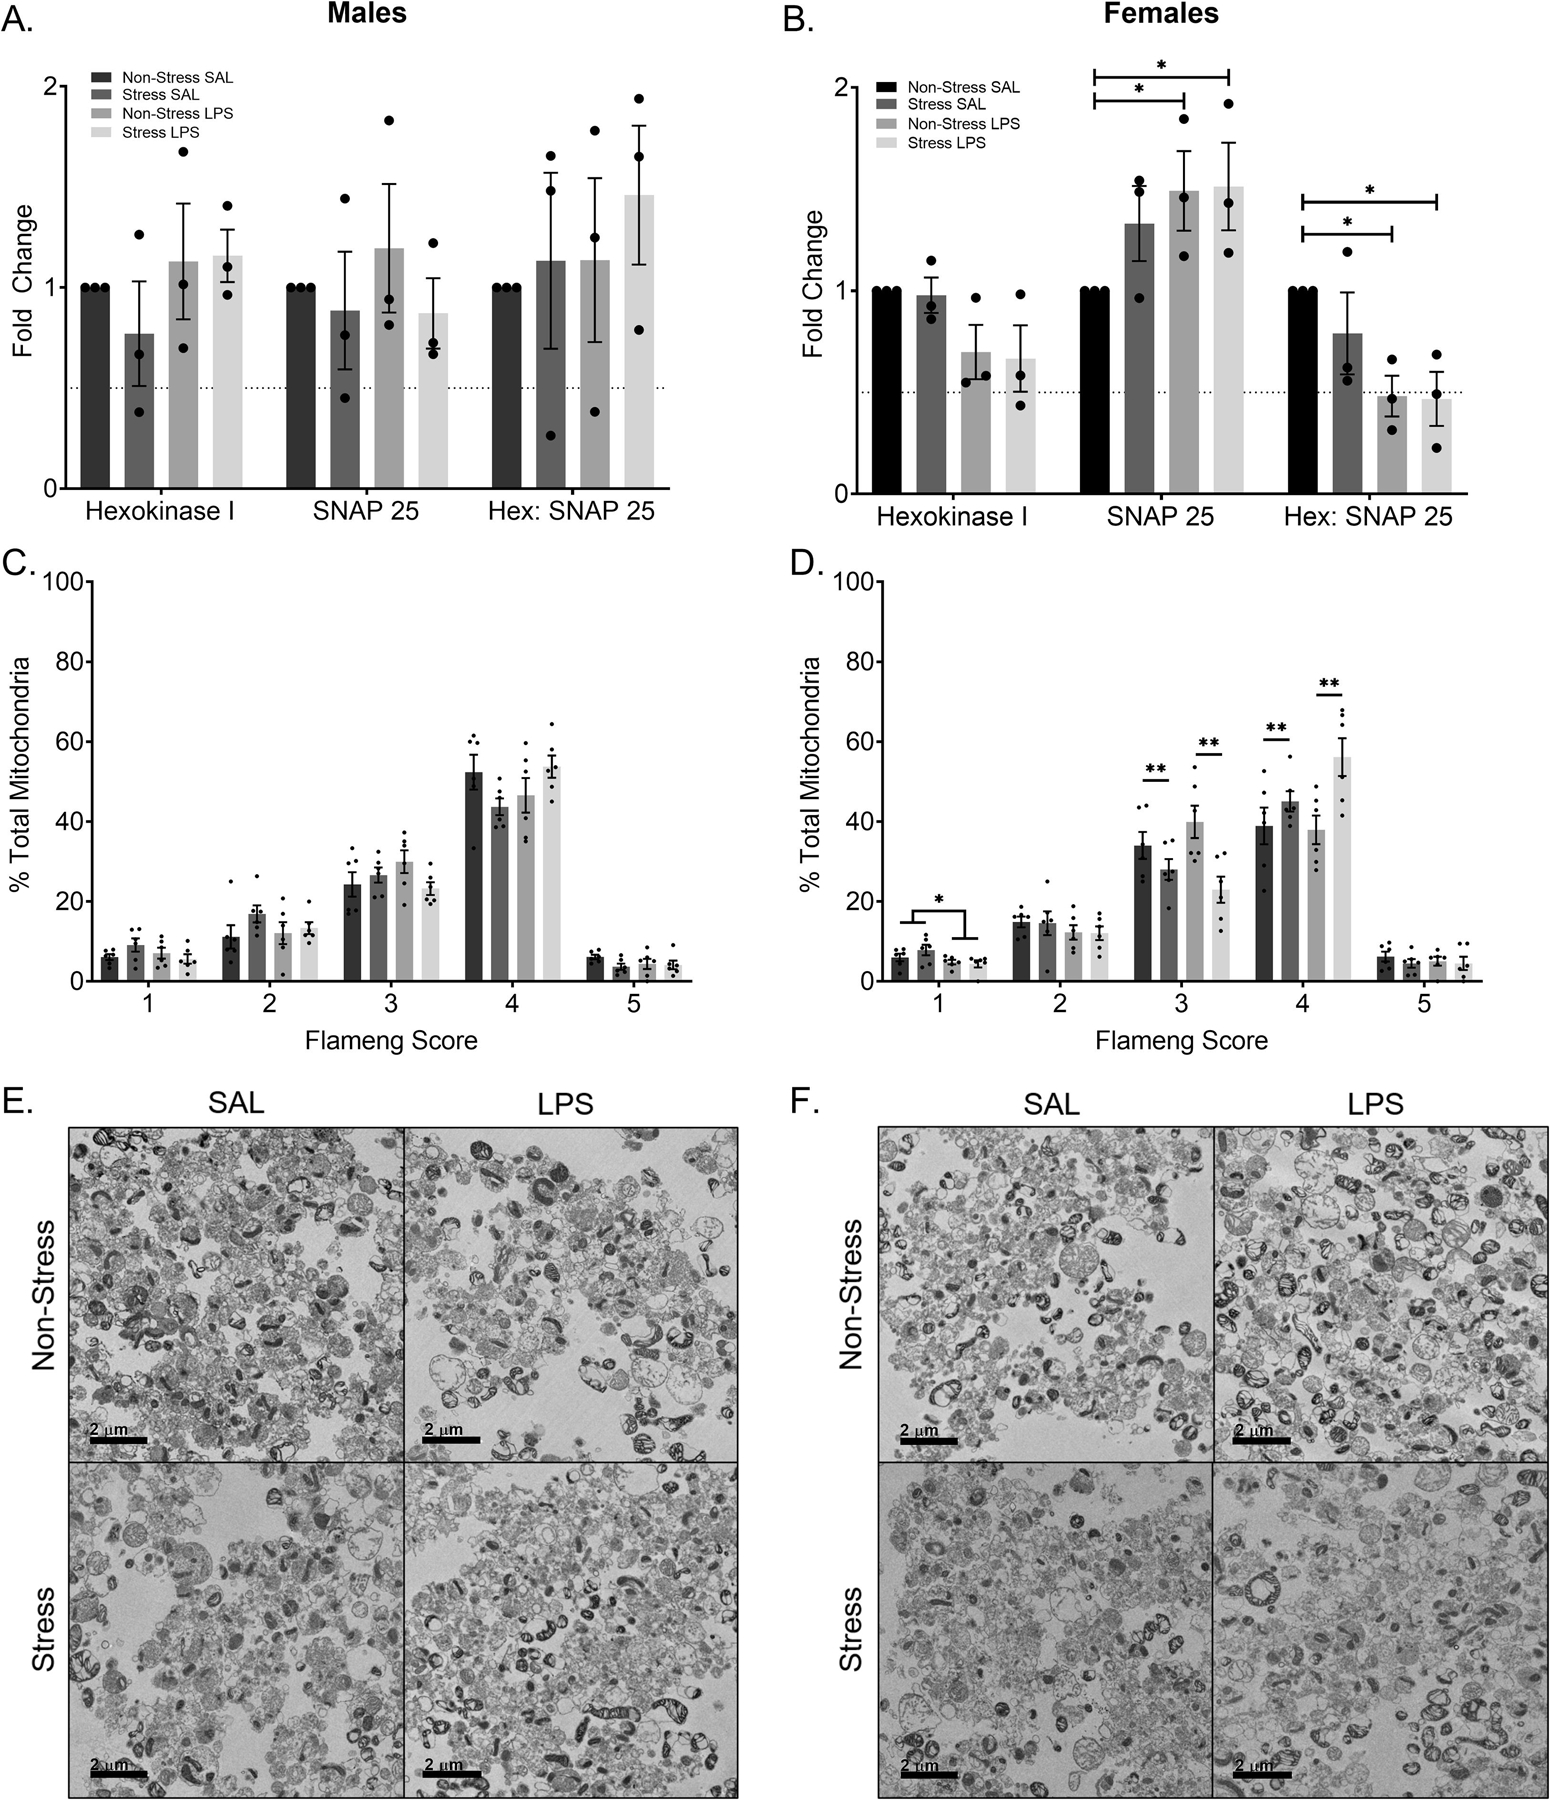
A) There is no significant difference in the number of mitochondria or presynaptic terminals in male mice. Likewise, there is no difference in relative number of mitochondria per presynaptic terminal. B) Within the females, there is no significant difference in mitochondrial number. There is a significant increase in the presence of presynaptic terminals in the LPS treated groups when compared to non-stress saline treated controls. Moreover, there is a significant decrease in the relative number of mitochondria per presynaptic terminal in the LPS treated groups when compared to the non-stress saline treated controls. C) Flameng score, a measure of mitochondrial phenotype and proxy for mitochondrial function did not differ by group for males. D) Flameng scores within the females show those who endured chronic LPS treatment display decreased mitochondria with broken membranes and broken cristae (Flameng score of one). A history of stress decreases inflamed mitochondria (Flameng score of three) and increases agranular mitochondria (Flameng score of four) within the female mice regardless of LPS exposure. Representative transmission electron images of males (E) and females (F).
Reported values depict mean ± SEM. *p < 0.05, **p < 0.01.
The ratio of Hexokinase I to SNAP-25 was calculated to assess the relative amount of mitochondria per presynaptic terminal. Males did not differ in relative ratio as a function of either stress or LPS exposure (p > 0.05). Females treated with either LPS alone (p = 0.0159) or with the combined exposure to stress and LPS (p = 0.0136) had a lower ratio indicative of fewer mitochondria per pre-synaptic terminal as compared to controls (no stress, no LPS).
3.5. Phenotypic Mitochondrial Assessment
In the males, there were no significant differences based on sex or treatment in the relative percentage of mitochondria at any Flameng score (p > 0.05; FIGURE 6C). Representative TEM images for each male group are displayed in FIGURE 6E. Female data show a main effect of LPS treatment in mitochondria with broken membranes and cristae (Flameng score of one; F(1,20) = 5.601, p = 0.0281; FIGURE 6D) and a main effect of stress in both inflamed mitochondria (Flameng score of three; F(1,20) = 11.73, p = 0.0027) and agranular mitochondria (Flameng score of four; F(1,20) = 9.466, p = 0.0060). Representative TEM images for each female group are displayed in FIGURE 6F.
3.6. qPCR
Chronic LPS exposure increased expression of IL-1ß in the hippocampus (F(1,27) = 11.12, p = 0.0025; FIGURE 7A) of male mice. In addition, both chronic LPS (F(1,27) = 5.176, p = 0.0311) and chronic stress (F(1,27) = 5.539, p = 0.0261) increased TNFα expression in the male hippocampus. No effects of chronic stress or chronic LPS were detected in the prefrontal cortex in expression of either TNFα (p > 0.05) or IL-1ß (p > 0.05). No impact of either a history of chronic stress or a history of chronic LPS was observed in terms of expression of IL-1ß or TNFα in the hippocampus or prefrontal cortex of female mice (p > 0.05; FIGURE 7B). Likewise, ROMO1 expression did not differ by either stress or LPS history for either males or females (p > 0.05).
Figure 7: Chronic Inflammation and a History of Chronic Stress Alter Expression of TNF-α and IL-1ß in the Hippocampus of Male Mice.
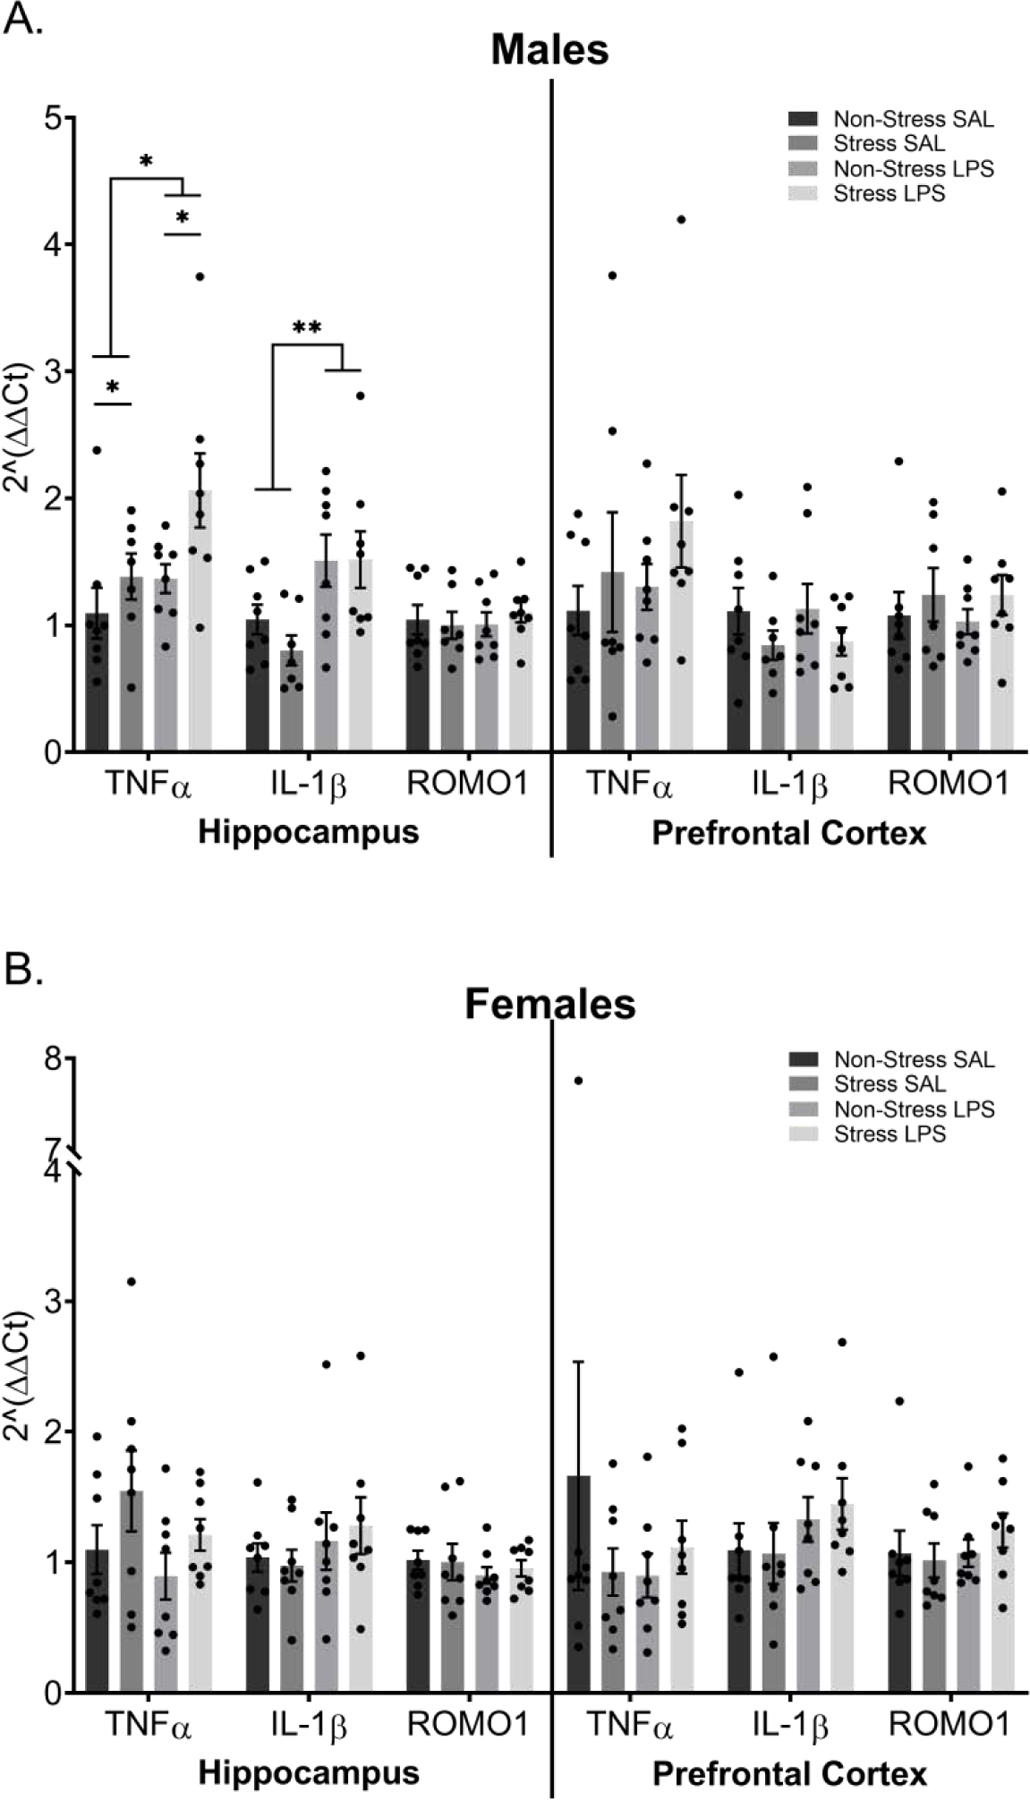
Transcript levels of the pro-inflammatory cytokines TNF-α and IL-β as well as the reactive oxygen species marker ROMO1 were assessed in hippocampal and prefrontal cortex tissue via TaqMan RT-qPCR. A) TNF-α levels within male hippocampi show that both stress and LPS increase TNF-α yet display no significant differences in the prefrontal cortex. Chronic LPS treatment increased IL-1β transcript in the hippocampus of male mice but did not change transcript levels in the prefrontal cortex. Neither hippocampal not prefrontal cortex samples showed significant differences in levels of ROMO1. B) Female data show no significant differences in TNF-α, IL-1β, or ROMO1 levels in either the hippocampus or prefrontal cortex.
Reported values depict mean ± SEM. *p < 0.05, **p < 0.01.
3.7. Peripheral Inflammation
3.7.1. Proinflammatory Cytokines
TNFα concentrations in male serum differed by sample collection timepoint (F(2,77) = 22.92, p < 0.0001), LPS treatment (F(1,77) = 25.66, p < 0.0001), and stress exposure history (F(1,77) = 4.392, p = 0.0394). In addition, interactions occurred between study time point and LPS treatment (F(2,77) = 22.77, p < 0.0001), study time point and stress history (F(2,77) = 4.603, p = 0.0129), LPS treatment and stress history (F(1,77) = 4.364, p = 0.0400), and LPS treatment by study time point by stress history (F(2,77) = 4.581, p = 0.0132; FIGURE 8A). Post hoc analysis demonstrated that males given an acute LPS injection had elevated TNFα concentrations regardless of stress history (p’s < 0.05). TNFα concentrations in females were altered by study time point (F(2,78) = 31.49, p < 0.0001) and LPS treatment (F(1,78) = 35.20, p < 0.0001), with a time point by LPSP treatment interaction (F(1,77) = 31.43, p < 0.0001; FIGURE 8B). Post hoc analysis exposes this interaction is driven by a significant difference between saline and LPS treated females at the acute time point (p < 0.0001).
Figure 8: Peripheral Pro-inflammatory Cytokines Changes Following LPS.
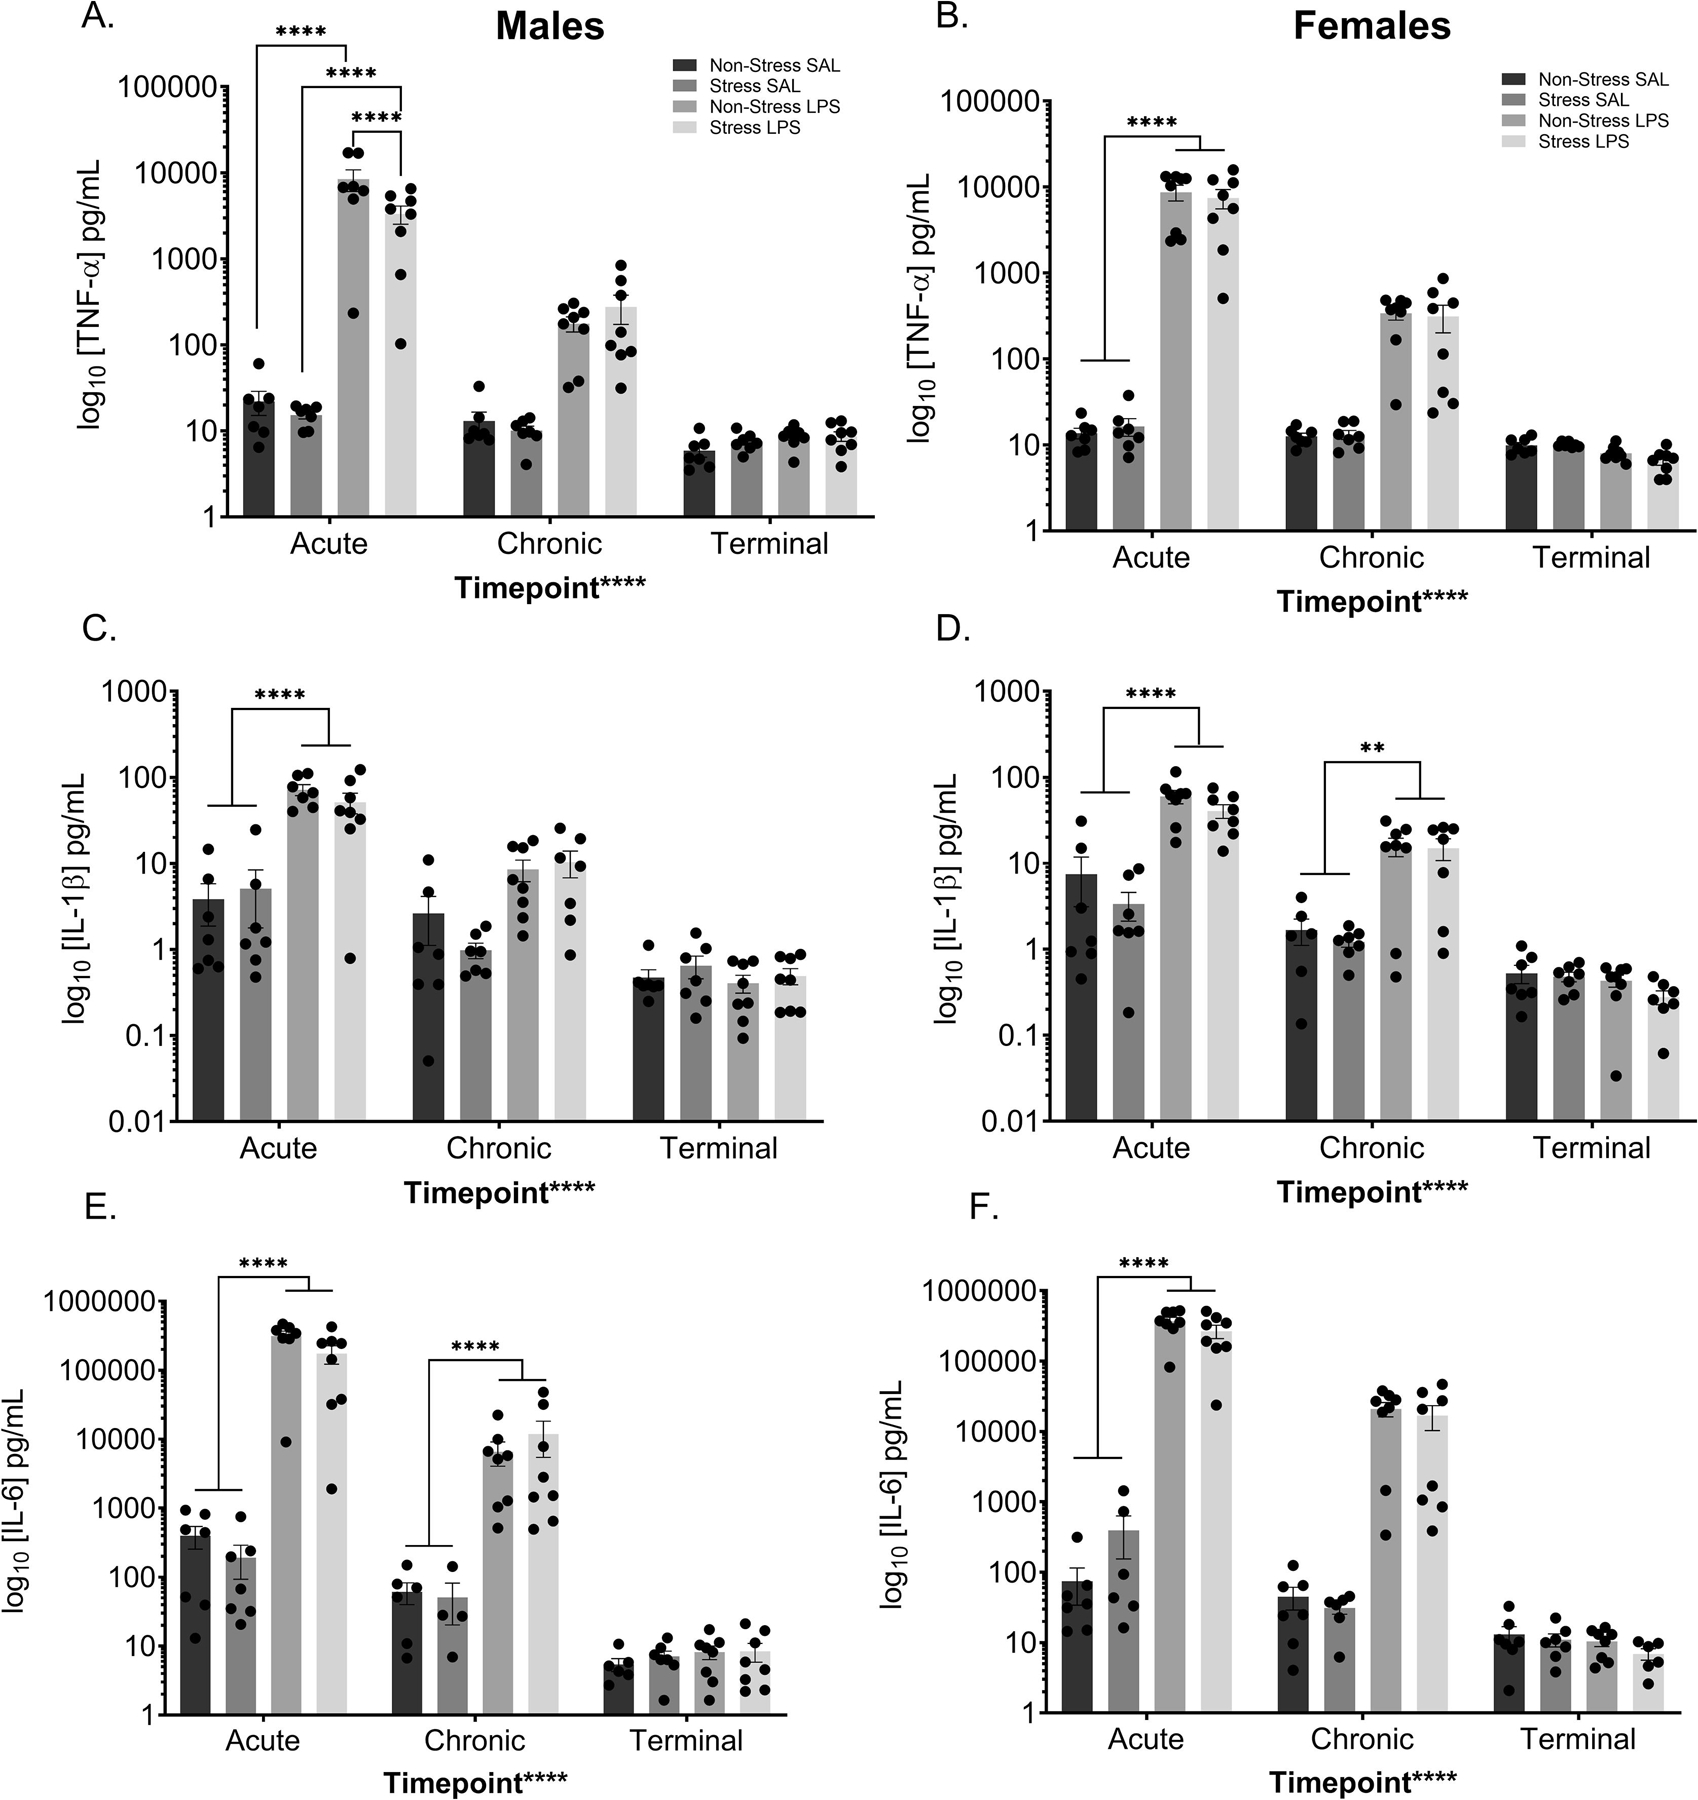
Peripheral cytokine levels were assessed at three time points; two hours after the initial treatment injection (“acute”), two hours after the last treatment injection (“chronic”), and from terminal collections (“terminal”). Chronic LPS injections increased circulating TNF-α in both males (A) and females (B) at the acute time point only. Moreover, in males, the combination of stress and LPS decreased circulating TNF-α levels when compared to those treated with LPS alone at the acute time point. Peripheral IL-1ß levels increased with chronic LPS injections at the acute time point of both males (C) and females (D). Additionally, chronic LPS treatment increased circulating IL-1ß levels in females at the chronic time point (D). IL-6 levels in the periphery were significantly increased following LPS treatment at both the acute and chronic time point in males (E). In females, IL-6 levels significantly increased following LPS treatment at the acute time point only (F).
Reported values depict mean ± SEM. **p < 0.01, ****p < 0.0001.
Concentrations of circulating IL-1ß in males differed as a function of study time point (F(2,76) = 40.39, p < 0.0001) and LPS treatment (F(1,76) = 46.09, p < 0.0001; FIGURE 8C). Further, there is a time point by LPS treatment interaction (F(2,76) = 31.82, p < 0.0001), which is driven by a difference between saline and LPS treated males at the acute time point (p < 0.0001). IL-1ß levels in the females demonstrates a main effect of study time point (F(2,75) = 336.93, p < 0.0001), LPS treatment (F(1,75) = 52.04, p < 0.0001), and a time point by treatment interaction (F(2,75) = 24.58, p < 0.0001; FIGURE 8D) driven by a significant difference between saline and LPS treated females at both the acute ( p < 0.0001) and chronic (p = 0.0053) study time points.
Both male and female data for IL-6 have similar patterns compared to their respective controls, with both sexes displaying main effects of study time point (male: F(2,72) = 33.68, p < 0.0001; FIGURE 8E; female F(2,74) = 50.69, p < 0.0001; FIGURE 8F) and LPS treatment (male: F(1,72) = 36.00, p < 0.0001; female: F(1,74) = 59.82, p < 0.0001), with a time point by LPS treatment interaction (males: F(2,72) = 33.53, p < 0.0001; females: F(2,74) = 50.55, p < 0.0001). In both cases, this interaction is driven by differences between the saline and LPS treated mice at the acute LPS time point (males: p < 0.0001; females: p < 0.0001)
Although male IFN-γ gave rise to no significant results (FIGURE 9A), female data showed a main effect of time point (F(2,70) = 3.614, p = 0.0321) and a time point by LPS treatment interaction (F(2,70) = 15.52, p < 0.0001; FIGURE 9B). Post hoc analysis revealed this interaction is driven by a difference between the saline and LPS treated females at the acute (p < 0.0001) and terminal (p = 0.0046) time points. This is notable as it suggests that chronic low-level inflammation increases IFN-γ circulation following an acute injection but gives rise to decreased IFN-γ circulation following chronic LPS injections.
Figure 9: Peripheral Pro-inflammatory Cytokines Altered Following Chronic Stress and LPS.
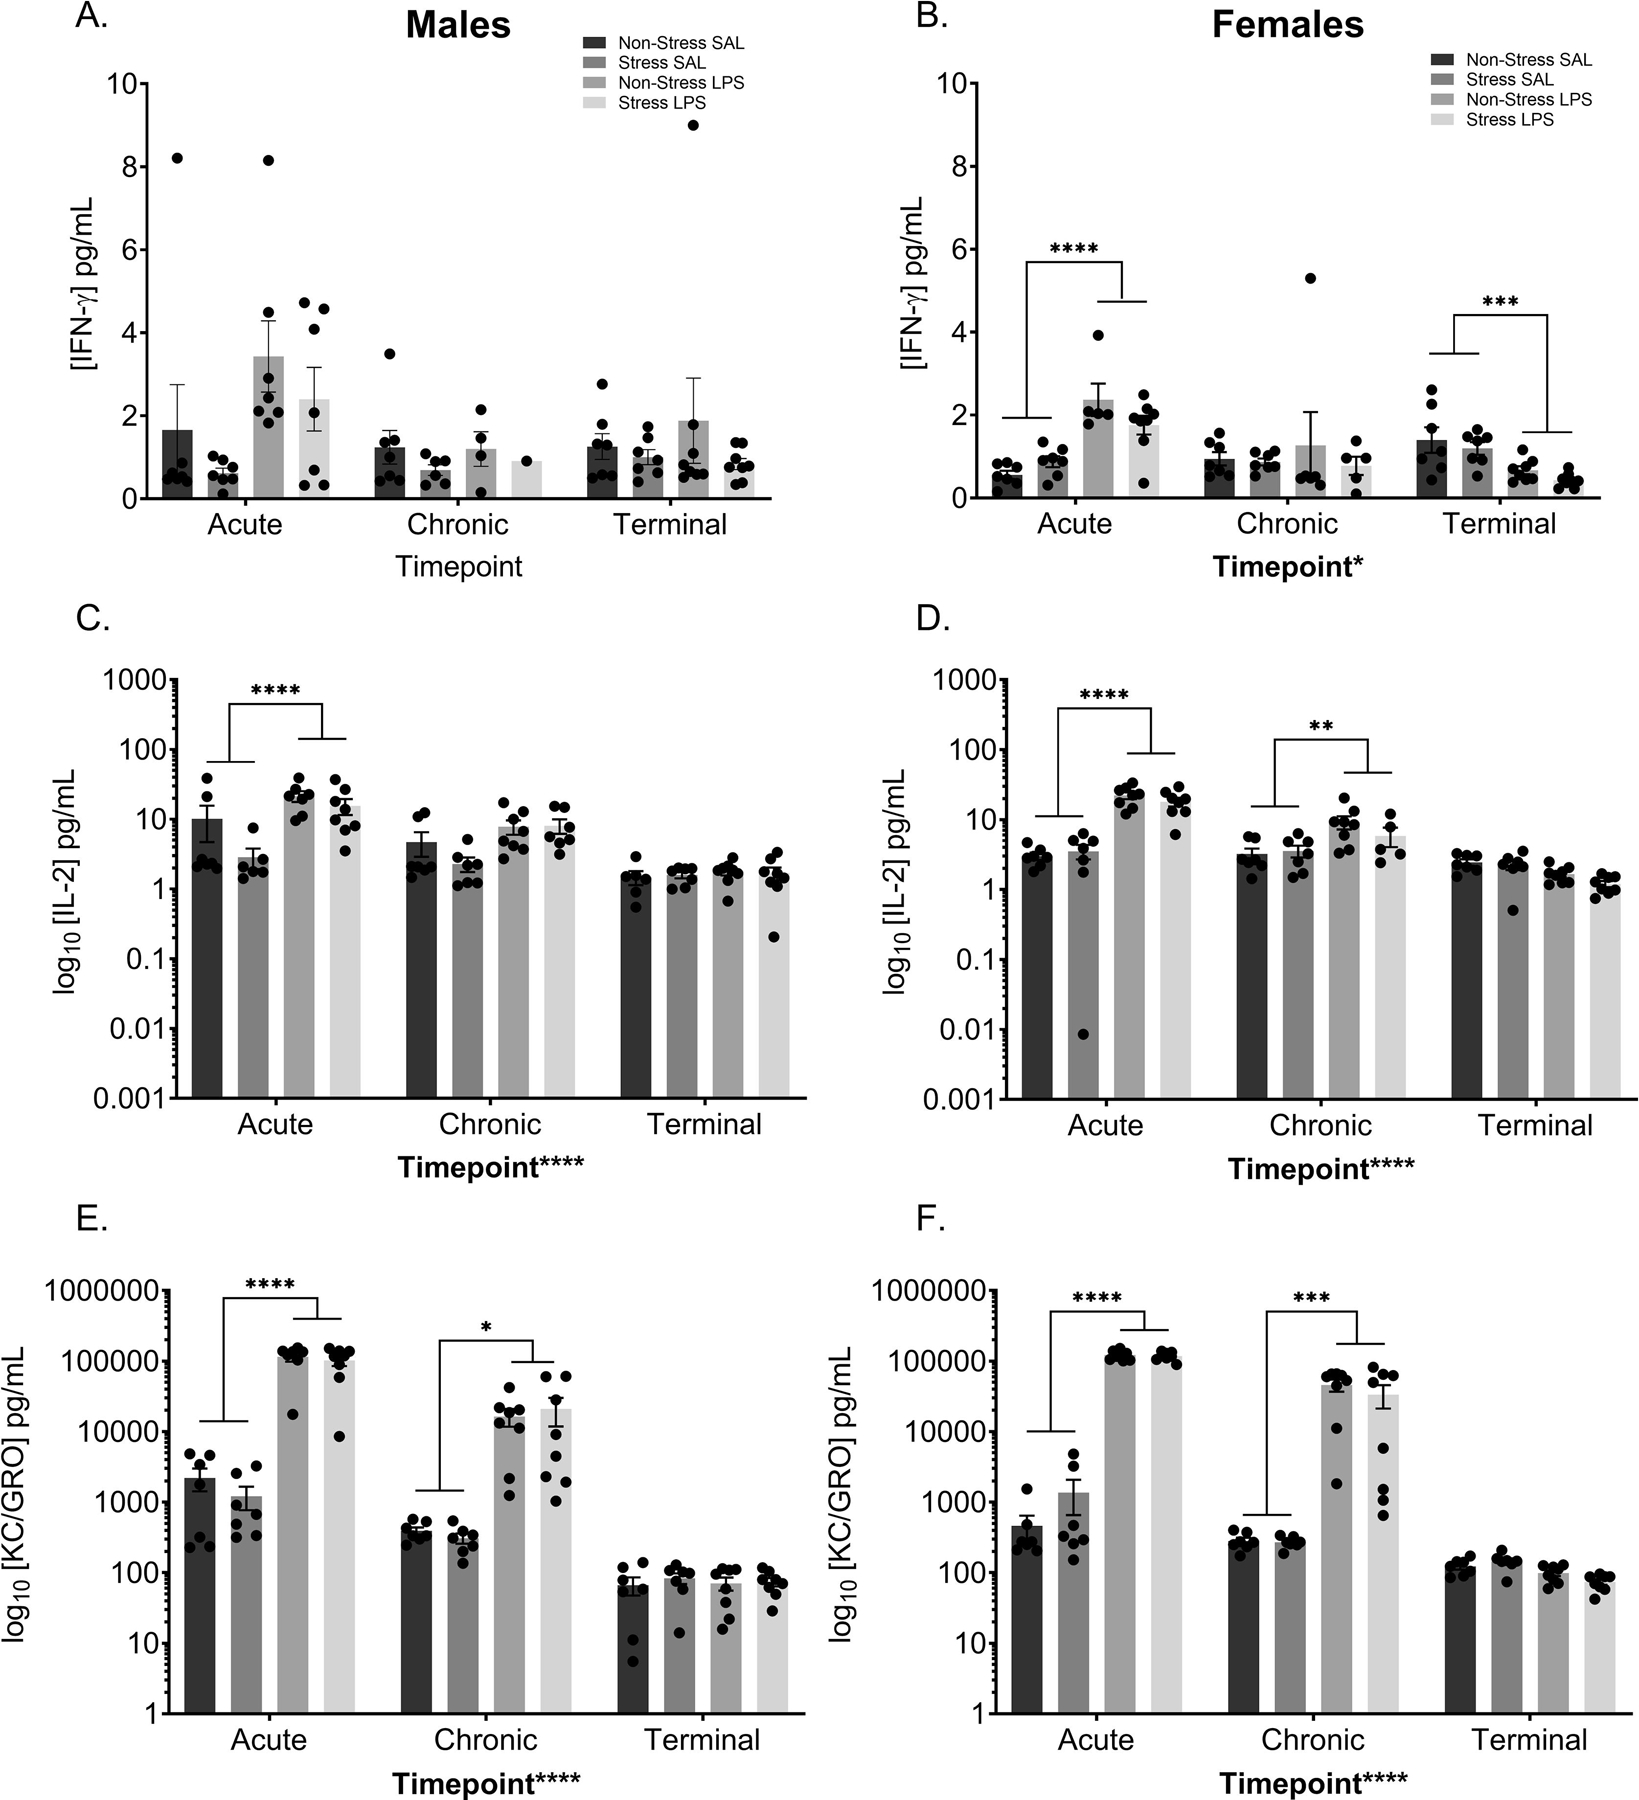
Peripheral cytokine levels were assessed at three time points; two hours after the initial treatment injection (“acute”), two hours after the last treatment injection (“chronic”), and from terminal collections (“terminal”). A) There was no significant difference in IFN-γ in the males. B) In the females, LPS treatment significantly increased circulating IFN-γ levels at the acute time point. Alternatively, a history of chronic LPS decreased baseline IFN-γ levels in the periphery of female mice. C) LPS significantly increased circulating IL-2 levels in male mice at the acute time point. D) In females, LPS increased circulating IL-2 levels at the acute and chronic time points. At both the acute and chronic times, LPS increased circulating levels of KC/GRO in both male (E) and female (F) mice.
Reported values depict mean ± SEM. *p < 0.05, **p < 0.01, ***p < 0.001, ****p < 0.0001.
Proinflammatory cytokine IL-2 also show similar results within the sexes, with males and females displaying main effects of time point (male: F(2,74) = 19.14, p < 0.0001; FIGURE 9C; female F(2,75) = 49.71, p < 0.0001; FIGURE 9D) and LPS treatment (male: F(1,74) = 14.80, p = 0.0003; female: F(1,75) = 65.01, p < 0.0001), with a time point by treatment interaction (males: F(2,74) = 5.650, p = 0.0052; females: F(2,75) = 42.24, p < 0.0001). Within the males, the interaction is driven by a significant difference in treatment at the acute time point (p < 0.0001). Female data display a more robust change, with the interaction driven by treatment differences at both the acute (p < 0.0001) and chronic (p = 0.0033) time points.
KC/GRO, a proinflammatory cytokine that has recently been tagged as a potential biomarker of depression in the elderly (Fanelli et al., 2019) shows similar results between males and females. Data show main effects of time point (male: F(2,77) = 56.34, p < 0.0001; FIGURE 9E; female F(2,78) = 128.9, p < 0.0001; FIGURE 9F) and treatment (male: F(1,77) = 85.65, p < 0.0001; female: F(1,78) = 284.7, p < 0.0001), with a time point by treatment interaction (males: F(2,77) = 53.05, p < 0.0001; females: F(2,78) = 125.5, p < 0.0001). In both this interaction is driven by significant differences between saline and LPS treated mice at the acute (male: p < 0.0001; female: p < 0.0001) and chronic (male: p = 0.0177; female: p < 0.0001) time points.
IL-12p70 was below the limit of detection for most samples. A summary of the data collected can be found in SUPPLEMENTARY TABLE 2.
3.7.2. Anti-inflammatory Cytokines
The anti-inflammatory cytokines IL-4, IL-5, and IL-10 were assessed and analyzed identically to the proinflammatory cytokines. IL-4 levels in the males display a main effect of time point (F(2,40) = 13.69, p < 0.0001), treatment (F(1,40) = 7.775, p = 0.0081), and a time point by treatment interaction (F(2,40) = 4.207, p = 0.0220; FIGURE 10A). At the acute time point, there is a significant difference between the saline treated and LPS treated males (p = 0.0001), driving this interaction. Female IL-4 levels display a main effect of time point (F(2,45) = 10.40, p = 0.0002) and a time point by treatment interaction (F(2,45) = 6.957, p = 0.0023; FIGURE 10B). Similar to the males, the female interaction is driven by a significant difference between the saline and LPS treated groups at the acute time point (p < 0.0001).
Figure 10: Peripheral Anti-inflammatory Cytokines Increase Following LPS.
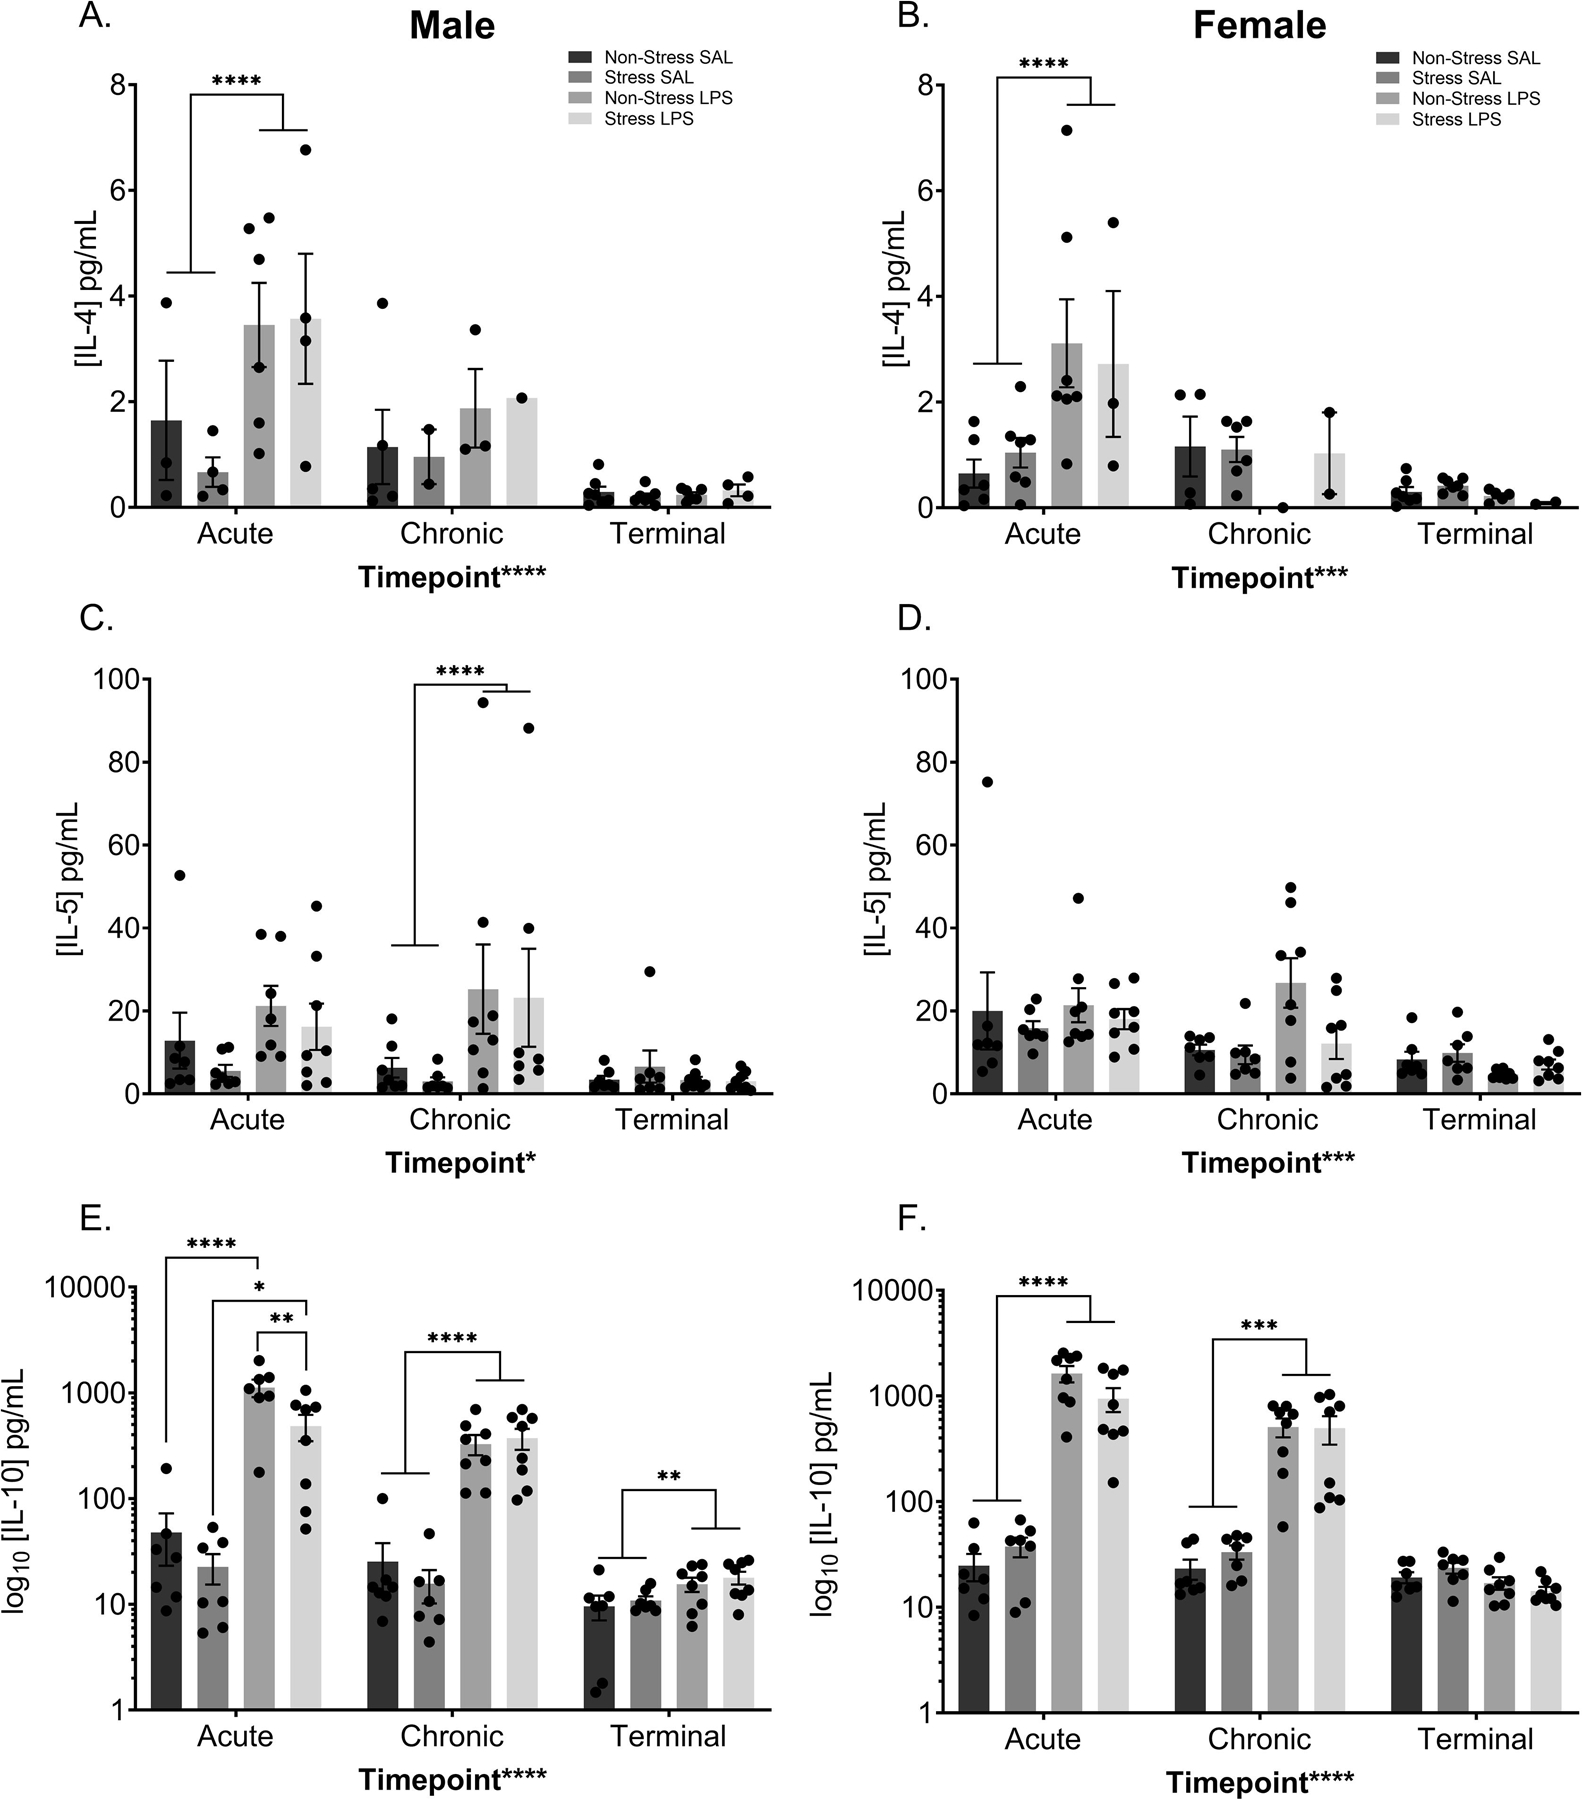
Peripheral cytokine levels were assessed at three time points; two hours after the initial treatment injection (“acute”), two hours after the last treatment injection (“chronic”), and from terminal collections (“terminal”). LPS treatment increased circulating IL-4 levels in both males (A) and females (B) at the acute time point. IL-5 levels increased in the periphery of LPS treated males at the chronic time point (C) but did not significantly alter circulating levels of females (D). Circulating levels of IL-10 were increased at all time points in the males (E), with LPS increasing IL-10 levels at the acute, chronic, and terminal time points. Moreover, at the acute time point, the combination of LPS and chronic stress decreased circulating IL-10 levels when compared to males that were treated with LPS alone. F) LPS increased circulating IL-10 levels in females at both the acute and chronic time points.
Reported values depict mean ± SEM. *p < 0.05, **p < 0.01, ***p < 0.001, ****p < 0.0001.
IL-5 levels in males display a main effect of time point (F(2,76) = 4.222, p = 0.0182), treatment (F(1,76) = 7.609, p = 0.0073), and a time point by treatment interaction (F(2,76) = 3.522, p = 0.0345; FIGURE 10C), driven by a significant difference between the saline and LPS treated males at the chronic time point (p = 0.0007). Female data only show a main effect of time point (F(2,78) = 9.038, p = 0.0003; FIGURE 10D), with levels of IL-5 decreasing over the course of the injection series.
Data from circulating IL-10 levels show a complex set of interactions within the males. IL-10 levels showed a main effect of time point (F(2,77) = 25.88, p < 0.0001), treatment (F(1,77) = 63.84, p < 0.0001), stress (F(1,77) = 5.124, p = 0.0264), as well as interactions between time point and treatment (F(2,77) = 22.79, p < 0.0001), time point and stress (F(2,77) = 6.060, p = 0.0036), treatment and stress (F(1,77) = 4.081, p = 0.0469), and treatment by time point by stress (F(2,77) = 5.357, p = 0.0066; FIGURE 10E). Post hoc analysis showed a significant difference between the non-stress groups (p < 0.0001), the LPS groups (p = 0.0014), and stress groups (p = 0.0154) at the acute time point. Moreover, there is a treatment effect at the chronic (p < 0.0001) and terminal (p = 0.0079) time points. Collectively, LPS treatment elevates IL-10 after acute and chronic dosing and it remains elevated for at least a week past the final exposure. Female data show a main effect of time point (F(2,78) = 25.12, p < 0.0001) and treatment (F(1,78) = 59.51, p < 0.0001; FIGURE 10F). Data also display a time point by treatment interaction (F(2,78) = 24.39, p < 0.0001), which is driven by a significant difference between saline and LPS treated females at the acute (p < 0.0001) and chronic (p = 0.0008) time points.
3.7.3. Circulating ROMO-1Cconcentration
Males exposed to chronic injections of LPS displayed increased circulating ROMO1 than their saline treated male counterparts regardless of stress history (F(1,27) = 4.984, p = 0.0341; FIGURE 11A). Despite a visual difference in means, a history of chronic stress did not significantly elevate ROMO-1 concentrations (p > 0.05). Within the female groups, there was no significant difference between stress or treatment background (p > 0.05; FIGURE 11B).
Figure 11: Chronic LPS Increases Circulating ROMO-1 in Males.
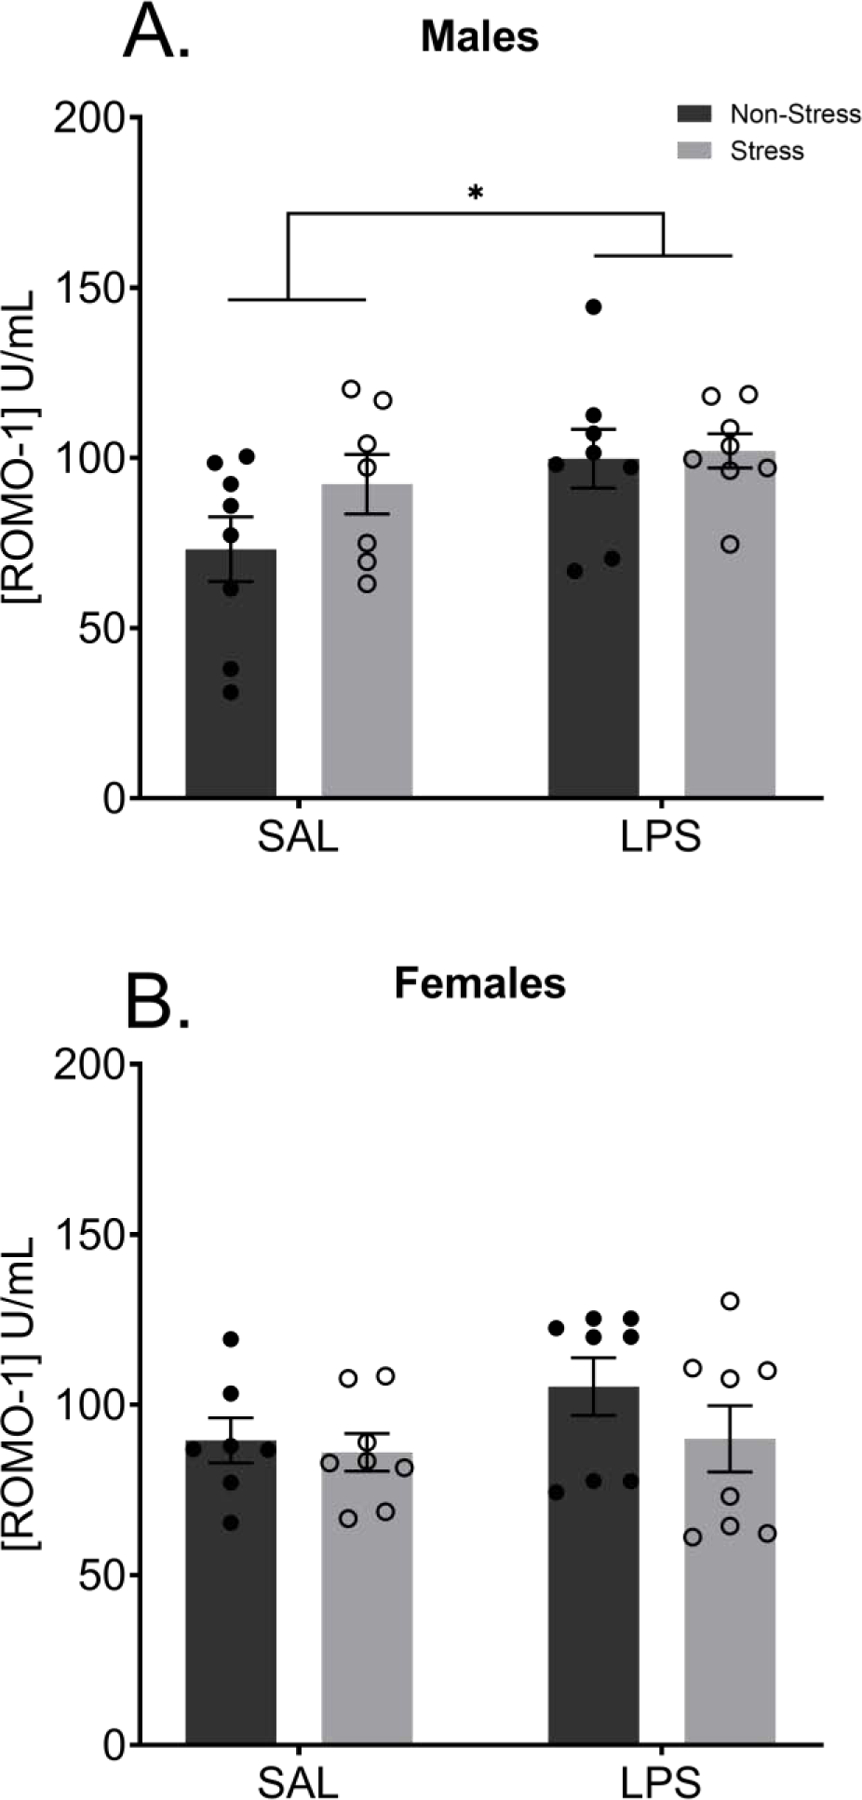
Terminal levels of peripheral ROMO1, eleven weeks after the final LPS treatment, were significantly increased in males treated with LPS (A) but not females (B). There was no effect of stress history on circulating levels of ROMO1 at baseline in either males or females.
Reported values depict mean ± SEM. *p < 0.05.
Discussion
A history of chronic traumatic stress is sufficient to alter mitochondrial function measured in synaptosomes collected from female mice eleven weeks after exposure to the final chronic stressor. In addition, with the exception of indicators of increased anxiety-like behavior, there were no observed phenotypic indicators of the neural changes. In contrast to females, males were susceptible to only inflammation-induced reductions in synaptic respiration as well as effects of chronic stress and chronic inflammation on piloerection and inflammatory profiles both peripherally and centrally. These data suggest that females are more sensitive to long-term functional changes in synaptic mitochondria, far removed from traumatic stress exposure. It will be important for future work to query the extent to which female-dominant manifestations of neurodegenerative conditions such as Alzheimer’s disease (Ferretti et al., 2018) may in part be fueled by phenotypically invisible changes to mitochondrial function that are accrued as a consequence of life stressors and inflammatory challenges.
Despite elevated synaptosomal respiration in females with a history of chronic stress or chronic inflammation, there were a reduced number of mitochondria present at the synapse in synaptosomes of females with a history of chronic inflammation. This reduction suggests an impaired rate of mitochondrial trafficking to the synaptic space (Fang et al., 2012). Combined with increased respiration, it is possible that females who have experienced chronic inflammation or a history of stress have increased individual mitochondrial respiration, potentially compensating for the deficit of mitochondrial number at the synapse via increased mitochondrial productivity. Compensatory mechanisms for the individual exposure to either chronic life stress or chronic inflammation appear to wane when exposed to both conditions such that, in females that experienced chronic inflammation after a history of chronic stress, synaptosomal respiration was decreased. In particular, females with both a history of stress and chronic inflammation displayed reduced proton leak, implicating a deficit in the oxidative phosphorylation pathway in the decreased respiration (Cheng et al., 2017; Krauss et al., 2002). Proton leak, the connecting factor between oxygen consumption and ATP generation, does not work alone and is minimally assisted by the ‘electron slip’ that may give rise to an elevated oxygen consumption rate disproportionate to what would be expected (Cheng et al., 2017), thus acting as a compensatory mechanism in times of mitochondrial distress. This shift in mitochondrial function likely prevents the activation of this protective compensatory mechanism, leaving ATP production at the synapse compromised when chronic inflammation is combined with chronic stress. This decreased respiration could lead to impaired neurotransmission, as ATP is critical in neurotransmitter packaging and vesicular release at the presynaptic terminal (Pathak et al., 2015; Rangaraju et al., 2014). Taken together, our data suggest that females employ compensatory mechanisms when exposed to a single modality of chronic exposure – stress or inflammation. However, when a consummate capacity is reached, as observed here in the females with a history of chronic stress combined with chronic inflammation, these mechanisms become inaccessible and synaptic respiration is compromised possibly leading to eventual impaired neural function. Finally, females did not exhibit evidence of a proinflammatory neural environment as indicated by the cytokines assessed, despite evident peripheral effects of initial LPS exposure. This may be indicative of a hormone dependent uncoupling of inflammation and metabolism in the female brain, as compared to the male brain and should be a course of future study (Stekovic et al., 2017). It is also important to highlight that mitochondrial metrics are from synaptosomes isolated from an entire hemisphere of the brain and therefore are not region specific. This was necessary due to technique limitations in the isolation protocol at the time of data collection, however, future studies will utilize an improved synaptosomal isolation technique that was not developed until after the collection of this data set (Hubbard et al., 2019); therefore, future work will identify region specific changes following chronic stress and chronic inflammation.
Inflammatory function of males appears more labile and impacted than in females such that metabolic data show that chronic inflammation alone is enough to decrease synaptic respiration. Interestingly, this effect compounds in males with a history of stress suggesting that stress creates a more vulnerable respiratory neural environment to the effects of inflammation in males. We did not observe changes in physical characteristics of mitochondrial structure or synaptic enrichment in male samples which suggests that effects on respiration were the product of an overall decrease in mitochondrial function via a mechanism not directly related to mitochondrial health. Potential explanations for this phenomenon could lie in increased rate of mitophagy (Wang et al., 2019), androgen mediated crosstalk between the nucleus and mitochondria (Bajpai et al., 2019), or a decrease in the mitochondrial proton motive force in a mechanism not directly assessed through our analysis (Berry et al., 2018). Moreover, the null results in central ROMO1 expression data suggest that mitochondrial respiration differences are not due to altered levels of reactive oxygen species in the brain, but the elevated ROMO1 concentrations in the blood may implicate peripheral effects of reactive oxygen which were not detectable at the expression level in the brain.
Inflammation could be a source of altered synaptosomal mitochondria in males given that they display increased central and peripheral impacts of stress and chronic LPS exposure. Hippocampal expression of the pro-inflammatory cytokines TNF-α and IL-1ß were increased following chronic inflammation – an effect exacerbated by stress history on TNF-α levels. This is particularly remarkable because the last predatory stressor was eleven weeks prior to sample collection and the last LPS exposure was one week prior to collection. Males also showed an increase in pro- (IL-6, KC-GRO) and anti- (IL-5, IL-10) inflammatory peripheral cytokines at both the initial and final chronic injection of LPS. These effects are to be expected, as an initial immune challenge promotes the production and circulation of systemic inflammation in response to a challenge (Couper et al., 2008; Deslauriers et al., 2017; Pacholko et al., 2019; Pripp and Stanišić, 2014). However, the observed differences at the terminal endpoint suggest a more sustained impact on inflammatory regulation following chronic stress and chronic inflammation. Furthermore, inflammation-related effects may be related to glial responses as stress activates hippocampal glial cells, priming a pro-inflammatory response to inflammatory stimuli (Frank et al., 2007; Kreisel et al., 2014). Stress-induced, glial-driven cell death is further exacerbated with an acute immune challenge (De Pablos et al., 2014, 2006) and impairs cognitive performance even after cessation of LPS administration for 30 days (Hauss-Wegrzyniak et al., 2000, 1998). Activated microglia will release pro-inflammatory molecules like ROS and cytokines that lead to neurotoxicity, driving synaptic deficits (Cunningham, 2013). As microglia play a significant role in the tripartite synapse, understanding the contribution of these cells to the changes in neuronal synaptic respiration observed here will be an essential course of future study. Taken together, these data suggest that males are susceptible to the effects of chronic inflammation and that a history of stress exacerbates this vulnerability at the level of whole brain synaptic respiration and the pro-inflammatory response.
Our results provide evidence that chronic repeated predation stress beginning in adolescence is sufficient to produce an anxiety-like phenotype, independent of sex, that is observable long after removal from the stressful environment. Accompanying this anxiety-like phenotype, we observed sex-specific changes in mitochondrial bioenergetics that highlight a potential mechanism by which stress and inflammation, either alone or together, can modify synaptic function. These data further support the considerable evidence that males are more susceptible to the negative effects of chronic inflammation than females and that females require compounded insults before inflammation-mediated deficits manifest. Our results expand the growing knowledge relating to the interplay of stress, inflammation, and sex and promote mitochondrial modulation as a bridging factor between chronic stress, chronic inflammation, and neuronal dysfunction. Future research is needed to uncover the specific mitochondrial components, the impact of altered respiration on synaptic function, relevant compensatory pathways, and neuron-glia interactions that may give rise to the sex-specific effects observed in this study.
Supplementary Material
A life history of chronic predatory stress increases synaptosomal respiration in females.
A life history of chronic inflammation increases synaptosomal respiration in females.
A history of stress and inflammation impairs synaptosomal respiration in females.
Male synaptosome respiration is sensitive to combined stress and chronic inflammation.
Chronic stress produces physical changes and increased TNFα months after stress.
Acknowledgements
Microscopy was performed at the VCU Microscopy Facility, supported, in part, by funding from NIH-NCI Cancer Center Support Grant P30 CA016059. Primary research funded by Alzheimer’s Research Supplement to NINR R014886.
Footnotes
Publisher's Disclaimer: This is a PDF file of an unedited manuscript that has been accepted for publication. As a service to our customers we are providing this early version of the manuscript. The manuscript will undergo copyediting, typesetting, and review of the resulting proof before it is published in its final form. Please note that during the production process errors may be discovered which could affect the content, and all legal disclaimers that apply to the journal pertain.
References
- Adiele RC, Adiele CA, 2019. Metabolic defects in multiple sclerosis. Mitochondrion 44, 7–14. 10.1016/j.mito.2017.12.005 [DOI] [PubMed] [Google Scholar]
- Allen J, Romay-Tallon R, Brymer KJ, Caruncho HJ, Kalynchuk LE, 2018. Mitochondria and mood: Mitochondrial dysfunction as a key player in the manifestation of depression. Front. Neurosci 12, 386. 10.3389/fnins.2018.00386 [DOI] [PMC free article] [PubMed] [Google Scholar]
- Bajpai P, Koc E, Sonpavde G, Singh R, Singh KK, 2019. Mitochondrial localization, import, and mitochondrial function of the androgen receptor. J. Biol. Chem 294, 6621–6634. 10.1074/jbc.ra118.006727 [DOI] [PMC free article] [PubMed] [Google Scholar]
- Barnum CJ, Pace TWW, Hu F, Neigh GN, Tansey MG, 2012. Psychological stress in adolescent and adult mice increases neuroinflammation and attenuates the response to LPS challenge. J. Neuroinflammation 9. 10.1186/1742-2094-9-9 [DOI] [PMC free article] [PubMed] [Google Scholar]
- Bekhbat M, Howell PA, Rowson SA, Kelly SD, Tansey MG, Neigh GN, 2019. Chronic adolescent stress sex-specifically alters central and peripheral neuro-immune reactivity in rats. Brain. Behav. Immun 76, 248–257. 10.1016/j.bbi.2018.12.005 [DOI] [PMC free article] [PubMed] [Google Scholar]
- Berry BJ, Trewin AJ, Amitrano AM, Kim M, Wojtovich AP, 2018. Use the Protonmotive Force: Mitochondrial Uncoupling and Reactive Oxygen Species. J. Mol. Biol 10.1016/j.jmb.2018.03.025 [DOI] [PMC free article] [PubMed]
- Bonanni L, Franciotti R, Martinotti G, Vellante F, Flacco ME, Di Giannantonio M, Thomas A, Onofrj M, 2018. Post traumatic stress disorder heralding the onset of semantic frontotemporal dementia. J. Alzheimer’s Dis 10.3233/JAD-171134 [DOI] [PMC free article] [PubMed]
- Bouayed J, Rammal H, Soulimani R, 2009. Oxidative stress and anxiety Relationship and cellular pathways. Oxid. Med. Cell. Longev 2, 63–67. 10.4161/oxim.2.2.7944 [DOI] [PMC free article] [PubMed] [Google Scholar]
- Bourke CH, Raees MQ, Malviya S, Bradburn CA, Binder EB, Neigh GN, 2013. Glucocorticoid sensitizers Bag1 and Ppid are regulated by adolescent stress in a sex-dependent manner. Psychoneuroendocrinology 38, 84–93. 10.1016/j.psyneuen.2012.05.001 [DOI] [PMC free article] [PubMed] [Google Scholar]
- Burgado J, Harrell CS, Eacret D, Reddy R, Barnum CJ, Tansey MG, Miller AH, Wang H, Neigh GN, 2014. Two weeks of predatory stress induces anxiety-like behavior with co-morbid depressive-like behavior in adult male mice. Behav. Brain Res 275, 120–125. 10.1016/j.bbr.2014.08.060 [DOI] [PMC free article] [PubMed] [Google Scholar]
- Carola V, D’Olimpio F, Brunamonti E, Mangia F, Renzi P, 2002. Evaluation of the elevated plus-maze and open-field tests for the assessment of anxiety-related behaviour in inbred mice. Behav. Brain Res 134, 49–57. 10.1016/S0166-4328(01)00452-1 [DOI] [PubMed] [Google Scholar]
- Cheng J, Nanayakkara G, Shao Y, Cueto R, Wang L, Yang WY, Tian Y, Wang H, Yang X, 2017. Mitochondrial proton leak plays a critical role in pathogenesis of cardiovascular diseases. Adv. Exp. Med. Biol 982, 359–370. 10.1007/978-3-319-55330-6_20 [DOI] [PMC free article] [PubMed] [Google Scholar]
- Choi SW, Gerencser AA, Nicholls DG, 2009. Bioenergetic analysis of isolated cerebrocortical nerve terminals on a microgram scale: Spare respiratory capacity and stochastic mitochondrial failure. J. Neurochem 109, 1179–1191. 10.1111/j.1471-4159.2009.06055.x [DOI] [PMC free article] [PubMed] [Google Scholar]
- Choleris E, Thomas AW, Kavaliers M, Prato FS, 2001. A detailed ethological analysis of the mouse open field test: Effects of diazepam, chlordiazepoxide and an extremely low frequency pulsed magnetic field. Neurosci. Biobehav. Rev 25, 235–260. 10.1016/S0149-7634(01)00011-2 [DOI] [PubMed] [Google Scholar]
- Clark KC, Sword BA, Dupree JL, 2017. Oxidative Stress Induces Disruption of the Axon Initial Segment. ASN Neuro 9, 1759091417745426. 10.1177/1759091417745426 [DOI] [PMC free article] [PubMed] [Google Scholar]
- Clouston SAP, Diminich ED, Kotov R, Pietrzak RH, Richards M, Spiro A, Deri Y, Carr M, Yang X, Gandy S, Sano M, Bromet EJ, Luft BJ, 2019. Incidence of mild cognitive impairment in World Trade Center responders: Long-term consequences of re-experiencing the events on 9/11/2001. Alzheimer’s Dement. Diagnosis, Assess. Dis. Monit 10.1016/j.dadm.2019.07.006 [DOI] [PMC free article] [PubMed]
- Couper KN, Blount DG, Riley EM, 2008. IL-10: The Master Regulator of Immunity to Infection. J. Immunol 180, 5771–5777. 10.4049/jimmunol.180.9.5771 [DOI] [PubMed] [Google Scholar]
- Cunningham C, 2013. Microglia and neurodegeneration: The role of systemic inflammation. Glia 61, 71–90. 10.1002/glia.22350 [DOI] [PubMed] [Google Scholar]
- De Pablos RM, Herrera AJ, Espinosa-Oliva AM, Sarmiento M, Muñoz MF, Machado A, Venero JL, 2014. Chronic stress enhances microglia activation and exacerbates death of nigral dopaminergic neurons under conditions of inflammation. J. Neuroinflammation 11, 34. 10.1186/1742-2094-11-34 [DOI] [PMC free article] [PubMed] [Google Scholar]
- De Pablos RM, Villarán RF, Argüelles S, Herrera AJ, Venero JL, Ayala A, Cano J, Machado A, 2006. Stress increases vulnerability to inflammation in the rat prefrontal cortex. J. Neurosci 26, 5709–5719. 10.1523/JNEUROSCI.0802-06.2006 [DOI] [PMC free article] [PubMed] [Google Scholar]
- Deslauriers J, van Wijngaarde M, Geyer MA, Powell S, Risbrough VB, 2017. Effects of LPS-induced immune activation prior to trauma exposure on PTSD-like symptoms in mice. Behav. Brain Res 323, 117–123. 10.1016/j.bbr.2017.01.048 [DOI] [PMC free article] [PubMed] [Google Scholar]
- Desmarais P, Weidman D, Wassef A, Bruneau M-A, Friedland J, Bajsarowicz P, Thibodeau M-P, Herrmann N, Nguyen QD, 2020. The Interplay Between Post-traumatic Stress Disorder and Dementia: A Systematic Review. Am. J. Geriatr. Psychiatry 28, 48–60. 10.1016/J.JAGP.2019.08.006 [DOI] [PubMed] [Google Scholar]
- Dunkley PR, Jarvie PE, Robinson PJ, 2008. A rapid percoll gradient procedure for preparation of synaptosomes. Nat. Protoc 3, 1718–1728. 10.1038/nprot.2008.171 [DOI] [PubMed] [Google Scholar]
- Fanelli G, Benedetti F, Wang SM, Lee SJ, Jun TY, Masand PS, Patkar AA, Han C, Serretti A, Pae CU, Fabbri C, 2019. Reduced CXCL1/GRO chemokine plasma levels are a possible biomarker of elderly depression. J. Affect. Disord 249, 410–417. 10.1016/j.jad.2019.02.042 [DOI] [PubMed] [Google Scholar]
- Fang C, Bourdette D, Banker G, 2012. Oxidative stress inhibits axonal transport: Implications for neurodegenerative diseases. Mol. Neurodegener 7, 29. 10.1186/1750-1326-7-29 [DOI] [PMC free article] [PubMed] [Google Scholar]
- Ferretti MT, Iulita MF, Cavedo E, Chiesa PA, Dimech AS, Chadha AS, Baracchi F, Girouard H, Misoch S, Giacobini E, Depypere H, Hampel H, 2018. Sex differences in Alzheimer disease — The gateway to precision medicine. Nat. Rev. Neurol 10.1038/s41582-018-0032-9 [DOI] [PubMed]
- Flameng W, Borgers M, Daenen W, Stalpaert G, 1980. Ultrastructural and cytochemical correlates of myocardial protection by cardiac hypothermia in man. J. Thorac. Cardiovasc. Surg 79, 413–424. [PubMed] [Google Scholar]
- Frank MG, Baratta MV, Sprunger DB, Watkins LR, Maier SF, 2007. Microglia serve as a neuroimmune substrate for stress-induced potentiation of CNS pro-inflammatory cytokine responses. Brain. Behav. Immun 21, 47–59. 10.1016/j.bbi.2006.03.005 [DOI] [PubMed] [Google Scholar]
- Green BL, Goodman LA, Krupnick JL, Corcoran CB, Petty RM, Stockton P, Stern NM, 2000. Outcomes of single versus multiple trauma exposure in a screening sample. J. Trauma. Stress 10.1023/A:1007758711939 [DOI] [PubMed]
- Hauss-Wegrzyniak B, Dobrzanski P, Stoehr JD, Wenk GL, 1998. Chronic neuroinflammation in rats reproduces components of the neurobiology of Alzheimer’s disease. Brain Res 780, 294–303. 10.1016/S0006-8993(97)01215-8 [DOI] [PubMed] [Google Scholar]
- Hauss-Wegrzyniak B, Vraniak PD, Wenk GL, 2000. LPS-induced neuroinflammatory effects do not recover with time. Neuroreport 11, 1759–1763. 10.1097/00001756-200006050-00032 [DOI] [PubMed] [Google Scholar]
- Hawong HY, Patterson JR, Winner BM, Goudreau JL, Lookingland KJ, 2015. Comparison of the structure, function and autophagic maintenance of mitochondria in nigrostriatal and tuberoinfundibular dopamine neurons. Brain Res 1622, 240–251. 10.1016/j.brainres.2015.06.030 [DOI] [PMC free article] [PubMed] [Google Scholar]
- Hubbard WB, Harwood CL, Prajapati P, Springer JE, Saatman KE, Sullivan PG, 2019. Fractionated mitochondrial magnetic separation for isolation of synaptic mitochondria from brain tissue. Sci. Rep 10.1038/s41598-019-45568-3 [DOI] [PMC free article] [PubMed]
- Hunter RG, Seligsohn M, Rubin TG, Griffiths BB, Ozdemir Y, Pfaff DW, Datson NA, McEwen BS, 2016. Stress and corticosteroids regulate rat hippocampal mitochondrial DNA gene expression via the glucocorticoid receptor. Proc. Natl. Acad. Sci. U. S. A 113, 9099–9104. 10.1073/pnas.1602185113 [DOI] [PMC free article] [PubMed] [Google Scholar]
- Kessler RC, Sonnega A, Bromet E, Hughes M, Nelson CB, 1995. Posttraumatic Stress Disorder in the National Comorbidity Survey. Arch. Gen. Psychiatry 10.1001/archpsyc.1995.03950240066012 [DOI] [PubMed]
- Khalifa ARM, Abdel-Rahman EA, Mahmoud AM, Ali MH, Noureldin M, Saber SH, Mohsen M, Ali SS, 2017. Sex-specific differences in mitochondria biogenesis, morphology, respiratory function, and ROS homeostasis in young mouse heart and brain. Physiol. Rep 5, e13125. 10.14814/phy2.13125 [DOI] [PMC free article] [PubMed] [Google Scholar]
- Krauss S, Zhang CY, Lowell BB, 2002. A significant portion of mitochondrial proton leak in intact thymocytes depends on expression of UCP2. Proc. Natl. Acad. Sci. U. S. A 99, 118–122. 10.1073/pnas.012410699 [DOI] [PMC free article] [PubMed] [Google Scholar]
- Kreisel T, Frank MG, Licht T, Reshef R, Ben-Menachem-Zidon O, Baratta MV, Maier SF, Yirmiya R, 2014. Dynamic microglial alterations underlie stress-induced depressive-like behavior and suppressed neurogenesis. Mol. Psychiatry 19, 699–709. 10.1038/mp.2013.155 [DOI] [PubMed] [Google Scholar]
- Lapp HE, Bartlett AA, Hunter RG, 2019. Stress and glucocorticoid receptor regulation of mitochondrial gene expression. J. Mol. Endocrinol 62, R121–R128. 10.1530/JME-18-0152 [DOI] [PubMed] [Google Scholar]
- Li H. Bin, Yue ZD, Zhao HW, Wang L, Fan ZH, He FL, Dong XQ, Liu FQ, 2018. Pathological features of mitochondrial ultrastructure predict susceptibility to post-tips hepatic encephalopathy. Can. J. Gastroenterol. Hepatol 2018. 10.1155/2018/4671590 [DOI] [PMC free article] [PubMed] [Google Scholar]
- Lihua M, Tao Z, Hongbin M, Hui W, Caihong J, Xiaolian J, 2020. Metabolic syndrome risk in relation to posttraumatic stress disorder among trauma-exposed civilians in Gansu Province, China. Med. (United States) 10.1097/MD.0000000000018614 [DOI] [PMC free article] [PubMed]
- Macdonald A, Danielson CK, Resnick HS, Saunders BE, Kilpatrick DG, 2010. PTSD and comorbid disorders in a representative sample of adolescents: The risk associated with multiple exposures to potentially traumatic events. Child Abus. Negl 10.1016/j.chiabu.2010.03.006 [DOI] [PubMed]
- Mellon SH, Bersani FS, Lindqvist D, Hammamieh R, Donohue D, Dean K, Jett M, Yehuda R, Flory J, Reus VI, Bierer LM, Makotkine I, Amara DA, Haase CH, Coy M III, F.J.D., Marmar C, Wolkowitz OM, 2019. Metabolomic analysis of male combat veterans with post traumatic stress disorder. PLoS One 14, e0213839. 10.1371/JOURNAL.PONE.0213839 [DOI] [PMC free article] [PubMed] [Google Scholar]
- Michopoulos V, Powers A, Gillespie CF, Ressler KJ, Jovanovic T, 2017. Inflammation in Fear-and Anxiety-Based Disorders: PTSD, GAD, and beyond. Neuropsychopharmacology 10.1038/npp.2016.146 [DOI] [PMC free article] [PubMed]
- Neigh GN, Ali FF, 2016. Co-morbidity of PTSD and immune system dysfunction: opportunities for treatment. Curr. Opin. Pharmacol 10.1016/j.coph.2016.07.011 [DOI] [PMC free article] [PubMed]
- Pacholko AG, Wotton CA, Bekar LK, 2019. Poor Diet, Stress, and Inactivity Converge to Form a “Perfect Storm” That Drives Alzheimer’s Disease Pathogenesis. Neurodegener. Dis 1–18. 10.1159/000503451 [DOI] [PubMed]
- Pathak D, Shields LY, Mendelsohn BA, Haddad D, Lin W, Gerencser AA, Kim H, Brand MD, Edwards RH, Nakamura K, 2015. The role of mitochondrially derived ATP in synaptic vesicle recycling. J. Biol. Chem 290, 22325–22336. 10.1074/jbc.M115.656405 [DOI] [PMC free article] [PubMed] [Google Scholar]
- Picard M, McEwen BS, Epel ES, Sandi C, 2018. An energetic view of stress: Focus on mitochondria. Front. Neuroendocrinol 10.1016/j.yfrne.2018.01.001 [DOI] [PMC free article] [PubMed]
- Preston G, Kirdar F, Kozicz T, 2018. The role of suboptimal mitochondrial function in vulnerability to post-traumatic stress disorder. J. Inherit. Metab. Dis 10.1007/s10545-018-0168-1 [DOI] [PubMed]
- Pripp AH, Stanišić M, 2014. The correlation between pro- and anti-inflammatory cytokines in chronic subdural hematoma patients assessed with factor analysis. PLoS One 9, e90149. 10.1371/journal.pone.0090149 [DOI] [PMC free article] [PubMed] [Google Scholar]
- Prut L, Belzung C, 2003. The open field as a paradigm to measure the effects of drugs on anxiety-like behaviors: A review. Eur. J. Pharmacol 10.1016/S0014-2999(03)01272-X [DOI] [PubMed]
- Pyter LM, Kelly SD, Harrell CS, Neigh GN, 2013. Sex differences in the effects of adolescent stress on adult brain inflammatory markers in rats. Brain. Behav. Immun 30, 88–94. 10.1016/j.bbi.2013.01.075 [DOI] [PMC free article] [PubMed] [Google Scholar]
- Rangaraju V, Calloway N, Ryan TA, 2014. Activity-driven local ATP synthesis is required for synaptic function. Cell 156, 825–835. 10.1016/j.cell.2013.12.042 [DOI] [PMC free article] [PubMed] [Google Scholar]
- Richter-Levin G, Stork O, Schmidt MV, 2019. Animal models of PTSD: a challenge to be met. Mol. Psychiatry 10.1038/s41380-018-0272-5 [DOI] [PMC free article] [PubMed]
- Rose S, Frye RE, Slattery J, Wynne R, Tippett M, Melnyk S, James SJ, 2014. Oxidative stress induces mitochondrial dysfunction in a subset of autistic lymphoblastoid cell lines. Transl. Psychiatry 10.1038/tp.2014.15 [DOI] [PMC free article] [PubMed]
- Salim S, 2016. Oxidative stress: a potential link between emotional wellbeing and immune response. Curr. Opin. Pharmacol 10.1016/j.coph.2016.06.006 [DOI] [PubMed]
- Salim S, 2014. Oxidative Stress and Psychological Disorders. Curr. Neuropharmacol 12, 140–147. 10.2174/1570159x11666131120230309 [DOI] [PMC free article] [PubMed] [Google Scholar]
- Seo C, Guru A, Jin M, Ito B, Sleezer BJ, Ho YY, Wang E, Boada C, Krupa NA, Kullakanda DS, Shen CX, Warden MR, 2019. Intense threat switches dorsal raphe serotonin neurons to a paradoxical operational mode. Science (80-. ) 10.1126/science.aau8722 [DOI] [PMC free article] [PubMed]
- Seo JH, Park HS, Park SS, Kim CJ, Kim DH, Kim TW, 2019. Physical exercise ameliorates psychiatric disorders and cognitive dysfunctions by hippocampal mitochondrial function and neuroplasticity in post-traumatic stress disorder. Exp. Neurol 322. 10.1016/j.expneurol.2019.113043 [DOI] [PubMed] [Google Scholar]
- Shalev AY, 2009. Posttraumatic Stress Disorder and Stress-Related Disorders. Psychiatr. Clin. North Am 10.1016/j.psc.2009.06.001 [DOI] [PMC free article] [PubMed]
- Shaw GA, Bent MAM, Council KR, Pais AC, Amstadter A, Wolstenholme JT, Miles MF, Neigh GN, 2020. Chronic repeated predatory stress induces resistance to quinine adulteration of ethanol in male mice. Behav. Brain Res 382, 112500. 10.1016/J.BBR.2020.112500 [DOI] [PMC free article] [PubMed] [Google Scholar]
- Smaga I, Niedzielska E, Gawlik M, Moniczewski A, Krzek J, Przegaliński E, Pera J, Filip M, 2015. Oxidative stress as an etiological factor and a potential treatment target of psychiatric disorders. Part 2. Depression, anxiety, schizophrenia and autism. Pharmacol. Reports 67, 569–580. 10.1016/j.pharep.2014.12.015 [DOI] [PubMed] [Google Scholar]
- Smith HL, Bourne JN, Cao G, Chirillo MA, Ostroff LE, Watson DJ, Harris KM, 2016. Mitochondrial support of persistent presynaptic vesicle mobilization with age-dependent synaptic growth after LTP. Elife 5, e15275. 10.7554/eLife.15275 [DOI] [PMC free article] [PubMed] [Google Scholar]
- Stekovic S, Ruckenstuhl C, Royer P, Winkler-Hermaden C, Carmona-Gutierrez D, Fröhlich K-U, Kroemer G, Madeo F, 2017. The neuroprotective steroid progesterone promotes mitochondrial uncoupling, reduces cytosolic calcium and augments stress resistance in yeast cells. Microb. Cell 4, 191–199. 10.15698/mic2017.06.577 [DOI] [PMC free article] [PubMed] [Google Scholar]
- Turkson S, Kloster A, Hamilton PJ, Neigh GN, 2019. Neuroendocrine drivers of risk and resilience: The influence of metabolism & mitochondria. Front. Neuroendocrinol 54, 100770. 10.1016/j.yfrne.2019.100770 [DOI] [PMC free article] [PubMed] [Google Scholar]
- Van Der Kolk BA, 1985. Adolescent Vulnerability to Posttraumatic Stress Disorder. Psychiatry (New York) 10.1521/00332747.1985.11024297 [DOI] [PubMed]
- Wang Y, Liu N, Lu B, 2019. Mechanisms and roles of mitophagy in neurodegenerative diseases. CNS Neurosci. Ther 10.1111/cns.13140 [DOI] [PMC free article] [PubMed]
- Zoladz PR, Eisenmann ED, Rose RM, Kohls BA, Johnson BL, Robinson KL, Heikkila ME, Mucher KE, Huntley MR, 2018. Predator-based psychosocial stress model of PTSD differentially influences voluntary ethanol consumption depending on methodology. Alcohol 70, 33–41. 10.1016/j.alcohol.2018.01.004 [DOI] [PubMed] [Google Scholar]
- Zoladz PR, Fleshner M, Diamond DM, 2012. Psychosocial animal model of PTSD produces a long-lasting traumatic memory, an increase in general anxiety and PTSD-like glucocorticoid abnormalities. Psychoneuroendocrinology 37, 1531–1545. 10.1016/j.psyneuen.2012.02.007 [DOI] [PubMed] [Google Scholar]
Associated Data
This section collects any data citations, data availability statements, or supplementary materials included in this article.