. 2022 Jul 29;11:e77215. doi: 10.7554/eLife.77215

Figure 2. Asymmetry of functional gradients in humans and its heritability.

(a) Mean asymmetry index (AI) of intra- and inter-hemispheric patterns in humans. Red and blue indicate rightward and leftward asymmetry respectively. (b) FDR correction for the P values of AI shown in A; (c) Violin plots of mean AI network loading across individuals (n=1014), with median, 25%-75%, and distribution at 25/75% -/+1.5 interquartile range. Networks are ranked from leftward (language) to rightward asymmetry (frontoparietal) along the intra-hemispheric principal gradient.

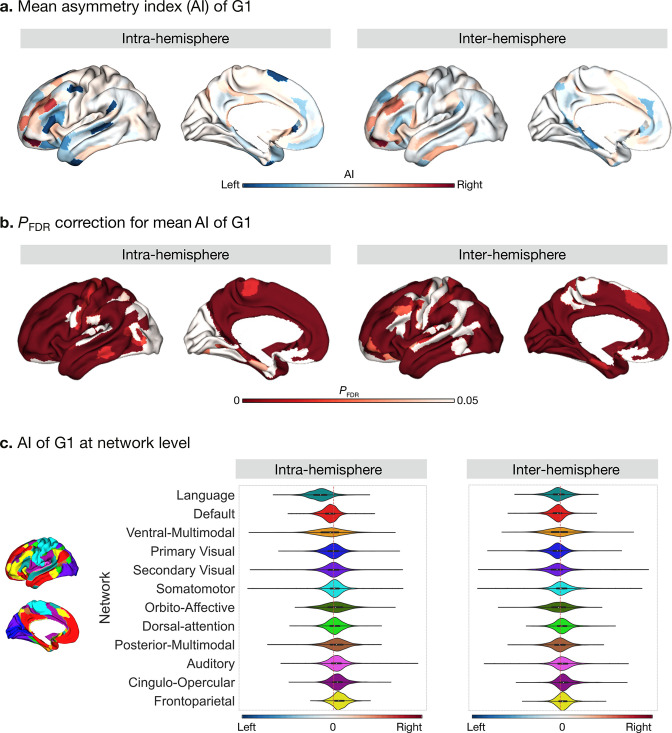
Figure 2.

Figure 2—figure supplement 1. FC profiles of the most asymmetric parcel (No.25: Peri-Sylvian language area).

Figure 2—figure supplement 1.

The upper panel is LL versus RR, and the lower panel is LR versus RL as well as their difference in connectivity (right panel), blue and red reflect leftward and rightward FC.
Figure 2—figure supplement 2. Cohen’s d maps of G1 asymmetry in humans.

Figure 2—figure supplement 2.

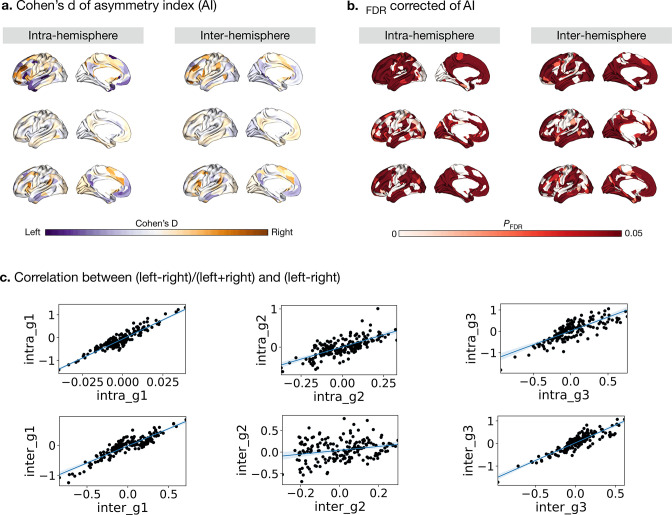
Figure 2—figure supplement 3. Cohen’s d (yellow-purple) and PFDR (red) of asymmetry index with (left-right)/(left +right).

Figure 2—figure supplement 3.

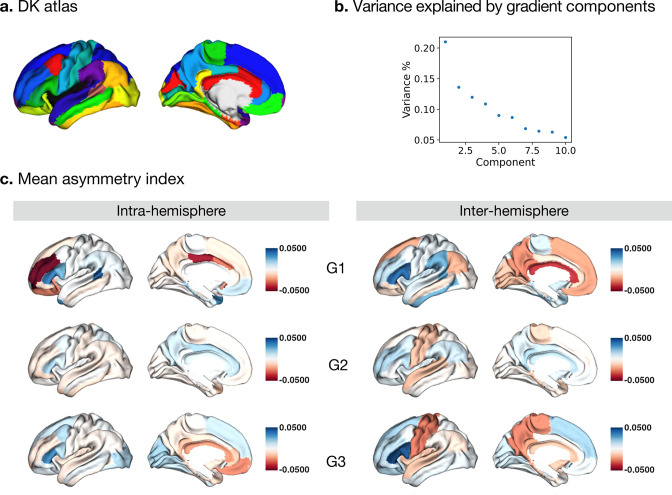
Figure 2—figure supplement 4. Asymmetry using Desikan-Killiany (DK) atlas.

Figure 2—figure supplement 4.

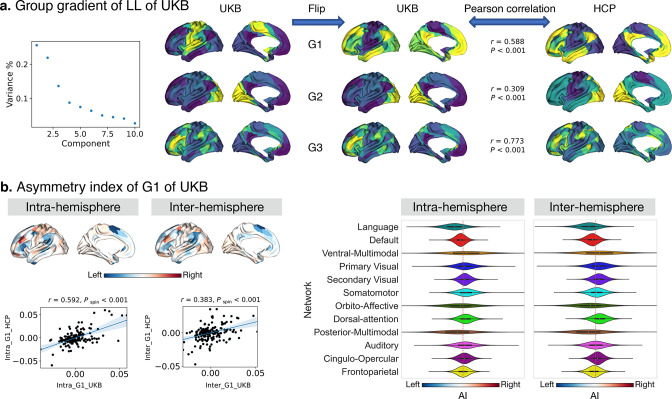
Figure 2—figure supplement 5. Asymmetry using UK Biobank sample (n=34,830).

Figure 2—figure supplement 5.

Figure 2—figure supplement 6. Vertex-wise asymmetry along G1.

Figure 2—figure supplement 6.

To test the vertex-wise asymmetry, we randomly chose 100 subjects and used the vertex-wise FC gradients to calculate the asymmetry.
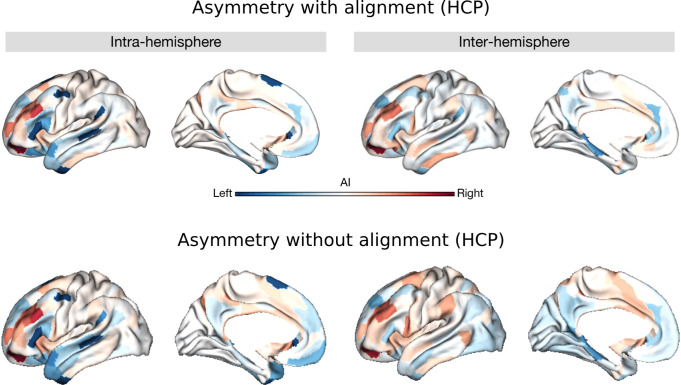
Figure 2—figure supplement 7. Asymmetry of functional gradients using HCP.

Figure 2—figure supplement 7.

Upper panel is the map with Procrustes alignment (main findings). Lower panel is the map without alignment. Blue color indicates the leftward asymmetry and red color indicates the rightward asymmetry.
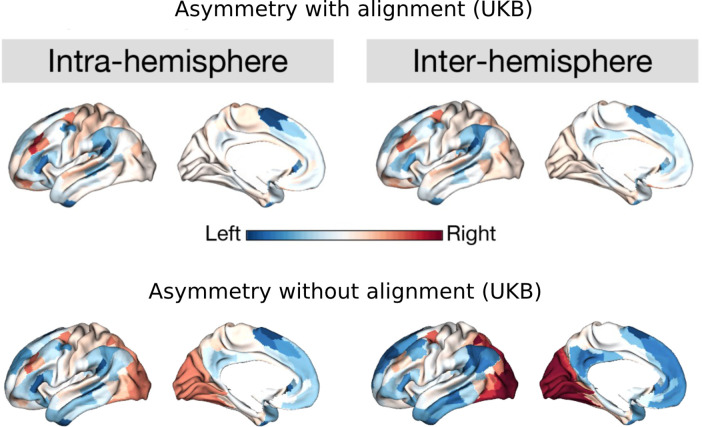
Figure 2—figure supplement 8. Asymmetry of functional gradients using UKB.

Figure 2—figure supplement 8.

Upper panel is the map with Procrustes alignment (main findings). Lower panel is the map without alignment. Blue color indicates the leftward asymmetry and red color indicates the rightward asymmetry.
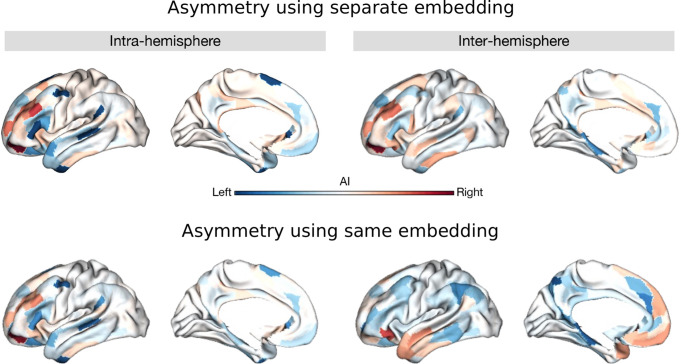
Figure 2—figure supplement 9. Asymmetry using LL_RR and LR_RL patterns in the same models instead of separate models.

Figure 2—figure supplement 9.

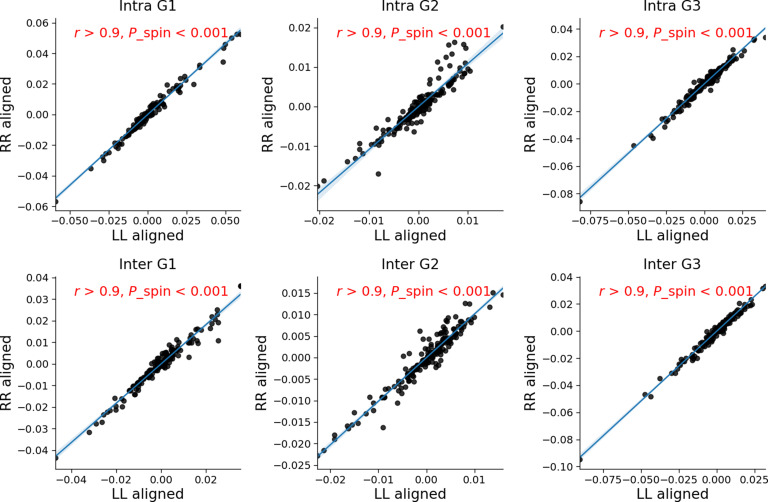
Figure 2—figure supplement 10. Correlations between LL aligned gradients asymmetry and RR aligned gradients asymmetry.

Figure 2—figure supplement 10.