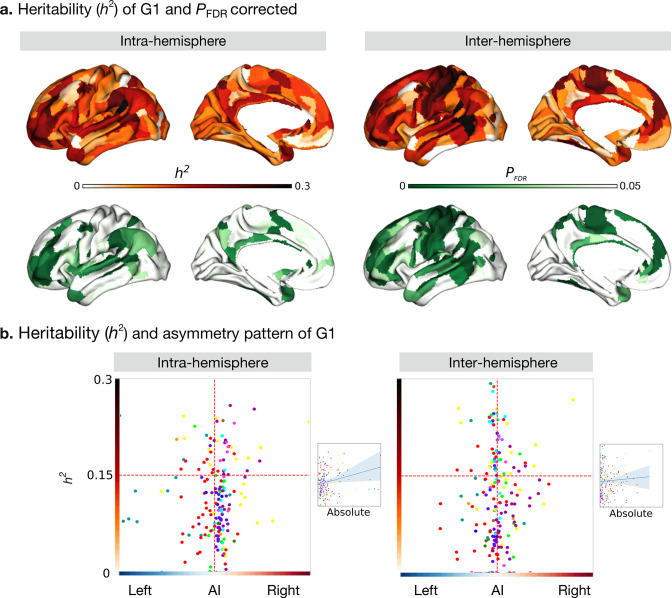
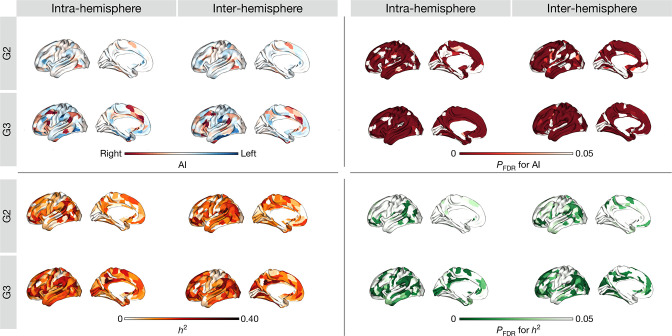
Figure 3. Heritability of asymmetry of functional G1.
(a) Heritability (orange colorbar) and p values after FDR correction (green colorbar). (b) Scatter plot of heritability and AI scores. The x- and y-axes are the mean asymmetry index and heritability, respectively. Dots represent parcels and are colored according to CA networks. The small scatter plots with a regression line are the corresponding absolute mean asymmetry index (x-axis) and heritability (y-axis).


