eLife logoLink to eLife
. 2022 Aug 16;11:e69626. doi: 10.7554/eLife.69626

Inhibition of itch by neurokinin 1 receptor (Tacr1) -expressing ON cells in the rostral ventromedial medulla in mice

Taylor Follansbee 1,2,, Dan Domocos 3, Eileen Nguyen 4, Amanda Nguyen 1, Aristea Bountouvas 1, Lauren Velasquez 1, Mirela Iodi Carstens 1, Keiko Takanami 5, Sarah E Ross 4, Earl Carstens 1
Editors: Rohini Kuner6, Kate M Wassum7
PMCID: PMC9381038  PMID: 35972457

Abstract

The rostral ventromedial medulla (RVM) is important in descending modulation of spinal nociceptive transmission, but it is unclear if the RVM also modulates spinal pruriceptive transmission. RVM ON cells are activated by noxious algesic and pruritic stimuli and are pronociceptive. Many RVM-spinal projection neurons express the neurokinin-1 receptor (Tacr1), and ON-cells are excited by local administration of substance P (SP). We hypothesized that Tacr1-expressing RVM ON cells exert an inhibitory effect on itch opposite to their pronociceptive action. Intramedullary microinjection of SP significantly potentiated RVM ON cells and reduced pruritogen-evoked scratching while producing mild mechanical sensitization. Chemogenetic activation of RVM Tacr1-expressing RVM neurons also reduced acute pruritogen-evoked scratching. Optotagging experiments confirmed RVM Tacr1-expressing neurons to be ON cells. We conclude that Tacr1-expressing ON cells in RVM play a significant role in the modulation of pruriceptive transmission.

Research organism: Mouse

Introduction

The transmission of somatosensory information in the spinal cord is under top-down modulation and has been extensively studied in the context of pain signaling. Descending modulation of pain is reflected by phenomena such as expectation (placebo and nocebo), diffuse noxious inhibitory control (DNIC), and conditioned pain modulation (CPM) (Bartels et al., 2018; Chebbi et al., 2014; Damien et al., 2018; Le Bars, 2002; Lockwood and Dickenson, 2020). Descending modulation is also thought to underlie stress mediated changes in pain threshold, with acute stress inhibiting and chronic stress facilitating nociceptive transmission (Butler and Finn, 2009; Fields, 2000; Jennings et al., 2014; Wager and Atlas, 2015). Recent studies indicate that the spinal transmission of pruriceptive information is also under descending modulatory influences, but it is not known whether itch is modulated in the same way as pain (Agostinelli and Bassuk, 2021; Gao et al., 2021; Gao et al., 2019; Koga et al., 2020; Liu et al., 2019; Samineni et al., 2019; Wu et al., 2021).

The rostral ventromedial medulla (RVM) contains neurons with descending projections to the spinal cord which bidirectionally modulate spinal nociceptive transmission (Fields, 2000; Fields and Basbaum, 1978; Fields and Heinricher, 1985; Heinricher et al., 2009; Millan, 2002; Ossipov et al., 2014). RVM ON cells are excited and OFF cells are inhibited by noxious stimulation just prior to a nocifensive withdrawal reflex, and respectively facilitate and inhibit spinal nociceptive transmission (Fields, 2004; Fields et al., 1983). Increased ON cell and decreased OFF cell firing are thought to contribute to the chronification of pain (Ossipov et al., 2014). Neutral cells do not exhibit any significant response to noxious stimulation (Barbaro et al., 1986). Many RVM neurons project to the spinal cord via the dorsolateral funiculus (DLF), terminating in layers I, II, and V, and are implicated in the analgesic effects of opioids. It is still unknown whether the RVM ON and OFF cells are involved in the modulation of itch transmission.

A recent study reported that neurons in the periaqueductal gray (PAG) expressing Tac1, the gene for substance P (SP), project to and make an excitatory glutamatergic connection with neurons in the RVM (Gao et al., 2019). Activation of these PAG neurons promotes scratching. A population of GABAergic neurons originating in the RVM synapse onto spinal neurons that express the gastrin releasing peptide receptor (GRPR) (Liu et al., 2019), which are considered to be essential for spinal pruriceptive transmission (Sun and Chen, 2007). Activation of GABAergic and inhibition of glutamatergic neurons in PAG reduced scratching behavior in both acute and chronic itch conditions (Samineni et al., 2019). Furthermore, pruritogens were shown to excite ON and inhibit OFF cells (Follansbee et al., 2018). Cervical cold block, which diminishes activity in descending modulatory pathways, decreased pruritogen-evoked activity and facilitated algogen-evoked activity of spinal cord neurons implying opposing effects of descending modulatory pathways on nociceptive and pruriceptive transmission (Carstens et al., 2018). The current evidence suggests that at least two classes of PAG neurons, via connections to RVM cells, exert bimodal effects on the spinal pain and itch signaling pathways. Since activation of PAG tac1r neurons facilitates itch this implies that activation of RVM Tacr1-expressing neurons may likewise facilitate itch. However, RVM ON cells are known to facilitate pain, and thus may have an opposing effect on itch transmission.

Here we investigated the role of Tacr1-expressing RVM neurons in itch modulation. In the present study, we used pharmacological and opto/chemogenetic methods to selectively activate RVM Tacr1-expressing cells, which we hypothesize represent a population of RVM ON cells, and assessed the effects on pruritogen-evoked scratching, and thermal and mechanical nociceptive behavior. When RVM Tacr1-expressings cells were activated, we observed that itch related behaviors were inhibited, while producing mild mechanical sensitization. We used optotagging to characterize these RVM Tacr1-expressing neurons as RVM ON cells. These results are the first to demonstrate an inhibitory effect of RVM ON cells on itch transmission, contrary to their known pronociceptive function.

Results

SP enhances RVM ON-cell responses to pinch

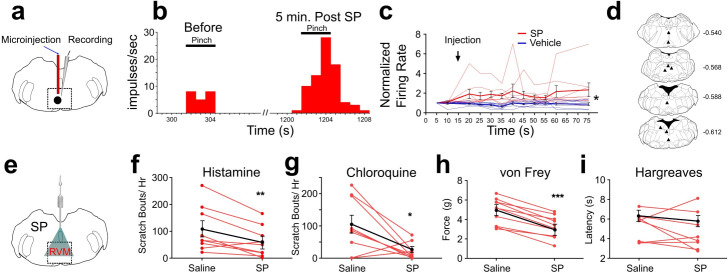
In rats, responses of RVM ON cells were potentiated by intramedullary microinjection of the Tacr1 agonist SP (Budai et al., 2007) and we wished to determine whether this is true in mouse. We identified RVM ON cells using in vivo extracellular electrophysiological recordings, with the criterion that noxious pinch elicited a >30% increase in firing that preceded the onset of the hindpaw withdrawal. Using a microinjection cannula attached to a recording microelectrode (Figure 1A), SP or saline was microinjected while recording from an ON cell in anesthetized mice. Microinjection of SP potentiated pinch-evoked responses (Figure 1B). Following SP microinjection, normalized responses of ON cells to repeated pinch stimuli were significantly increased (Figure 1C). The enhancement of responses lasted >1 hr. Histologically recovered recording sites were located within the RVM and adjacent regions of the medullary reticular formation (Figure 1D). These results show that, similar to rats, RVM ON cells in the mouse are potentiated following localized injection of SP.

Figure 1. Effects of intramedullary microinjection of SP on RVM ON cells and itch and pain behavior.

Figure 1.

(A) SP or saline was microinjected while recording from single ON cells. (B) Peristimulus-time histogram of ON cell response to pinch before (left) and 5 min after local microinjection of SP (right). (C) Normalized firing rate of ON cells following local microinjection of saline (blue, n=8) or SP (red, n=8) at time indicated by arrow. ON cells showed a significant increase in evoked firing following SP injection compared with saline (*; two-way ANOVA, F1, 14 = 8.020, p=0.0133, bolded lines: mean responses; error bars SEM). Male mice were used in these experiments. (D) Lesion sites from the RVM ON cell recordings. Numbers to right indicate Bregma coordinates. (E) An implanted intramedullary microinjection cannula allowed assessment of itch and pain behavior after injection of SP into RVM. (F, G) Graphs plot the number of scratch bouts elicited by intradermal injection of histamine (F, n=9, M = (106.2; 59.72), t=3.4113, DF = 8, 95% CI [15.06, 77.83], p=0.0092) or chloroquine (G, n=9, M = (102.9; 22.00), t=2.847, DF = 8, 95% CI [15.39, 146.5], p=0.0216) for each mouse (red dots and lines), and mean scratch bouts (black line; error bars: SEM), following intramedullary microinjection of saline or SP. Experiments with saline and SP microinjections were conducted at least 7 days apart. Microinjection of SP significantly attenuated histamine- and chloroquine-evoked scratching (F, G). (H) Mechanical withdrawal thresholds were reduced by intramedullary SP, n=10, M = (4.855; 3.253), t=8.96, DF = 8, 95% CI [1.198, 2.007], p = <0.0001 (I) Thermal withdrawal latency was not significantly affected by intramedullary SP, n=8, M = (5.271; 4.691), t=0.9784, DF = 7, 95% CI [–0.8216, 1.981], p=0.3605. (G, F) students t-test *p<0.05, **p<0.01, ***p<0.001. n=5–7 males, 3 females/ group.

Figure 1—source data 1. Data for electrophysiolgical recordings and behavior from SP injection into the RVM.

Intramedullary SP inhibits scratching

Since RVM ON cells are potentiated following injection of SP, we next tested if intramedullary microinjection of SP affected itch and pain related behaviors. Mice were implanted with an intramedullary microinjection cannula dorsal to the RVM to allow microinjection of SP or vehicle (Figure 1E). The number of scratch bouts elicited by intradermal injection of histamine was significantly lower following intramedullary microinjection of SP compared to saline vehicle (Figure 1F). Scratching elicited by intradermal injection of chloroquine was also significantly reduced following intramedullary injection of SP compared to saline (Figure 1G).

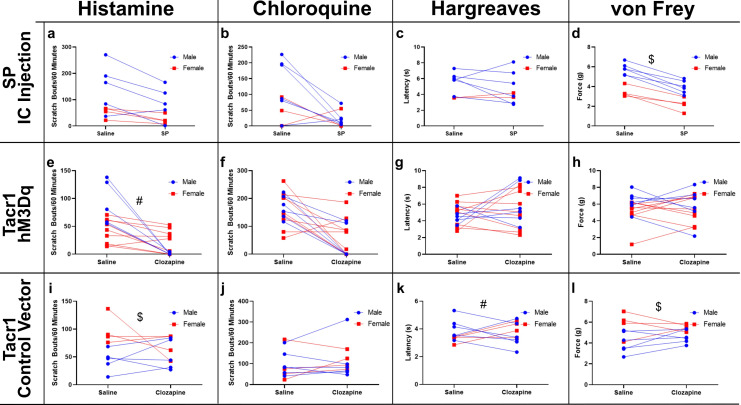
There was a significant decrease in mechanical force to elicit a hindlimb withdrawal following intramedullary SP compared to vehicle injection (Figure 1H), indicating mild mechanical sensitization. There was no significant effect of intramedullary SP injection on thermal hindpaw withdrawal latency (Figure 1I). We observed that both male and female mice showed a reduced hindlimb withdrawal, but that males had a significantly higher force for both saline and SP injection when compared with females (Figure 3—figure supplement 3D). Thus, activation of RVM Tacr1-expressing neurons, through intramedullary injection of SP, resulted in facilitation of mechanical nociceptive behavior and inhibition of pruritogen-evoked scratching behavior.

Targeted expression of DREADDs in RVM Tacr1 expressing neurons

We next wanted to determine whether activation of RVM Tacr1 expressing neurons would modulate itch related behaviors. To selectively target Tacr1-expressing neurons in the RVM, we employed a chemogenetic approach. AAV-DIO-hM3dq-mCherry was injected into the RVM of Tacr1 cre mice, resulting in selective expression of hM3Dq in Tacr1-expressing neurons (84% of RVM mCherry labeled neurons also expressed Tacr1 Figure 2A–D).

Figure 2. In Tacr1 cre +/-mice receiving AAV-DIO-hM3Dq-mCherry injections in the RVM, mCherry strongly colocalized with Tacr1 expression.

Figure 2.

(A–C): Images of RVM cells expressing mCherry (A), anti-Tacr1 antibody (B), and double-labeled cells (C). (D): 84% of mCherry expressing neurons co-express Tacr1. N=7. Scale bar (25 µm).

Figure 2—source data 1. Data for co-expression of DREADDs to Tac1r.

Activation of RVM Tacr1 expressing neurons inhibits acute itch

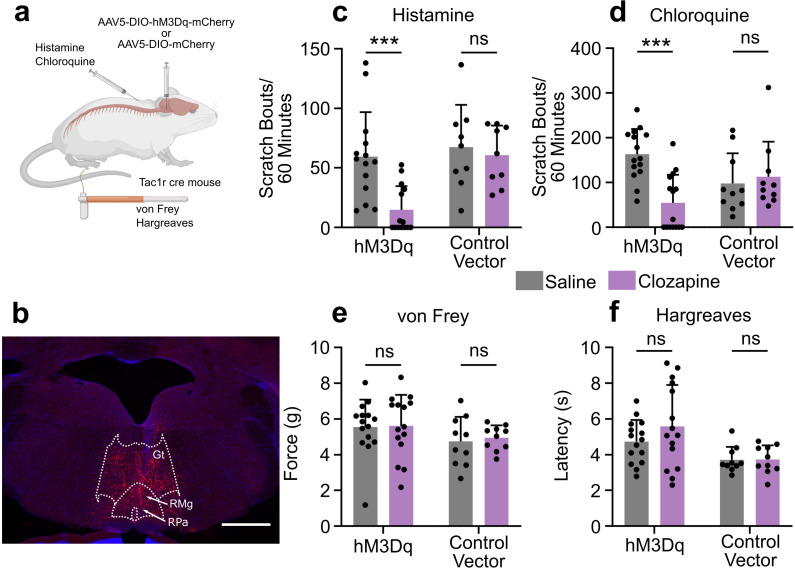
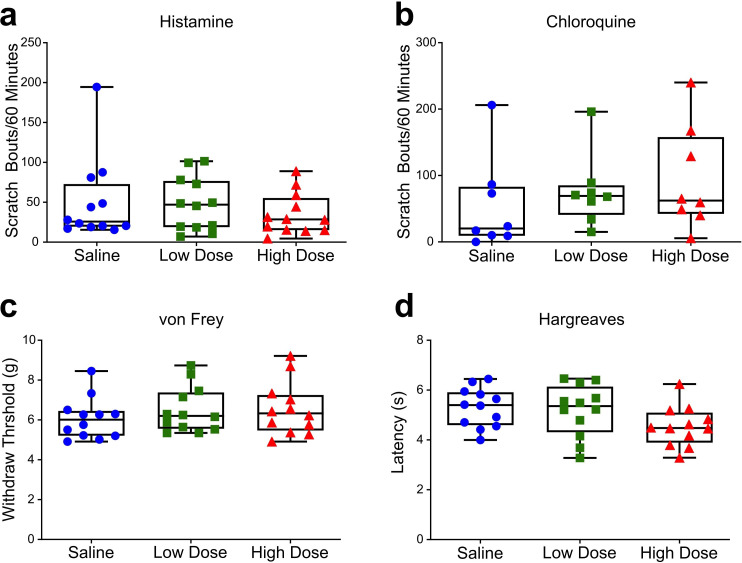
To test the functional role of the RVM Tacr1-expressing population of neurons in itch modulation, we used DREADDs (hM3dq) to activate these neurons during pruritogen-evoked scratching behaviors (Figure 3A). Following viral injection, we observed clear expression of mCherry in the RVM (Figure 3B). Activation of DREADD-expressing RVM neurons in Tacr1 cre mice using clozapine significantly attenuated pruritogen-evoked scratching behavior. After clozapine administration (0.01 mg/kg, ip; Gomez et al., 2017), there was a significant reduction in scratch bouts elicited by intradermal histamine as compared to systemic administration of saline vehicle (Figure 3C). There was a significantly stronger inhibition of histamine-evoked scratching behavior in male compared to female mice (Figure 3—figure supplement 3e). Similarly, there was a significant reduction in chloroquine-evoked scratching (Figure 3D). In contrast, clozapine administration had no significant effect on the withdrawal threshold to mechanical von Frey stimuli (Figure 3E) or withdrawal latency to thermal stimulation (Figure 3F). Administration of clozapine in control vector (Tacr1-mCherry) mice had no significant effect on scratching behavior elicited by intradermal injection of histamine (Figure 3C) or chloroquine (Figure 3D). Likewise, clozapine administration had no significant effect on mechanical (Figure 3E) or thermal hindpaw withdrawals in vector controls (Figure 3F). Finally, neither a low (0.01 mg/kg) nor a higher dose (0.1 mg/kg) of clozapine had any significant effect on histamine- or chloroquine-evoked scratching behavior or on mechanically- or thermally-evoked paw withdrawals in wildtype mice (Figure 3—figure supplement 2).

Figure 3. Chemogenetic activation of RVM Tacr1 expressing neurons inhibits itch related behavior.

(A) AAV5-DIO-hM3Dq-mCherry or AAV5-DIO-mCherry was injected into the RVM of Tacr1 cre mice. (B) Expression of hM3Dq-mCherry was limited to the RVM. Gt: gigantocellularis; RMg: raphe magnus; RPa: raphe pallidus. Scale bar (1 mm). (C) Administration of clozapine caused a significant reduction in histamine-evoked scratching in hM3Dq expressing mice (7 males, 7 females, M = (59.32; 14.75), t=3.715, DF = 13, 95% CI [18.65, 70.49], p=0.0026), but not in control vector mice (six males, three females, M = (67.28; 60.61), t=0.6235, DF = 8, 95% CI [–24.11, 37.44], p=0.6235). (D) Administration of Clozapine caused a significant reduction in chloroquine-evoked scratching in hM3Dq mice (seven males, eight females, M = (163.2; 54.33), t=4.72, DF = 14, 95% CI [59.40, 158.3], p=0.0003) but not in control vector mice (six males, four females, M = (97.90; 112.9), t=0.4129, DF = 9, 95% CI [–23.45, 36.78], p=0.4129). (E) Clozapine administration did not significantly change mechanical withdrawal thresholds in hM3Dq (seven males, eight females, M = (5.549; 5.610), t=0.1309, DF = 14, 95% CI [–1.060, 0.9378], p=0.8977) or control vector mice (six males, four females, M = (4.742; 4.958), t=0.6342, DF = 9, 95% CI [–0.9867, 0.5546], p=0.5418). (F) Clozapine administration did not significantly change thermal withdrawal thresholds in hM3Dq (seven males, eight females, M = (4.735; 5.587), t=1.262, DF = 14, 95% CI [–2.300, 0.5961], p=0.2276) or control vector mice (six males, four females, M = (3.718; 3.737), t=0.0597, DF = 9, 95% CI [–0.7260, 0.6886], p=0.9537). (C–F) *p<0.05, **p<0.01, ***p<0.001, Students paired t-test.

Figure 3—source data 1. Behavioral data of RVM Tac1r DREADDs activation with clozapine.

Figure 3.

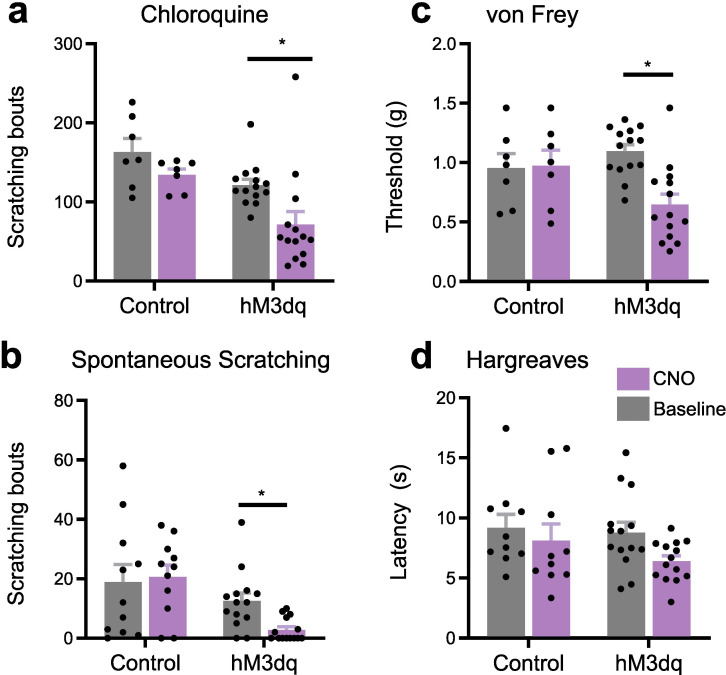
Figure 3—figure supplement 1. Chemogenetic activation of RVM Tacr1 expressing neurons inhibits itch-related behavior.

Figure 3—figure supplement 1.

Tacr1creER mice were injected with AAV2-DIO-hM3Dq-mCherry. (A) CNO administration significantly reduced chloroquine evoked scratch bouts in DREADDs but not control vector mice (Control: n=7, M = (163.286; 134.143), t=1.243, DF = 19, 95% CI [–27.7, 86.06], p=0.4057. hM3dq: n=14, M = (121.214; 71.357), t=3.007, DF = 19, 95% CI [9.608, 90.11], p=0.0145). (B) CNO reduced spontaneous scratching in hM3Dq-expressing but not control vector mice (Control: n=11, M = (18.909; 20.636), t=0.4089, DF = 23, 95% CI [–11.83, 8.377], p=0.9017. hM3dq: n=14, M = (12.571; 2.786), t=2.613, DF = 23, 95% CI [0.8292, 18.74], p=0.0308). (C) CNO administration significantly reduced mechanical withdrawal thresholds in DREADDs but not control vector mice (Control: n=7, M = (0.955; 0.976), t=1.035, DF = 38, 95% CI [–0.4584, 0.1762], p=0.5199. hM3dq: n=14, M = (1.096; 0.647), t=2.411, DF = 38, 95% CI [0.01126, 0.6459], p=0.0413). (D) CNO did not affect thermal withdrawal latency in any group (Control: n=10, M = (9.193; 8.131), t=0.7995, DF = 22, 95% CI [–2.125, 4.248], p=0.678. hM3dq: n=14, M = (8.797; 6.401), t=2.135, DF = 22, 95% CI [–0.2973, 5.089], p=0.0864). (A–D) Two-way ANOVA with Sidak multiple comparisons *p<0.05, **p<0.01, ***p<0.001.
Figure 3—figure supplement 1—source data 1. Behavioral data of RVM Tac1r DREADDs activation with CNO.
Figure 3—figure supplement 2. Clozapine administration does not affect acute itch or pain behavior.

Figure 3—figure supplement 2.

Saline, low dose clozapine (0.01 mg/kg) or high dose clozapine (0.1 mg/kg) was administered systemically, followed by tests for acute itch and pain behaviors. (A, B) Clozapine did not significantly affect the number of scratch bouts elicited by intradermal injection of histamine (A, RM one-way ANOVA, F2,22 = 0.7673, p=0.4763) or chloroquine (B, RM one-way ANOVA, F2,14 = 0.7234, p=05024). (C, D) Clozapine also did not significantly affect the respective latency or threshold of hindlimb withdrawals elicited by acute thermal (C, RM one-way ANOVA, F2,22 = 0.2.900, p=0.0763) or mechanical (D, RM one-way ANOVA, F2,22 = 1.103, p=0.3496) stimuli. (A, C and D) n=6 males, 6 females; (B) n=5 males, 3 females.
Figure 3—figure supplement 2—source data 1. Data for Clozapine administration effects on behavior.
Figure 3—figure supplement 3. Sex differences.

Figure 3—figure supplement 3.

Graphs are replotted with data sorted into male (blue) and females (red). (A–C) There were no significant sex differences following intramedullary microinjection of saline or SP for histamine- (A, n=9, SP: F1,7 = 11.49 p=0.0116, Sex: F1,7 = 4.325 p=0.0761, SP*Sex: F1,7 = 1.682 p=0.2357) or chloroquine-evoked scratching (B, n=9, SP: F1,7 = 5.64 p=0.0493, Sex: F1,7 = 2.094 p=0.1911, SP*Sex: F1,7 = 1.969 p=0.2033), or for thermal withdrawal latencies (C, n=8, SP: F1,6 = 0.153 p=0.7092, Sex: F1,6 = 2.208 p=0.1878, SP*Sex: F1,6 = 0.7851 p=0.4097). (D) Males exhibited a significantly higher mechanical withdrawal threshold following intramedullary saline ($, n=10, SP: F1,8 = 84.72 p = <0.001, Sex: F1,8 = 31.28 p=0.005, SP*Sex: F1,8 = 2.599 p=0.1456), while both sexes showed a significant reduction in withdrawal threshold following intramedullary SP. (E) Suppression of histamine-evoked scratching following clozapine was significantly greater in males (#; n=14, Clozapine: F1,12 = 49.73 p = <0.0001, Sex: F1,12 = 1.84 p=0.2, Clozapine*Sex: F1,12 = 21.6 p=0.0006). (F–H) There were no sex differences for chloroquine-evoked scratching (F, n=15, Clozapine: F1,13 = 22.09 p=0.0004, Sex: F1,13 = 0.1533 p=0.7018, Clozapine*Sex: F1,13 = 0.5548 p=0.4696), thermal withdrawal latency (G, n=15, Clozapine: F1,13 = 1.921 p=0.844, Sex: F1,13 = 0.0403 p=0.844, Clozapine*Sex: F1,13 = 0.6736 p=0.4266) or mechanical withdrawal threshold (H, n=15, Clozapine: F1,13 = 0.006799 p=0.9355, Sex: F1,13 = 1.51 p=0.2409, Clozapine*Sex: F1,13 = 1.116 p=0.3101). (I–L) We did observe a higher number of histamine-evoked scratch bouts in female mice when compared to male -(I, $, n=9, Clozapine: F1,7 = 0.5241 p=0.4926, Sex: F1,7 = 10.74 p=0.0135, Clozapine*Sex: F1,7 = 2.429 p=0.1631) and a higher mechanical withdrawal threshold for female versus male mice (L, $, n=10, Clozapine: F1,8 = 0.1487 p=0.7099, Sex: F1,8 = 8.878 p=0.0176, Clozapine*Sex: F1,8 = 1.671 p=0.2322). In the Hargreaves test there was no significant effect of clozapine administration or sex on thermal withdrawal latency, but we did observe a significant interaction (K, n=10, Clozapine: F1,8 = 0.3303 p=0.5813, Sex: F1,8 = 0.0842 p=0.7791, Clozapine*Sex: F1,8 = 6.277 p=0.0366). We did not observe any sex differences for chloroquine- evoked scratch bouts (J, #, n=10, Clozapine: F1,8 = 0.147 p=0.4061, Sex: F1,8 = 0.00381 p=0.9523, Clozapine*Sex: F1,8 = 0.147 p=0.7114),.
Figure 3—figure supplement 3—source data 1. Data for behavioral sex differences.

Our results were independently confirmed using a separate line of Tacr1-CreER mice (Huang et al., 2016), which received intra-RVM microinjection of the excitatory DREADD AAV2-DIO-hM3dq-mCherry. Chemogenetic activation using CNO significantly reduced chloroquine evoked scratch bouts (Figure 3—figure supplement 1A) and spontaneous scratching behavior (Figure 3—figure supplement 1B), and also significantly reduced the von Frey mechanical withdrawal threshold (Figure 3—figure supplement 1C) with no effect on thermal withdrawal latency (Figure 3—figure supplement 1D). CNO had no effect in the control vector mice. Independent experiments in two lines of Tacr1 cre mice support the conclusion that activation of RVM Tacr1 expressing neurons inhibits pruritogen evoked scratching behavior.

RVM Tacr1 expressing neurons inhibit chronic itch

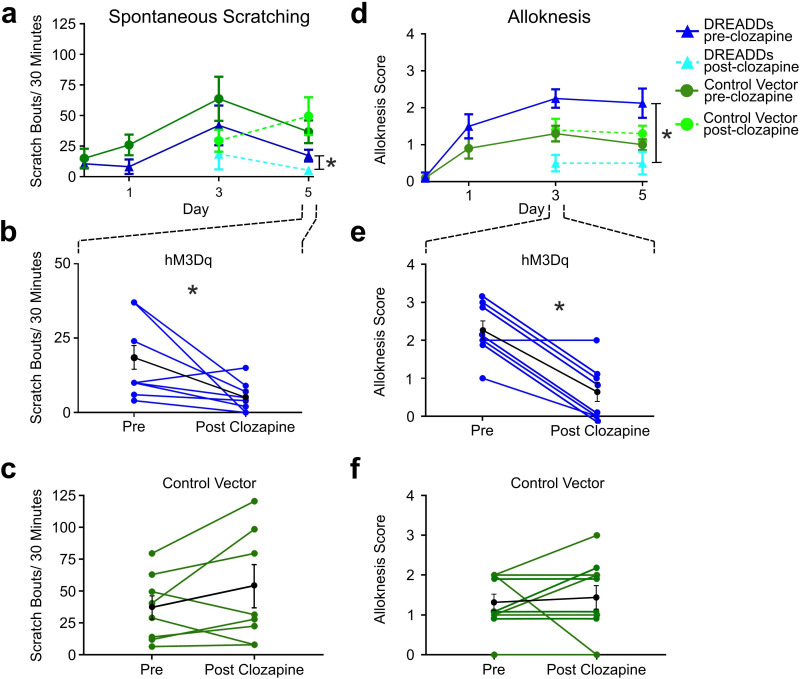
Since activation of RVM Tacr1-expressing neurons inhibited acute pruritogen-evoked scratching behavior, we next wanted to determine whether chronic itch related behaviors would be affected. We used the imiquimod model of psoriasisiform dermatitis in Tacr1 cre mice receiving intra-RVM injection of hM3Dq or control vector. Mice were treated daily with topical application of 5% imiquimod cream for 5 days. This resulted in a significant increase in spontaneous scratching on treatment day 3 (Figure 4A, dark blue) and significantly increased alloknesis scores on treatment days 1, 3, and 5 (Figure 4D, dark blue). Application of vehicle (Vanicream) had no effect on spontaneous scratching or alloknesis (Follansbee et al., 2019). Following administration of clozapine on day 5, there was a significant reduction in the number of spontaneous scratch bouts (Figure 4A, light blue). Figure 4B shows that scratch bouts in individual animals were significantly reduced after the administration of clozapine. Clozapine administered on days 3 and 5 also significantly reduced alloknesis scores (Figure 4D, light blue). Figure 5E shows significant reductions in alloknesis scores of individual animals after as compared to before clozapine. Mice that received intra-RVM microinjection of control vector also showed significant increases in spontaneous scratching (Figure 4A, dark green) and alloknesis scores (Figure 4D, dark green) following imiquimod treatment. Administration of clozapine did not significantly affect spontaneous scratching (Figure 5C) or alloknesis scores (Figure 5F) in these mice. These results show that activation of RVM Tacr1-expressing neurons reduces itch related behaviors in a model of chronic itch in addition to acute pruritogen-evoked scratch bouts.

Figure 4. Chemogenetic activation of RVM Tacr1 neurons reduces spontaneous scratching and alloknesis in the imiquimod model of chronic psoriasisiform itch.

Figure 4.

(A) Application of imiquimod (1%, 0.05 g, Taro) once per day produced a significant increase in spontaneous scratching at day 3 for both DREADDs (dark blue, RM ANOVA, Dunnett’s multiple comparisons Day0 vs Day 3, q=0.18511, p=0.0234) and control vector (dark green, RM ANOVA, Dunnett’s multiple comparisons Day0 vs Day 3, q=2.549, p=0.0382) mice. Following clozapine, there was a significant reduction in spontaneous scratching on day 5 for the DREADDs mice (dashed light blue, Paired t test n=8, M = (17.25; 5.250), t=2.38, DF = 7, 95% CI [-23.92,–0.07597], p=0.0489) but no significant change in control vector mice (dashed light green, Paired t test n=10, M = (36.75; 49.56), t=1.343, DF = 9, 95% CI [–35.38, 9.752], p=0.2213). (B) Graph shows individual DREADDs animals’ spontaneous scratch bouts pre- and post-clozapine. Following clozapine there was a significant reduction in scratching. Blue: individual counts; black: mean +/-SEM. Paired t test n=8, M = (17.25; 5.250), t=2.38, DF = 7, 95% CI [-23.92,–0.07597], p=0.0489 (C) Graph as in B for mice in vector control group, in which clozapine had no significant effect. Green: individual counts; black: mean +/-SEM. Paired t test n=10, M = (36.75; 49.56), t=1.343, DF = 9, 95% CI [–35.38, 9.752], p=0.2213 (D) Imiquimod induced significant increases in alloknesis scores on days 3 and 5 of treatment in DREADDs (dark blue, RM ANOVA, Dunnett’s multiple comparisons, Day0 vs Day 3, q=9.379, p=0.<0.0001, Day0 vs Day5, q=4.00, p=0.0129) and vector control (dark green, RM ANOVA, Dunnett’s multiple comparisons, Day0 vs Day 3, q=4.811, p=0.0025, Day0 vs Day5, q=5.014, p=0.0019) mice. Following clozapine administration on days 3 and 5 there were significant reductions in alloknesis scores for the DREADDs mice (dashed light blue, Paired t test n=8, M = (2.250; 0.6250) t=6.177, DF = 7, 95% CI [1.003, 2.247], p=0.0005) but not control vector groups (dashed light green, Paired t test n=10, M = (1.300; 1.400) t=0.3612, DF = 9, 95% CI [–0.7264, 0.5264], p=0.7263). (E) Clozapine resulted in a significant reduction in alloknesis scores (format as in B), Paired t test n=8, M = (2.250; 0.6250) t=6.177, DF = 7, 95% CI [1.003, 2.247], p=0.0005 (F) Clozapine had no effect on alloknesis scores in vector controls (format as in C). Paired t test n=10, M = (1.300; 1.400) t=0.3612, DF = 9, 95% CI [–0.7264, 0.5264], p=0.7263. Paired students t-test *p<0.05, **p<0.01, ***p<0.001. (A–F) n=4–5 males, 4–5 females/group.

Figure 4—source data 1. Data for RVM Tac1r activation in psoriasis model of chronic itch.

Figure 5. Optotagging of RVM Tacr1 neurons.

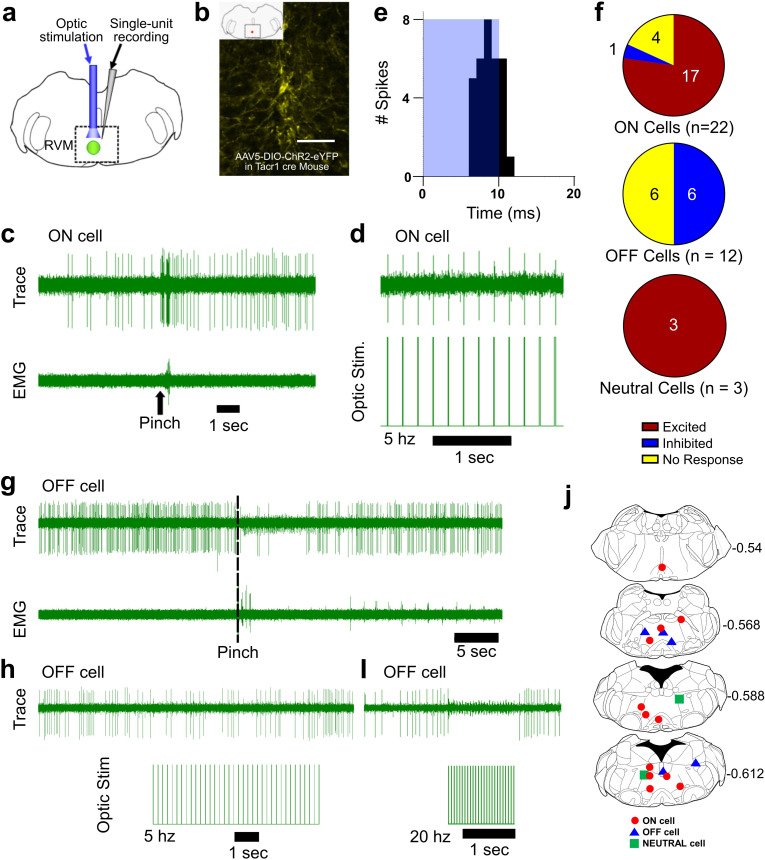
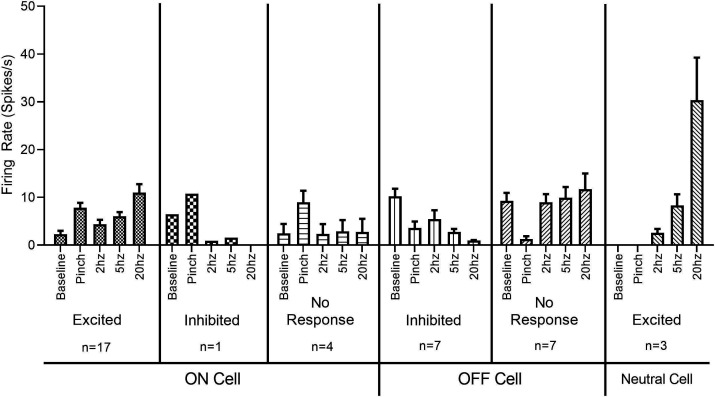
(A) RVM cells were recorded with a microelectrode coupled to an optic fiber. (B) Injection of AAV-ChR2-eYFP in the RVM of Tacr1 cre+/- mice caused strong expression of eYFP. Scale bar (100 µm). (C) ON cells were identified based on their pinch-evoked response that preceded the hindlimb withdrawal as monitored by EMG in biceps femoris. (D) Cells identified as RVM ON cells were optically stimulated (5 mW, 472 nm). This neuron faithfully responded to each pulse in a 5 hz train. (E) Light entrainment was analyzed by creating peristimulus-time histograms (PSTH) of action potentials that occurred within a 20 ms window following the onset of each light pulse. This neuron responded consistently at a latency of approximately 8.14 ms with a calculated efficiency index of 0.86. (F) Distribution of RVM ON, OFF, and Neutral cells which were excited (red), inhibited (blue), or not affected (yellow) by optic stimulation. (G) Application of a pinch stimulus elicited a hindlimb withdrawal (dotted line) and a pause in firing that is typical of OFF cells. (H) There was an intermittent decrease in OFF cell firing during 5 hz optic stimulation and a (I) total cessation of firing during 20 hz optic stimulation. (J) Lesion sites from the optotagging recordings of RVM ON (red circles), OFF (blue triangles), and NEUTRAL cells (green squares). Numbers to right indicate Bregma coordinates.

Figure 5.

Figure 5—figure supplement 1. Efficiency index of classified RVM neurons.

Figure 5—figure supplement 1.

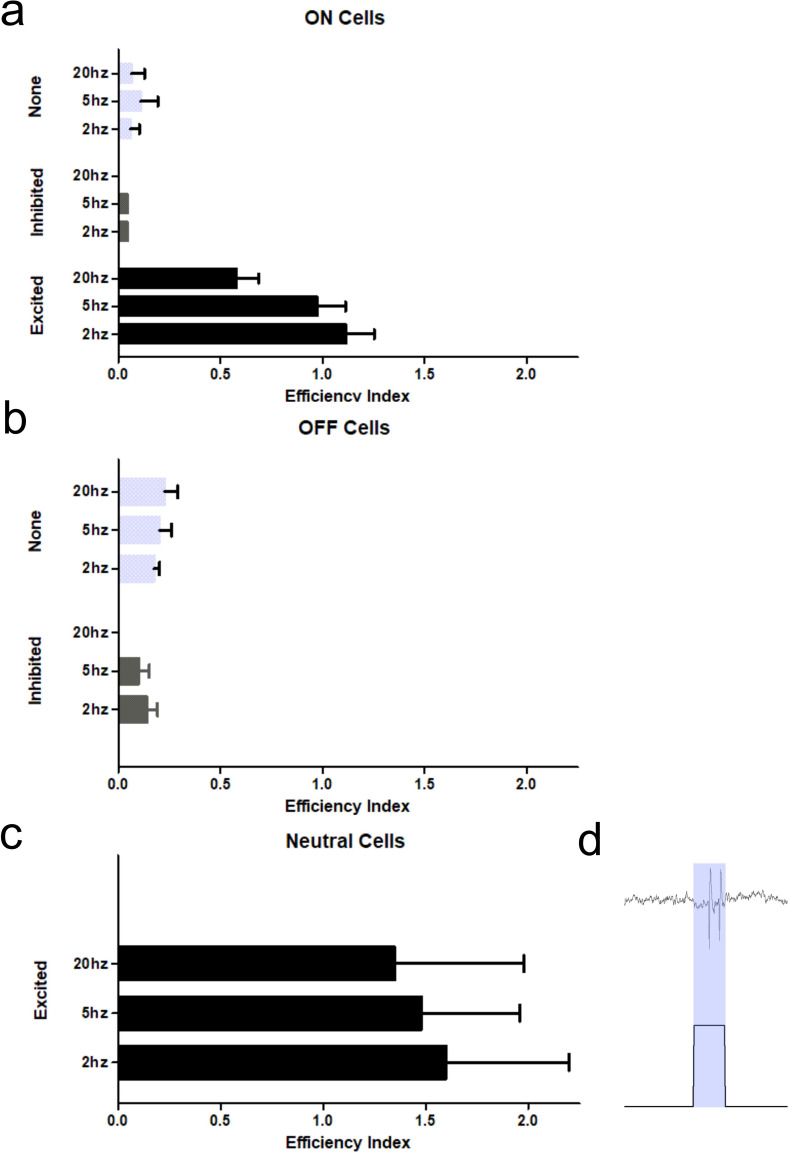
(A–C) Identified ON (A), OFF (B), and NEUTRAL (C) cells were tested for efficiency to respond within 20 ms following the onset of an optic stimulus. Neurons which were excited by optic stimulation had a robust efficiency index (approaching or >1) compared to neurons inhibited or unaffected (none) by optic stimulation. (D) Neutral cell doublet.
Figure 5—figure supplement 1—source data 1. Data for efficiency index analsyis of optotagging experiments.
Figure 5—figure supplement 2. Firing rates of classified RVM neurons in response to optic stimulation.

Figure 5—figure supplement 2.

Figure 5—figure supplement 2—source data 1. Data for firing rate analsyis of optotagging experiments.
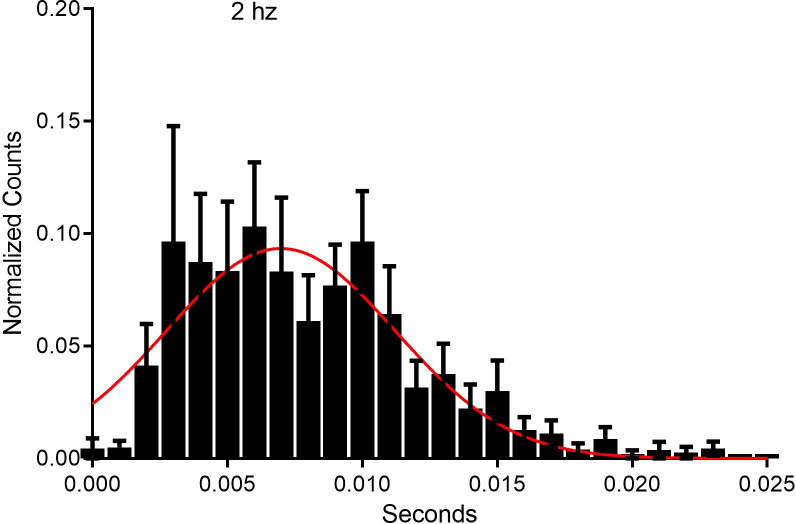
Figure 5—figure supplement 3. Response latency of ON cells to optic stimulation.

Figure 5—figure supplement 3.

RVM neurons (n=17) which responded to optic stimulation at 2 hz, had averaged response latencies of approximately 7.6+/-1.12 ms.
Figure 5—figure supplement 3—source data 1. Data for response latency of optotagging experiments.

RVM ON cells express Tacr1

Previous reports had shown, in rats, that RVM ON cells were facilitated by local microinjection of SP (Budai et al., 2007; Zhang and Hammond, 2009) and ablation of RVM neurons which express Tacr1, was antihyperalgesic (Khasabov et al., 2017a), consistent with a pronociceptive role for RVM ON cells.

We used Tacr1 cre mice which were injected with an AAV encoding channelrhodopsin (AAV5:DIO-ChR2-eYFP). Four weeks later, the mice were anesthetized with sodium pentobarbital for single-unit recording with a microelectrode whose tip extended a few hundred micrometers beyond the tip of an optic fiber it was affixed to (Figure 5A). Injected mice exhibited robust expression of eYFP in the RVM (Figure 5B). ON and OFF cells were identified based on their response to a pinch stimulus. Once identified, blue light (473 nm, 0.25–5 mW) was applied and the cell was tested for entrainment to the light stimulus. Figure 5C shows an example of an ON cell in RVM that responded to pinch prior to the onset of EMG activity and was faithfully entrained to 5 hz light stimulation (Figure 5D). This neuron received a total of 37 light pulses at 2 hz and fired 32 action potentials within 20ms of the light onset (Figure 5E) with a calculated efficiency index of 0.86 (see below), and an average latency of 8.14ms. The latencies measured presently compare favorably with those reported previously for hippocampal neurons (Zhang et al., 2013). The latency, or on rate, of neuronal activation differs by cell type (Herman et al., 2014) and increases with diminishing light density (Lin et al., 2009). Out of 22 identified ON cells, 17 were entrained to the light stimulus, 1 was inhibited and 4 were not affected (Figure 5F). It is possible that our estimate is an under representation since viral transduction was not completely efficacious. At the end of the recording a lesion was produced which we histologically verified (Figure 5J). Since the majority of RVM ON cells were entrained to light stimulation, we conclude that the majority of ON cells likewise express Tacr1.

While our primary interest was RVM ON cells, we wanted to determine whether Tacr1 is also expressed in other cell types, such as RVM OFF cells. During our recordings we often found RVM OFF cells. Out of 14 identified OFF cells, none were directly activated by the light stimulus, with 7 showing a clear inhibitory response to the light stimulation while the other 7 were unaffected (Figure 5F). Often the degree of inhibition of the OFF cell increased proportionately to the stimulation frequency (Figure 5G–I). These results support the hypothesis that RVM ON cells provide an inhibitory input onto RVM OFF cells (Fields and Heinricher, 1989) and may underlie the RVM OFF cell mediated pause during noxious stimulation.

Occasionally, Neutral cells were identified by their response to optic stimulation (n=3), and each was strongly entrained (Figure 5F). Since Neutral cells are numerous, not affected by noxious stimulation and their contribution, if any, to descending modulation is unknown, they were not investigated further. We thus conclude that while most presently-recorded light-sensitive cells were ON cells, other cell types including Neutral cells also expresses Tacr1.

To validate our results from optotagging, we used several metrics to determine whether a light-sensitive neuron was truly entrained to the optic stimulus. We assumed that each optic stimulus was likely to directly excite a neuron expressing ChR2 and tested this in different ways. An efficiency index was calculated to determine whether a neuron was entrained to the optic stimulus, by counting the number of evoked action potentials divided by the number of optic stimuli (Figure 5—figure supplement 1). The 3 Neutral cells had the highest efficiency index (>1), which was due to occasional firing of ‘doublet’ action potentials in response to the optic stimulus (Figure 5—figure supplement 1C, D). ON cells classified as light sensitive also had a high efficiency index, which decreased with increasing optic stimulation frequency most likely due to desensitization of ChR2. We additionally assumed that the neuronal firing rate would reflect the number of optic stimuli. Indeed, the neuronal firing rate in light sensitive neurons increased with the stimulation frequency, while non-light sensitive neurons showed no change (Figure 5—figure supplement 2). In neurons which were inhibited by optic stimulation, there was a decrease in firing rate following light stimulation (Figure 5—figure supplement 2, OFF cells). Finally, we assumed that the light-evoked latency of neuronal action potentials would be consistent. For the population of light-sensitive ON cells, the average latency of responses to the optic stimuli delivered at 2 hz was 7.6 (+/-1.12) ms (Figure 5—figure supplement 3). Thus, these experiments strongly support the hypothesis that the majority of RVM ON cells express Tacr1.

Discussion

Previous studies indicate a pronociceptive role for SP acting at Tacr1 expressing neurons in RVM (Budai et al., 2007), many of which have descending spinal projections (Pinto et al., 2008). A novel finding of the present study is that pharmacological and chemogenetic activation of Tacr1-expressing RVM neurons inhibited itch-related scratching behavior, with mild mechanical sensitization and no effect on thermal nociception. Our optotagging experiments provide evidence that the majority of ON cells express Tacr1. These results argue for a causal role of a subpopulation of Tacr1-expressing ON cells in the inhibition of itch-related scratching behavior, in contrast to their pronociceptive role.

Role of SP in RVM in descending modulation of pain and itch

SP (Ljungdahl et al., 1978) and Tacr1 (Saffroy et al., 2003) are present within the RVM. SP acting in the RVM potentiated ON cells, induced pronociceptive behavioral effects and sensitized spinal wide dynamic range dorsal horn neurons (Budai et al., 2007; Khasabov et al., 2017b). SP appears not to be released in the RVM in the absence of injury, but is released under inflammatory conditions elicited by CFA or capsaicin to induce Tacr1-dependent hyperalgesia (Brink et al., 2012; Hamity et al., 2010; Khasabov et al., 2017a). The present study expands on this work in important ways. Firstly, we confirm that SP potentiates noxious pinch-evoked responses of mouse RVM ON cells. Secondly, our optotagging data provide evidence that the Tacr1-expressing neurons are ON cells. Importantly, our results support a role for these neurons in the inhibition of acute and chronic itch. Intra-RVM microinjection of SP or chemogenetic activation of Tacr1-expressing neurons in two different Tacr1 cre lines significantly decreased pruritogen-evoked as well as chronic itch related scratching behavior, while facilitating mechanical nociception in most experiments with no effect on thermal nociception. This latter observation contrasts with a previous report that intra-RVM microinjection of an SP agonist enhanced thermal nociceptive behavior in rats (Khasabov et al., 2017b) a discrepancy that might be attributed to a species difference.

Descending modulation of itch

Optogenetic activation of GABAergic neurons in RVM facilitated mechanical, but not thermal nociception in mice (François et al., 2017), consistent with our data. The latter authors suggested that the GABAergic RVM neurons might represent ON cells, which descend to presynaptically inhibit mechanonociceptor input onto spinal inhibitory enkephalinergic interneurons that in turn contact the spinal mechanonociceptive pathway. Thus, activation of the descending GABAergic neurons would facilitate mechanical nociception via disinhibition.

Our study shows that RVM Tacr1 neurons represent a population of RVM ON cells, which when activated, reduce pruritogen-evoked scratching. A limitation of this study is that we were not able to directly demonstrate that inhibition of spinal pruriceptive transmission caused the reduction in scratching behavior. Previous studies have shown that 31% of functionally identified RVM ON cells (Vanegas et al., 1984), and 42.5% of Tacr1-expressing RVM neurons (Pinto et al., 2008), project to the spinal cord, supporting the descending modulation of spinal itch processing. Moreover, recent studies report that activation of spinal projection neurons originating in the locus coeruleus (Koga et al., 2020) or somatosensory cortex (Wu et al., 2021) suppress itch-related scratching behavior. Given this and the historical evidence of the spinal action of RVM ON cells, the most parsimonious explanation is that RVM Tacr1-expressing neurons with descending axons exert an inhibitory effect on spinal pruriceptive transmission to reduce scratching behavior. However, we cannot exclude the possibility that Tacr1-expressing RVM neurons lacking spinal projections exert an antipruritic effect via an unknown supraspinal action.

It was recently reported that activation of neurons in RVM that express the G-protein-coupled estrogen receptor (GPER) suppresses signs of acute and chronic itch (Gao et al., 2021). It is currently not known if GPER-expressing neurons co-express Tacr1.

Electrical stimulation of the PAG inhibited nocifensive behavior in rats (Mayer et al., 1971; Reynolds, 1969), and the PAG projects directly to the RVM (Behbehani and Fields, 1979). Activation of PAG GABAergic neurons, and inhibition of glutamatergic neurons, reduced scratching behavior under both acute and chronic itch conditions (Samineni et al., 2019) but facilitated nocifensive behaviors (Samineni et al., 2017). Activation of Tac1 (SP-expressing) neurons in the PAG was shown to facilitate pruritogen-evoked scratching via release of glutamate onto neurons in the RVM (Gao et al., 2019). In contrast, our results indicate that activation of RVM Tacr1 neurons inhibited pruritogen-evoked scratching behavior. This potentially represents a difference in the synaptic connections of PAG Tac1-expressing neurons with glutamate- and/or Tacr1-expressing RVM neurons. Previous studies have reported projections to RVM from SP-expressing neurons located in dorsolateral PAG, dorsal raphe nucleus, cuneiform nucleus, and lateral hypothalamus (Chen et al., 2013; Holden and Pizzi, 2008; Yin et al., 2014). It is thus possible that Tacr1-expressing RVM neurons that inhibit scratching are activated by different SP inputs than the RVM neurons activated by PAG TAc1-expressing neurons that facilitate scratching.

Modality specific role of RVM ON cells

For decades, the role of RVM ON cells has been considered faciliatory for spinal nociceptive transmission. Our results suggest that the role of RVM ON cells is modality specific, with RVM ON cells facilitating spinal nociceptive while inhibiting pruriceptive transmission. Pruritogens and algogens similarly excited RVM ON and inhibited OFF cells, implying that the opposing modulatory effects of ON cells on spinal nociceptive vs. pruriceptive transmission likely occurs via separate spinal circuits. RVM ON cells have a GABA-mediated inhibitory connection to spinal enkephalinergic neurons (François et al., 2017), raising the possibility that spinal enkephalinergic tone accounts for the opposing effects on spinal nociceptive and pruriceptive transmission. Since pain suppresses itch, we cannot exclude the possibility that activation of spinal pronociceptive circuitry inhibits itch transmission.

Treatment of chronic itch with Tacr1 antagonists

The Tacr1 antagonists aprepitant and serlopitant were recently shown to be partially effective in reducing chronic itch of various etiologies. Tacr1 antagonists might act at Tacr1 that is expressed by spinothalamic and spinoparabrachial neurons (Yang et al., 2021 & Todd, 2010) to reduce pruriceptive transmission. Indeed, ablation of Tacr1-expressing spinal and medullary neurons reduces pruritogen-evoked scratching behavior (Carstens et al., 2010). The present results suggest that Tacr1 antagonists also have an opposite effect to block Tacr1-mediated descending inhibition of itch. Systemic administration of Tacr1 antagonists thus appear to have offsetting supraspinal and spinal effects, potentially explaining the limited efficacy of Tacr1 antagonists for chronic itch.

Materials and methods

Key resources table.

Reagent type (species) or resource Designation Source or reference Identifiers Additional information
Strain, strain background (M. musculus) Tacr1 cre Dong Lab
Strain, strain background (M. musculus) Tacr1 creER Dong Lab (Huang et al., 2016)
Strain, strain background (AAV) aav5-hSyn-DIO-hM3Dq-mCherry Addgene 44361-AAV5
Strain, strain background (AAV) aav5-hSyn-DIO-mCherry Addgene 50459-AAV5
Strain, strain background (AAV) aav5-Ef1a-hChR2-mCherry Addgene 20297-AAV5
Antibody Mouse monoclonal: anti-Tacr1 conjugated 488 SCBT sc-365091 AF488 (1:50)
Chemical compound, drug Substance P (SP) Tocris 1156/5
Chemical compound, drug Histamine Dihydrochloride (HA) Sigma-Aldrich H7250
Chemical compound, drug Chloroquine Diphosphate (CLQ) Sigma-Aldrich C6628
Chemical compound, drug Pentobarbital Sodium Sigma-Aldrich P3761
Chemical compound, drug Buprenorphine Hydrochloride Amerisoucebergen NDC42023-179-05
Software, algorithm 5 Prism Graphpad

Animals

Experiments were performed using wild type mice (c57BL/6 j, Jackson Labs, Bar Harbor ME), Tacr1 cre+/- (courtesy of Dr. X. Dong, Johns Hopkins University), and Tacr1 creER +/-mice (Huang et al., 2016) of both sexes, 8–10 weeks of age, all on a C57Bl/6 background. Mice were given free access to food and water and housed under standard laboratory conditions. Mice were housed in-lab and at the animal housing facility, with a natural light cycle and 12 hr light dark cycle, respectively. Mice were allowed to habituate for at least 3 days following transfer from the animal facility to lab housing before use in behavioral experiments. Mice were cohoused with between 1 and 4 mice/cage. All procedures were approved by the University of California, Davis and University of Pittsburgh Animal Care and Use Committees and followed the ARRIVE guidelines to the extent possible.

Pharmacologic agents

Clozapine was dissolved in saline and administered intraperitoneally (ip) at concentrations of 0.01 and 0.1 mg/kg. Clozapine-N-oxide (CNO;Tocris, Bristol UK) was dissolved in phosphate-buffered saline and administered ip (5 mg/kg). In clozapine and CNO treated mice, experiments were conducted 30 min following their administration. Histamine HCl (Sigma, St. Louis MO; 0.5% in 10 µl) or chloroquine diphosphate salt (Sigma; 1% in 10 µl) were dissolved in physiological saline and administered intradermally via a 30 g needle in the nape of the neck. Imiquimod cream (5%; Aldara, 50 mg; 3 M Health Care Limited, UK) was administered topically once per day to shaved skin on the rostral back for 5 days.

Stereotaxic injections and cannula implantation

Animals were anesthetized with 2% isoflurane and placed in a stereotaxic head frame. A burr hole was made in the calvarium and a Hamilton microsyringe loaded with virus was stereotaxically placed such that the tip was at the injection site in RVM (RC: –5.5 to –5.8 mm, ML: 0.0, DV: –4.2 to –6 mm). Virus (0.25–1 µl) containing either AAV5: hSyn-DIO-hM3Dq-mCherry (excitatory DREADD; Addgene, Watertown MA), AAV5: hSyn-DIO-mCherry (control vector, Addgene), or AAV5: hSyn-DIO-ChR2-eYFP (Addgene) was injected into the RVM. Virus was infused at an approximate rate of 100 nL/min. The injection needle was left in place for an additional 15 min post-injection and then slowly withdrawn. The incision was closed using Vetbond and animals were given ketofen (10 mg/kg ip) or buprenorphine (0.05 mg/kg ip) and allowed to recover on a heating pad. A 4-week recovery period ensued prior to experimentation.

For intracranial drug injections, an injection cannula (Plastics One, Roanoke VA) was implanted stereotaxically with the tip targeted 1–2 mm above the RVM. For optogenetic stimulation, following microinjection of AAV5: hSyn-DIO-ChR2-eYFP into RVM, an optic fiber (Doric Lenses, Quebec Canada) was stereotaxically implanted at the target site. Dental cement was used to affix the injection cannula or optic fiber to the skull. Post-implantation mice received buprenorphine (0.05 mg/kg ip). Mice recovered for at least 4 weeks prior to experimentation.

Intracranial drug microinjection

Mice were habituated for 15 min prior to intracranial drug injection in clear cylindrical glass enclosures and videotaped from above. Saline (0.5 µl) or Substance P (SP, 0.5 µl, 10 nmol, Tocris, Minneapolis MN) was microinjected. Fifteen minutes post-injection mice were tested for itch or pain behaviors as described below. Both male and female mice were used.

Chemogenetics

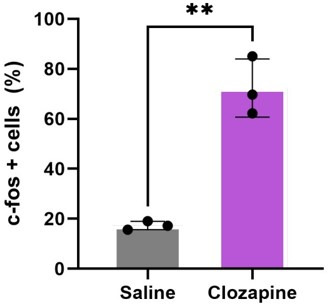
Thirty minutes after ip administration of saline, clozapine or CNO, behavioral testing commenced. We verified the efficacy of clozapine by observing an increase in cfos staining in the RVM of DREADDs versus control vector mice as well as saline versus clozapine (data not shown).

Behavior

Scratching behavior: Scratch bouts were defined as back-and-forth hindpaw movements directed to the rostral back, followed by biting the toes and/or placement of the hindpaw on the floor. Scratch bouts elicited by histamine, chloroquine or saline vehicle were videotaped and counts made by at least two blinded observers. Nociceptive behavioral assays (von Frey; Hargreaves) were conducted by investigators blinded as to treatment. Successive behavioral tests were conducted in pseudorandom order and spaced 1 week apart.

Von Frey: Mechanical sensitivity was measured in two ways. Mice stood on a mesh floor allowing access to the plantar surface from below. Using the Chaplan up-down method (Chaplan et al., 1994), calibrated von Frey filaments (North Coast Medical Inc) were applied to the plantar surface. Paw lifting, shaking, and licking were scored as positive responses. Averaged responses were obtained from each hindpaw, with 3 min between trials on opposite paws, and 5 min between trials on the same paw. Alternatively, the force at the moment of hindpaw withdrawal was measured using an electronic von Frey device (2390; IITC, Woodland Hills CA). Measurements were again taken from each hindpaw with 3 and 5 min between trials on the same or opposite paw.

Hargreaves: Animals were acclimated on a glass plate held at 30 °C (Model 390 Series 8, IITC Life Science Inc). A radiant heat source was applied to the hindpaw and latency to paw withdrawal was recorded (Hargreaves et al., 1988). Two trials were conducted on each paw, with at least 5 min between tests of opposite paws and at least 10 min between tests of the same paw. To avoid tissue damage, a cut off latency of 20 s was set. Values from both paws were averaged.

In vivo single-unit recording

Adult mice (6 weeks) mice were anesthetized with pentobarbital sodium (60 mg/kg, ip). The head was secured in a stereotaxic frame and an opening was made in the occipital bone. The animal’s body temperature was maintained with a heating pad and external heating source. Teflon coated silver wires were inserted into the biceps femoris to record electromyographic (EMG) activity. A single-unit recording microelectrode (10 MOhm, Frederick Haer Inc, Bowdoin ME) was coupled to a 33-gauge injection cannula such that the tip of the recording microelectrode extended several hundred μm beyond the tip of the injection cannula and was inserted into the RVM. ON cells were identified by a hindpaw pinch-evoked increase in firing that preceded the hindlimb withdraw reflex measured as EMG activity from fine wires inserted in the biceps femoris. Once an ON cell was identified, either saline or SP (0.5 μl, 10 nmol) was microinjected and changes in firing rate to repeated consistent pinch stimuli were recorded. Responses to pinch stimuli were normalized to the initial response for each unit. Electrode voltages were amplified and digitized (CED 1401, CED, Cambridge UK) and analyzed with Spike2 (CED). At the end of the recording, a lesion was produced at the last recording site by passing direct current through the microelectrode, the brain was harvested postmortem and postfixed in 10% formalin.

Optotagging

At least 4 weeks following injection of AAV5: hSyn-DIO-ChR2-eYFP into RVM, single-unit recordings were made from RVM as described above using a Tungsten microelectrode attached to an optic fiber such that the microelectrode tip extended a few hundred microns beyond the optic fiber. In most experiments ON cells were functionally characterized as described above, and OFF cells were characterized by a pinch-evoked pause in ongoing activity that preceded the withdrawal reflex. ON and OFF cells were then tested for entrainment to optic stimulation at 473 nm wavelength and 0.25 mW - 5 mW light output (5–20 Hz, 10 ms pulse duration) from a laser (Laserglow R471003GX). In some experiments, optic stimulation was used as to isolate light-sensitive neurons, which were then identified as ON, OFF or Neutral based on their response to pinch. Efficiency indices were calculated as the number of action potentials firing within a 20 ms window following the onset of the optic stimulus divided by the total number of optic stimulus pulses, and were used to determine whether a neuron was entrained to the optic stimulus. Both male and female mice were used for all electrophysiological experiments.

Imiquimod treatment

Imiquimod cream was applied topically to the shaved area on the rostral back once per day for 5 consecutive days. Treatment groups consisted of age-matched male and female NK-1-cre mice that had received intra-RVM injection of AAV5: DIO-hM3Dq-mCherry or the control vector AAV5: hSyn-DIO-mCherry. Imiquimod treatment induced signs of skin pathology including skin scaling and erythema. As measures of chronic itch, we assessed spontaneous scratching, and alloknesis, 23 hr following imiquimod treatment. Mice were videotaped and tested between 10 AM and 5 PM, with each individual mouse tested at the same time each day. The mice were habituated to glass cylinders for 3 successive days prior to recording. Animals were videotaped from above for 30 min. Behavioral videos were analyzed by two blinded observers. Only discrete bouts of spontaneous hindlimb scratches directed towards the application site were counted, as described previously (Akiyama et al., 2016) and summed over the 30 min period. Alloknesis was assessed as previously described (Akiyama et al., 2012). The mouse was placed in an enclosed area and a 0.07 g von Frey monofilament was applied to the perimeter of the imiquimod application area five consecutive times. The alloknesis score consisted of the number of immediately occurring hindlimb scratch bouts directed to the stimulus site.

Immunofluorescence

Four weeks after intra-RVM injection of AAV5:hSyn-DIO-hM3Dq-mCherry or the control vector (AAV5:hSyn-DIO-mCherry) in Tacr1 cre mice, clozapine (0.01 mg/kg, i.p.) was injected, followed 1 hr later by perfusion (4% paraformaldehyde), harvesting of brains and post-fixation overnight in 4% paraformaldehyde. Brains were sectioned (20 μm) on a freezing microtome and stained as free floating sections. DREADDs-expressing neurons were counterstained for Tacr1 expression with a conjugated Tacr1 antibody (D-11, sc-365091, Santa Cruz Biotechnology, Dallas TX) at 1:50 overnight at 4 °C. mCherry expressing neurons were identified in the RVM and then observed for Tacr1 expression. All slides were mounted with vectashield and imaged with confocal microscopy. Staining intensity was measured relative to the red fluorescence (from DREADDs) and was quantified using FIJI (Schindelin et al., 2012).

Statistical analysis

All statistical analyses were performed using GraphPad Prism. Values are presented as mean +/-SEM. Statistical significance was assessed using students t-test or a two-way, repeated measures ANOVA with Bonferroni’s correction, unless otherwise specified. Significance was indicated by p<0.05. Sample sizes were based on pilot data and are similar to those typically used in the field.

For analysis of effects of intracranial microinjections, a paired students t-test was used to compare the effects of intracranial injection of saline versus SP on behavioral measures. Two-way ANOVA determined a lack of significant sex x SP microinjection interaction, so the data from both sexes were pooled. For chemogenetic experiments, a paired t-test was used to compare scratch counts and nociceptive measures following vehicle vs. clozapine or CNO injection, or between vector controls and DREADDs mice following clozapine or CNO. For optogenetic experiments a paired t-test was similarly used to compare behavioral measures during and in the absence of optic stimulation.

For experiments with imiquimod, paired students t-tests compared the effects of ip injection of saline versus clozapine on spontaneous scratch bouts and alloknesis scores. A two-way ANOVA revealed no interaction for sex x clozapine administration, so the data were pooled for further analysis.

For single-unit recordings, a two-way repeated measures ANOVA with bonferroni post-hoc test was used to compare the neuronal responses to pinch following intra-RVM injection of saline or SP for 60 min post-injection.

For immunohistochemical staining for c-fos, students t-test compared the staining intensity of c-fos and the proportion of c-fos-positive neurons in Tacr1-expressing neurons following administration of clozapine, in mice receiving DREADDs or control vector injections.

Acknowledgements

We thank Dr. Dong (Johns Hopkins University) for the generous donation of Tacr1-cre mice.

Funding Statement

The funders had no role in study design, data collection and interpretation, or the decision to submit the work for publication.

Contributor Information

Taylor Follansbee, Email: tfollansbee@ucdavis.edu.

Rohini Kuner, Heidelberg University, Germany.

Kate M Wassum, University of California, Los Angeles, United States.

Funding Information

This paper was supported by the following grants:

  • National Institutes of Health AR076434 to Earl Carstens.

  • National Institutes of Health AR057194 to Earl Carstens.

  • National Institutes of Health AR063772 to Sarah E Ross.

  • National Institutes of Health NS096705 to Sarah E Ross.

  • National Institutes of Health F31NS113371 to Eileen Nguyen.

  • National Institutes of Health T32GM008208 to Eileen Nguyen.

Additional information

Competing interests

No competing interests declared.

No competing interests declared.

Author contributions

Conceptualization, Resources, Data curation, Software, Formal analysis, Supervision, Validation, Investigation, Visualization, Methodology, Writing – original draft, Project administration, Writing – review and editing.

Formal analysis, Funding acquisition, Investigation.

Data curation, Investigation.

Data curation, Investigation.

Investigation.

Data curation, Investigation.

Resources, Supervision, Investigation, Methodology, Project administration.

Data curation, Formal analysis, Investigation.

Supervision, Writing – review and editing.

Conceptualization, Data curation, Formal analysis, Supervision, Funding acquisition, Methodology, Writing – original draft, Writing – review and editing.

Ethics

This study was performed in accordance with our approved IACUC protocol (21316) at the University of California, Davis.

Additional files

Transparent reporting form

Data availability

All data generated or analyzed during this study are included in the manuscript and supporting files.

References

  1. Agostinelli LJ, Bassuk AG. Novel inhibitory brainstem neurons with selective projections to spinal lamina I reduce both pain and itch. The Journal of Comparative Neurology. 2021;529:2125–2137. doi: 10.1002/cne.25076. [DOI] [PMC free article] [PubMed] [Google Scholar]
  2. Akiyama T, Carstens MI, Ikoma A, Cevikbas F, Steinhoff M, Carstens E. Mouse model of touch-evoked itch (alloknesis) The Journal of Investigative Dermatology. 2012;132:1886–1891. doi: 10.1038/jid.2012.52. [DOI] [PMC free article] [PubMed] [Google Scholar]
  3. Akiyama T, Ivanov M, Nagamine M, Davoodi A, Carstens MI, Ikoma A, Cevikbas F, Kempkes C, Buddenkotte J, Steinhoff M, Carstens E. Involvement of TRPV4 in serotonin-evoked scratching. The Journal of Investigative Dermatology. 2016;136:154–160. doi: 10.1038/JID.2015.388. [DOI] [PMC free article] [PubMed] [Google Scholar]
  4. Barbaro NM, Heinricher MM, Fields HL. Putative pain modulating neurons in the rostral ventral medulla: reflex-related activity predicts effects of morphine. Brain Research. 1986;366:203–210. doi: 10.1016/0006-8993(86)91296-5. [DOI] [PubMed] [Google Scholar]
  5. Bartels DJP, van Laarhoven AIM, van de Kerkhof PCM, Evers AWM. Nocebo effects and scratching behaviour on itch. Acta Dermato-Venereologica. 2018;98:943–950. doi: 10.2340/00015555-2979. [DOI] [PubMed] [Google Scholar]
  6. Behbehani MM, Fields HL. Evidence that an excitatory connection between the periaqueductal gray and nucleus raphe magnus mediates stimulation produced analgesia. Brain Research. 1979;170:85–93. doi: 10.1016/0006-8993(79)90942-9. [DOI] [PubMed] [Google Scholar]
  7. Brink TS, Pacharinsak C, Khasabov SG, Beitz AJ, Simone DA. Differential modulation of neurons in the rostral ventromedial medulla by neurokinin-1 receptors. Journal of Neurophysiology. 2012;107:1210–1221. doi: 10.1152/jn.00678.2011. [DOI] [PMC free article] [PubMed] [Google Scholar]
  8. Budai D, Khasabov SG, Mantyh PW, Simone DA. NK-1 receptors modulate the excitability of ON cells in the rostral ventromedial medulla. Journal of Neurophysiology. 2007;97:1388–1395. doi: 10.1152/jn.00450.2006. [DOI] [PubMed] [Google Scholar]
  9. Butler RK, Finn DP. Stress-induced analgesia. Progress in Neurobiology. 2009;88:184–202. doi: 10.1016/j.pneurobio.2009.04.003. [DOI] [PubMed] [Google Scholar]
  10. Carstens EE, Carstens MI, Simons CT, Jinks SL. Dorsal horn neurons expressing NK-1 receptors mediate scratching in rats. Neuroreport. 2010;21:303–308. doi: 10.1097/WNR.0b013e328337310a. [DOI] [PMC free article] [PubMed] [Google Scholar]
  11. Carstens E, Iodi Carstens M, Akiyama T, Davoodi A, Nagamine M. Opposing effects of cervical spinal cold block on spinal itch and pain transmission. Itch. 2018;3:e16. doi: 10.1097/itx.0000000000000016. [DOI] [PMC free article] [PubMed] [Google Scholar]
  12. Chaplan SR, Bach FW, Pogrel JW, Chung JM, Yaksh TL. Quantitative assessment of tactile allodynia in the rat paw. Journal of Neuroscience Methods. 1994;53:55–63. doi: 10.1016/0165-0270(94)90144-9. [DOI] [PubMed] [Google Scholar]
  13. Chebbi R, Boyer N, Monconduit L, Artola A, Luccarini P, Dallel R. The nucleus raphe magnus OFF-cells are involved in diffuse noxious inhibitory controls. Experimental Neurology. 2014;256:39–45. doi: 10.1016/j.expneurol.2014.03.006. [DOI] [PubMed] [Google Scholar]
  14. Chen T, Wang XL, Qu J, Wang W, Zhang T, Yanagawa Y, Wu SX, Li YQ. Neurokinin-1 receptor-expressing neurons that contain serotonin and gamma-aminobutyric acid in the rat rostroventromedial medulla are involved in pain processing. The Journal of Pain. 2013;14:778–792. doi: 10.1016/j.jpain.2013.02.002. [DOI] [PubMed] [Google Scholar]
  15. Damien J, Colloca L, Bellei-Rodriguez CÉ, Marchand S. Pain modulation: from conditioned pain modulation to placebo and nocebo effects in experimental and clinical pain. International Review of Neurobiology. 2018;139:255–296. doi: 10.1016/bs.irn.2018.07.024. [DOI] [PMC free article] [PubMed] [Google Scholar]
  16. Fields HL, Basbaum AI. Brainstem control of spinal pain-transmission neurons. Annual Review of Physiology. 1978;40:217–248. doi: 10.1146/annurev.ph.40.030178.001245. [DOI] [PubMed] [Google Scholar]
  17. Fields HL, Vanegas H, Hentall ID, Zorman G. Evidence that disinhibition of brain stem neurones contributes to morphine analgesia. Nature. 1983;306:684–686. doi: 10.1038/306684a0. [DOI] [PubMed] [Google Scholar]
  18. Fields HL, Heinricher MM. Anatomy and physiology of a nociceptive modulatory system. Philosophical Transactions of the Royal Society of London. Series B, Biological Sciences. 1985;308:361–374. doi: 10.1098/rstb.1985.0037. [DOI] [PubMed] [Google Scholar]
  19. Fields HL, Heinricher MM. Brainstem modulation of nociceptor-driven withdrawal reflexes. Annals of the New York Academy of Sciences. 1989;563:34–44. doi: 10.1111/j.1749-6632.1989.tb42188.x. [DOI] [PubMed] [Google Scholar]
  20. Fields HL. Pain modulation: expectation, opioid analgesia and virtual pain. Progress in Brain Research. 2000;122:245–253. doi: 10.1016/s0079-6123(08)62143-3. [DOI] [PubMed] [Google Scholar]
  21. Fields HL. State-dependent opioid control of pain. Nature Reviews Neuroscience. 2004;5:565–575. doi: 10.1038/nrn1431. [DOI] [PubMed] [Google Scholar]
  22. Follansbee T, Akiyama T, Fujii M, Davoodi A, Nagamine M, Iodi Carstens M, Carstens E. Effects of pruritogens and algogens ON rostral ventromedial medullary ON and OFF cells. Journal of Neurophysiology. 2018;120:2156–2163. doi: 10.1152/jn.00208.2018. [DOI] [PMC free article] [PubMed] [Google Scholar]
  23. Follansbee T, Zhou Y, Wu X, Delahanty J, Nguyen A, Domocos D, Carstens MI, Hwang ST, Carstens E. Signs of chronic itch in the mouse imiquimod model of psoriasiform dermatitis. Itch. 2019;4:e25. doi: 10.1097/itx.0000000000000025. [DOI] [PMC free article] [PubMed] [Google Scholar]
  24. François A, Low SA, Sypek EI, Christensen AJ, Sotoudeh C, Beier KT, Ramakrishnan C, Ritola KD, Sharif-Naeini R, Deisseroth K, Delp SL, Malenka RC, Luo L, Hantman AW, Scherrer G. A brainstem-spinal cord inhibitory circuit for mechanical pain modulation by GABA and enkephalins. Neuron. 2017;93:822–839. doi: 10.1016/j.neuron.2017.01.008. [DOI] [PMC free article] [PubMed] [Google Scholar]
  25. Gao ZR, Chen WZ, Liu MZ, Chen XJ, Wan L, Zhang XY, Yuan L, Lin JK, Wang M, Zhou L, Xu XH, Sun YG. Tac1-expressing neurons in the periaqueductal gray facilitate the itch-scratching cycle via descending regulation. Neuron. 2019;101:45–59. doi: 10.1016/j.neuron.2018.11.010. [DOI] [PubMed] [Google Scholar]
  26. Gao T, Dong L, Qian J, Ding X, Zheng Y, Wu M, Meng L, Jiao Y, Gao P, Luo P, Zhang G, Wu C, Shi X, Rong W. G-protein-coupled estrogen receptor (GPER) in the rostral ventromedial medulla is essential for mobilizing descending inhibition of itch. The Journal of Neuroscience. 2021;41:7727–7741. doi: 10.1523/JNEUROSCI.2592-20.2021. [DOI] [PMC free article] [PubMed] [Google Scholar]
  27. Gomez JL, Bonaventura J, Lesniak W, Mathews WB, Sysa-Shah P, Rodriguez LA, Ellis RJ, Richie CT, Harvey BK, Dannals RF, Pomper MG, Bonci A, Michaelides M. Chemogenetics revealed: DREADD occupancy and activation via converted clozapine. Science. 2017;357:503–507. doi: 10.1126/science.aan2475. [DOI] [PMC free article] [PubMed] [Google Scholar]
  28. Hamity MV, White SR, Hammond DL. Effects of neurokinin-1 receptor agonism and antagonism in the rostral ventromedial medulla of rats with acute or persistent inflammatory nociception. Neuroscience. 2010;165:902–913. doi: 10.1016/j.neuroscience.2009.10.064. [DOI] [PMC free article] [PubMed] [Google Scholar]
  29. Hargreaves K, Dubner R, Brown F, Flores C, Joris J. A new and sensitive method for measuring thermal nociception in cutaneous hyperalgesia. Pain. 1988;32:77–88. doi: 10.1016/0304-3959(88)90026-7. [DOI] [PubMed] [Google Scholar]
  30. Heinricher MM, Tavares I, Leith JL, Lumb BM. Descending control of nociception: specificity, recruitment and plasticity. Brain Research Reviews. 2009;60:214–225. doi: 10.1016/j.brainresrev.2008.12.009. [DOI] [PMC free article] [PubMed] [Google Scholar]
  31. Herman AM, Huang L, Murphey DK, Garcia I, Arenkiel BR. Cell type-specific and time-dependent light exposure contribute to silencing in neurons expressing channelrhodopsin-2. eLife. 2014;3:e01481. doi: 10.7554/eLife.01481. [DOI] [PMC free article] [PubMed] [Google Scholar]
  32. Holden JE, Pizzi JA. Lateral hypothalamic-induced antinociception may be mediated by a substance P connection with the rostral ventromedial medulla. Brain Research. 2008;1214:40–49. doi: 10.1016/j.brainres.2008.03.051. [DOI] [PMC free article] [PubMed] [Google Scholar]
  33. Huang H, Kuzirian MS, Cai X, Snyder LM, Cohen J, Kaplan DH, Ross SE. Generation of a NK1R-creer knockin mouse strain to study cells involved in neurokinin 1 receptor signaling. Genesis. 2016;54:593–601. doi: 10.1002/dvg.22985. [DOI] [PMC free article] [PubMed] [Google Scholar]
  34. Jennings EM, Okine BN, Roche M, Finn DP. Stress-induced hyperalgesia. Progress in Neurobiology. 2014;121:1–18. doi: 10.1016/j.pneurobio.2014.06.003. [DOI] [PubMed] [Google Scholar]
  35. Khasabov SG, Malecha P, Noack J, Tabakov J, Giesler GJ, Simone DA. Hyperalgesia and sensitization of dorsal horn neurons following activation of NK-1 receptors in the rostral ventromedial medulla. Journal of Neurophysiology. 2017a;118:2727–2744. doi: 10.1152/jn.00478.2017. [DOI] [PMC free article] [PubMed] [Google Scholar]
  36. Khasabov SG, Wang JCF, Simone DA, Strichartz GR. A role for neurokinin-1 receptor neurons in the rostral ventromedial medulla in the development of chronic postthoracotomy pain. Pain. 2017b;158:1332–1341. doi: 10.1097/j.pain.0000000000000919. [DOI] [PubMed] [Google Scholar]
  37. Koga K, Shiraishi Y, Yamagata R, Tozaki-Saitoh H, Shiratori-Hayashi M, Tsuda M. Intrinsic braking role of descending locus coeruleus noradrenergic neurons in acute and chronic itch in mice. Molecular Brain. 2020;13:1–11. doi: 10.1186/s13041-020-00688-0. [DOI] [PMC free article] [PubMed] [Google Scholar]
  38. Le Bars D. The whole body receptive field of dorsal horn multireceptive neurones. Brain Research. Brain Research Reviews. 2002;40:29–44. doi: 10.1016/s0165-0173(02)00186-8. [DOI] [PubMed] [Google Scholar]
  39. Lin JY, Lin MZ, Steinbach P, Tsien RY. Characterization of engineered channelrhodopsin variants with improved properties and kinetics. Biophysical Journal. 2009;96:1803–1814. doi: 10.1016/j.bpj.2008.11.034. [DOI] [PMC free article] [PubMed] [Google Scholar]
  40. Liu MZ, Chen XJ, Liang TY, Li Q, Wang M, Zhang XY, Li YZ, Sun Q, Sun YG. Synaptic control of spinal GRPR+ neurons by local and long-range inhibitory inputs. PNAS. 2019;116:27011–27017. doi: 10.1073/pnas.1905658116. [DOI] [PMC free article] [PubMed] [Google Scholar]
  41. Ljungdahl A, Hökfelt T, Nilsson G. Distribution of substance P-like immunoreactivity in the central nervous system of the rat--I. cell bodies and nerve terminals. Neuroscience. 1978;3:861–943. doi: 10.1016/0306-4522(78)90116-1. [DOI] [PubMed] [Google Scholar]
  42. Lockwood S, Dickenson AH. What goes up must come down: insights from studies on descending controls acting on spinal pain processing. Journal of Neural Transmission. 2020;127:541–549. doi: 10.1007/s00702-019-02077-x. [DOI] [PMC free article] [PubMed] [Google Scholar]
  43. Mayer DJ, Wolfle TL, Akil H, Carder B, Liebeskind JC. Analgesia from electrical stimulation in the brainstem of the rat. Science. 1971;174:1351–1354. doi: 10.1126/science.174.4016.1351. [DOI] [PubMed] [Google Scholar]
  44. Millan MJ. Descending control of pain. Progress in Neurobiology. 2002;66:355–474. doi: 10.1016/s0301-0082(02)00009-6. [DOI] [PubMed] [Google Scholar]
  45. Ossipov MH, Morimura K, Porreca F. Descending pain modulation and chronification of pain. Current Opinion in Supportive and Palliative Care. 2014;8:143–151. doi: 10.1097/SPC.0000000000000055. [DOI] [PMC free article] [PubMed] [Google Scholar]
  46. Pinto M, Sousa M, Lima D, Tavares I. Participation of mu-opioid, GABA(B), and NK1 receptors of major pain control medullary areas in pathways targeting the rat spinal cord: implications for descending modulation of nociceptive transmission. The Journal of Comparative Neurology. 2008;510:175–187. doi: 10.1002/cne.21793. [DOI] [PubMed] [Google Scholar]
  47. Reynolds DV. Surgery in the rat during electrical analgesia induced by focal brain stimulation. Science. 1969;164:444–445. doi: 10.1126/science.164.3878.444. [DOI] [PubMed] [Google Scholar]
  48. Saffroy M, Torrens Y, Glowinski J, Beaujouan JC. Autoradiographic distribution of tachykinin NK2 binding sites in the rat brain: comparison with NK1 and NK3 binding sites. Neuroscience. 2003;116:761–773. doi: 10.1016/s0306-4522(02)00748-0. [DOI] [PubMed] [Google Scholar]
  49. Samineni VK, Grajales-Reyes JG, Copits BA, O’Brien DE, Trigg SL, Gomez AM, Bruchas MR, Gereau RW. Divergent modulation of nociception by glutamatergic and gabaergic neuronal subpopulations in the periaqueductal gray. ENeuro. 2017;4:ENEURO.0129-16.2017. doi: 10.1523/ENEURO.0129-16.2017. [DOI] [PMC free article] [PubMed] [Google Scholar]
  50. Samineni VK, Grajales-Reyes JG, Sundaram SS, Yoo JJ, Gereau RW, Gereau Iv RW. Cell type-specific modulation of sensory and affective components of itch in the periaqueductal gray. Nature Communications. 2019;10:1–15. doi: 10.1038/s41467-019-12316-0. [DOI] [PMC free article] [PubMed] [Google Scholar]
  51. Schindelin J, Arganda-Carreras I, Frise E, Kaynig V, Longair M, Pietzsch T, Preibisch S, Rueden C, Saalfeld S, Schmid B, Tinevez JY, White DJ, Hartenstein V, Eliceiri K, Tomancak P, Cardona A. Fiji: an open-source platform for biological-image analysis. Nature Methods. 2012;9:676–682. doi: 10.1038/nmeth.2019. [DOI] [PMC free article] [PubMed] [Google Scholar]
  52. Sun YGG, Chen ZFF. A gastrin-releasing peptide receptor mediates the itch sensation in the spinal cord. Nature. 2007;448:700–703. doi: 10.1038/nature06029. [DOI] [PubMed] [Google Scholar]
  53. Vanegas H, Barbaro NM, Fields HL. Tail-flick related activity in medullospinal neurons. Brain Research. 1984;321:135–141. doi: 10.1016/0006-8993(84)90689-9. [DOI] [PubMed] [Google Scholar]
  54. Wager TD, Atlas LY. The neuroscience of placebo effects: connecting context, learning and health. Nature Reviews. Neuroscience. 2015;16:403–418. doi: 10.1038/nrn3976. [DOI] [PMC free article] [PubMed] [Google Scholar]
  55. Wu ZH, Shao HY, Fu YY, Wu XB, Cao DL, Yan SX, Sha WL, Gao YJ, Zhang ZJ. Descending modulation of spinal itch transmission by primary somatosensory cortex. Neuroscience Bulletin. 2021;37:1345–1350. doi: 10.1007/s12264-021-00713-9. [DOI] [PMC free article] [PubMed] [Google Scholar]
  56. Yang Y, Guo L, Chen Z, Jiang X, Liu Y. Benefits and harms of NK1 R antagonists in pruritus: A systematic review and meta-analysis. Dermatologic Therapy. 2021;34:e14698. doi: 10.1111/dth.14698. [DOI] [PubMed] [Google Scholar]
  57. Yin JB, Wu HH, Dong YL, Zhang T, Wang J, Zhang Y, Wei YY, Lu YC, Wu SX, Wang W, Li YQ. Neurochemical properties of BDNF-containing neurons projecting to rostral ventromedial medulla in the ventrolateral periaqueductal gray. Frontiers in Neural Circuits. 2014;8:137. doi: 10.3389/fncir.2014.00137. [DOI] [PMC free article] [PubMed] [Google Scholar]
  58. Zhang L, Hammond DL. Substance P enhances excitatory synaptic transmission on spinally projecting neurons in the rostral ventromedial medulla after inflammatory injury. Journal of Neurophysiology. 2009;102:1139–1151. doi: 10.1152/jn.91337.2008. [DOI] [PMC free article] [PubMed] [Google Scholar]
  59. Zhang SJ, Ye J, Miao C, Tsao A, Cerniauskas I, Ledergerber D, Moser MB, Moser EI. Optogenetic dissection of entorhinal-hippocampal functional connectivity. Science. 2013;340:1232627. doi: 10.1126/science.1232627. [DOI] [PubMed] [Google Scholar]

Editor's evaluation

Rohini Kuner 1

This manuscript uses several complementary strategies to investigate and manipulate the activity of neurokinin 1 receptor-expressing neurons in the rostroventral medulla of mice in the context of itch sensation. The study delivers important insights into supraspinal itch processing and descending modulation of itch signals in the spinal cord.

Decision letter

Editor: Rohini Kuner1
Reviewed by: Mark Hoon2, Vijay K Samineni3

In the interests of transparency, eLife publishes the most substantive revision requests and the accompanying author responses.

Decision letter after peer review:

Thank you for submitting your article "Descending inhibition of itch by neurokinin 1 receptor (Tacr1) -expressing ON cells in the rostral ventromedial medulla" for consideration by eLife. Your article has been reviewed by 3 peer reviewers, and the evaluation has been overseen by a Reviewing Editor and Kate Wassum as the Senior Editor. The following individuals involved in review of your submission have agreed to reveal their identity: Mark Hoon (Reviewer #2); Vijay K Samineni (Reviewer #3).

The reviewers have discussed their reviews with one another, and the Reviewing Editor has drafted this to help you prepare a revised submission.

Essential revisions:

1. Perform further experiments to show more convincingly that descending inhibition of itch signal in the spinal cord is the mechanism the tacr1 rvm 'on' neurons are using to reduce scratching. Consider direct functional evidence for descending modulation, as opposed to indirect spinal consequences of local modulation in the RVM, and report the proportion of the tacr1 rvm neurons that send descending projections to the spinal itch circuitry.

2. Include essential controls in experiments involving DREADDs

3. Address the caveat of heterogeneity of tacr1 cells in association with the claim of their identity as ON cells; accordingly either provide additional evidence or temper down claims.

4. Undertake changes in text and figures recommended by reviewers under the 'recommendations' section of individual reviews, as appropriate

5. If you have not already done so, please ensure your manuscript complies with the eLife policies for statistical reporting: https://reviewer.elifesciences.org/author-guide/full Report exact p-values wherever possible alongside the summary statistics, degrees of freedom, and 95% confidence intervals. These should be reported for all key questions and not only when the p-value is less than 0.05.

6. Please also include a key resource table.

7. Please include housing details, including number of animals/cage (e.g., single v. pair v. group housed), light-dark cycle, cycle at test etc.

Reviewer #1 (Recommendations for the authors):

Decades of penetrating investigation of nociception at the level of the brainstem has revealed a complex circuitry including ON and OFF cells that activate or deactivate, respectively, in response to noxious input. This manuscript begins to unwind the relationship of these cells and circuits to the signaling of itch. The main conclusion, that a population of Tacr1 expressing neurons in the rostroventral medulla are "ON" cells and that activation of these cells suppresses scratching is supported by anatomical, behavioral, and functional data. The strengths of these conclusions rest on the use of several approaches to manipulate activity (optogenetic, chemogenetic, and pharmacological) and from single unit recordings in anesthetized animals, which provide a high level of internal consistency. The use of appropriate blinding, detailed analysis of sex differences, and several experiments offering detail on the precision of optogenetic activation are other methodological strengths. While the data are strong, the interpretations at times stray into areas of less certainty, and a singular vision is presented where alternate possibilities still exist.

One alternate possibility is that the activation of Tacr1 RVM neurons with substance P enhances nociception, and it is this enhanced pain that limits the scratching behavior, rather than a decrease in the itch sensation per se. This is supported by the lowered mechanical withdrawal threshold after DREADD activation of TacR1 neurons. Perhaps scratching becomes too painful, or perhaps the effectiveness of scratching is increased, and therefore fewer scratches are required for the same itch suppressing effect. Although Liu 2019 is cited in support (p. 20) of the authors' conclusions, there is not data in the present manuscript showing that the Tacr1 RVM ON cells under study directly modulate the spinal itch circuitry, or the GRPR cells.

The experiments in figure 2 are missing a control – DREADDs may have some constitutive activity, and therefore it is important to show with and without the DREADD activator CNO or clozapine (the authors use both interchangeably for some reason).

There is also the nagging problem that somehow motor systems are compromised by the activation of RVM neurons (the spinal cord appears to be fully labeled with mcherry Figure 4f, including the ventral horn). Although the contrasting findings between less scratching and more von Frey withdrawal suggest an intact system at the most basic level, more convincing would be showing enhanced scratching activity via inhibition of the Tacr1 RVM ON cells (a positive behavioral output). This would both put aside motor concerns and strengthen the functional role of these cells. Since according to the recordings in Figure 6c, ON these on cells have ongoing activity prior to the pinch stimulus, it should be possible to inhibit this tonic activity.

Figure 7 should include more of the findings from the results. No OFF cells are represented, lack of involvement of 5HT not shown.

Finally, the text generally needs more methodological details to understand the experiments. I realize this is a trend with some journals to put the methods at the end, which is fine, but additional basic information must be presented to understand and interpret the experiments. Specific instances are listed below.

Line 78+ state briefly what prep is being used (anesthetized, in vivo).

Indicate volume and concentration of drugs (ie substance P, hist, cq). This could even be in figure legend.

Figure 1 (also Figure 6) Please confirm accuracy of the Bregma coordinates.

Line 86: “enhancement of responses lasted 1 hr” please show.

Figure 1 e: it looks like blue light is shining in this figure. Please use a different style for clarity.

Figure 2 – Are the figures a and e mixed up?

Figure 2 – I couldn't understand the value of including i-k, seems duplicative.

Figure 2 – legend “mean number of c-fos”, but figure shows percentage, correct; also see line 119-121; again, this needs a no CNO control.

Figure 3B would be more convincing for the authors’ statement that “expression of hM3Dq-mcherry was limited to the RVM” if the area outside the RVM was included in the figure.

Data between Figure 4 and Figure 3 are a bit different re: von Frey. Please explain the added value of the tac1rcre-er mice versus the previous mouse line and offer some insight into this discrepancy.

Figure 5 – this figure was awkward (particularly a and b). What is meant by the bars and stars on the side? The shades of green are hard to distinguish. The legend states “imiquimod…produced a significant increase in spontaneous scratching” – but I could not identify the statistical test used. There is an indication that something is “red”, but I see no red in the figure. Why is clozapine used instead of CNO? Why are imiquimod-evoked scratches “spontaneous”?

Line 187 – “tip extended a few millimeters” This seems too far. I’m not sure it would work properly. The methods says micrometers.

Line 189 (and elsewhere), light used is given as less than 5mW. This is vague, and could be 0mW.

Line 191 – “faithfully entrained 10Hz (6d)” but only 5 hz is shown.

Line 219 – “doublet” action potentials. I was expecting a picture.

Line 227 – Figure 4 (should be supplemental).

Line 234 – reword; it sounds like the actual force of the limb withdrawal was greater.

Line 246 – Please define what is the fev-cre line upon first introduction.

Line 305 – reference to Figure 4, but I think maybe Figure 2 is meant?

Reviewer #2 (Recommendations for the authors):

Strengths: The results from this study broadly indicate that RVM TacR1-neurons can alter itch responses and are mainly ON-cells which are new findings that define important elements in the itch sensory system.

Weaknesses: neurochemical experiments suggest that TacR1 is expressed in a heterogeneous population of RVM neurons. Further, the results from the use of two different mouse lines where TacR1-neurons are chemogenetically manipulated, differ from each other. These two issues make it difficult to completely unambiguously interpret results from chemogenetic experiments.

Overall, the data in this manuscript is interesting and show important new findings. However, several of the interpretations made in the manuscript go beyond the results described and a revision of the manuscript is needed to reasonably reflect the presented results. There are also other questions about the Results and errors in the way that data is presented. First, the TacR1-neurons recorded from and manipulated are not directly shown to be descending. This is inferred from other studies and spinal cord staining but, what proportion of them are descending and could some of the effects reported be through indirect pathways? Further, the study does not directly establish that the effects seen occur in the spinal cord. For instance, some of the TacR1 neurons may be interneurons and some of the effects of activating TacR1 neurons may occur in other brain regions. Second, another concern is the incomplete characterization of the TacR1-cre mouse lines; the second TacR1-creERT2 mouse line does not seem to have been neurochemically characterized and the characterization of the one TacR1-cre line is not thorough (see comments below). Third, the parts of the manuscripts on 5HT signaling are not well connected with the other parts of the paper and need to be integrated or removed. Fourth, although it is not unreasonable to suggest that the OFF-cells are downstream of ON-cells, the manuscript does not provide direct proof of this; TTX, GABA inhibition experiments and measurements of latency responses relative to optogenetics are probably required to demonstrate this.

I realize that all these requests would likely require considerable additional experimentation, and this may go beyond eLife guidelines. In the absence of performing new extra studies, the title, abstract and discussion will all need revisions to tone down conclusions to better reflect the data presented.

Below is an itemized list of concerns:

a) The data in figure1c is a bar graph, scatter plots should be used to allow a better assessment of the data.

b) Figure 1h, are the values on the y-axis correct? (8-2g, presumably 0.8g to 0.2g). This increase in sensitivity would be better described as a mild mechanical sensitization, similarly data in figure 3 should be described as mild-mechanical sensitization.

c) Figure 2, panels a and e have been switched. The staining for mCherry is different for each panel, what is the reason for this? – are they the same region or is A in the reticular region of the RVM and other images taken in the midline? i.e. were images taken from the same area of the RVM and if not, how was data normalized? Since the RVM encompasses several separate brain nuclei, the authors should detail these, for instance; raphe magnus, raphe pallidus, PGRNL, and MARN. In addition, in the electrophysiology experiments described in figure 6, ON-cells and OFF-cells were probed in many areas of the general medulla – was the characterization of the lines used also similarly widely distributed? Images in figure 2 (or a new supplement) should be of whole coronal sections of the medulla in order to see the locations of all the TacR1-neurons in the medulla.

d) Images in figure 2ab and c indicate 4 double positive and 4 TacR1 alone neurons, but the graph reports there is an 80% overlap. A move representative image should be presented.

e) Figure 2d, h, and l should be presented as scatter plots.

f) Figure m, n, o same comment as d), an image showing more neurons would better illustrate the data presented in panel p.

g) Figure 2m shows endogenous TacR1 expression and does not report cells where cre mediated excision occurs. Therefore, this does not prove that cells chemogenetically manipulation or recorded from are GABAergic. The ISH should be on tissues from TacR1-cre mice infected with AAV-cherry and if different serotypes of AAV were used in different experiments this should be noted as a limitation of the study.

h) All numbers of counted neurons for figure 2 need to be reported.

i) Were similar neurochemical characterization studies performed on the second TacR1-creERT2 line? If they were not, then the authors should acknowledge that the differences in results between these lines may be because different populations of neurons might be activated.

j) Line 115, sentence needs rewording.

k) Line 129, this sentence repeats the previous one and is less accurate giving a false impression the presented data shows that all Tacr1-neurons are inhibitory. Similar inaccuracies are repeated throughout the manuscript.

l) Are the TacR1-neurons the same as those described in Francois et al. 2017?

m) Different serotypes of AAV are used in Figure 3 and 4, a comment on this should be added as this may additionally contribute to the differences in effects of chemogenetic manipulation between these experiments.

n) 50ug of chloroquine produces different numbers of itch bouts in controls in figure 3 and 4, what's the reason?

o) Given that these experiments are suggested to confirm each other, is there a reason why in figure 3 von Frey thresholds are not affected but in figure 4 they are? This difference needs to be acknowledged in interpreting these results.

p) Figure 4e, the staining for mCherry seems to extend beyond the cell bodies of neurons in the raphe magnus (dorsal and lateral), are these dendrites and could the AAV retrogradely infect, in the RVM, terminals of neurons in other brain regions? A larger image would help resolve whether the staining is from dendrites.

q) Figure 4f, the contrast used for this image makes it hard to see any staining. Is there bilateral staining and which lamina are these terminals projecting to and are projections the same in all spinal cord segments?

r) The electrophysiology of optogenetic responses of ON and OFF-cells- optotagging. What were the waveforms and latency of the proposed directly activated versus indirectly activated neurons and were there any indications there is more than one class of ON-cells? Was supervised/unsupervised clustering used to distinguish cell-types? Even though the evoked response reliability of ON-cells is high, the latency of these neurons in slow compared to other optotagging studies reported. What is the response reliability of OFF-cells is the distribution of latency for ON-cells suggest more than one class? And what's the average latency of response of OFF-cells? Were experiments with NBQX and bicuculine performed to show direct activation?

s) Figure 6b shows a small area of where recordings were made (versus panel j). A larger view would be good.

t) Were studies performed to show ON-cells are synaptically connected to OFF-cells? I.e. for OFF-cells could responses be blocked with TTX, or since the TacR1-cells are suggested to be mainly GABAergic are these responses blocked with bicuculline? Without these results, it is possible that TacR1 is expressed in both ON and OFF-cells.

u) The section on sex differences is odd. It needs to be integrated with the other parts of the paper.

v) Section of 5HT RVM cells does not connect with other parts of the paper and basic control data are not presented for these studies. I would recommend this section be removed as it does not add to the main theme of the paper and the data is too preliminary.

Reviewer #3 (Recommendations for the authors):

The manuscript looks at contributory role of a RVM Tacr1-expressing neurons in the acute and chronic pruritis. Authors demonstrate that RVM ON and neutral cells express Tacr1 and send projections to the spinal cord, implicating possible role in descending inhibition of spinal pruriceptive transmission. Overall, the study used well established and complementary methods to support their findings. This work fills significant gaps in the descending itch literature. Largely I think the paper is well presented, data supports the conclusions of the study. There are some concerns regarding the figures. The manuscript could improve if authors address these concerns.

1. Authors show that in Figure 1, SP injections into the RVM significantly reduced evoked itch and von Frey behaviors. It is confusing as the data is presented, authors say they are using Paired student test. But in the methods, it is not clear if they use same mice for saline and SP injections. Paired T test would be appropriate if pre and post were conducted on same mice.

2. SP microinjections did not always decrease evoked itch behaviors. Any differences observed in the location of injections that explains this variance in the data?

3. Figure 2a and 2e seemed to be switched. Authors should address this.

4. cFos is a nuclear protein. In the images authors show, it seems like they are just capturing background autofluorescence instead of cFos signal.

5. Authors claim Tacr1 neurons are Vgat+ve. Could authors comment on if they have looked to see any Tacr1 neurons are Vglut positive. It is possible because it has not been tested there could be neurons Tacr1+ve neurons that could be Vglut+ve.

6. In Figure 3, authors seem to use same panels for histamine and chloroquine evoked scratching.

7. Figure 4b is not clearly explained. What treatment was done to these mice to elicit spontaneous scratching?

8. Authors should make Figure 6 to figure 2. Current location of this figure is not appropriate.

9. In opto-tagging experiments, authors have found that all the recorded neutral cells are excited by the optical stimulation. This indicates both RVM ON and neutral cells express Tacr1. But authors do not acknowledge this in most of the study.

10. Current study shows role for RVM Tacr1 neurons in itch modulation, there is no direct evidence to show that its only via ON cells not via neutral cells or both.

[Editors' note: further revisions were suggested prior to acceptance, as described below.]

Thank you for resubmitting your work entitled "Inhibition of itch by neurokinin 1 receptor (Tacr1) -expressing ON cells in the rostral ventromedial medulla in mice" for further consideration by eLife. Your revised article has been evaluated by Kate Wassum (Senior Editor) and a Reviewing Editor.

The manuscript has been improved but there are some remaining issues that need to be addressed, as outlined below:

1. Owing to concerns about the quality of cFos staining, we recommend that these are deleted.

2. Revise the legend to Figure 2 and ensure that there are no inconsistencies with the text.

3. Correct textual errors as outlined by Review#1.

4. Specify the statistical analysis performed on results shown in Figure 4D.

5. Provide a correct reference for the text on line 59.

6. Please ensure your manuscript complies with the eLife policies for statistical reporting: https://reviewer.elifesciences.org/author-guide/full Report summary statistics (e.g., t, F values) and degrees of freedom, exact p-values, and 95% confidence intervals wherever possible. These should be reported for all key questions and not only when the p-value is less than 0.05.

Reviewer #1 (Recommendations for the authors):

The authors made a good faith attempt to validate the more ambitious claims from the original submission for which additional evidence was requested and was mostly unsuccessful. The manuscript is now more modest, yet still contributes significantly to our understanding of brainstem processing of scratching behavior in rodents. The main conclusion, that activation of Tacr1 expressing ON cells in the RVM reduces itch-evoked scratching, is supported by the data. The authors have also corrected some errors and improved some figures and clarified text. A number of careless errors still remain, however (listed below), and although the original hypothesis for a descending mechanism was unable to be supported by experimental evidence, the discussion still reaches this original conclusion with both hands.

Line 247 – "Importantly, our results support a role for these neurons in descending inhibition of acute and chronic itch." The results do not address descending inhibition.

It's a shame that a few more cells like in Figure 1 from the response to reviewers could not be found.

Here is a list of items that could be improved:

Figure 2: Legend and Results text: There are ambiguities regarding the percentages reported that should be written more clearly. For example: "(D) 84% of cells exhibited co-localization of tacr1 and mcherry" p32. Does this mean 84% of all cells in RVM? // "…there was significant increase in the number of c-fos positive cells following ip administration of clozapine…" p.6 – is this a percent of the total cells in RVM or a percent of mcherry-labelled cells? It is reported that the number of such cells is increased, but then percentages are reported and the ratios are not clearly defined.

Figure 1: Please include blue and red indicators for SP and vehicle in the actual figure.

3A and B are not mentioned in the results text.

Line 136 – says figure 4D, maybe is referring to 3D?

Line 137 – Figure 4E, maybe is referring to 3E?

Figure 4 (D) "Imiquimod induced significant increases in alloknesis scores on day 1, 3 and 5 of treatment in DREADDs (dark blue) and vector control (dark green) mice." Presumably, this was compared to day 0, I could not find statistics for this.

5D – results text states 10 Hz, but figure and figure legend say 5 Hz.

5E – the description of this in the results does not match the image in the panel. The panel appears to show a sustained light for 10ms and a burst of APs toward the end. Perhaps there is a better way to illustrate this experiment.

Maybe 6F refers to 5F?

5j is not mentioned in the results text.

Line 59 – I do not think Carstens 2020 is the ideal citation for "[GRPR cells] are considered essential for spinal itch transmission" – that claim and finding belong to the Chen lab and it would be most appropriate to cite their work here.

Reviewer #3 (Recommendations for the authors):

The revised manuscript by Follansbee et al. has addressed many of our previous concerns. The authors also revised the manuscript to reflect if the Tacr1 cells in the RVM are ON or neutral cells. The only concern I have is regarding the quality of the cFos staining that is demonstrated in the manuscript. cFos is a nuclear protein but the images the authors have provided do not reflect this. As cFos data does not change the outcome of the study, I suggest authors remove this data from the final manuscript for publication.

eLife. 2022 Aug 16;11:e69626. doi: 10.7554/eLife.69626.sa2

Author response


Essential revisions:

1. Perform further experiments to show more convincingly that descending inhibition of itch signal in the spinal cord is the mechanism the tacr1 rvm 'on' neurons are using to reduce scratching. Consider direct functional evidence for descending modulation, as opposed to indirect spinal consequences of local modulation in the RVM, and report the proportion of the tacr1 rvm neurons that send descending projections to the spinal itch circuitry.

We thank the reviewers for this excellent comment. We attempted to perform several functional experiments to demonstrate that the descending component of RVM activation was necessary for inhibition of spinal itch transmission. We first attempted to record from lumbar itch sensitive neurons which received an AAV-DIO-ChR2-eYFP injection in the RVM of Tacr1-cre mice. Once an itch sensitive neuron was identified we applied 10 hz blue light stimulation to the spinal cord to selectively activate the descending fibers of RVM Tacr1 +/ChR2 + neurons (Author response imge 1). Unfortunately, technical difficulties limited the number of pruritogen-sensitive spinal neurons we were able to record. In the provided example we did observe a clear inhibition of chloroquine evoked activity during blue light stimulation which returned once the stimulation ended. However, given the low sample size this is only anecdotal which we will not include in the revision.

Author response image 1. Response of spinal neuron to intradermal injection of chloroquine (CLQ) is suppressed by optogenetic stimulation in RVM.

Author response image 1.

(a) diagram of experimental design. AAV5-DIO-ChR2-eYFP was injected into the RVM of Tacr1 cre mice. (B) A CLQ responsive neuron was identified and inhibition observed following blue light stimulation to the spinal cord to activate ChR2-expressing descending fibers.

We also performed behavioral experiments in which we injected a retrograde AAV (AAV-RetroDIO-ChR2-mCherry) into the spinal cord of Tacr1 cre mice and subsequently implanted an optic fiber which terminated into the RVM. Using this paradigm, we hoped to transfect TacR1 + neurons which project to the lumbar spinal cord including the RVM Tacr1 neurons, which would be selectively activated with optogenetic stimulation. Unfortunately, these mice did not show a consistent decrease in pruritogen evoked scratching during optogenetic stimulation (Autor response image 2). This is likely the result of poor efficaciousness in the retrograde labeling of RVM projecting neurons, which were sparse when verified histologically (Author response image 2b,c).

Author response image 2. Inability of optogenetic stimulation of spinally projecting RVM Tacr1 expressing neurons to suppress scratching behavior.

Author response image 2.

(a) retrograde AAV was injected into the dorsal spinal cord of Tacr1 cre mice. An optic fiber was implanted into the RVM following viral injection. (b-c) Expression of mCherry was present, but weak, in the RVM. (d,e) Blue light stimulation did not significantly reduce histamine (d) or chloroquine (e) evoked scratching behavior. n = 6 group.

Previous studies have reported that 31% of RVM ON-cells project to spinal cord (Venegas et al., 1984) and that 42.5% of NK-1R-expressing RVM cells project to spinal cord (Pinto et al., 2008). While we believe that descending modulation of itch-signaling spinal neurons is the most parsimonious explanation for our results, our additional experiments do not provide unequivocal support for this. Rather than performing even more experiments, we opt instead to change the language of the manuscript. We maintain that descending modulation is still a possibility but cannot exclude the possibility of a supraspinal mechanism being responsible for our observed effect.

2. Include essential controls in experiments involving DREADDs

We have included the essential control experiments as it pertains to the DREADDs experiment. We compared ip saline versus clozapine in DREADDs expressing mice and found a significant increase in cfos positive cells following ip clozapine compared with ip saline. The results are provided in Author response image 3.

Author response image 3. Figure 3: cfos expression in Tacr1 DREADDs expressing mice following i.

Author response image 3.

p. Saline and i.p. Clozapine.

3. Address the caveat of heterogeneity of tacr1 cells in association with the claim of their identity as ON cells; accordingly either provide additional evidence or temper down claims.

We thank the reviewers for this comment. Most of the confusion relates to the 3 identified Neutral cells which were light sensitive.

However, given the absence of evidence that Neutral cells are involved in descending spinal modulation, we did not study this class further

and thus did not document what percentage of Neutral cells were light sensitive. We included these neutral cells to make the point that there are some cells in the RVM which express ChR2 but are not classified as ON cells. This could be the result of a small population of neurons which are not RVM ON cells but express Tacr1. We have included a description of this in the Discussion section.

4. Undertake changes in text and figures recommended by reviewers under the

'recommendations' section of individual reviews, as appropriate.

Addressed individually below.

5. If you have not already done so, please ensure your manuscript complies with the eLife policies for statistical reporting: https://reviewer.elifesciences.org/author-guide/full Report exact p-values wherever possible alongside the summary statistics, degrees of freedom, and 95% confidence intervals. These should be reported for all key questions and not only when the p-value is less than 0.05.

We have provided a statistics page which includes the summary statistics, degrees of freedom, 95% confidence intervals, and p-values for each experiment.

6. Please also include a key resource table.

Included.

7. Please include housing details, including number of animals/cage (e.g., single v. pair v. group housed), light-dark cycle, cycle at test etc.

Included.

Reviewer #1 (Recommendations for the authors):

Decades of penetrating investigation of nociception at the level of the brainstem has revealed a complex circuitry including ON and OFF cells that activate or deactivate, respectively, in response to noxious input. This manuscript begins to unwind the relationship of these cells and circuits to the signaling of itch. The main conclusion, that a population of Tacr1 expressing neurons in the rostroventral medulla are "ON" cells and that activation of these cells suppresses scratching is supported by anatomical, behavioral, and functional data. The strengths of these conclusions rest on the use of several approaches to manipulate activity (optogenetic, chemogenetic, and pharmacological) and from single unit recordings in anesthetized animals, which provide a high level of internal consistency. The use of appropriate blinding, detailed analysis of sex differences, and several experiments offering detail on the precision of optogenetic activation are other methodological strengths. While the data are strong, the interpretations at times stray into areas of less certainty, and a singular vision is presented where alternate possibilities still exist.

One alternate possibility is that the activation of Tacr1 RVM neurons with substance P enhances nociception, and it is this enhanced pain that limits the scratching behavior, rather than a decrease in the itch sensation per se. This is supported by the lowered mechanical withdrawal threshold after DREADD activation of TacR1 neurons. Perhaps scratching becomes too painful, or perhaps the effectiveness of scratching is increased, and therefore fewer scratches are required for the same itch suppressing effect. Although Liu 2019 is cited in support (p. 20) of the authors' conclusions, there is not data in the present manuscript showing that the Tacr1 RVM ON cells under study directly modulate the spinal itch circuitry, or the GRPR cells.

We agree with the Reviewer’s last sentence and this has been addressed above. We agree that a pronociceptive effect of ON cells might reduce itch and mention this possibility; however there is currently limited evidence to support this idea.

The experiments in figure 2 are missing a control – DREADDs may have some constitutive activity, and therefore it is important to show with and without the DREADD activator CNO or clozapine (the authors use both interchangeably for some reason).

We thank the reviewer for their comments. Our c-fos data (original manuscript Figure 2e-I; revised manuscript Figure 2 h), does show that there is some baseline activity in the DREADDs expressing neurons without clozapine. This is not surprising since most RVM ON cells we recorded from (Figure 6 and Supp Figure 3) exhibited baseline firing and were transiently excited by the ip injection. That is why we chose to directly compare the DREADDs activation with a control vector group, to demonstrate an increase in activity in the DREADDs positive cells following injection of clozapine. Our behavioral experiments are intrinsically controlled through ip injection of clozapine versus saline in the same animal. We performed the suggested experiment and compared i.p. saline versus i.p. clozapine in our DREADDs mice to confirm (Figure 2 i). We observed a similar result and have updated figure 2 to reflect this change.

There is also the nagging problem that somehow motor systems are compromised by the activation of RVM neurons (the spinal cord appears to be fully labeled with mcherry Figure 4f, including the ventral horn). Although the contrasting findings between less scratching and more von Frey withdrawal suggest an intact system at the most basic level, more convincing would be showing enhanced scratching activity via inhibition of the Tacr1 RVM ON cells (a positive behavioral output). This would both put aside motor concerns and strengthen the functional role of these cells. Since according to the recordings in Figure 6c, ON these on cells have ongoing activity prior to the pinch stimulus, it should be possible to inhibit this tonic activity.

We thank the reviewer for this excellent suggestion. However, we did not perform the experiment with inhibitory DREADDs and rely on the observation of enhanced mechanical withdrawal as evidence against generalized motor suppression.

Figure 7 should include more of the findings from the results. No OFF cells are represented, lack of involvement of 5HT not shown.

We thank the reviewer for this suggestion. Given some of the comments from other reviewers we have decided to remove this summary figure due to limited direct evidence that RVM Tacr1 expressing neurons exert an effect on spinal pruriceptive transmission.

Line 78+ state briefly what prep is being used (anesthetized, in vivo)

Indicate volume and concentration of drugs (ie substance P, hist, cq). This could even be in figure legend.

Added.

Figure 1 (also Figure 6) Please confirm accuracy of the Bregma coordinates.

Bregma coordinates shown in Figure 1d and 5j were confirmed based on anatomical landmarks and intramedullary injection of blue dye at the injection site (for Figure 1d) or microscopic identification of lesions made at the intramedullary recording site (Figure 5j).

Line 86: "enhancement of responses lasted 1 hr" please show.

This is shown in Figure 1C. The potentiated ON cell response persists for the 60 minute window following SP injection.

Figure 1 e: it looks like blue light is shining in this figure. Please use a different style for clarity.

We agree and have updated the figure with a light gray color.

Figure 2 – Are the figures a and e mixed up?

We thank the author for this observation. The panels were mixed up and have been corrected in this revised version.

Figure 2 – I couldn't understand the value of including i-k, seems duplicative.

In these experiments we compared mice which received a viral injection containing the excitatory DREADD (e-g) or a control vector containing only mCherry (i-k). This way we can compare the increased c-fos expression in DREADD (+) cells with DREADD (-) cells. To improve clarity and reduce duplication we have removed the analysis for measurement of mean intensity and present only the percentage of positive cells.

Figure 2 – legend "mean number of c-fos", but figure shows percentage, correct; also see line 119-121; again, this needs a no CNO control.

We have performed a saline (i.p.) control. We observe an increase in the number of cfos positive cells following clozapine (ip) when compared with saline in DREADDs mice (updated Figure 2 h).

Figure 3B would be more convincing for the authors' statement that "expression of hM3Dq-mcherry was limited to the RVM" if the area outside the RVM was included in the figure.

We apologize for the narrowness of the imaging window. We have updated Figure 3 b with a highquality coronal image showing the distribution of mCherry following DREADD injection. This shows that mCherry extends beyond the raphe nuclei into the adjacent areas that include nucleus gigantocellularis, which is included in Fields' definition of RVM.

Data between Figure 4 and Figure 3 are a bit different re: von Frey. Please explain the added value of the tac1rcre-er mice versus the previous mouse line and offer some insight into this discrepancy.

We thank the reviewer for this excellent observation. Figure 3 was the result established in our lab. Serendipitously, we found that our collaborating lab had performed a similar set of experiments which was consistent regarding the effect on itch related behavior (Figure 4). Since these two sets of experiments were conducted entirely independently, there were several differences in the experimental approach (Different Tacr1 cre lines, use of clozapine vs CNO, different labs, and different experimenters). We are not sure why the von Frey results differ between these two experiments, but speculate that it is related to the numerous differences in the experimental design. We have decided to move the results of our collaborators to the supplemental section to reduce confusion, since the results are largely duplicative. We wanted to include these results to highlight that this result was reproducible.

Figure 5 – this figure was awkward (particularly a and b). What is meant by the bars and stars on the side?

The bars and asterisks indicate the groups which were significantly different. We have included a modified version of this figure in the revised manuscript.

The shades of green are hard to distinguish.

We appreciate this comment. To better distinguish among the lines, we have increased the size of the symbols and have made the light green and light blue lines dashed. This helps the reader to differentiate the various lines and symbols.

The legend states "imiquimod…produced a significant increase in spontaneous scratching" – but I could not identify the statistical test used.

We have now included the statistical test used (paired t-tests) and correct the language used.

There is an indication that something is "red", but I see no red in the figure.

We apologize for this error. There are no red bars in the revised figure 4.

Why is clozapine used instead of CNO?

We used clozapine for all behavioral experiments except that shown in what is now Supplementary Figure 1 (conducted by the Pittsburgh laboratory, which used CNO). This is due to concerns mentioned in Gomez et al., 2017, which showed that CNO cannot cross the bloodbrain barrier, but instead breaks down into clozapine which can cross the blood-brain barrier and acts as a potent DREADDs agonist.

Why are imiquimod-evoked scratches "spontaneous"?

Imiquimod is applied ~23 hours prior to measurement of scratching behaviors, thus we call these scratches spontaneous since this is ongoing behavior.

Line 187 – "tip extended a few millimeters" This seems too far. I'm not sure it would work properly. The methods says micrometers.

We thank the reviewer for this observation. The electrode tip extended a few hundred microns past the end of the optic fiber. We have revised the manuscript.

Line 189 (and elsewhere), light used is given as less than 5mW. This is vague, and could be 0mW.

Agreed and we have revised.

Line 191 – "faithfully entrained 10Hz (6d)" but only 5 hz is shown.

This is a mistake and we have revised.

Line 219 – "doublet" action potentials. I was expecting a picture.

We have included an example in the supplemental figure 3d.

Line 227 – Figure 4 (should be supplemental).

Agreed.

Line 234 – reword; it sounds like the actual force of the limb withdrawal was greater.

Agreed, this has been corrected.

Line 246 – Please define what is the fev-cre line upon first introduction.

At the suggestion of the other reviewers we have removed our results pertaining to serotonergic neurons from this paper.

Line 305 – reference to Figure 4, but I think maybe Figure 2 is meant?

The reviewer is correct and this has been revised.

Reviewer #2 (Recommendations for the authors):

Strengths: The results from this study broadly indicate that RVM TacR1-neurons can alter itch responses and are mainly ON-cells which are new findings that define important elements in the itch sensory system.

Weaknesses: neurochemical experiments suggest that TacR1 is expressed in a heterogeneous population of RVM neurons. Further, the results from the use of two different mouse lines where TacR1-neurons are chemogenetically manipulated, differ from each other. These two issues make it difficult to completely unambiguously interpret results from chemogenetic experiments.

Overall, the data in this manuscript is interesting and show important new findings. However, several of the interpretations made in the manuscript go beyond the results described and a revision of the manuscript is needed to reasonably reflect the presented results. There are also other questions about the Results and errors in the way that data is presented. First, the TacR1-neurons recorded from and manipulated are not directly shown to be descending. This is inferred from other studies and spinal cord staining but, what proportion of them are descending and could some of the effects reported be through indirect pathways? Further, the study does not directly establish that the effects seen occur in the spinal cord. For instance, some of the TacR1 neurons may be interneurons and some of the effects of activating TacR1 neurons may occur in other brain regions.

The Reviewer is correct and this comment is consistent with that of other Reviewers. For this reason, we have modified the text as described above.

Second, another concern is the incomplete characterization of the TacR1-cre mouse lines; the second TacR1-creERT2 mouse line does not seem to have been neurochemically characterized and the characterization of the one TacR1-cre line is not thorough (see comments below). Third, the parts of the manuscripts on 5HT signaling are not well connected with the other parts of the paper and need to be integrated or removed.

The section on serotonergic neurons has been removed as recommended.

Fourth, although it is not unreasonable to suggest that the OFF-cells are downstream of ON-cells, the manuscript does not provide direct proof of this; TTX, GABA inhibition experiments and measurements of latency responses relative to optogenetics are probably required to demonstrate this.

We agree.

I realize that all these requests would likely require considerable additional experimentation, and this may go beyond eLife guidelines. In the absence of performing new extra studies, the title, abstract and discussion will all need revisions to tone down conclusions to better reflect the data presented.

The revised text has toned down these conclusions.

Below is an itemized list of concerns:

a) The data in figure1c is a bar graph, scatter plots should be used to allow a better assessment of the data.

We thank the reviewer for this suggestion and have revised our graphs accordingly.

b) Figure 1h, are the values on the y-axis correct? (8-2g, presumably 0.8g to 0.2g). This increase in sensitivity would be better described as a mild mechanical sensitization, similarly data in figure 3 should be described as mild-mechanical sensitization.

The force in grams is labeled correctly. This represents the instantaneous force measurements using the electronic con Frey apparatus. We agree with describing as mild mechanical sensitization and we have revised accordingly.

c) Figure 2, panels a and e have been switched. The staining for mCherry is different for each panel, what is the reason for this? – are they the same region or is A in the reticular region of the RVM and other images taken in the midline? I.e. were images taken from the same area of the RVM and if not, how was data normalized?

The reviewer is correct, the panels were inadvertently switched and we apologize for this error. We have corrected in this current version. Each panel (a, e, and i) represents a different experiment. Panel a represents mCherry expression in the NK-1R counter-staining experiments, panel e from our DREADDs injections and panel i from our control vector injections. Images were taken from approximately the same region of the RVM.

Since the RVM encompasses several separate brain nuclei, the authors should detail these, for instance; raphe magnus, raphe pallidus, PGRNL, and MARN.

We thank the reviewer for this suggestion. We have provided an updated coronal image with borders for the Gigantocellular, raphe magnus, and raphe pallidus nuclei. The RVM, as described by Howard Fields, includes the midline raphe and adjacent reticular formation extending into the gigantocellular nucleus. We see most of the expression within the raphe magnus/pallidus nuclei, and extending dorsally and laterally into the gigantocellular nucleus, consistent with this definition of RVM.

In addition, in the electrophysiology experiments described in figure 6, ON-cells and OFF-cells were probed in many areas of the general medulla – was the characterization of the lines used also similarly widely distributed?

Similar to our previous recordings on RVM ON and OFF cells (Follansbee et al., 2018), the recording sites were broadly distributed, often into the gigantoceullar nucleus. There was no apparent difference in ON/OFF cell response based on anatomical location within this area.

Images in figure 2 (or a new supplement) should be of whole coronal sections of the medulla in order to see the locations of all the TacR1-neurons in the medulla.

We generated a coronal section image which has been used in the revised version of the manuscript (Figure 3b).

d) Images in figure 2ab and c indicate 4 double positive and 4 TacR1 alone neurons, but the graph reports there is an 80% overlap. A move representative image should be presented.

The graph panels were out of order. This has been addressed in the revised version and is more representative.

e) Figure 2d, h, and l should be presented as scatter plots.

Changed.

f) Figure m, n, o same comment as d), an image showing more neurons would better illustrate the data presented in panel p.

We appreciate the reviewer’s suggestion, however we wanted to use representative images as taken from our analysis, which best correlated with the mean reported. These images are the full size. I took several images from each brain and averaged for each mouse.

g) Figure 2m shows endogenous TacR1 expression and does not report cells where cre mediated excision occurs. Therefore, this does not prove that cells chemogenetically manipulation or recorded from are GABAergic. The ISH should be on tissues from TacR1-cre mice infected with AAV-cherry and if different serotypes of AAV were used in different experiments this should be noted as a limitation of the study.

We have removed the section pertaining to GABA colocalization.

h) All numbers of counted neurons for figure 2 need to be reported.

Agreed and included.

i) Were similar neurochemical characterization studies performed on the second TacR1-creERT2 line? If they were not, then the authors should acknowledge that the differences in results between these lines may be because different populations of neurons might be activated.

Previous Figure 4 (now supplemental Figure 1) shows the only data obtained from the second Tacr1 line. However, this second line was not as completely evaluated. We wanted to include these data because the experiments were conducted entirely independently (in the Pittsburgh lab) and highlight the reproducibility of our behavioral scratching results.

j) Line 115, sentence needs rewording.

Agreed and fixed.

k) Line 129, this sentence repeats the previous one and is less accurate giving a false impression the presented data shows that all Tacr1-neurons are inhibitory. Similar inaccuracies are repeated throughout the manuscript.

We agree with the reviewer and have changed our language throughout the manuscript to be more explicit and not misleading.

l) Are the TacR1-neurons the same as those described in Francois et al. 2017?

Francois et al. drove expression in GABAergic cells, so any RVM cells which project to the spinal cord and express GABA would have been manipulated. Sarah Ross has evidence that OFF cells are also GABAergic, so some of the neurons described by Francois et al. may have been OFF cells. Our optotagging experiments suggest that OFF cells do not express Tacr1, while many ON cells do. Francois suggested they were activating RVM ON cells due to the predominant behavioral effect (mechanical sensitization) following activation of RVM spinally projecting GABAergic neurons. We have some limited evidence that RVM ON cells express GABA, thus it is possible that Francois activated Tacr1-expressing RVM ON cells, but the population of neurons they activated was likely more extensive and not limited to RVM ON cells.

m) Different serotypes of AAV are used in Figure 3 and 4, a comment on this should be added as this may additionally contribute to the differences in effects of chemogenetic manipulation between these experiments.

We completely agree. These experiments were conducted independently, without either investigator being aware the other was also conducting a similar experiment, so we weren’t able to coordinate these details.

n) 50ug of chloroquine produces different numbers of itch bouts in controls in figure 3 and 4, what's the reason?

These experiments were performed by completely different investigators, independently, and in a different line of mice.

o) Given that these experiments are suggested to confirm each other, is there a reason why in figure 3 von Frey thresholds are not affected but in figure 4 they are? This difference needs to be acknowledged in interpreting these results.

The reviewer brings up a great point. These two experiments were conducted entirely independently, without knowledge of each other. Figure 3, was conducted by TF in the Carstens Lab while (Previous version Figure 4) was conducted by EN in the Ross lab. Thus, there were numerous differences including: Lab location, mouse line, virus serotype, behaviorist, behavior apparatus, DREADDs actuator (clozapine vs CNO), etc. We found the similarity of our results astounding and included both sets of data as validation of the reproducibility of our results. However, this led to confusion and we decided to put the secondary results from the Ross lab (Previous Figure 4) in the supplemental section and focus primarily on the results generated from the Carstens lab.

p) Figure 4e, the staining for mCherry seems to extend beyond the cell bodies of neurons in the raphe magnus (dorsal and lateral), are these dendrites and could the AAV retrogradely infect, in the RVM, terminals of neurons in other brain regions? A larger image would help resolve whether the staining is from dendrites.

The expression of mCherry is not limited to the cell bodies and we frequently see strong expression of mCherry throughout the entire neuron (mainly soma and dendritic field), but additionally in the axons. In our injections, we see strong expression of mCherry at the injection site in the RVM, but not a lot of expression elsewhere. A lower-power image of the brainstem has been included in revised figure 3b.

q) Figure 4f, the contrast used for this image makes it hard to see any staining. Is there bilateral staining and which lamina are these terminals projecting to and are projections the same in all spinal cord segments?

We agree and this image has been removed from the manuscript.

r) The electrophysiology of optogenetic responses of ON and OFF-cells- optotagging. What were the waveforms and latency of the proposed directly activated versus indirectly activated neurons and were there any indications there is more than one class of ON-cells?

We did not observe any striking difference in spike waveforms between different cell types. There was no indication of more than one class of ON cell.

Was supervised/unsupervised clustering used to distinguish cell-types?

No.

Even though the evoked response reliability of ON-cells is high, the latency of these neurons in slow compared to other optotagging studies reported.

The latency from optotagged neurons varies drastically across cell type and light intensity. We found it necessary to use latency, efficiency index and firing rate to determine whether the cell was responding directly. Another study of hippocampal cells (Zhang et al., 2013) reported latencies of similar duration (~9 msec) compared to our present data.

What is the response reliability of OFF-cells is the distribution of latency for ON-cells suggest more than one class?

Sorry, we don’t understand the question.

And what's the average latency of response of OFF-cells?

No OFF cells we recorded from responded with excitation to the light stimulus, but 6/12 responded with inhibition to the light stimulus.

Were experiments with NBQX and bicuculine performed to show direct activation?

No, we did not try to block synaptic transmission in these experiments because this paper was largely focused on Tacr1 expressing ON cells. But we thought the OFF cell response was of interest and wanted to include the observation in this manuscript. We did not try applying NBQX or bicuculine because it was too difficult to construct a microinjection/optic fiber/microelectrode device which would be required for these experiments and thus was beyond the scope of the present study.

s) Figure 6b shows a small area of where recordings were made (versus panel j). A larger view would be good.

We thank the reviewer for this comment. Unfortunately, at the time of these recordings, we were limited in our microscopy experiments and could only image at 20-40x. The injections for these experiments are quite similar to the injections made for our chemogenetic experiments (same injection coordinates and virus serotype). Figure 5b is not a lesion site but demonstration of expression of YFP, and thus ChR2.

t) Were studies performed to show ON-cells are synaptically connected to OFF-cells? I.e. for OFF-cells could responses be blocked with TTX, or since the TacR1-cells are suggested to be mainly GABAergic are these responses blocked with bicuculline? Without these results, it is possible that TacR1 is expressed in both ON and OFF-cells.

As mentioned above, RVM OFF cells were never excited by light, but were instead inhibited by optic stimulation. While Tacr1 expressing cells might be heterogenous, we have no evidence to suggest RVM OFF cells express Tacr1.

u) The section on sex differences is odd. It needs to be integrated with the other parts of the paper.

We agree with the reviewer and have integrated the sex differences in the revised manuscript.

v) Section of 5HT RVM cells does not connect with other parts of the paper and basic control data are not presented for these studies. I would recommend this section be removed as it does not add to the main theme of the paper and the data is too preliminary.

We agree and have removed this from the manuscript.

Reviewer #3 (Recommendations for the authors):

The manuscript looks at contributory role of a RVM Tacr1-expressing neurons in the acute and chronic pruritis. Authors demonstrate that RVM ON and neutral cells express Tacr1 and send projections to the spinal cord, implicating possible role in descending inhibition of spinal pruriceptive transmission. Overall, the study used well established and complementary methods to support their findings. This work fills significant gaps in the descending itch literature. Largely I think the paper is well presented, data supports the conclusions of the study. There are some concerns regarding the figures. The manuscript could improve if authors address these concerns.

1. Authors show that in Figure 1, SP injections into the RVM significantly reduced evoked itch and von Frey behaviors. It is confusing as the data is presented, authors say they are using Paired student test. But in the methods, it is not clear if they use same mice for saline and SP injections. Paired T test would be appropriate if pre and post were conducted on same mice.

We apologize for the confusion. In these experiments the same mice received both saline and SP and were analyzed using a paired t test.

2. SP microinjections did not always decrease evoked itch behaviors. Any differences observed in the location of injections that explains this variance in the data?

This is a distinct possibility, although we did not observe a correlation between injection location and the degree of suppression of scratching. Itch behavior is notoriously variable. Especially for saline injections that produce low initial scratch bouts, it could be a floor effect. Nonetheless, the overall decrease is significant and consistent across several lines of evidence.

3. Figure 2a and 2e seemed to be switched. Authors should address this.

Thank you for your observation. We have fixed this issue.

4. cFos is a nuclear protein. In the images authors show, it seems like they are just capturing background autofluorescence instead of cFos signal.

We thank the reviewer for this astute comment. We only measured cfos expression in mCherry positive cells. The acquisition settings were maintained constant for DREADDs and Control vector imaging and apologize for the bright image provided. In addition to the measurement of mean intensity, we also used the traditional method of visually counting cfos positive cells and achieved similar numbers.

5. Authors claim Tacr1 neurons are Vgat+ve. Could authors comment on if they have looked to see any Tacr1 neurons are Vglut positive. It is possible because it has not been tested there could be neurons Tacr1+ve neurons that could be Vglut+ve.

We have decided to remove the section colocalizing Tacr1 and GABA.

6. In Figure 3, authors seem to use same panels for histamine and chloroquine evoked scratching.

We thank the reviewer for this astute observation and apologize for this inadvertent error. We have replaced the panel showing chloroquine-evoked scratching behavior. The conclusions remain the same.

7. Figure 4b is not clearly explained. What treatment was done to these mice to elicit spontaneous scratching?

The spontaneous scratching observed was with no treatment. The mice used for this behavior demonstrated some amount of “baseline” scratching bouts, which were reduced during administration of CNO.

8. Authors should make Figure 6 to figure 2. Current location of this figure is not appropriate.

We thank the reviewer for this suggestion. We ultimately decided to remove this figure at the suggestion of other reviewers.

9. In opto-tagging experiments, authors have found that all the recorded neutral cells are excited by the optical stimulation. This indicates both RVM ON and neutral cells express Tacr1. But authors do not acknowledge this in most of the study.

We apologize for the confusion. This study did not include a comprehensive investigation of Neutral cells. Qualitatively speaking, the large majority of Neutral cells were not light sensitive, but I felt it important to acknowledge that some (n=3) were light sensitive. For example, in the neutral cells we recorded from, there was no baseline activity and they do not respond to nociceptive stimuli, so it would be impossible to record from similar cells if it weren’t for the occasional light sensitive neurons. We agree with the reviewer that we should explicitly mention the heterogeneity of Tacr1 expressing cells and have revised the manuscript to reflect this.

10. Current study shows role for RVM Tacr1 neurons in itch modulation, there is no direct evidence to show that its only via ON cells not via neutral cells or both.

We agree that our conclusions are on RVM Tacr1 expressing cells. However, our evidence, suggests that this is likely overlapping with RVM ON cells. The reviewer makes a good point, but we are reluctant to suggest a role for Neutral cells in descending itch modulation since their firing does not change in response to noxious stimulation.

[Editors' note: further revisions were suggested prior to acceptance, as described below.]

The manuscript has been improved but there are some remaining issues that need to be addressed, as outlined below:

1. Owing to concerns about the quality of cFos staining, we recommend that these are deleted.

We thank the editors and reviewers for this suggestion. We have removed the cfos experiments from the revised manuscript. Perhaps the cfos data could be included as a supplemental figure?

2. Revise the legend to Figure 2 and ensure that there are no inconsistencies with the text.

In addition to removing the cfos data from this figure, we have clarified the analysis used in the text and in the figure legend.

3. Correct textual errors as outlined by Review#1.

We have made the changes requested by Reviewer #1 (see individual points below).

4. Specify the statistical analysis performed on results shown in Figure 4D.

We have added this information to the figure legend as well as our summary statistics file.

5. Provide a correct reference for the text on line 59.

6. Please ensure your manuscript complies with the eLife policies for statistical reporting: https://reviewer.elifesciences.org/author-guide/full Report summary statistics (e.g., t, F values) and degrees of freedom, exact p-values, and 95% confidence intervals wherever possible. These should be reported for all key questions and not only when the p-value is less than 0.05.

We thank the editor for this reminder. In the author guide it states: “In some cases, it might be unwieldy to have this information in the legend of a figure, in which case the information can be provided in a source data file”. We have opted to include our statistics as source data files associated with each figure, which include the summary statistics and the raw data. We hope that this is satisfactory. If not, please let me know and I will add the statistics to the figure legends.

Reviewer #1 (Recommendations for the authors):

The authors made a good faith attempt to validate the more ambitious claims from the original submission for which additional evidence was requested and was mostly unsuccessful. The manuscript is now more modest, yet still contributes significantly to our understanding of brainstem processing of scratching behavior in rodents. The main conclusion, that activation of Tacr1 expressing ON cells in the RVM reduces itch-evoked scratching, is supported by the data. The authors have also corrected some errors and improved some figures and clarified text. A number of careless errors still remain, however (listed below), and although the original hypothesis for a descending mechanism was unable to be supported by experimental evidence, the discussion still reaches this original conclusion with both hands.

We thank the reviewer for their comments and careful review of our manuscript.

Line 247 – "Importantly, our results support a role for these neurons in descending inhibition of acute and chronic itch." The results do not address descending inhibition.

It's a shame that a few more cells like in Figure 1 from the response to reviewers could not be found.

We agree with the reviewer and are likewise disappointed that we could not find more neurons in an appropriate amount of time.

Here is a list of items that could be improved:

Figure 2: Legend and Results text: There are ambiguities regarding the percentages reported that should be written more clearly. For example: "(D) 84% of cells exhibited co-localization of tacr1 and mcherry" p32. Does this mean 84% of all cells in RVM?

We apologize for the ambiguity. For this analysis we evaluated Tacr1 expression specifically in the mCherry-expressing population. The result is the percentage of mCherry expressing neurons which also express Tacr1 and not all cells in the RVM. We have added clarifying statements in the figure legend as well as in the methods under Immunofluorescence.

// "…there was significant increase in the number of c-fos positive cells following ip administration of clozapine…" p.6 – is this a percent of the total cells in RVM or a percent of mcherry-labelled cells? It is reported that the number of such cells is increased, but then percentages are reported and the ratios are not clearly defined.

Again, we apologize for any ambiguity in our writing. At the behest of another reviewer, we have decided to remove the cfos labeling experiments.

Figure 1: Please include blue and red indicators for SP and vehicle in the actual figure.

Fixed.

3A and B are not mentioned in the results text.

Added.

Line 136 – says figure 4D, maybe is referring to 3D?

Corrected.

Line 137 – Figure 4E, maybe is referring to 3E?

Corrected.

Figure 4 (D) "Imiquimod induced significant increases in alloknesis scores on day 1, 3 and 5 of treatment in DREADDs (dark blue) and vector control (dark green) mice." Presumably, this was compared to day 0, I could not find statistics for this.

The reviewer is correct. For this statement, we conducted a 1 way ANOVA and compared days 1, 3, and 5 with Day 0. We will add these details into the figure legend and add the analysis to our statistics materials.

5D – results text states 10 Hz, but figure and figure legend say 5 Hz.

Fixed. The correct frequency is 5 Hz.

5E – the description of this in the results does not match the image in the panel. The panel appears to show a sustained light for 10ms and a burst of APs toward the end. Perhaps there is a better way to illustrate this experiment.

The results shown here are shown as a peristimulus time histogram (PSTH). For all the stimulation events (light pulses) applied at 2 Hz for this neuron, the action potentials within a 20 ms period are summated. This shows the average latency to respond as well as the jitter of response. It is our belief that this graph is informative and important to convey the consistency of this neuron to respond to the optic stimulation.

Maybe 6F refers to 5F?

Fixed.

5j is not mentioned in the results text.

Added.

Line 59 – I do not think Carstens 2020 is the ideal citation for "[GRPR cells] are considered essential for spinal itch transmission" – that claim and finding belong to the Chen lab and it would be most appropriate to cite their work here.

Agreed.

Reviewer #3 (Recommendations for the authors):

The revised manuscript by Follansbee et al. has addressed many of our previous concerns. The authors also revised the manuscript to reflect if the Tacr1 cells in the RVM are ON or neutral cells. The only concern I have is regarding the quality of the cFos staining that is demonstrated in the manuscript. cFos is a nuclear protein but the images the authors have provided do not reflect this. As cFos data does not change the outcome of the study, I suggest authors remove this data from the final manuscript for publication.

We thank the reviewer for this observation. Given the concerns about the specificity of the cfos labeling we have removed this data from the revised manuscript.

Associated Data

    This section collects any data citations, data availability statements, or supplementary materials included in this article.

    Supplementary Materials

    Figure 1—source data 1. Data for electrophysiolgical recordings and behavior from SP injection into the RVM.
    Figure 2—source data 1. Data for co-expression of DREADDs to Tac1r.
    Figure 3—source data 1. Behavioral data of RVM Tac1r DREADDs activation with clozapine.
    Figure 3—figure supplement 1—source data 1. Behavioral data of RVM Tac1r DREADDs activation with CNO.
    Figure 3—figure supplement 2—source data 1. Data for Clozapine administration effects on behavior.
    Figure 3—figure supplement 3—source data 1. Data for behavioral sex differences.
    Figure 4—source data 1. Data for RVM Tac1r activation in psoriasis model of chronic itch.
    Figure 5—figure supplement 1—source data 1. Data for efficiency index analsyis of optotagging experiments.
    Figure 5—figure supplement 2—source data 1. Data for firing rate analsyis of optotagging experiments.
    Figure 5—figure supplement 3—source data 1. Data for response latency of optotagging experiments.
    Transparent reporting form

    Data Availability Statement

    All data generated or analyzed during this study are included in the manuscript and supporting files.


    Articles from eLife are provided here courtesy of eLife Sciences Publications, Ltd

    RESOURCES