Abstract
Spatial visualization of glycans within clinical tissue samples is critical for discovery of disease-relevant glycan dysregulations. Herein, we develop an on-tissue derivatization strategy for sensitive spatial visualization of N-glycans from formalin-fixed paraffin-embedded (FFPE) tissue sections, based on amidation of sialic acid residues with aniline. The sialylated N-glycans were stabilized and given enhanced signal intensity owing to selective capping of a phenyl group to the sialic acid residue after aniline labeling. Proof-of-concept experiments, including determinations of sialylglycopeptide and N-glycans enzymatically released from glycoproteins, were performed. Further, mass spectrometry (MS) imaging of N-glycans on human laryngeal cancer FFPE tissue sections was conducted via matrix-assisted laser desorption/ionization mass spectrometry imaging (MALDI-MSI), based on our strategy for on-tissue amidation of sialylated N-glycans. We obtained higher sialylated N-glycan coverages for both the glycoproteins and cancer tissue samples, demonstrating that the detection sensitivity for sialylated N-glycans is notably improved by amidation derivatization. We also characterized N-glycan heterogeneity across the human laryngeal cancer tissue section, showing N-glycan dysregulation in the tumor region.
Keywords: Mass spectrometry imaging, MALDI, N-glycans, sialic acid, on-tissue derivatization, laryngeal cancer
Graphical Abstract
Introduction
Protein glycosylation is one of the major protein post-translational modifications in human biology and serves essential roles in many physiological events [1, 2]. Dysregulations of glycosylation have been found in many diseases such as cancer [3], Alzheimer’s disease [4], Huntington’s disease [5], etc. Exploring glycan alterations in biological samples at the molecular level is significant for enabling the discovery of disease-relevant glycan biomarkers, as well as for developing novel therapeutic strategies. Currently, mass spectrometry (MS) is one of the most informative tools to analyze glycans with superior sensitivity, specificity, and throughput [6–8]. While advances are being made in glycomics with conventional hyphenated MS approaches (including high-performance liquid chromatography ESI-MS (HPLC-ESI-MS) and capillary electrophoresis ESI-MS (CE-ESI-MS)) [9–13], elaborate glycan purification processes such as solid-phase extraction (SPE), gel filtration, and liquid-liquid extraction [6] are usually required prior to MS interrogation, resulting in the loss of spatial distribution information. Undoubtedly, acquisition of both molecular and spatial information of glycans is of vital importance to better understand their biological functions.
In response to this limitation, mass spectrometry imaging (MSI) is emerging as a promising approach to explore glycan heterogeneity among various tissue samples [14]. For instance, N-glycan heterogeneity in human laryngeal cancer, ovarian cancer, clear-cell renal cell carcinoma, hepatocellular carcinoma, etc. has been studied using matrix-assisted laser desorption/ionization mass spectrometry imaging (MALDI-MSI)[15–18]. Although MALDI-MSI provides a powerful tool for mapping the spatial localization of N-glycans across such tissue samples, it remains challenging to collect information on sialylated N-glycans due to in-source or post-source degradation of sialic acid residues. Furthermore, the high hydrophilicity of sialylated N-glycans and their inherent negative charges additionally deteriorate ionization efficiency in MS analysis. To enhance the ionization efficiency of sialylated N-glycans, chemical derivatization strategies – including esterification, amidation, and permethylation – have been adopted for labeling the sialylated N-glycans [19–21]. These chemical derivatization approaches typically stabilize the sialic acid residues, neutralize the negative charges from the carboxyl groups, and even facilitate differentiation of the sialic acid linkage positions [19, 20]. After labeling, the detection sensitivity for sialylated N-glycans is generally improved; however, because such glycan derivatization strategies are carried out under in-solution conditions, tedious post-derivatization sample clean-up is often required [21], resulting in loss of glycan spatial information and limiting the value of these derivatization techniques for MSI applications. In contrast, on-tissue chemical derivatization of glycans is an alternative strategy with direct applicability to MSI. For instance, Wuhrer et al. reported in situ MSI of linkage-specific sialic acid based on a two-step derivatization strategy [22] and Matsuo et al. showed in situ benzylamidation of N-glycans from mouse liver [23]. Recently, our group developed an on-tissue labeling strategy using a charge tag of Girard’s reagent P (GP) for MSI of N-glycans [17]. The merit of GP labeling was capping a permanent charge group to the reducing end of the N-glycans, which enhanced detection sensitivity during MSI. Despite this advance, we detected very few sialylated N-glycans following GP derivatization, possibly due to unfavorable in-source or post-source dissociation of sialic acid residues. Therefore, there remains a strong need for the development of on-tissue chemical derivatization methodologies that target sialylated N-glycans.
Herein, we develop an on-tissue derivatization strategy for sensitive MALDI-MSI of sialylated N-glycans from formalin-fixed paraffin-embedded (FFPE) tissue sections, based on amidation of sialic acid residues with aniline. First, we evaluated the chemical derivatization method by analyzing sialylglycopeptide and N-glycans enzymatically released from glycoproteins. Second, we conducted MSI to profile the spatial distribution of N-glycans in FFPE human laryngeal cancer tissue sections, showing altered glycosylation in the laryngeal tumor region compared to adjacent normal tissue.
Experimental
Chemicals and materials
Chemicals including acetonitrile, formic acid, methanol, ethanol, trifluoroacetic acid, citric acid, distilled water, ammonium bicarbonate, sodium chloride, aniline, 1-ethyl-3-(3-dimethylaminopropyl)carbodiimide hydrochloride (EDC), 1-hydroxybenzotriazole (HOBt) hydrate, and hydrochloric acid (HCl) (37%) were purchased from Fisher Scientific (Pittsburgh, PA, United States). Xylene, triethylammonium bicarbonate buffer (TEAB, 1.0 M), tris(2-carboxyethyl)phosphine hydrochloride (TCEP), α-Cyano-4-hydroxycinnamic acid (CHCA), and glycoproteins (bovine thyroglobulin (BTG) and fetuin from fetal bovine serum) were purchased from Sigma-Aldrich (St. Louis, MO, United States). Sialylglycopeptide standard (SGP) was purchased from Tokyo Chemical Industry (TCI) Ltd. (Tokyo, Japan). Peptide-N-glycosidase F (PNGase F) was obtained from Promega (Madison, WI, United States). Microcon-30 kDa centrifugal filters (30K MWCO) were purchased from Merck Millipore Ltd. (Darmstadt, Germany). Oasis HLB extraction cartridges (10 mg) were purchased from Waters Corporation (Milford, MA, United States). Indium tin oxide (ITO)-coated glass slides (25 mm × 75 mm × 1 mm) were purchased from Bruker (Billerica, MA, United States).
Human laryngeal cancer tissue samples were obtained from the University of Wisconsin Carbone Cancer Center Translational Sciences Biobank. All specimens were reviewed by a board-certified pathologist and given a pathologic diagnosis of squamous cell carcinoma. Tissues were formalin-fixed and paraffin-embedded following standard protocols. Tissue sections were cut at 10 μm thickness and mounted on ITO-coated glass slides. Adjacent tissue sections were used for hematoxylin and eosin (H&E) staining for comparative analysis. Note that the experiments with human laryngeal cancer tissues were approved by the Institutional Review Board of the University of Wisconsin School of Medicine and Public Health.
Histology staining
H&E staining was performed according to our previous study [17]. Briefly, the FFPE tissue sections were dewaxed by passing through xylene (3 × 2 min). After deparaffinization, the tissue slides were passed through a series of graded ethanol baths (100% ethanol (2 × 2 min), 95% ethanol (2 × 2 min), 70% ethanol (2 × 2 min)). Then, the slides were rinsed in water, followed by consecutive rinses in hematoxylin, 1% acid alcohol, and eosin, respectively. Afterwards, the slides were passed through ethanol to dehydrate the tissue and rinsed in xylene to render it completely transparent. A thin layer of mounting medium was applied before mounting with a glass cover slip. Images were obtained using a Nikon Eclipse TE2000-inverted microscope (Minato, Tokyo, Japan).
Preparation of N-glycans released from glycoproteins
Releasing of N-glycans from glycoproteins including BTG and fetuin from fetal bovine serum was performed by filter-aided N-glycan separation (FANGS)[24]. Protein stock solutions were prepared in 0.5 M TEAB buffer at a concentration of 10 mg mL−1. An aliquot of 50 μL protein solution was added into a 0.6 mL Eppendorf tube followed by adding 5 μL TCEP (0.5 M), and the mixture was heated at 95 °C water bath for 5 min for protein denaturation. Then, the sample was loaded into a Microcon-30 kDa centrifugal filter for buffer exchange with 100 μL of 0.5 M TEAB buffer three times. After that, 100 μL of 0.5 M TEAB, together with 4 μL of PNGase F enzyme (10 u μL−1), was added into the filter and the sample was incubated at 37 °C in a water bath for 16 h. The released glycosylamines were collected into the bottom tube by centrifuging (12000 xg, 10 min) and the filter was washed with 100 μL of 0.5 M TEAB buffer using centrifuging three times. The flowthrough was combined and dried in vacuo, followed by dissolving in 200 μL of 1% acetic acid and incubation at room temperature for 4 h, which converted the glycosylamines to glycans. The product was dried in vacuo and stored in −20 °C before use.
Amidation of sialylated N-glycans for MALDI-MS analysis
In-solution amidation of sialic acid residues with aniline was first investigated for the method development. Briefly, an aliquot of 50 μL of SGP (1 mg mL−1 in water) was added into a 0.6 mL Eppendorf tube following by adding aniline (0.5 M in methanol) and EDC (0.5 M in water) with a final concentration of 50 mM for both the aniline and EDC. Then, the mixture was shaken at 300 rpm for 3 hours at room temperature. After the reaction, sample clean-up was performed using Oasis HLB cartridges. The cartridge was conditioned with 1 mL of 95% ACN, 1 mL of water, and 1 mL of 95% ACN. Then, the sample was loaded into the cartridge together with 1 mL of 95% ACN. After sample loading, the cartridge was washed with 1 mL of 95% ACN for three times, and the labeled SGP was eluted with 0.8 mL of 50% ACN and 0.8 mL of water. The eluents were combined and dried in vacuo. The analysis of N-glycans enzymatically released from glycoproteins followed the above steps. N-glycans released from glycoproteins (50 μg) were labeled with aniline, while an equal amount of N-glycans skipped aniline derivatization for treatment as control samples. The labeled SGP and N-glycan samples were reconstituted with 10 μL water and subjected to MALDI-TOF-MS spotting analysis.
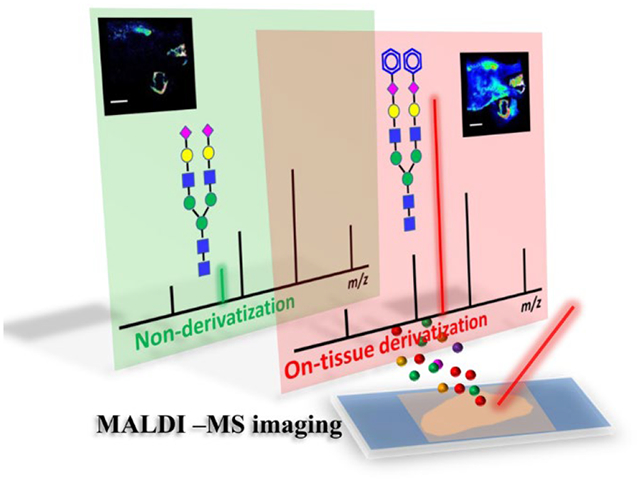
For on-tissue derivatization of FFPE tissue section samples, the schematic experimental workflow is shown in Figure 1. The FFPE tissue section slides were placed on a heating plate at 60 °C for 20 min for enhancing the adherence of the tissue section on the ITO glass slide. Then, the tissue slides were deparaffinized by washing with xylene three times. After dewaxing, the tissue slides were sequentially rinsed with 100% ethanol, 95% ethanol, and 70% ethanol, three times for each solvent (2 min each). Afterwards, on-tissue derivatization of sialylated N-glycans was performed by incubating the tissue slides in derivatization solution (50 mM aniline, 50 mM EDC and 50 mM HOBT in 50% ACN, pH ≈ 6) at room temperature for 3 h. Following derivatization, the tissue slides were washed by rinsing in 50% ethanol three times (5 min each) to remove the excess derivatization reagents on the tissue. Following the rinsing, the slides were dried in vacuo at room temperature. To release N-glycans, an aliquot of 20 μL of PNGase F (10 u μL−1) dissolved in 380 μL of 50 mM ammonium bicarbonate solution was prepared, and the enzyme solution was sprayed onto the tissue sections via a M5 Sprayer (HTX Technologies, Carrboro, NC) with parameters including flow rate of 20 μL min−1, spray nozzle temperature of 35 °C, nozzle nitrogen gas pressure of 8 psi, moving velocity of 800 mm min−1, tracking space of 2 mm, spraying passes of 8 passes, and drying time of 30 s. Then, tissue sections were incubated in a humid chamber at 37 °C for 12 h. After incubation, CHCA matrix (5 mg mL−1 in 70% ACN with 0.1% TFA) was applied onto the tissue sections via the M5 sprayer with parameters including flow rate of 100 μL min−1, spray nozzle temperature of 75 °C, nozzle nitrogen gas pressure of 10 psi, moving velocity of 100 mm min−1, tracking space of 3 mm, spraying passes of 8 passes, and drying time of 30 s. For control experiments, serial tissue sections were processed using the same workflow with the exception of the on-tissue derivatization step.
Figure 1.

Schematic diagram depicting the workflow for the on-tissue labeling of sialylated N-glycans using aniline for MALDI-MS imaging.
Data acquisition and analysis
All MALDI-MS experiments were carried out using a RapifleX MALDI TOF mass spectrometer (Bruker Scientific, LLC, Bremen, Germany) coupled with a Smartbeam 3D Nd:YAG (355mm) laser. Images were acquired at 50 μm spatial resolution under positive detection mode at mass range of m/z 900–4000 and 100 shots per pixel. The Smartbeam laser energy was set to 40%. The ion source, PIE, and lens voltages were set to 20.000 kV, 2.670 kV, and 11.600 kV, respectively. The reflector voltages were set at 20.850 kV, 1.085 kV and 8.600 kV. The MSI data were acquired with a sampling rate of 1.25 GS s−1, and baseline subtraction was performed during the MS imaging data acquisition with default parameters. For each measurement, the instrument was calibrated using the red phosphorus. MSI data were further processed using SCiLS Lab 2020b Pro and FlexImaging v5.0 (Bruker Scientific, LLC, Bremen, Germany) for ion image visualization with data normalized to total ion count (TIC), and hotspot removal was performed on all loaded images. All MALDI-TOF MS data were acquired by running at least three replicates. The compositions and structures of N-glycans were tentatively assigned by searching across the UniCarbKB database (http://www.glygen.org) with mass tolerance within 50 ppm. The observed N-glycans from the full mass spectra were annotated by using the GlycoWorkbench [25] (https://code.google.com/archive/p/glycoworkbench/). It is worth mentioning that more confident chemical identification of the N-glycan compositions could be achieved by using tandem MS analysis.
Results and Discussion
Derivatization of sialic acid residues with aniline
The schematic diagram of labeling sialic acid residues with aniline is shown in Scheme S1. Derivatization of sialic acid residues on sialylated glycans using aniline is achieved through a condensation reaction between the carboxyl group of sialic acid and the amino group of aniline, which form an amidated conjugate of the labeled N-glycan. After the conjugation, a mass increment of 75.047 Da is observed when compared to the original sialic acid residue. Multiple aniline tags would attach to a sialylated N-glycan with more than one sialic acid residue. It is noted that derivatization of N-glycans with aniline through reductive amination has been reported in previous studies, in which the reducing end of the N-glycan is tagged by the aniline under the presence of a reducing reagent such as sodium cyanoborohydride [26–29]. Nevertheless, labeling of the sialic acid residues of sialylated N-glycans by aniline through amidation has rarely been explored.
To conduct proof-of-principle evaluation of the labeling of sialic acid residues using aniline, SGP standard was used for method development. The SGP has a bi-antennary N-glycan bearing a short peptide fragment of Lys-Val-Ala-Asn-Lys-Thr [30, 31]. The N-glycan part of the SGP contains two sialic acid residues located at the end of each antenna. Together, the SGP molecule contains three carboxyl groups from the two sialic acid residues and the C-terminal of the peptide fragment. For labeling the SGP, an aliquot of 50 μL of SGP (1 mg mL−1 in water) were mixed with aniline and EDC with a final concentration of 50 mM for both the aniline and EDC. After the derivatization, sample clean-up was performed using HILIC cartridges and the sample eluents were dried in vacuo. Then, the samples were reconstituted with 10 μL water and subjected to MALDI-TOF-MS spotting analysis. As shown in Figure 2, the derivatization results suggested that aniline works well to afford complete amidation of all three carboxyl groups. For the underivatized SGP, the ion peak at m/z 2575.05 is derived from the native SGP (m/z 2866.17) with one sialic acid residue lost due to in/post-source degradation (Figure 2a). After aniline labeling, the labeled SGP detected at m/z 3091.15 became the dominant ion peak in the mass spectrum without any significant fragmentation, while the native SGP signal (m/z 2866.17) was absent (Figure 2b). Thus, complete labeling of SGP was achieved following derivatization, confirmed by the lack of detection of native SGP. This result clearly indicated that the SGP was stabilized via the aniline labeling. Note that some low abundance peaks in the mass range of m/z 3000–3100 might be related with some side reactions (Figure S1), but these side reactions occurred at a low-level as the expected labeling product (m/z 3091.146) was the predominant ion peak in the mass spectra. Notably, the signal intensity of the labeled SGP (signal-to-noise (S/N) = 299) was enhanced by ~25-fold over the native form (S/N = 53). This enhanced detection sensitivity of the SGP via aniline labeling might be related to decreased hydrophilicity of the SGP molecule as the original three carboxyl groups in SGP were capped by phenyl groups following aniline derivatization. Recent studies reported the use of other amidation reagents such as dimethylamine and benzylamine for the labeling of the sialylated N-glycans [22, 23]. Usually, it requires multi-step labeling or working with dipolar aprotic solvent condition. In comparison with previous studies, the advantages of aniline amidation of sialylated N-glycans include high reaction efficiency, simplicity, and compatibility with the aqueous media for amide coupling of the sialylated N-glycans.
Figure 2. MALDI-TOF-MS spectra obtained from SGP:
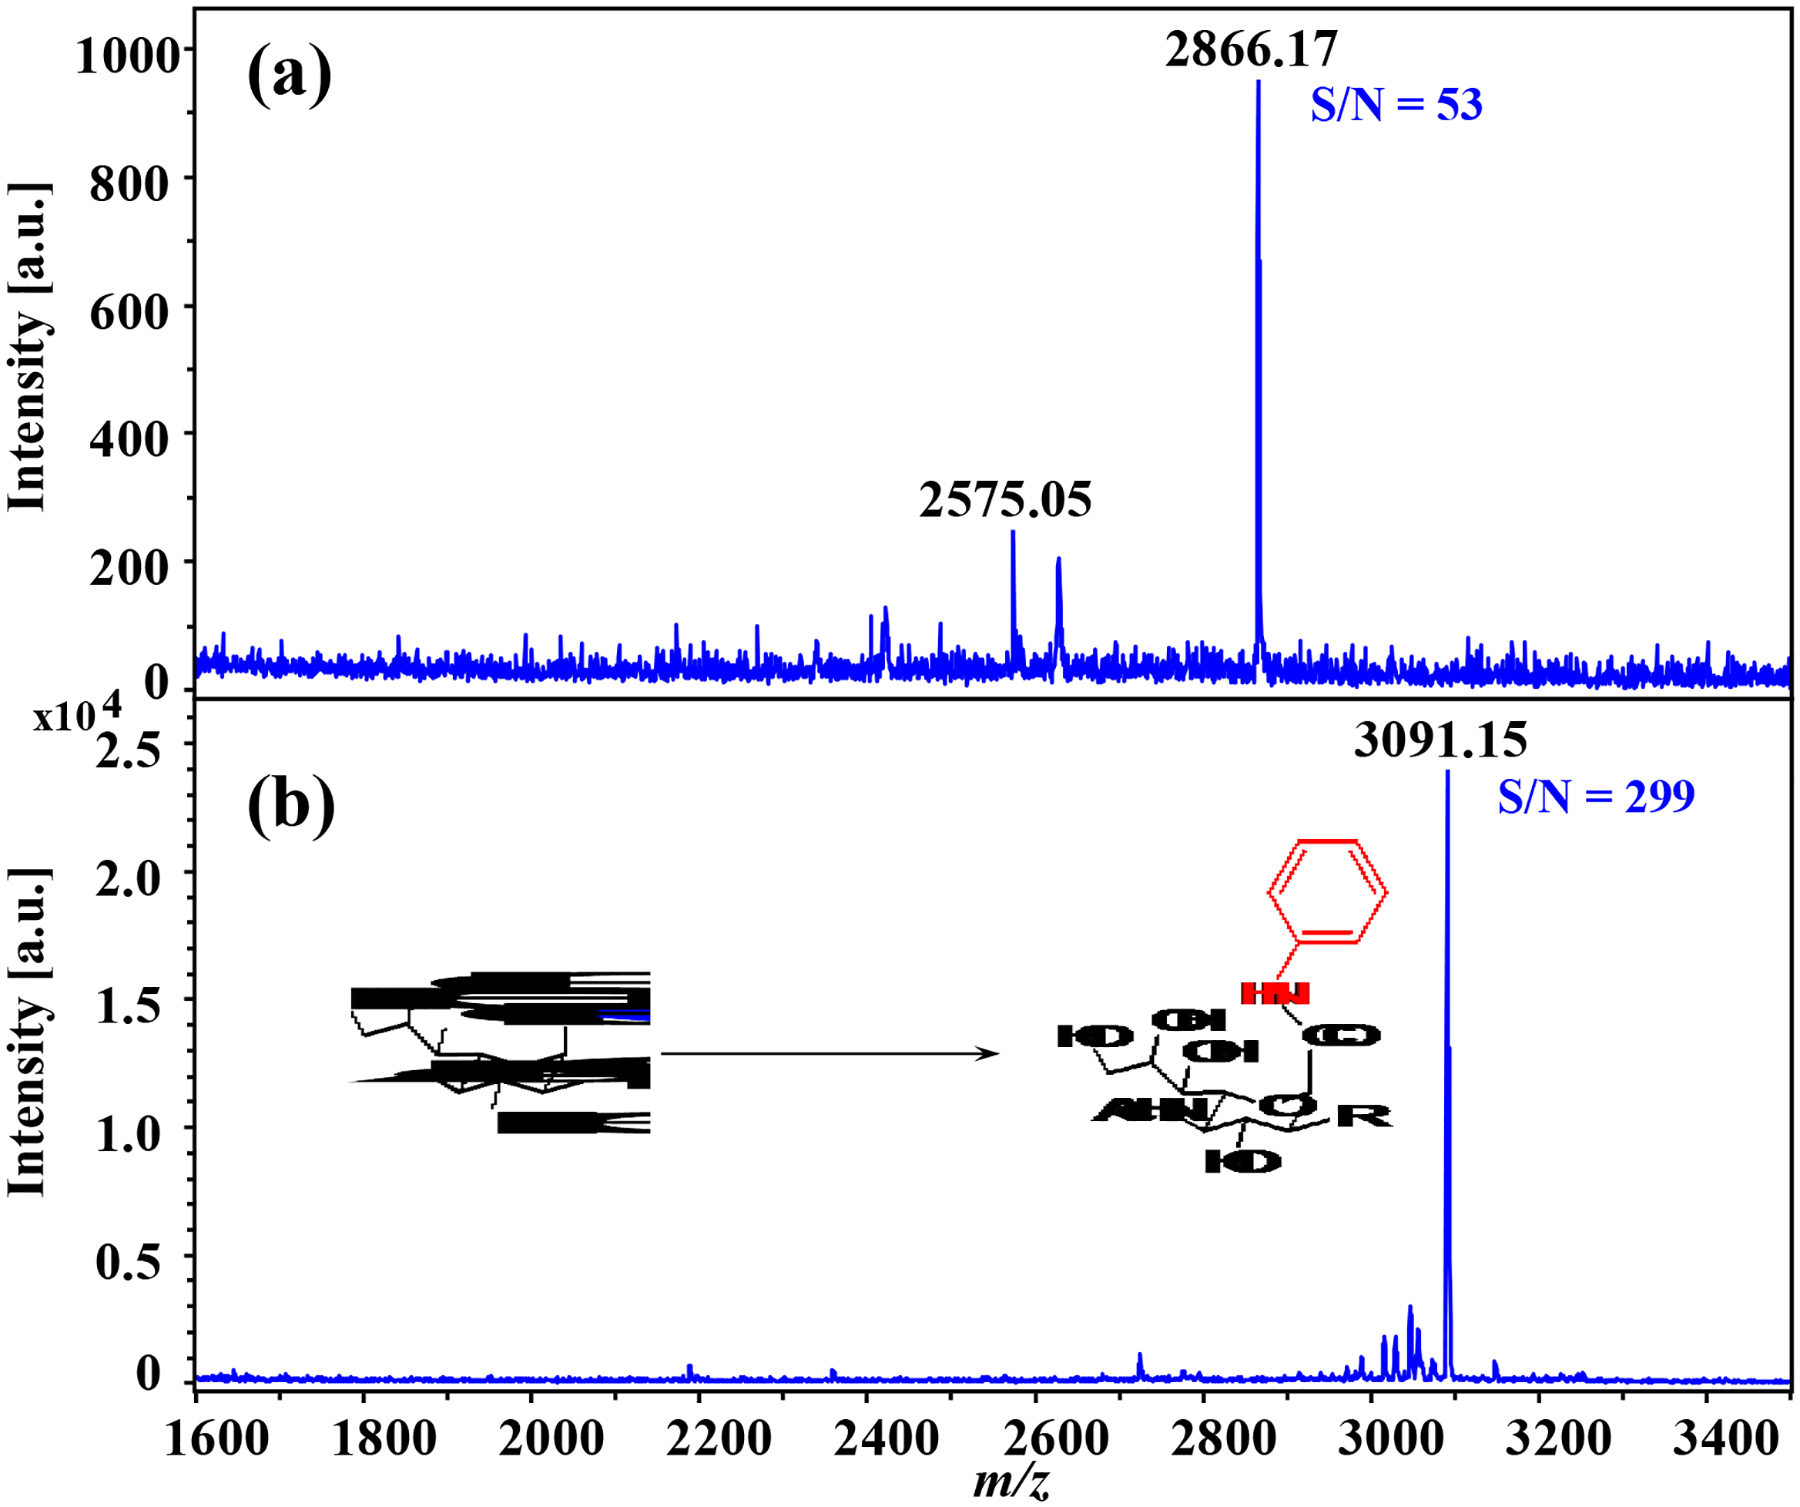
(a) SGP without derivatization, (b) SGP with aniline amidation, the inset shows the reaction scheme of labeling sialic acid residues with aniline. The native (m/z 2866.17) and derivatized SGP (m/z 3091.15) were both detected as sodium adduct products.
Determination of N-glycans from glycoprotein samples
N-glycans enzymatically released from glycoproteins, including BTG and fetuin from fetal bovine serum, were analyzed following aniline amidation. HILIC cartridges were used for cleaning excess derivatization reagents and the labeled N-glycans were subjected to MALDI-TOF-MS spotting analysis. As shown in Figure 3, sialylated N-glycans from BTG were successfully detected after aniline labeling. For underivatized BTG N-glycans, the mass spectrum was dominated by the signals of sodium adducted non-sialylated N-glycans (Figure 3a): among them, 17 N-glycans, including 3 sialylated N-glycans, were detected (detailed in Table S1). In contrast, the labeled sialylated N-glycans became the dominant ion peaks after derivatization, where 31 N-glycans, including 15 sialylated N-glycans, were identified (Figure 3b and detailed in Table S2). Many labeled sialylated N-glycans were detected at the high mass range of 2600–4000 Da, whereas no unlabeled N-glycans were observed in this same mass window (Figure S2). This enhanced detection sensitivity for sialylated N-glycans could be explained by the improved stability of the sialylated N-glycans, as well as the decreased hydrophilicity conferred by tagging phenyl groups after aniline derivatization; in contrast, the unlabeled sialylated N-glycans may be more susceptible to degradation and more hydrophilic. A summarizing Venn diagram shows that all N-glycan species found in the non-derivatization condition are detected in the aniline derivatization condition (Figure 4a), indicating that aniline amidation derivatization selectively labels the sialylated N-glycans with minimal impact on detection of other non-sialylated N-glycans within glycoprotein samples. It is noted that the N-glycans were detected as sodium adducted ions due to the higher affinity of sodium for N-glycans is higher than that of proton [32, 33].
Figure 3. Analysis of N-glycans from bovine thyroglobulin (BTG):
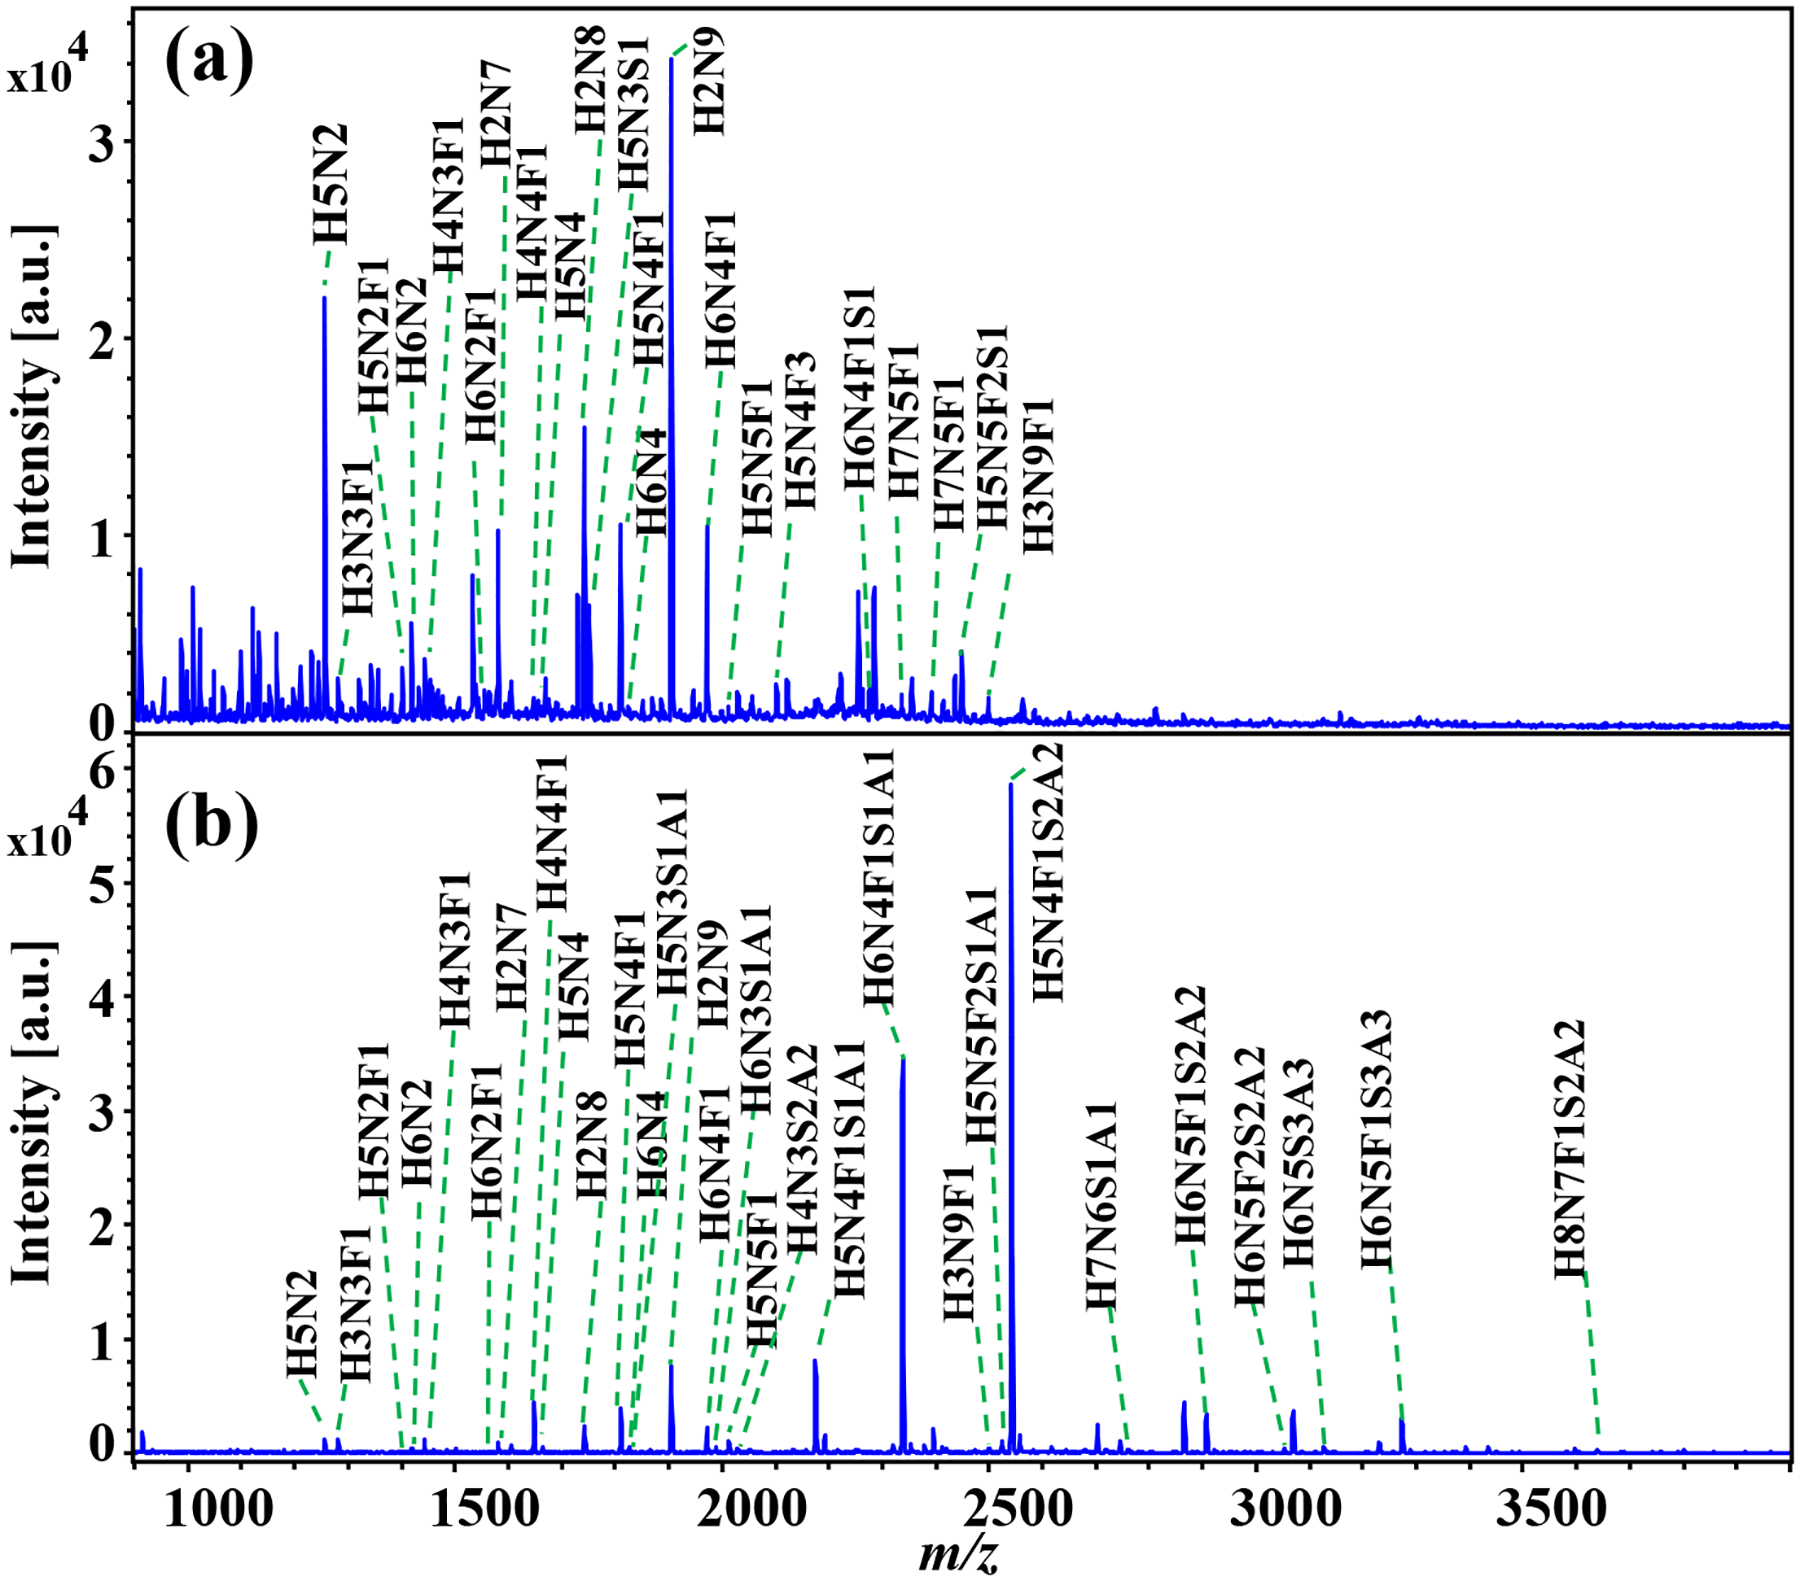
(a) sample without derivatization, (b) sample with aniline labeling. All the N-glycans were detected as sodium adduct peaks.
Figure 4. Venn diagrams presenting the numbers of N-glycans detected in the analysis of glycoproteins and tissue section:

(a) analysis of bovine thyroglobulin protein without (w/o) and with (w/) aniline amidation derivatization, (b) analysis of fetuin protein without (w/o) and with (w/) aniline amidation derivatization, (c) N-glycans detected from one specific region of the human laryngeal tissue section without (w/o) and with (w/) chemical derivatization.
Next, we studied the N-glycans released from 50 μg fetuin protein. Fetuin is a blood carrier protein that has been reported to be highly modified with sialylated N-glycans [34]. As shown in Figure 5, only 6 N-glycans, including 1 sialylated N-glycan, each with low signal intensity, were detected in the control sample; in contrast, 41 N-glycans, including 25 sialylated N-glycans, were observed after aniline labeling (detailed in Figure S3, Table S3 and Table S4). Significantly improved glycome coverage was achieved following chemical derivatization. Also, the Venn diagram indicates that the N-glycans detected without derivatization were all present in the N-glycan group obtained via aniline labeling (Figure 4b). Note that the low detection sensitivity for the N-glycans from the underivatized sample is associated with the degradation of sialylated N-glycans during MALDI, as the mass spectrum is dominated by fragment ions (Figure S3a). As a result, the detection sensitivity for sialylated N-glycans is significantly improved by labeling of sialic acid residues using aniline, supporting its applicability to MALDI-MS imaging via on-tissue labeling.
Figure 5. Analysis of N-glycans from a glycoprotein fetuin:
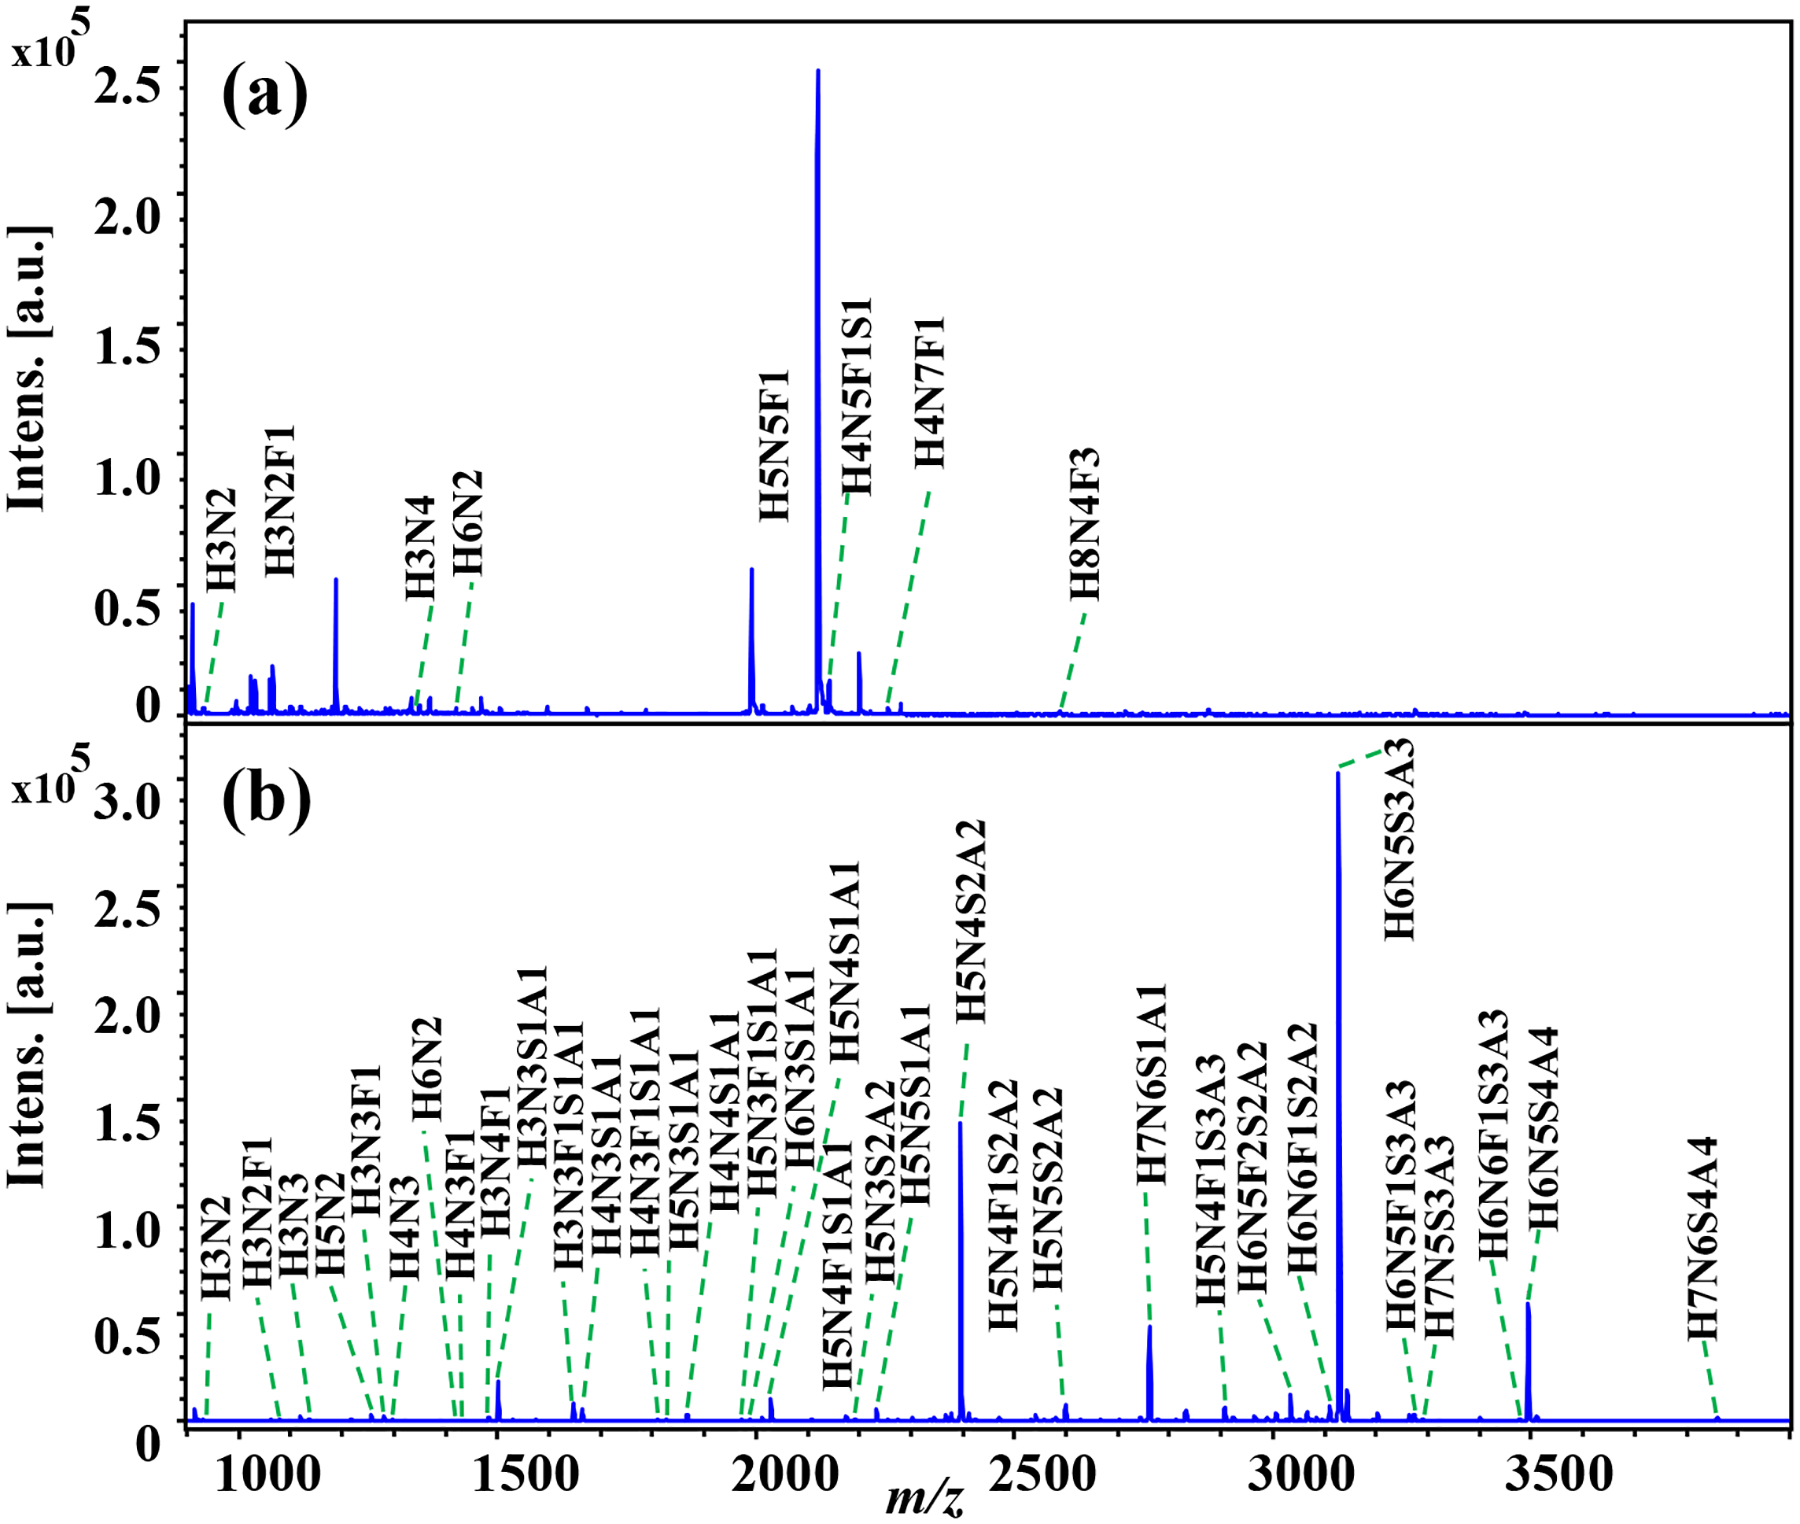
(a) N-glycans released from fetuin without derivatization, (b) N-glycans released from fetuin with aniline labeling. All the N-glycans were detected as sodium adduct peaks.
MALDI-MS imaging of N-glycans coupled with on-tissue aniline derivatization
On-tissue derivatization of sialylated N-glycans was performed on FFPE human laryngeal tissue sections. After dewaxing of paraffin, slides were incubated in a derivatization solution for on-tissue labeling. Two serial tissue sections were used to establish the on-tissue derivatization method: one section underwent aniline derivatization whereas the other was retained as an unlabeled control. MALDI-MS spotting analysis was first performed on the same region of the two tissue sections. As shown in Figure 6, the high-mannose N-glycan, Hex6HexNAc2 (m/z 1419.446) presented as the predominant ion peak in both samples, while more N-glycans were detected at the high mass range (>2000 Da) after aniline labeling. All N-glycans were detected as sodium adducted ions in the control and aniline-labeled samples. For the underivatized tissue sample, 17 N-glycans were detected, out of which the majority were non-sialylated N-glycans – just one sialylated N-glycan was detected at very low signal intensity (Figure 6a and detailed in Table S5). In contrast, 34 N-glycans, including 14 sialylated N-glycans, were attained from the same tissue region following in situ aniline derivatization (Figure 6b and detailed in Table S6), showing enhanced detection sensitivity after reaction with aniline. Comparing the N-glycan species detected in the control and derivatized tissue samples, we confirmed that all N-glycans identified in the untreated control samples were also present following aniline labeling (Figure 4c). These results show that aniline selectively labels sialylated N-glycans without compromising the detection of non-sialylated N-glycans, such as high mannose and fucosylated N-glycans. The current method shows significant improvement in comparison to our previous study, where five sialylated N-glycans were detected at low signal intensities with in-situ MSI of N-glycans from the FFPE human laryngeal tissue with on-tissue labeling of N-glycans using a charged tag of GP [17]. The low coverage for sialylated N-glycans from the GP labeling strategy may be due to either the in-source or post-source fragmentation of the sialylated N-glycans as the sialic acid residue was not stabilized – the GP labels the reducing end of the N-glycans instead of the sialic acid residue. Note that there are reports about MSI of sialylated N-glycans from other types of tissue samples (e.g., human leiomyosarcoma, myxoid liposarcoma, and colorectal carcinoma tissues; mouse brain, ovarian cancer tissue section, etc.)[15, 35, 36], overall, the identification scale for sialylated N-glycans was low due to the lability of sialylated N-glycans during MALDI-MSI. It is worth mentioning that controlling the pH of the derivatization solution to ca. 6.5 is essential to successful detection of N-glycans in tissue sections after chemical derivatization, as no unlabeled non-sialylated N-glycans or labeled sialylated N-glycans were detected at pH < 5 in our experiments (data not shown).
Figure 6. MALDI-TOF mass spectra obtained from the same region of two consecutive FFPE human laryngeal tissue sections:
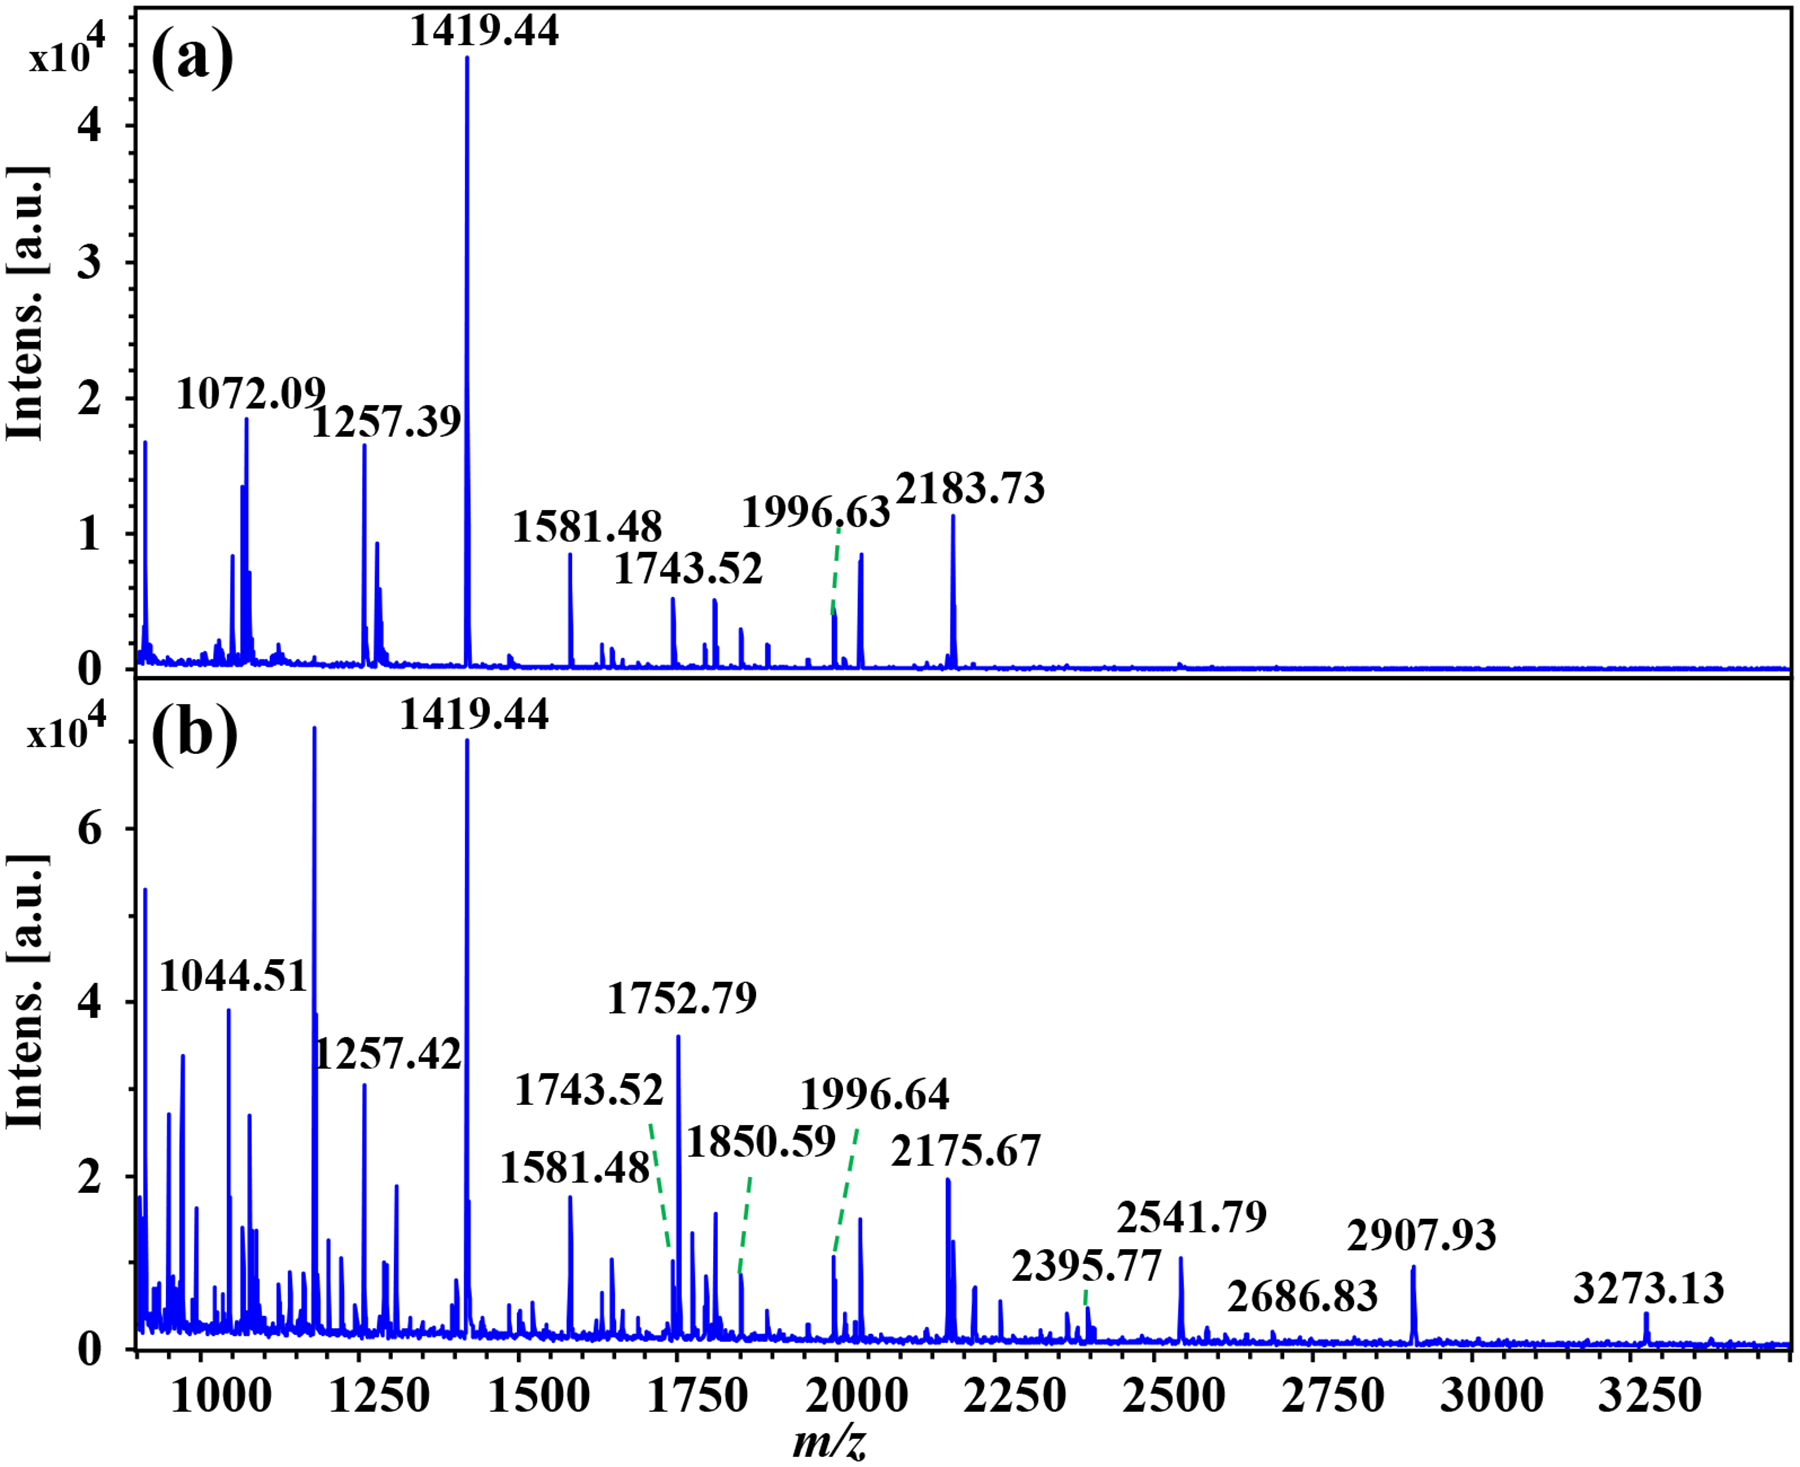
(a) without chemical derivatization and (b) with on-tissue aniline derivatization.
Following this method validation, we subjected serial human laryngeal cancer (squamous cell carcinoma) tissue sections to MALDI-TOF-MS imaging. Six tissue sections were analyzed by MSI, with three replicates for the non-derivatization and aniline labeling conditions, respectively. Figure 7 shows the ion maps of representative non-sialylated N-glycans obtained from the aniline-derivatization-treated sample compared to untreated control. The non-sialylated N-glycans were all detected as sodium adducts and their lateral distribution patterns were well-matched before and after the on-tissue labeling (Figure 7a–k). It is noted that aniline does not react with the non-sialylated N-glycans due to the absence of a carboxyl group, demonstrating the specificity of the reaction. Comparison with the histological image (Figure 7l) was used to delineate the normal and pathologic tissue regions, in which higher signal intensities of high-mannose type N-glycans, such as Hex5HexNAc2, Hex6HexNAc2, Hex7HexNAc2, Hex8HexNAc2, and Hex9HexNAc2, were obtained (Figure 7a, b, d, g, j). Receiver operating characteristic (ROC) analysis was performed to compare intensities of these high-mannose N-glycans in the tumor and adjacent normal region, resulting in area-under-the-curve (AUC) values from 0.72 to 0.97 (Figure S4). These AUC values indicate upregulated expression of these high-mannose N-glycans in the cancer lesion. In contrast, complex/hybrid/fucosylated N-glycans, such as Hex3HexNAc4dHex1, Hex4HexNAc4dHex1, and Hex3HexNAc5dHex1, were found to have higher expression in the adjacent normal tissue (Figure 7c, e, f, h). This finding suggests that these high-mannose N-glycans are potential biomarkers of human laryngeal squamous cell carcinoma, consistent with our previous study [17].
Figure 7. MALDI-MS imaging of N-glycans in human laryngeal cancer tissue sections:
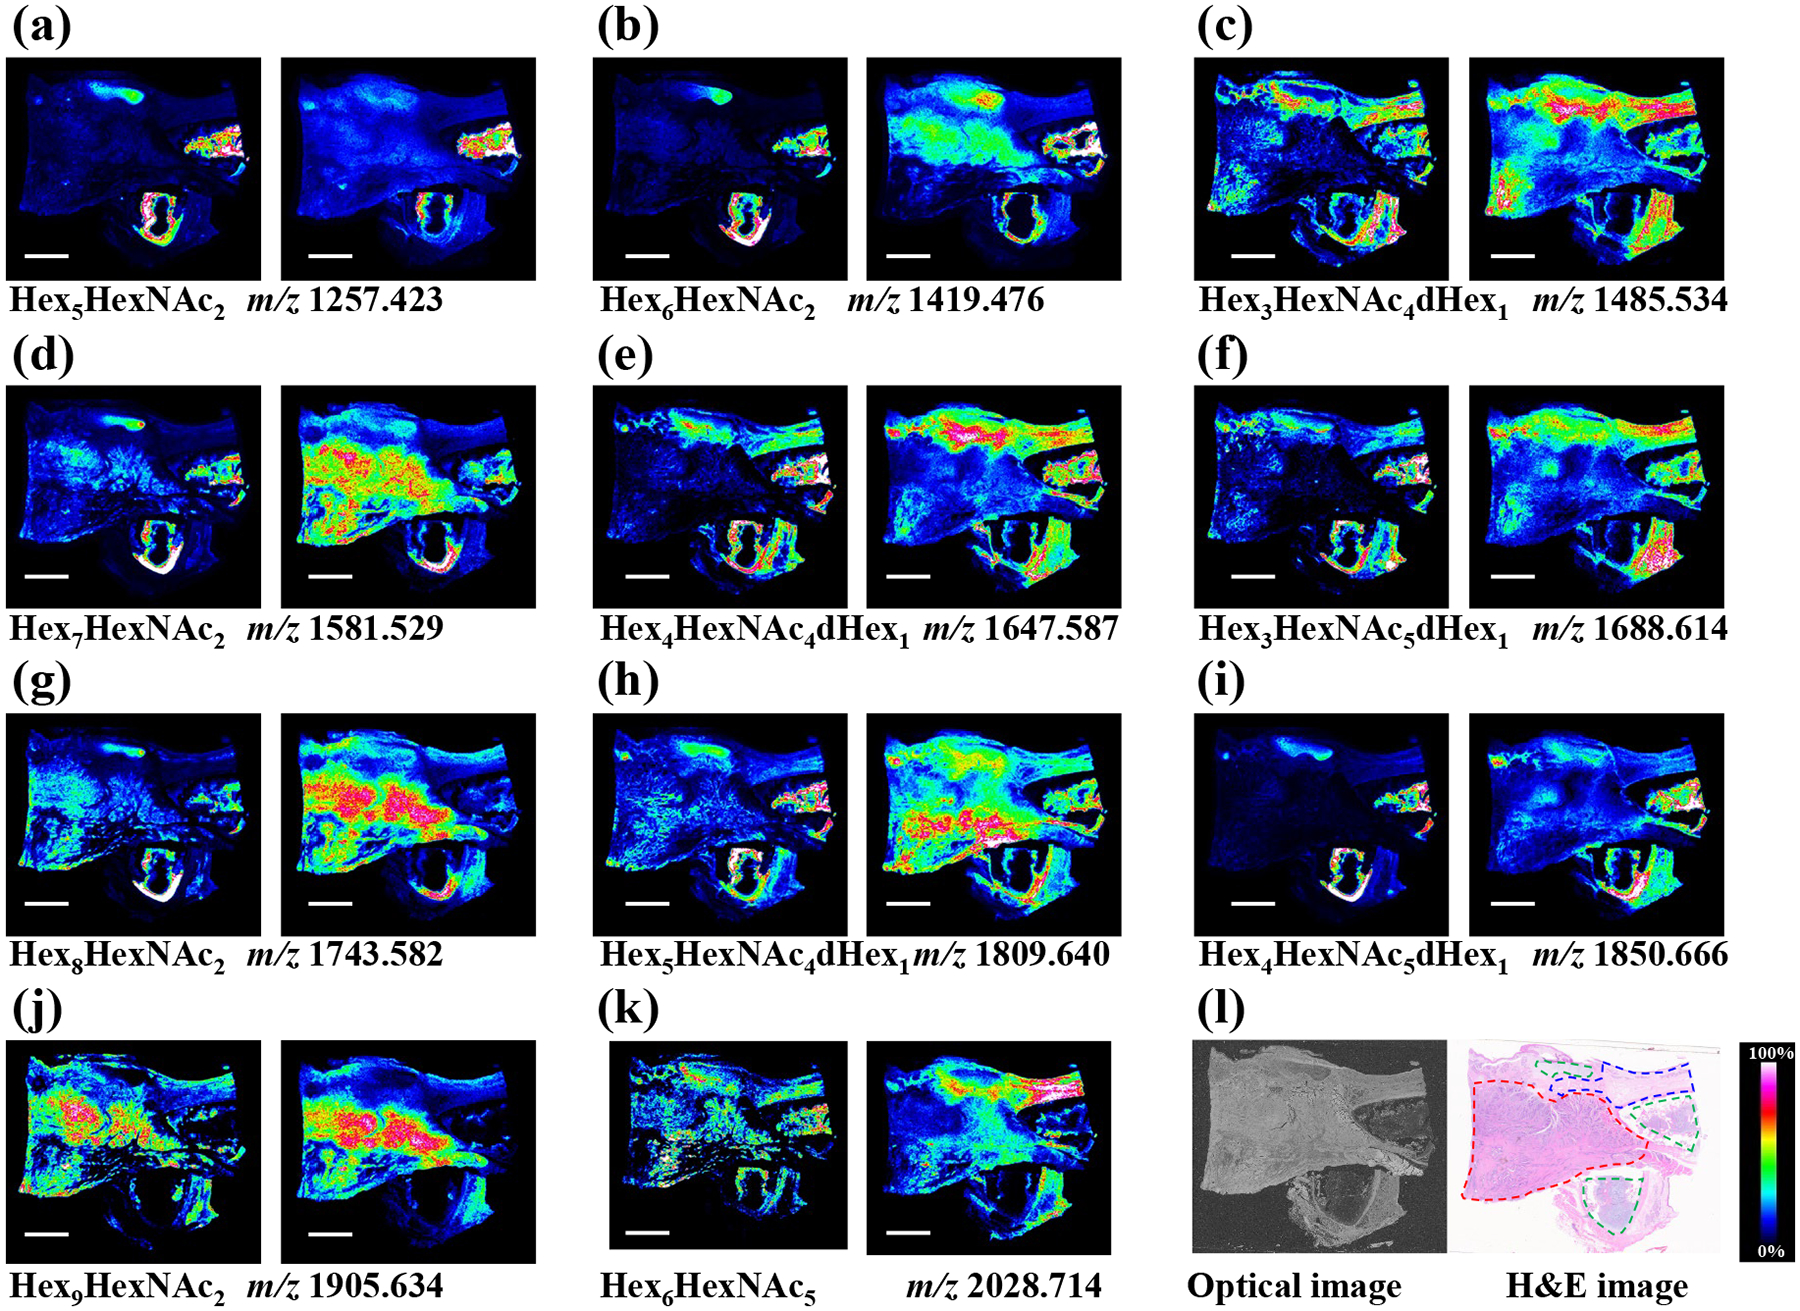
(a-k) MS images of representative non-sialylated N-glycans detected from the underivatized tissue section (left panel) and aniline derivatization treated tissue section (right panel), (l) optical image of the human laryngeal cancer tissue sections (left panel) and corresponding H&E staining image showing the tumor region (red dotted line), normal region (blue dotted line), and cartilage tissue (green dotted line). Scale bar is 5 mm. All the N-glycans were detected as sodium adduct peaks.
A limited number of sialylated N-glycans with low signal intensities were detected in the control tissue due to the in/post-source degradation of sialic acid residues, whereas clearer regional distribution patterns of the labeled sialylated N-glycans were depicted following on-tissue aniline derivatization (Figure 8). Based on histological orientation, a higher abundance of sialylated N-glycans were found in (non-diseased) laryngeal cartilage whereas specific sialylated N-glycans such as Hex4HexNAc4NeuAc1dHex1 and Hex5HexNAc4NeuAc1dHex1 were substantially more abundant in the tumor region (Figure 8 a–b). These findings showcase the improved spatial mapping of sialylated N-glycans in normal and diseased FFPE tissue sections enabled by on-tissue aniline labeling.
Figure 8. MALDI-MS imaging of sialylated N-glycans in human laryngeal cancer tissue sections:
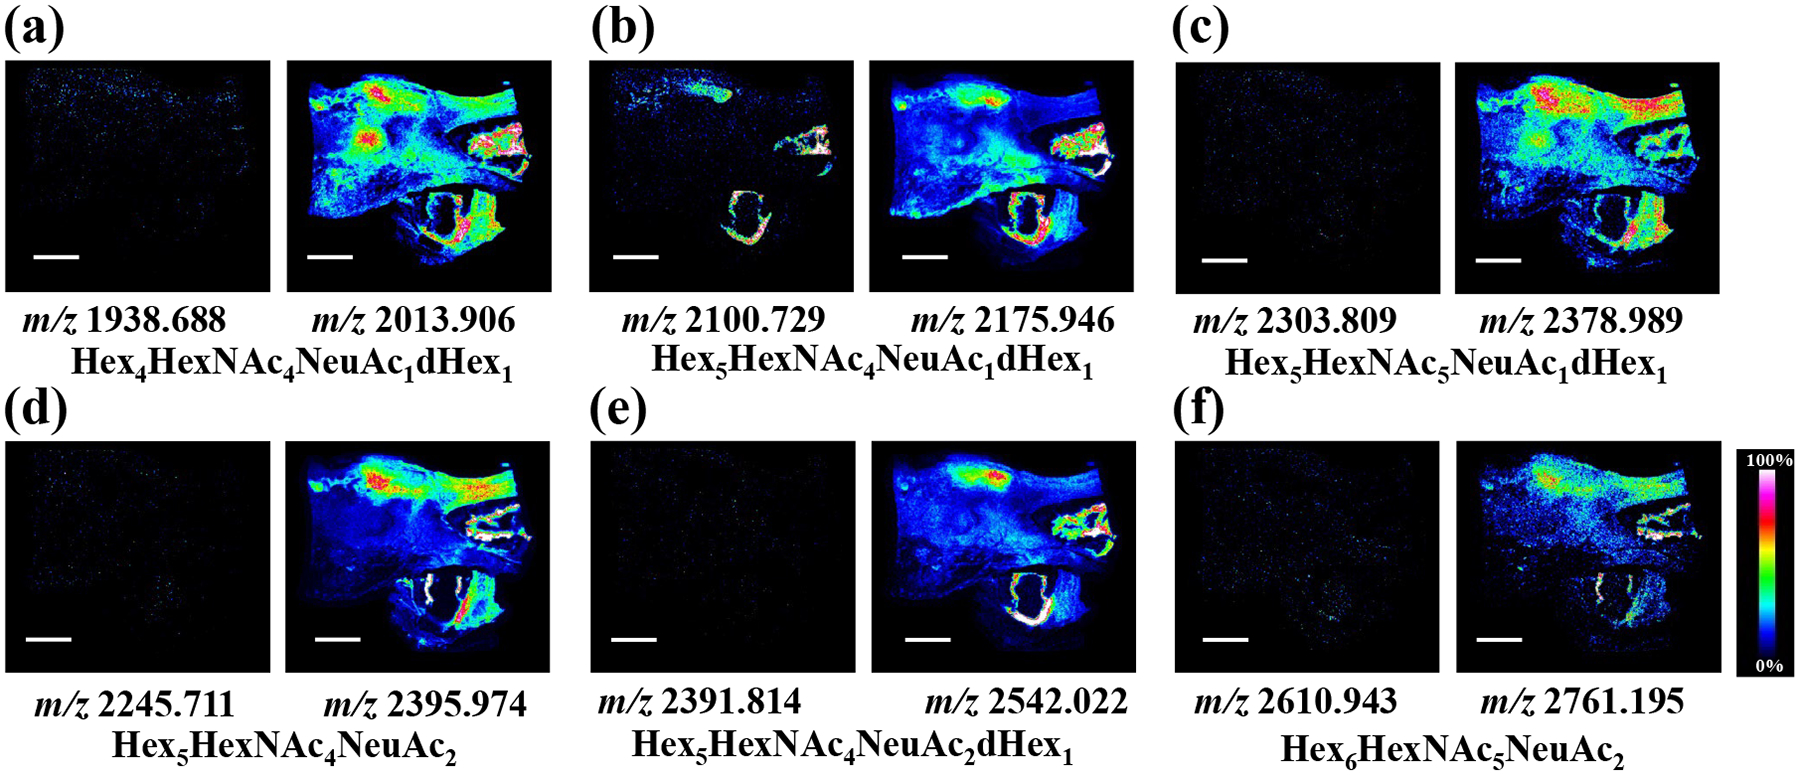
(a-f) MS images of representative sialylated N-glycans detected from consecutive tissue sections, images from the underivatized tissue section are shown on the left panel and images from the aniline derivatization treated tissue section are shown on the right panel. Scale bar is 5 mm and all the N-glycans were detected as sodium adduct peaks.
Conclusions
In summary, an on-tissue derivatization strategy based on amidation of sialylated N-glycans using aniline was developed for sensitive MALDI-MS imaging of N-glycans on tissue samples. An aromatic group is capped to the sialic acid residue after coupling with aniline which neutralizes the negative charges of the sialic acids as well as decreases the hydrophilicity of sialylated N-glycans. Also, the sialylated N-glycans are stabilized after the aniline labeling, alleviating in/post-source degradation during MALDI-MS measurement. The capability of the proposed aniline strategy has been demonstrated using sialylglycopeptide, N-glycans released from glycoproteins, and in situ labeling of N-glycans from human laryngeal tissues. Taken together, the results show that detection sensitivity for sialylated N-glycans is notably improved after the aniline labeling and that higher glycome coverage has been achieved for both glycoproteins and tissue samples. The proposed method allows sensitive profiling of N-glycans from biological samples, which facilitates the discovery and identification of disease-relevant glycans. We anticipate that this sensitive glycomic imaging strategy could be applied to the study of other clinical tissue samples. It is worth mentioning that in addition to enhancement of detection sensitivity for the sialylated N-glycans, differentiation of the linkage between sialic acid and adjacent monosaccharide residue (α2,3-/α2,6-linkages) is also a significant issue, as emerging studies show these two distinctive linkages play diverse roles in physiological and pathological processes [22, 37–39]. In this regard, combining aniline labeling strategy with ion mobility separation (e.g., using MALDI-timsTOF-MS) would be a promising future direction for sensitive linkage-specific profiling of the heterogeneity of sialylated N-glycans. A related study is currently ongoing in our laboratory.
Supplementary Material
Funding
Aspects of this work were supported by NIH grants R01 DK071801, R01 DC010777, R56MH110215, RF1AG052324, and U01CA231081; as well as pilot funds from the University of Wisconsin Institute for Clinical and Translational Research (UL1TR002373) and Head and Neck Cancer SPORE (P50DE026787). The MALDI TOF/TOF RapifleX mass spectrometer was purchased through the support of an NIH shared instrument grant S10OD025084. MX acknowledges NSF Graduate Research Fellowship Program (DGE-1747503). L.L. acknowledges a Vilas Distinguished Achievement Professorship and Charles Melbourne Johnson Distinguished Chair Professorship, with funding provided by the Wisconsin Alumni Research Foundation and the University of Wisconsin-Madison School of Pharmacy.
Footnotes
Ethics declarations
We declare that all research were conducted in compliance with ethical standards.
Conflict of interest
The authors declare no competing interests.
References
- 1.Varki A Biological roles of glycans. Glycobiology. 2017;27(1):3–49. [DOI] [PMC free article] [PubMed] [Google Scholar]
- 2.Reily C, Stewart TJ, Renfrow MB, Novak J. Glycosylation in health and disease. Nat Rev Nephrol. 2019;15(6):346–66. [DOI] [PMC free article] [PubMed] [Google Scholar]
- 3.Kailemia MJ, Park D, Lebrilla CB. Glycans and glycoproteins as specific biomarkers for cancer. Anal Bioanal Chem. 2017;409(2):395–410. [DOI] [PMC free article] [PubMed] [Google Scholar]
- 4.Haukedal H, Freude KK. Implications of Glycosylation in Alzheimer’s Disease. Front Neurosci. 2021;14:625348. [DOI] [PMC free article] [PubMed] [Google Scholar]
- 5.Ryan P, Xu M, Davey AK, Danon JJ, Mellick GD, Kassiou M, et al. O-GlcNAc Modification Protects against Protein Misfolding and Aggregation in Neurodegenerative Disease. Acs Chem Neurosci. 2019;10(5):2209–21. [DOI] [PubMed] [Google Scholar]
- 6.Kailemia MJ, Xu G, Wong M, Li Q, Goonatilleke E, Leon F, et al. Recent advances in the mass spectrometry methods for glycomics and cancer. Anal Chem. 2018;90(1):208–24. [DOI] [PMC free article] [PubMed] [Google Scholar]
- 7.Drake RR, West CA, Mehta AS, Angel PM. MALDI Mass Spectrometry Imaging of N-Linked Glycans in Tissues. In: Yamaguchi Y, Kato K, editors. Glycobiophysics. Advances in Experimental Medicine and Biology. 1104. Cham: Springer International Publishing Ag; 2018. p. 59–76. [DOI] [PubMed] [Google Scholar]
- 8.Delafield DG, Li L. Recent Advances in Analytical Approaches for Glycan and Glycopeptide Quantitation. Mol Cell Proteomics. 2021;20:100054. [DOI] [PMC free article] [PubMed] [Google Scholar]
- 9.Lu G, Crihfield CL, Gattu S, Veltri LM, Holland LA. Capillary Electrophoresis Separations of Glycans. Chem Rev. 2018;118(17):7867–85. [DOI] [PMC free article] [PubMed] [Google Scholar]
- 10.Vreeker GCM, Wuhrer M. Reversed-phase separation methods for glycan analysis. Anal Bioanal Chem. 2017;409(2):359–78. [DOI] [PMC free article] [PubMed] [Google Scholar]
- 11.Sun SS, Shah P, Eshghi ST, Yang WM, Trikannad N, Yang S, et al. Comprehensive analysis of protein glycosylation by solid-phase extraction of N-linked glycans and glycosite-containing peptides. Nat Biotechnol. 2016;34(1):84–8. [DOI] [PMC free article] [PubMed] [Google Scholar]
- 12.Li QY, Xie YX, Wong MR, Barboza M, Lebrilla CB. Comprehensive structural glycomic characterization of the glycocalyxes of cells and tissues. Nat Protoc. 2020;15(8):2668–704. [DOI] [PubMed] [Google Scholar]
- 13.Cheng MX, Shu H, Peng Y, Feng XX, Yan GQ, Zhang L, et al. Specific Analysis of alpha-2,3-Sialylated N-Glycan Linkage Isomers by Microchip Capillary Electrophoresis-Mass Spectrometry. Anal Chem. 2021;93(13):5537–46. [DOI] [PubMed] [Google Scholar]
- 14.McDowell CT, Lu X, Mehta AS, Angel PM, Drake RR. Applications and continued evolution of glycan imaging mass spectrometry. Mass Spectrom Rev. 2021:21725. [DOI] [PMC free article] [PubMed] [Google Scholar]
- 15.Drake RR, McDowell C, West C, David F, Powers TW, Nowling T, et al. Defining the human kidney N-glycome in normal and cancer tissues using MALDI imaging mass spectrometry. J Mass Spectrom. 2020;55(4):e4490. [DOI] [PMC free article] [PubMed] [Google Scholar]
- 16.Zhu J, Warner E, Parikh ND, Lubman DM. Glycoproteomic markers of hepatocellular carcinoma-mass spectrometry based approaches. Mass Spectrom Rev. 2019;38(3):265–90. [DOI] [PMC free article] [PubMed] [Google Scholar]
- 17.Zhang H, Shi X, Vu NQ, Li G, Li Z, Shi Y, et al. On-Tissue Derivatization with Girard’s Reagent P Enhances N-Glycan Signals for Formalin-Fixed Paraffin-Embedded Tissue Sections in MALDI Mass Spectrometry Imaging. Anal Chem. 2020;92(19):13361–8. [DOI] [PMC free article] [PubMed] [Google Scholar]
- 18.Kishimoto AO, Kishimoto Y, Shi X, Hutchinson EB, Zhang H, Shi Y, et al. High-resolution magnetic resonance and mass spectrometry imaging of the human larynx. J Anat. 2021;239(3):545–56. [DOI] [PMC free article] [PubMed] [Google Scholar]
- 19.de Haan N, Yang S, Cipollo J, Wuhrer M. Glycomics studies using sialic acid derivatization and mass spectrometry. Nat Rev Chem. 2020;4(5):229–42. [DOI] [PubMed] [Google Scholar]
- 20.Nishikaze T Sialic acid derivatization for glycan analysis by mass spectrometry. P Jpn Acad B-phys. 2019;95(9):523–37. [DOI] [PMC free article] [PubMed] [Google Scholar]
- 21.Ruhaak LR, Zauner G, Huhn C, Bruggink C, Deelder AM, Wuhrer M. Glycan labeling strategies and their use in identification and quantification. Anal Bioanal Chem. 2010;397(8):3457–81. [DOI] [PMC free article] [PubMed] [Google Scholar]
- 22.Holst S, Heijs B, de Haan N, van Zeijl RJM, Briaire-de Bruijn IH, van Pelt GW, et al. Linkage-specific in situ sialic acid derivatization for N-glycan mass spectrometry imaging of formalin-fixed paraffin-embedded tissues. Anal Chem. 2016;88(11):5904–13. [DOI] [PubMed] [Google Scholar]
- 23.Saito T, Watanabe A, Nakano M, Matsuo K. MALDI-TOF mass spectrometry imaging for N-glycans on FFPE tissue sections of mouse NASH liver through Sialic acid Benzylamidation. Glycoconjugate J. 2021;38(2):167–75. [DOI] [PubMed] [Google Scholar]
- 24.Rahman SA, Bergstroem E, Watson CJ, Wilson KM, Ashford DA, Thomas JR, et al. Filter-aided N-glycan separation (FANGS): A convenient sample preparation method for mass spectrometric N-glycan profiling. J Proteome Res. 2014;13(3):1167–76. [DOI] [PMC free article] [PubMed] [Google Scholar]
- 25.Ceroni A, Maass K, Geyer H, Geyer R, Dell A, Haslam SM. GlycoWorkbench: A tool for the computer-assisted annotation of mass spectra of Glycans. J Proteome Res. 2008;7(4):1650–9. [DOI] [PubMed] [Google Scholar]
- 26.Lawrence R, Olson SK, Steele RE, Wang LC, Warrior R, Cummings RD, et al. Evolutionary Differences in Glycosaminoglycan Fine Structure Detected by Quantitative Glycan Reductive Isotope Labeling. J Biol Chem. 2008;283(48):33674–84. [DOI] [PMC free article] [PubMed] [Google Scholar]
- 27.Xia BY, Feasley CL, Sachdev GP, Smith DF, Cummings RD. Glycan reductive isotope labeling for quantitative glycomics. Anal Biochem. 2009;387(2):162–70. [DOI] [PMC free article] [PubMed] [Google Scholar]
- 28.Gimenez E, Sanz-Nebot V, Rizzi A. Relative quantitation of glycosylation variants by stable isotope labeling of enzymatically released N-glycans using C-12 / C-13 aniline and ZIC-HILIC-ESI-TOF-MS. Anal Bioanal Chem. 2013;405(23):7307–19. [DOI] [PubMed] [Google Scholar]
- 29.Mancera-Arteu M, Gimenez E, Sancho J, Sanz-Nebot V. Alterations in the Glycan Profile of Mouse Transferrin: New Insights in Collagen-Induced Arthritis. J Proteome Res. 2020;19(4):1750–9. [DOI] [PubMed] [Google Scholar]
- 30.Seko A, Koketsu M, Nishizono M, Enoki Y, Ibrahim HR, Juneja LR, et al. Occurrence of a sialylglycopeptide and free sialylglycans in hen’s egg yolk. Bba-gen Subjects. 1997;1335(1–2):23–32. [DOI] [PubMed] [Google Scholar]
- 31.Liu L, Prudden AR, Bosman GP, Boons G-J. Improved isolation and characterization procedure of sialylglycopeptide from egg yolk powder. Carbohyd Res. 2017;452:122–8. [DOI] [PMC free article] [PubMed] [Google Scholar]
- 32.Lee CP, Lu IC, Hsu H, Lin HY, Liang SP, Lee YT, et al. Formation of Metal-Related Ions in Matrix-Assisted Laser Desorption Ionization. J Am Soc Mass Spectrom. 2016;27(9):1491–8. [DOI] [PubMed] [Google Scholar]
- 33.Mohr MD, Bornsen KO, Widmer HM. Matrix-assisted laser-desorption ionization mass spectrometry improved matrix for oligosaccharides. Rapid Commun Mass Spectrom. 1995;9(9):809–14. [DOI] [PubMed] [Google Scholar]
- 34.Wang C, Wu Y, Zhang L, Liu B-F, Lin Y, Liu X. Relative quantitation of neutral and sialylated N-glycans using stable isotopic labeled d0/d5-benzoyl chloride by MALDI-MS. Anal Chim Acta. 2018;1002:50–61. [DOI] [PubMed] [Google Scholar]
- 35.Heijs B, Holst S, Briaire-de Bruijn IH, van Pelt GW, de Ru AH, van Veelen PA, et al. Multimodal Mass Spectrometry Imaging of N-Glycans and Proteins from the Same Tissue Section. Anal Chem. 2016;88(15):7745–53. [DOI] [PubMed] [Google Scholar]
- 36.Shi YT, Li ZH, Felder MA, Yu QY, Shi XD, Peng YJ, et al. Mass Spectrometry Imaging of N-Glycans from Formalin-Fixed Paraffin-Embedded Tissue Sections Using a Novel Subatmospheric Pressure Ionization Source. Anal Chem. 2019;91(20):12942–7. [DOI] [PMC free article] [PubMed] [Google Scholar]
- 37.Zhou X, Yang G, Guan F. Biological Functions and Analytical Strategies of Sialic Acids in Tumor. Cells. 2020;9(2). [DOI] [PMC free article] [PubMed] [Google Scholar]
- 38.Schjoldager KT, Narimatsu Y, Joshi HJ, Clausen H. Global view of human protein glycosylation pathways and functions. Nat Rev Mol Cell Bio. 2020;21(12):729–49. [DOI] [PubMed] [Google Scholar]
- 39.Schultz MJ, Swindall AF, Bellis SL. Regulation of the metastatic cell phenotype by sialylated glycans. Cancer Metast Rev. 2012;31(3–4):501–18. [DOI] [PMC free article] [PubMed] [Google Scholar]
Associated Data
This section collects any data citations, data availability statements, or supplementary materials included in this article.


