

Abstract
Immune dysfunction contributes to the higher risk of communicable and non-communicable diseases among diabetics. HLA-DR expression is a robust marker of immune competence in mononuclear cells, including antigen presentation to CD4 lymphocytes. Given the high prevalence of obesity among diabetics, we evaluated the independent association between hyperglycemia and dyslipidemias with respect to HLA-DR expression in blood monocytes from type 2 diabetes patients. The monocytes from individuals with (n=16) or without diabetes (n=25) were phenotyped by flow cytometry to assess the differential expression of HLA-DR on their three subpopulations (classical, intermediate and non-classical monocytes). Diabetes was independently associated with lower HLA-DR expression across all monocyte subpopulations (p <0.05). Blood triglycerides were associated with further HLA-DR depression (interaction p <0.002). Cholesterols counterbalanced the reductive effect, with CD36, a receptor for oxidized cholesterol, correlating with HLA-DR (rho=0.373; p= 0.016). Future studies are warranted to elucidate the complex interactions between hyperglycemia and dyslipidemias on antigen presentation in diabetic monocytes.
Keywords: HLA-DR, monocytes, diabetes, triglycerides, cholesterol
1. Introduction
Patients with diabetes have a higher risk of morbidity, hospitalizations and mortality from infections, including pulmonary diseases like tuberculosis, streptococcal pneumonia, influenza and Coronavirus disease-19 (COVID-19) [1]. They are also at higher risk of certain types of cancers, and of cardiovascular diseases [2]. The high prevalence of these co-morbidities has been attributed to a dysfunctional immune system in diabetes. Given the high prevalence of obesity-associated diabetes (up to 90% of adult diabetes patients in the United States), it is important to understand the contribution of hyperglycemia versus obesity on the underlying mechanisms driving immune dysfunction in diabetes [3].
Chronic hyperglycemia is associated with alterations in the phenotype and function of immune cells, including mononuclear cells which are the focus of this report [4–14]. These cells play a key role in bridging innate and adaptive immune responses. For example, in pulmonary infections like tuberculosis, blood monocytes migrate to the lungs, and differentiate into interstitial macrophages that play a key role in granuloma formation and bacterial containment. These monocyte-derived macrophages orchestrate the local response, including the phagocytosis, processing and antigen presentation of bacterial antigenic peptides via the major histocompatibility complex (MHC) class II (HLA-DR), to CD4 T cells a major mediator of infection immunity [15].
Given the critical role of antigen presentation in the ability of monocytes or monocyte-derived macrophages to connect innate and adaptive responses, we evaluated host factors associated with expression of MHC-II among blood monocytes from healthy individuals with or without diabetes. Previous studies have reported lower MHC-II expression in monocytes from patients with diabetes or transient hyperglycemia, but there are knowledge gaps. Namely, i) some studies are in critically-ill patients (e.g. sepsis, post-surgery) [16, 17]; ii) it is unclear if altered MHC-II expression is attributed to hyperglycemia or to the high prevalence of dyslipidemias [9]; and, iii) monocytes are heterogeneous and comprise three major sub-populations based on their expression of CD14 and CD16, but an altered MHC-II expression in these sub-groups has not been evaluated in diabetic patients [18]. This is relevant given that evaluation of all monocytes will mainly reflect changes in the predominant “classical” monocyte compartment, but may be overlooking defects in the intermediate and non-classical sub-populations which are amplified in inflammatory conditions and are more specialized in antigen presentation [18].
2. Materials and Methods
Healthy Hispanics were enrolled in South Texas and evaluated for diabetes or dyslipidemias as described [4, 19, 20]. Mononuclear cells were isolated from heparinized blood, stored frozen (10% DMSO, 20% fetal bovine serum, 70% RPMI) and quick-thawed for batch phenotyping of baseline monocytes by flow cytometry. The antibodies and gating strategy to identify the three monocyte subpopulations (CD14+16- or classical, CD14+CD16+ or intermediate and CD14lo,CD16+ or non-classical) was described previously [14]. In addition, we used anti-HLA-DR-PE-Cy7 (eBioscience clone LN3) and anti-CD36-APC (Biolegend, clone 5–271). The MFI values were log-transformed for normalization and parametric analysis. Data analysis was conducted using SAS 9.4 with p values considered significant (≤ 0.5) or borderline significant (0.051 – 0.099).
3. Results
We enrolled 16 participants with (n=16) or without type 2 diabetes (n=25; Table). Among the diabetes patients, the mean number of years with the disease was 6.7 (range 0–21 y). Besides higher glucose and HbA1c, the participants with diabetes were more obese and had lower HDL cholesterol levels (Table). The phenotyping of their baseline monocytes by flow cytometry showed no differences in the proportion of monocyte subsets by diabetes status: classical 80% vs 82%, intermediate 6.1% vs 5.2% or non-classical 12.8% vs 12% in participants with diabetes vs non-diabetes, respectively (p > 0.05). We next evaluated if monocytes exhibited differences in the expression of HLA-DR, a broad marker of immune competence. Among all participants, the intermediate monocyte sub-population had the highest MFI for HLA-DR, which is consistent with the major role of this subset in antigen presentation (Table and Fig 1A) [18]. Diabetes or its defining variables [hyperglycemia or high HbA1c (≥ 6.5%)] were associated with low HLA-DR expression across all monocyte sub-populations (Fig 1A), but glycemic index among the diabetes patients was not (Table). Additional host characteristics associated with HLA-DR expression included body-mass index, the different types of cholesterols and triglycerides. Namely, body-mass index (BMI) was also inversely correlated with HLA-DR expression, but only for the classical monocyte subset (Table). Total cholesterol, HDL or low-density cholesterol (LDL) were associated with higher HLA-DR expression: Total or HDL cholesterol among the classical monocytes, while LDL cholesterol among the intermediate or non-classical monocytes (Table). Given the associations between cholesterols and HLA-DR expression, we evaluated if HLA-DR was correlated with CD36, a scavenger receptor for uptake of LDL cholesterol. Accordingly, we found a significant correlation between HLA-DR expression and CD36 (linear regression in Fig 1B). In contrast to cholesterols, participants with high triglycerides had monocytes with lower HLA-DR expression but differences were not significant (Table).
Table.
Study population, and relationship between HLA-DR median fluorescent intensity (MFI) and host factors, by monocyte subpopulation
| Participant characteristicsa | HLA-DR median fluorescence intensity, by participant characteristicsb | |||||||||||
|---|---|---|---|---|---|---|---|---|---|---|---|---|
| All | No diabetes | Diabetes | All monocytes | Classical (CD14+,CD16lo) | Intermediate (CD14+,CD16+) | Non-classical (CD14lo,CD16+) | ||||||
| n (%) | n (%) | n (%) | p | Mean (SD)/Rho | p | Mean (SD)/Rho | p | Mean (SD)/Rho | p | Mean (SD)/Rho | p | |
| All participants | 41 | 25 (61%) | 16 (39%) | 7.83 (0.36) | 7.66 (0.40) | 9.06 (0.38) | 8.48 (0.37) | |||||
| Sex | 0.987 | 0.921 | 0.866 | 0.703 | 0.174 | |||||||
| Male | 18 (43.9) | 11 (44.0) | 7 (43.8) | 7.83 (0.371) | 7.65 (0.42) | 9.03 (0.39) | 8.38 (0.31) | |||||
| Female | 23 (56.1) | 14 (56.0) | 9 (56.2) | 7.82 (0.367) | 7.67 (0.08) | 9.07 (0.39) | 8.54 (0.39) | |||||
| Age (y) | 48 (10) | 47 (10) | 50 (9) | 0.208 | −0.01 | 0.975 | −0.08 | 0.647 | 0.05 | 0.743 | −0.10 | 0.559 |
| Diabetes | N/A | 0.011 | 0.005 | 0.007 | 0.003 | |||||||
| No | 25 (61%) | 25 (61%) | 7.94 (0.37) | 7.81 (0.37) | 9.18 (0.39) | 8.59 (0.40) | ||||||
| Yes | 16 (39%) | 16 (39%) | 7.65 (0.29) | 7.43 (0.33) | 8.86 (0.29) | 8.29 (0.21) | ||||||
| Blood glucose (mg/dL) | 125.8 (56.8) | 90.6 (11.1) | 180.9 (56.0) | < 0.001 | −0.42 | 0.006 | −0.48 | 0.002 | −0.42 | 0.008 | −0.38 | 0.018 |
| Hb1Ac | < 0.001 | 0.001 | 0.012 | 0.023 | 0.004 | |||||||
| < 6.5% | 28 (68.3) | 25 (100.0) | 3 (18.8) | 7.93 (0.35) | 7.78 (0.37) | 9.16 (0.38) | 8.57 (0.39) | |||||
| ≥ 6.5% | 13 (31.7) | 0 (0) | 13 (81.2) | 7.62 (0.3) | 7.42 (0.36) | 8.85 (0.29) | 8.28 (0.23) | |||||
| Glycemic index c | 25.7 (61.9) | N/A | 65.9 (86.2) | < 0.001 | 0.334 | 0.206 | 0.425 | 0.114 | −0.029 | 0.918 | 0.087 | 0.757 |
| BMI (kg/m 2 ) | 28.7 (4.9) | 27.5 (4.8) | 30.6 (4.5) | 0.039 | −0.32 | 0.041 | −0.39 | 0.015 | −0.12 | 0.463 | −0.08 | 0.639 |
| BMI categories | 0.066 | 0.045 | 0.031 | 0.876 | 0.658 | |||||||
| Underweight/Normal | l 9 (21.9) | 8 (32.0) | 1 (6.2) | 8.04 (0.25) | 7.91 (0.09) | 9.07 (0.09) | 8.52 (0.14) | |||||
| Overweight/Obese | 32 (78.1) | 17 (68.0) | 15 (93.8) | 7.76 (0.37) | 7.58 (0.07) | 9.05 (0.07) | 8.46 (0.06) | |||||
| Triglycerides | 0.723 | 0.401 | 0.375 | 0.165 | 0.143 | |||||||
| < 150 mg/dL | 30 (73.2) | 19 (76.0) | 11 (68.8) | 7.86 (0.39) | 7.70 (0.43) | 9.11 (0.35) | 8.53 (0.35) | |||||
| ≥ 150 mg/dL | 11 (26.8) | 6 (24.0) | 5 (31.3) | 7.75 (0.28) | 7.57 (0.3) | 8.92 (0.44) | 8.34 (0.39) | |||||
| Total cholesterol | 0.742 | 0.084 | 0.047 | 0.187 | 0.519 | |||||||
| < 200 mg/dL | 26 (63.4) | 15 (60.0) | 11 (68.8) | 7.75 (0.34) | 7.57 (0.37) | 9 (0.36) | 8.45 (0.39) | |||||
| ≥ 200 mg/dL | 15 (36.6) | 10 (40.0) | 5 (31.2) | 7.96 (0.37) | 7.83 (0.4) | 9.17 (0.41) | 8.53 (0.34) | |||||
| Low density cholesterol | 0.792 | 0.298 | 0.228 | 0.012 | 0.069 | |||||||
| < 130 mg/dL | 24 (60.0) | 14 (58.3) | 10 (62.5) | 7.79 (0.33) | 7.61 (0.37) | 8.95 (0.36) | 8.4 (0.37) | |||||
| ≥ 130 mg/dL | 16 (40.0) | 10 (41.7) | 6 (37.5) | 7.92 (0.4) | 7.77 (0.43) | 9.26 (0.35) | 8.62 (0.32) | |||||
| High density cholesterol | 0.024 | 0.175 | 0.082 | 0.640 | 0.844 | |||||||
| < 40 mg/dL | 21 (51.2) | 9 (36.0) | 12 (75.0) | 7.75 (0.36) | 7.56 (0.39) | 9.08 (0.39) | 8.49 (0.35) | |||||
| ≥ 40 mg/dL | 20 (48.8) | 16 (64.0) | 4 (25.0) | 7.91 (0.36) | 7.78 (0.38) | 9.03 (0.38) | 8.46 (0.40) | |||||
| Interaction model | Estimate (95% CI) | p value | Estimate (95% CI) | p value | Estimate (95% CI) | p value | Estimate (95% CI) | p value | ||||
| Hb1Ac * Triglycerides | 2.19 (0.78, 3.59) | 0.002 | 2.17 (0.91, 3.43) | <0.001 | 2.98 (−2.47, 8.42) | 0.283 | 2.02 (−1.18, 5.22) | 0.216 | ||||
Participant characteristics summarized as n(%) for discrete variables or mean (SD) for continuous;
HLA MFI summarized as Mean (SD) for discrete variables or pearsons rho correlation coefficient for continuous;
Fisher’s exact when cells ≤ 5, or chi-square;
Glycemic index = HbA1c * self-reported years with diabetes, among diabetes patients
Figure 1. HLA-DR expression in monocyte subsets by diabetes, CD36 or dyslipidemic status.
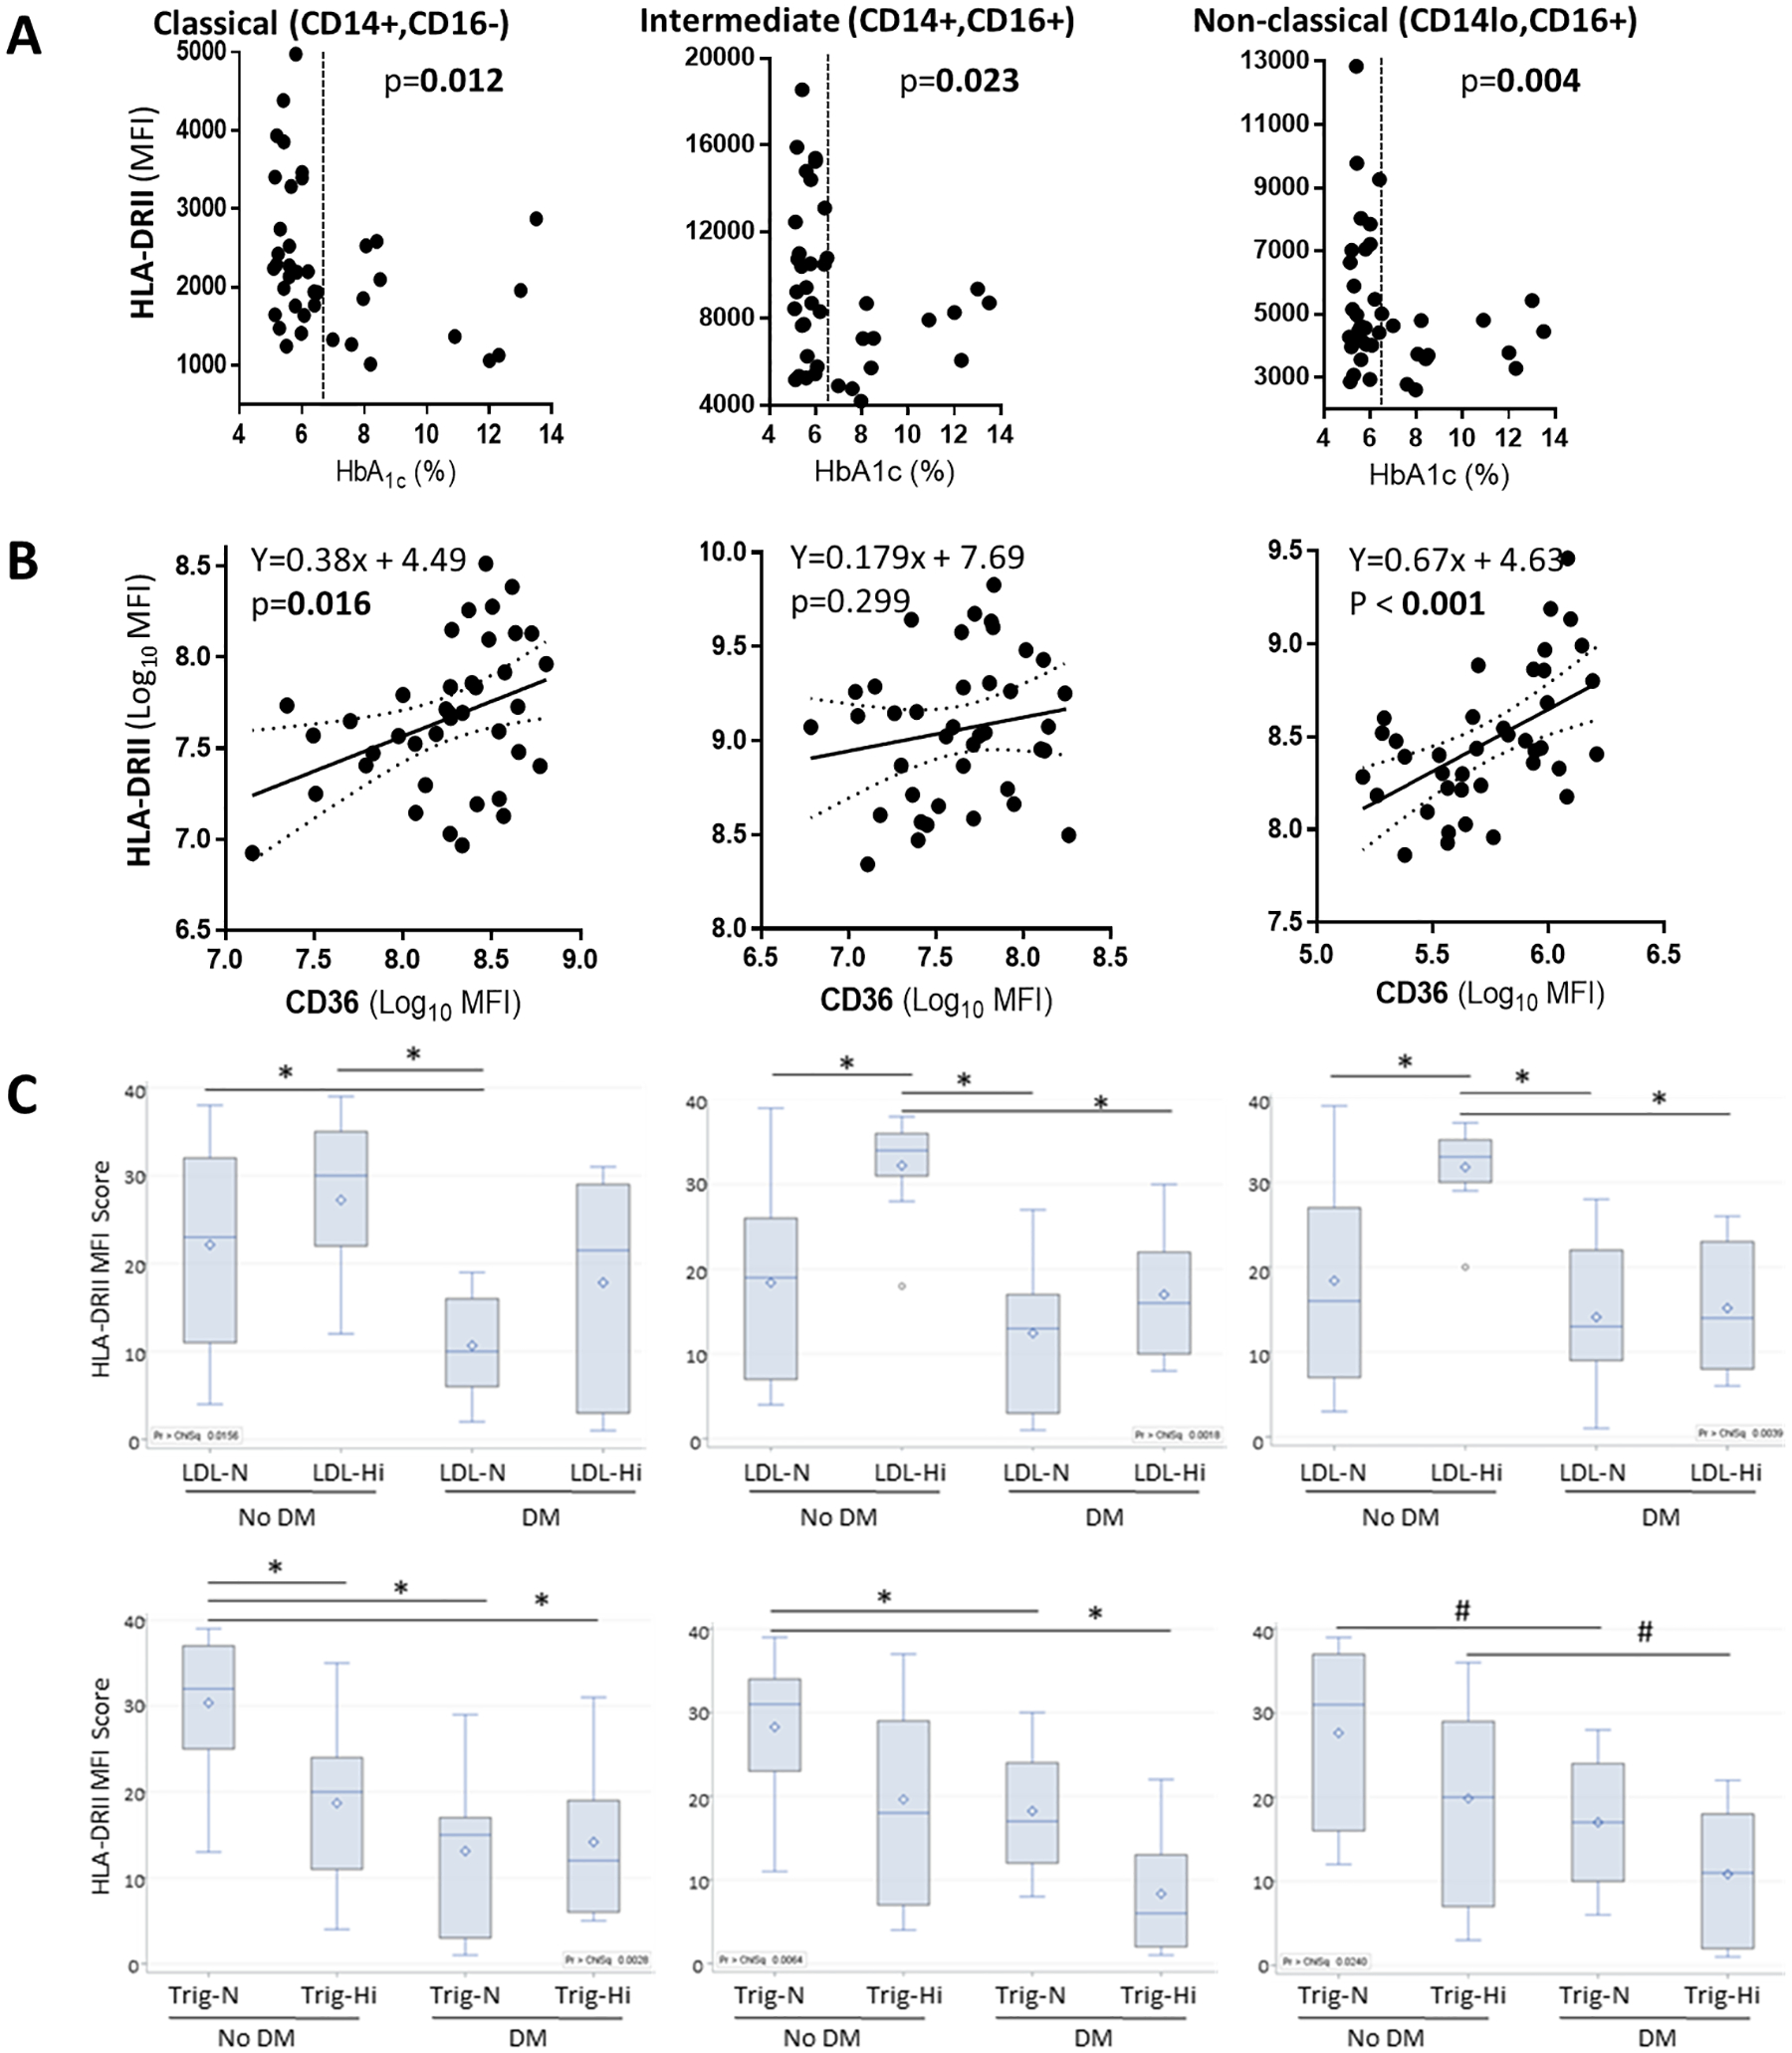
PBMCs from healthy controls or diabetes patients were phenotyped by flow cytometry. After exclusion of dead cells (7AAD-positive), lymphocytes (CD3+ or CD19+) or NK cells (CD56), monocytes were identified and classified into classical, intermediate or non-classical sub-populations based on the expression of CD14 or CD16, as described previously [14]. The median fluorescence intensity (MFI) of HLA-DRII was then analyzed. A. HLA-DR MFI by HbA1c levels. Differences by normal versus high HbA1c (≥ 6.5%; vertical dotted line) established by t-test. B. Scatter plots with regression analysis (solid line) and 95% confidence intervals (dotted lines) of the MFI of HLA-DR versus CD36. Each dot represents a participant. C. Boxplots of HLA-DR by diabetes and either LDL cholesterol or triglyceride levels. HLA-DR MFIs were log-transformed and median rank scores were compared with post-hoc Dwass, Steel, Critchlow-Fligner to adjust for multiple comparisons. Differences between study groupsare indicated if p values less than 0.05 (*) or between 0.051–0.099 (#). The horizontal lines in the box display the median with 25% and 75% quartiles, and the whiskers show the minimum and maximum values. The open dot represents the mean. LDL, Low-density cholesterol, with high cutoff values at ≥130 mg/dL; Trig, triglycerides with high cutoff values at ≥150 mg/dL; N, normal values; Hi, high values; DM, diabetes mellitus.
To further understand the relationship between monocyte HLA-DR expression and the host’s diabetic, obese or dyslipidemic status, we took several analytical approaches. First, we controlled for potential confounders using a one-way ANCOVA with Tukey’s post hoc test. Even though diabetes patients were more likely to be obese, we found that diabetes remained independently associated with a lower HLA-DR density after controlling for BMI (p < 0.05 for all monocyte subsets; Fig 2). We also considered if lipids could be confounders given that dyslipidemias are frequent co-morbidities in diabetes [20]. However, our study population had a high proportion of obese individuals even in the non-diabetic participants (68% in no diabetes and 93.8% in diabetes). Thus, the only lipid with a significant difference by diabetes status was HDL (Table), but diabetes remained independently associated with lower HLA-DR expression after controlling for HDL levels (Fig 2).
Figure 2. Diabetes remains independently associated with HLA-DR expression after controlling for body-mass index or HDL.
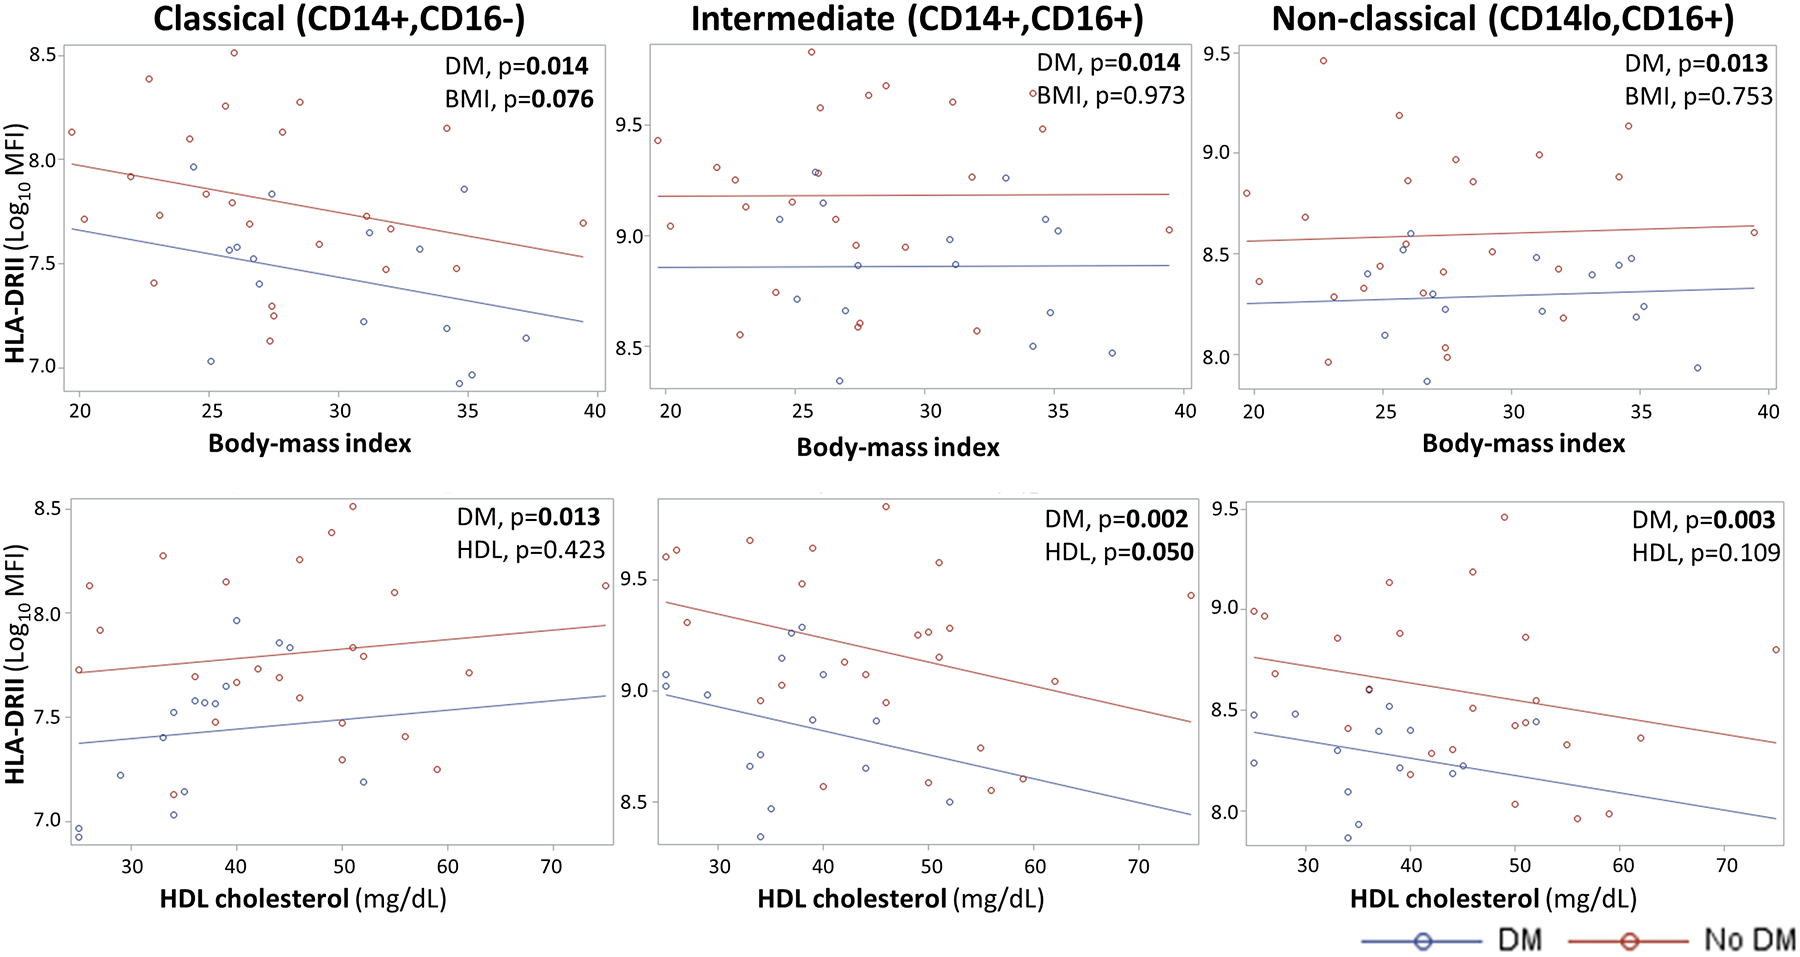
Analysis of covariance (ANCOVA) with Tukey’s post hoc tests indicate that diabetes remains independently associated with lower HLA-DR expression after controlling for body mass index or HDL cholesterol, two characteristics that differed by diabetes status (Table). MFI, median fluorescence intensity; HDL, high-density cholesterol; Significant and borderline significant p values are highlighted with bold text.
Second, we evaluated interactions between HLA-DR expression and each lipid type. We found that the only significant interaction term was HbA1c * triglycerides for all monocytes (p = 0.002) or the classical subset (p= <0.001; Table), even though triglycerides alone were not associated with HLA-DR by bi-variable analysis. Third, we stratified the study groups by diabetes and either high or low LDL cholesterol or triglycerides levels (Fig 1C). Consistent with our findings, boxplots showed that diabetics had monocytes with lower HLA-DR expression, and this reduction was further magnified with high triglycerides, although differences were only significant among the non-diabetic group. In contrast, individuals without diabetes and high LDL cholesterol had the highest HLA-DR MFI for the three monocytes subsets, with this difference being statistically significant for the intermediate and non-classical monocytes (Fig 1C).
4. Discussion
Our findings show lower HLA-DR expression in all the monocyte subsets from diabetes patients, regardless of their dyslipidemic state. Lipids may further affect HLA-DR expression, with triglycerides promoting depression, while cholesterols, particularly LDL, counterbalancing the reductive effect. Our findings complement previous reports of defects in monocytes and macrophages from diabetes patients or mice, with alterations in phenotype (e.g. lower MHC-II, adhesins, Fc-receptors) and function (e.g. reduced phagocytosis, chemotaxis, cytokine expression, response to TLR receptors, higher apoptosis) [4–13]. Our current findings highlight the further contribution of dyslipidemias towards the altered phenotype of monocytes from diabetic patients.
Our results are consistent with some studies in patients with diabetes, but contrast with the findings from Romano et al, who concluded that HLA-DR reduction was due to the higher levels of both cholesterol and triglycerides, and not to diabetes [8, 9]. Our findings in patients are supported by previous in-vitro studies. Exposure of mouse or human macrophages to a free fatty acid like palmitate (a triglyceride precursor), promoted an M2 polarization program that included a reduction in HLA-DR expression [21]. Palmitate mediated this effect by promoting the activation of peroxisome-activated receptor-γ and increasing endoplasmic reticulum stress. Incubation of macrophages with palmitate plus high glucose caused a further reduction in HLA-DR expression [21]. In contrast to triglycerides, in-vitro supplementation with cholesterol leads to an upregulation of HLA-DR expression and antigen presentation in blood monocytes from healthy individuals [22]. These researchers postulated that a high cholesterol uptake may alter the cholesterol to phospholipid ratio in the cell membrane, stabilizing HLA-DR expression [22]. Accordingly, in the classical and non-classical monocytes there was a significant correlation between HLA-DR expression and CD36, a receptor that facilitates the uptake of oxidized low-density cholesterol (Fig 1B). Together, the in-vitro and in-vivo studies illustrate the complex interplay between high glucose, triglycerides and cholesterols on the monocyte phenotype and their ability to present antigen to T cells. Epidemiological studies are now pointing towards the joint contribution of diabetes and body-mass index in tuberculosis risk or outcomes [23–25]. Given that lipids are correlated with body-mass index and are frequently altered in diabetes, a more detailed understanding of the role of triglycerides and the different forms of cholesterol in the context of hyperglycemia warrants further studies.
HLA-DR expression has been proposed as a general marker of monocyte immune competence, with a role in not only in antigen-presentation, but also in the enhancement of TLR-2 mediated signaling, cellular proliferation, maturation, cytokine production and apoptosis [26, 27]. This broader view of HLA-DR is consistent with its identification in the clinical setting as a biomarker (together with CD64) that distinguished survivors from non-survivors among diabetic patients with sepsis.[17]. In oncology studies, the CD14+HLA-DRlo/neg monocytes have not only been shown to have a diminished capacity to present antigens to T cells, but also to be immunosuppressive and predictive of diminished responses to anti-tumor responses and/or poor clinical outcomes [28]. Interestingly, type 2 diabetes patients have a higher risk of certain cancers [29]. Thus, the functional and clinical implications of the lower HLA-DR expression in diabetic monocytes needs further studies.
In summary, our findings suggest that in diabetes patients, a balance between glucose control and blood lipids influence HLA-DR expression in baseline monocytes. In cardiovascular diseases like atherosclerosis, there is an upregulation of HLA-DR antigens, even in non-immune cells, that reflects a widespread immune activation linked to the pathology [30]. In contrast, in infections like tuberculosis, higher antigen presentation is beneficial for infection control, and in fact, M. tuberculosis down-regulates HLA-DR expression as a part of its evasion from the host’s immune response [31]. From an evolutionary perspective, one may hypothesize a selective pressure for higher antigen presentation in young humans to ensure survival from infections. However, in contemporary times, antibiotics are available and populations are reaching an older age and are more obese, leading to an increasing prevalence of cardiovascular disease and associated deaths. Hence, our findings with respect to HLA expression in monocytes are in line with the broader hypothesis that the tuberculosis epidemic in previous centuries generated a selective pressure that has led to the high prevalence of metabolic syndrome in contemporary times [32].
Acknowledgements.
We thank the health professionals and Ms. Lucy Ramirez at Nuestra Clinica del Valle in San Juan, Texas, for support with participant enrollment.
Funding.
This work was supported by the National Institutes of Health, National Institute of Allergy and Infectious Diseases (NIAID), grant NIAID 1R21AI144541 to BIR and CJ.
Abbreviations:
- MHC
Major histocompatibility complex
- MFI
Median fluorescence intensity
- HDL
high-density cholesterol
- LDL
low-density cholesterol
- BMI
Body-mass index
- TLR
toll-like receptor
Footnotes
Conflicts of interest.
All the authors declare “No conflict”.
Refereces
- [1].Erener S: Diabetes, infection risk and COVID-19. Mol Metab 2020;39:101044. [DOI] [PMC free article] [PubMed] [Google Scholar]
- [2].Flynn MC, Pernes G, Lee MKS, Nagareddy PR, Murphy AJ: Monocytes, Macrophages, and Metabolic Disease in Atherosclerosis. Front Pharmacol 2019;10:666. [DOI] [PMC free article] [PubMed] [Google Scholar]
- [3].Mozaffarian D, Benjamin EJ, Go AS, Arnett DK, Blaha MJ, Cushman M et al. : Heart disease and stroke statistics--2015 update: a report from the American Heart Association. Circulation 2015;131:e29. [DOI] [PubMed] [Google Scholar]
- [4].Gomez DI, Twahirwa M, Schlesinger LS, Restrepo BI: Reduced Mycobacterium tuberculosis association with monocytes from diabetes patients that have poor glucose control. Tuberculosis 2013;93:192. [DOI] [PMC free article] [PubMed] [Google Scholar]
- [5].Restrepo BI, Twahirwa M, Rahbar MH, Schlesinger LS: Phagocytosis via Complement or Fc-Gamma Receptors Is Compromised in Monocytes from Type 2 Diabetes Patients with Chronic Hyperglycemia. PLoS. ONE 2014;9:e92977. [DOI] [PMC free article] [PubMed] [Google Scholar]
- [6].Restrepo BI, Schlesinger LS: Host-pathogen interactions in tuberculosis patients with type 2 diabetes mellitus. Tuberculosis. (Edinb.) 2013;93:S10. [DOI] [PMC free article] [PubMed] [Google Scholar]
- [7].Ronacher K, van Crevel R, Critchley JA, Bremer AA, Schlesinger LS, Kapur A et al. : Defining a Research Agenda to Address the Converging Epidemics of Tuberculosis and Diabetes: Part 2: Underlying Biologic Mechanisms. Chest 2017;152:174. [DOI] [PMC free article] [PubMed] [Google Scholar]
- [8].Lopez-Lopez N, Martinez AGR, Garcia-Hernandez MH, Hernandez-Pando R, Castaneda-Delgado JE, Lugo-Villarino G et al. : Type-2 diabetes alters the basal phenotype of human macrophages and diminishes their capacity to respond, internalise, and control Mycobacterium tuberculosis. Mem Inst Oswaldo Cruz 2018;113:e170326. [DOI] [PMC free article] [PubMed] [Google Scholar]
- [9].Romano-Carratelli C, Galdiero M, Bentivoglio C, Nuzzo I, Cozzolino D, Torella R: HLA class II antigens and interleukin-1 in patients affected by type-II diabetes mellitus and hyperlipemia. J Med 1993;24:28. [PubMed] [Google Scholar]
- [10].Komura T, Sakai Y, Honda M, Takamura T, Matsushima K, Kaneko S: CD14+ monocytes are vulnerable and functionally impaired under endoplasmic reticulum stress in patients with type 2 diabetes. Diabetes 2010;59:634. [DOI] [PMC free article] [PubMed] [Google Scholar]
- [11].Vallerskog T, Martens GW, Kornfeld H: Diabetic mice display a delayed adaptive immune response to Mycobacterium tuberculosis. J Immunol 2010;184:6275. [DOI] [PMC free article] [PubMed] [Google Scholar]
- [12].Alim MA, Sikder S, Bridson TL, Rush CM, Govan BL, Ketheesan N: Anti-mycobacterial function of macrophages is impaired in a diet induced model of type 2 diabetes. Tuberculosis (Edinb) 2017;102:47. [DOI] [PubMed] [Google Scholar]
- [13].Lachmandas E, Thiem K, van den Heuvel C, Hijmans A, de Galan BE, Tack CJ et al. : Patients with type 1 diabetes mellitus have impaired IL-1beta production in response to Mycobacterium tuberculosis. Eur J Clin Microbiol Infect Dis 2018;37:371. [DOI] [PMC free article] [PubMed] [Google Scholar]
- [14].Stew SS, Martinez PJ, Schlesinger LS, Restrepo BI: Differential expression of monocyte surface markers among TB patients with diabetes co-morbidity. Tuberculosis 2013;93:S78. [DOI] [PMC free article] [PubMed] [Google Scholar]
- [15].Guirado E, Schlesinger LS: Modeling the Mycobacterium tuberculosis Granuloma - the Critical Battlefield in Host Immunity and Disease. Front Immunol 2013;4:98. [DOI] [PMC free article] [PubMed] [Google Scholar]
- [16].Turina M, Miller FN, Tucker CF, Polk HC: Short-term hyperglycemia in surgical patients and a study of related cellular mechanisms. Ann. Surg 2006;243:845. [DOI] [PMC free article] [PubMed] [Google Scholar]
- [17].Lekka K, Marangos M, Roupas N, Karakantza M, Gogos C, Velissaris D: Evaluation of the Activity of Neutrophils and Monocytes in Diabetic Patients With Sepsis, Can Surface Antigens HLA-DR and CD64 Be Useful as Prognostic Factors? J Clin Med Res 2020;12:157. [DOI] [PMC free article] [PubMed] [Google Scholar]
- [18].Kapellos TS, Bonaguro L, Gemund I, Reusch N, Saglam A, Hinkley ER et al. : Human Monocyte Subsets and Phenotypes in Major Chronic Inflammatory Diseases. Front Immunol 2019;10:2035. [DOI] [PMC free article] [PubMed] [Google Scholar]
- [19].Restrepo BI, Kleynhans L, Salinas AB, Abdelbary BE, Tshivhula H, Aguillon G et al. : Diabetes screen during tuberculosis contact investigations highlights opportunity for diabetes diagnosis and reveals metabolic differences between ethnic groups. Tuberculosis (Edinb) 2018;113:10. [DOI] [PMC free article] [PubMed] [Google Scholar]
- [20].American Diabetes A: 2. Classification and Diagnosis of Diabetes: Standards of Medical Care in Diabetes-2020. Diabetes Care 2020;43:S14. [DOI] [PubMed] [Google Scholar]
- [21].Xiu F, Diao L, Qi P, Catapano M, Jeschke MG: Palmitate differentially regulates the polarization of differentiating and differentiated macrophages. Immunology 2016;147:82. [DOI] [PMC free article] [PubMed] [Google Scholar]
- [22].Hughes DA, Townsend PJ, Haslam PL: Enhancement of the antigen-presenting function of monocytes by cholesterol: possible relevance to inflammatory mechanisms in extrinsic allergic alveolitis and atherosclerosis. Clin Exp Immunol 1992;87:279. [DOI] [PMC free article] [PubMed] [Google Scholar]
- [23].Lin HH, Wu CY, Wang CH, Fu H, Lonnroth K, Chang YC et al. : Association of Obesity, Diabetes, and Risk of Tuberculosis: Two Population-Based Cohorts. Clin Infect Dis 2018;66:699. [DOI] [PMC free article] [PubMed] [Google Scholar]
- [24].Soh AZ, Chee CBE, Wang YT, Yuan JM, Koh WP: Diabetes and body mass index in relation to risk of active tuberculosis: a prospective population-based cohort. Int J Tuberc Lung Dis 2019;23:1277. [DOI] [PubMed] [Google Scholar]
- [25].Kornfeld H, Sahukar SB, Procter-Gray E, Kumar NP, West K, Kane K et al. : Impact of Diabetes and Low Body Mass Index on Tuberculosis Treatment Outcomes. Clin Infect Dis 2020. [DOI] [PMC free article] [PubMed] [Google Scholar]
- [26].Frei R, Steinle J, Birchler T, Loeliger S, Roduit C, Steinhoff D et al. : MHC class II molecules enhance Toll-like receptor mediated innate immune responses. PLoS One 2010;5:e8808. [DOI] [PMC free article] [PubMed] [Google Scholar]
- [27].Hassan GS, Mourad W: An unexpected role for MHC class II. Nat Immunol 2011;12:375. [DOI] [PubMed] [Google Scholar]
- [28].Mengos AE, Gastineau DA, Gustafson MP: The CD14(+)HLA-DR(lo/neg) Monocyte: An Immunosuppressive Phenotype That Restrains Responses to Cancer Immunotherapy. Front Immunol 2019;10:1147. [DOI] [PMC free article] [PubMed] [Google Scholar]
- [29].Collins KK: The diabetes-cancer link. Diabetes Spectr 2014;27:276. [DOI] [PMC free article] [PubMed] [Google Scholar]
- [30].Hansson GK, Jonasson L: The discovery of cellular immunity in the atherosclerotic plaque. Arterioscler Thromb Vasc Biol 2009;29:1714. [DOI] [PubMed] [Google Scholar]
- [31].Gehring AJ, Rojas RE, Canaday DH, Lakey DL, Harding CV, Boom WH: The Mycobacterium tuberculosis 19-kilodalton lipoprotein inhibits gamma interferon-regulated HLA-DR and Fc gamma R1 on human macrophages through Toll-like receptor 2. Infect. Immun 2003;71:4487. [DOI] [PMC free article] [PubMed] [Google Scholar]
- [32].Roth J: Evolutionary speculation about tuberculosis and the metabolic and inflammatory processes of obesity. JAMA 2009;301:2586. [DOI] [PubMed] [Google Scholar]