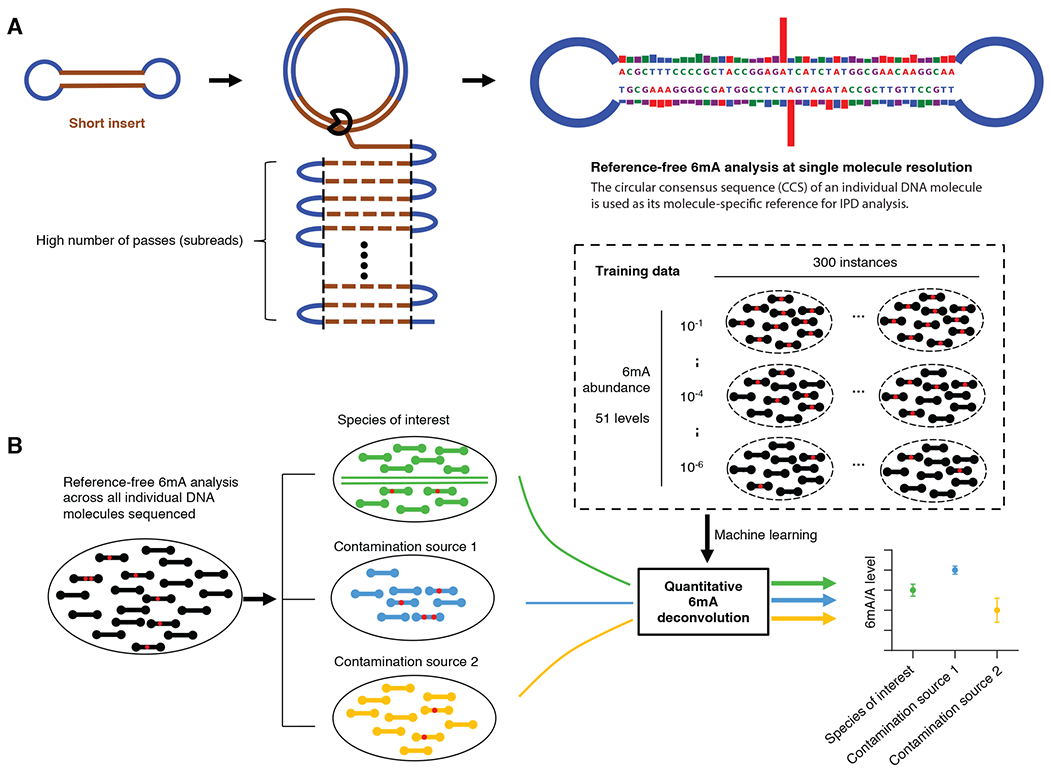
Fig. 1. Overview of 6mASCOPE for quantitative 6mA deconvolution.

(A) Reference-free 6mA analysis of single molecules. Each molecule (short insert) is sequenced for a large number of passes (subreads). The subreads are combined to a circular consensus sequence (CCS), serving as the molecule-specific reference for in silico IPD estimation, and provide repeated measures of IPD values for 6mA analysis (Methods). Blue segment: SMRT adapter. (B) After single molecule 6mA analysis (a red dot indicates a 6mA event), CCSs (black rods) from a sequenced gDNA sample are separated into the eukaryotic genome (green) and contamination sources (blue and yellow). The 6mA/A levels of each species (or genomic region) are estimated using a machine learning model trained across a wide range of 6mA abundance, with defined confidence intervals.
