

Abstract
Purpose
To quantify radiation exposure to the primary operator and staff during PET/CT-guided interventional procedures.
Methods
In this prospective study, 12 patients underwent PET/CT-guided interventions over a 6 month period. Radiation exposure was measured for the primary operator, the radiology technologist, and the nurse anesthetist by means of optically stimulated luminescence dosimeters. Radiation exposure was correlated with the procedure time and the use of in-room image guidance (CT fluoroscopy or ultrasound).
Results
The median effective dose was 0.02 (range 0–0.13) mSv for the primary operator, 0.01 (range 0–0.05) mSv for the nurse anesthetist, and 0.02 (range 0–0.05) mSv for the radiology technologist. The median extremity dose equivalent for the operator was 0.05 (range 0–0.62) mSv. Radiation exposure correlated with procedure duration and with the use of in-room image guidance. The median operator effective dose for the procedure was 0.015 mSv when conventional biopsy mode CT was used, compared to 0.06 mSv for in-room image guidance, although this did not achieve statistical significance as a result of the small sample size (p = 0.06).
Conclusion
The operator dose from PET/CT-guided procedures is not significantly different than typical doses from fluoroscopically guided procedures. The major determinant of radiation exposure to the operator from PET/CT-guided interventional procedures is time spent in close proximity to the patient.
Keywords: Ablation, Clinical practice, Experimental IR, Interventional oncology, Nonvascular interventions, PET/CT, Radiation protection
Introduction
Image guidance for transcutaneous ablation is typically done with computed tomography (CT) or ultrasound [1, 2]. When inherent tissue contrast between tumor and normal parenchyma within an organ is minimal, additional techniques such as the use of intravenous contrast can aid visualization. The conspicuity of a lesion with intravenous contrast, however, is fleeting. Peak enhancement at CT with blood pool contrast agents occurs at about 90 s after injection [3], then rapidly dissipates [4]. As a consequence, there is a very short time window where contrast enhancement aids targeting. Lipiodol tumor staining can also prolong lesion conspicuity, but it necessitates arteriography, with its attendant risks. In addition, it is inconvenient because it generally cannot be performed simultaneously in most CT rooms [5]. Other imaging modalities such as magnetic resonance imaging (MRI) can also help, but physical and safety limitations and availability restrict its utility.
Fluorine-18 fluorodeoxyglucose (18F-FDG) positron emission tomography CT (PET/CT) combines imaging of the metabolic characteristics of malignant tumors apparent on PET and the anatomical detail of CT. This provides an attractive image guidance technique for metabolically active targets that are inconspicuous, difficult to visualize, or not detected by CT or MRI [6, 7]. The patient radiation dose from PET/CT, however, can be significant. The effective patient dose from the diagnostic PET component is typically in the range of 8–9 mSv [8]. The diagnostic CT dose is variable depending on the protocol used, but it can lead to a total PET/CT dose of up to 32 mSv [9].
18F-FDG has a photon energy of 511 keV, far in excess of the typical scattered photon energies interventional radiologists are exposed to while performing CT and fluoroscopically guided procedures [10]. Personal protective equipment, such as lead aprons or glasses worn by radiologists for conventional fluoroscopically guided procedures, are ineffective against PET photons’ annihilation energy [11]. Once the patient has been injected with the radiopharmaceutical, the radiologist has minimal control over the radiation emitted from the patient, in contrast to fluoroscopically or CT-guided procedures, where the amount and quality of x-rays is directly controlled by the operator. Although newer navigation systems that combine historical and real-time imaging data from multiple modalities can be used [12], they may not have recent diagnostic PET/CT data to draw from, and patients may be in different positions during the ablation procedure. Reported mean tracking errors with navigation systems are in the range of 6 mm, which may be unacceptable for small lesions in critical locations [13].
Although the patient may benefit from the therapeutic advantages of PET/CT for image guidance in cases where target lesions are best visualized with PET/CT, few data exist concerning the dose to the interventional radiologist and staff who perform the procedure. The aim of this study the to evaluate the radiation exposure to the interventional radiologist and staff during PET/CT-guided tumor ablation.
Materials and Methods
From September 2010 to March 2011, as part of a quality improvement project, 12 patients were prospectively enrolled. Radiation exposure data during PET/CT-guided interventions were collected.
Each PET/CT-guided intervention was performed according to a standard protocol. The patient was injected with a standard diagnostic dose of approximately 444 MBq (12 mCi) 18F-FDG approximately 45–60 min before the procedure. When possible, the patient voided urine before the procedure. All cases were performed with general anesthesia with paralysis for full muscle relaxation. Imaging was performed on a GE Discovery PET/CT 690 platform (General Electric, Milwaukee, WI). The patient was anesthetized on the PET/CT scanner before the acquisition of any images. Once the patient was anesthetized, a full body diagnostic PET/CT was performed consisting of 10–12 table positions each of 2 min duration. This acquisition was performed with slow, shallow breathing. If the patient had undergone a recent diagnostic PET/CT, this full diagnostic PET/CT acquisition was omitted, and the previous PET/CT was used for initial localization of the target lesion. Subsequently, a 2 min PET acquisition of the organ to be targeted was performed at one table position. Planning CT scans of the same region were obtained, and these two data sets were fused to allow for planning of the access route to the target lesion. Patients were preoxygenated with a fractional inhaled oxygen concentration (FiO2) of 100 % to facilitate artificial suspension of respiration during image acquisition to minimize motion artifact and allow better registration of PET and CT data sets. The interventional procedure was then performed in the standard manner for an image-guided intervention using conventional biopsy mode CT, CT fluoroscopy, or combined ultrasound and CT guidance. CT images of the device or needle in position were again fused to the PET data set to confirm accurate needle position within the PET-avid target lesion. Fusion of the most recently acquired CT images with the PET data set acquired at the beginning of the procedure was typically repeated multiple times during the procedure.
Operator radiation doses were recorded with an optically stimulated luminescence dosimeter (Luxel+ ; Landauer, Glenwood, IL). The badge was worn on the operator’s chest, and when CT fluoroscopy was used, the badge was worn underneath the lead apron. Extremity dose equivalent was monitored by a thermoluminescent ring dosimeter. Procedure duration was defined as the time from induction of anesthesia to completion of the procedure.
For purposes of analysis, cases were grouped by the type of in-room image guidance (CT fluoroscopy/ultrasound vs. conventional CT biopsy mode). Continuous variables were compared by groups by the Wilcoxon rank sum test. The Wilcoxon rank sum test was used to evaluate whether the distributions differed significantly between the two groups. Spearman rank correlation coefficients were estimated to describe the linear association of procedure duration with effective dose and with extremity dose equivalent. Spearman’s rank correlation test was used to assess whether the correlation differs significantly from zero. All statistical tests were performed by SAS software, version 9.2 (SAS Institute, Cary, NC).
Results
Data from 12 adult patients were evaluated. There were seven men and five women ranging in age from 35 to 67 years with a median age of 57 years. Ten patients underwent radiofrequency ablations, one had microwave ablation, and one had a core needle biopsy. Nine procedures were performed in the liver, one in the lung, one in the pelvis, and one in bone. The diagnoses were as follows: nine colorectal cancer metastases, one prostate cancer metastasis, one sarcoma, and one head and neck cancer metastasis.
All patients underwent general anesthesia. The mean procedure time was 276 (range 121–386) min. The median injected dose of FDG was 447.7 MBq (12.1 mCi) (range 410.7–484.7 MBq). The median uptake time from injection to initial image acquisition was 68 (range 36–123) min. Six procedures were performed with in-room image guidance (CT fluoroscopy or ultrasound), and six were performed with conventional biopsy mode CT. A median of 390 (range 61–3,128) CT images were acquired per case, excluding postprocessed reformats and fused images. A median of 4 (range 1–12) needle placements were performed per case.
Doses were measured for every case for the primary operator (whole body and extremity), the nurse anesthetist, and the radiology technologist (Fig. 1). The median dose for the primary operator was 0.02 (range 0–0.13) mSv, for the nurse anesthetist 0.01 (range 0–0.05) mSv, and for the radiology technologist 0.02 (range 0–0.05) mSv. The median hand dose for the operator was 0.05 (0–0.62) mSv.
Fig. 1.
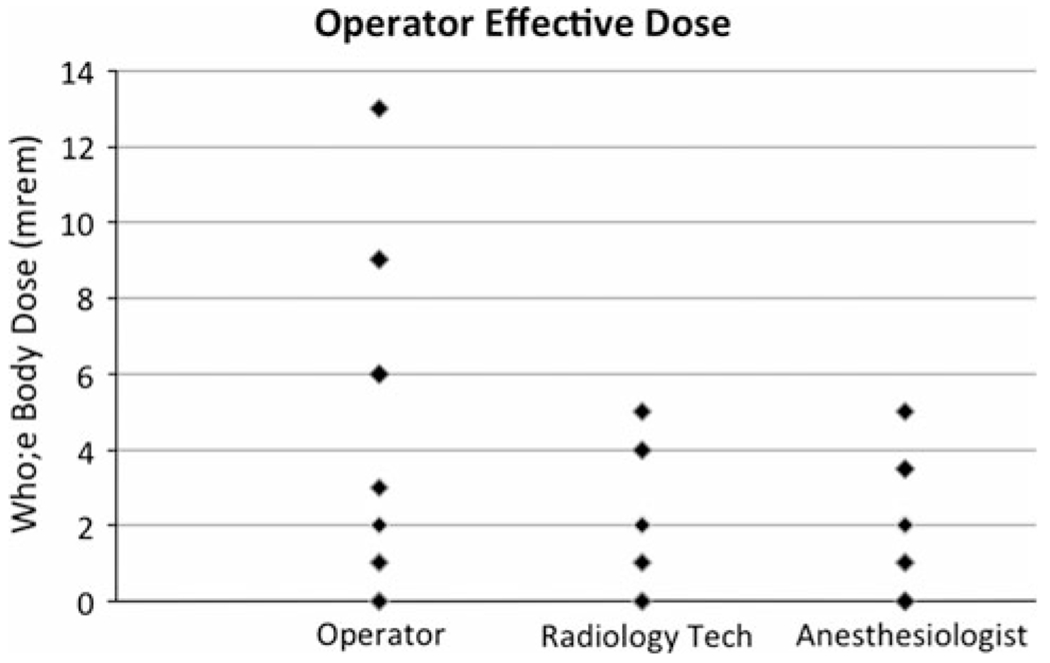
Scatter plot showing the distribution of effective doses for the primary operator, the radiology technologist, and the anesthesiologist per case
Figure 2 shows the operator total body dose compared to procedure time. This shows a trend toward higher radiation doses with longer procedures. This relationship was tested with Spearman’s rank correlation test but did not achieve statistical significance as a result of the small sample size (Table 1).
Fig. 2.
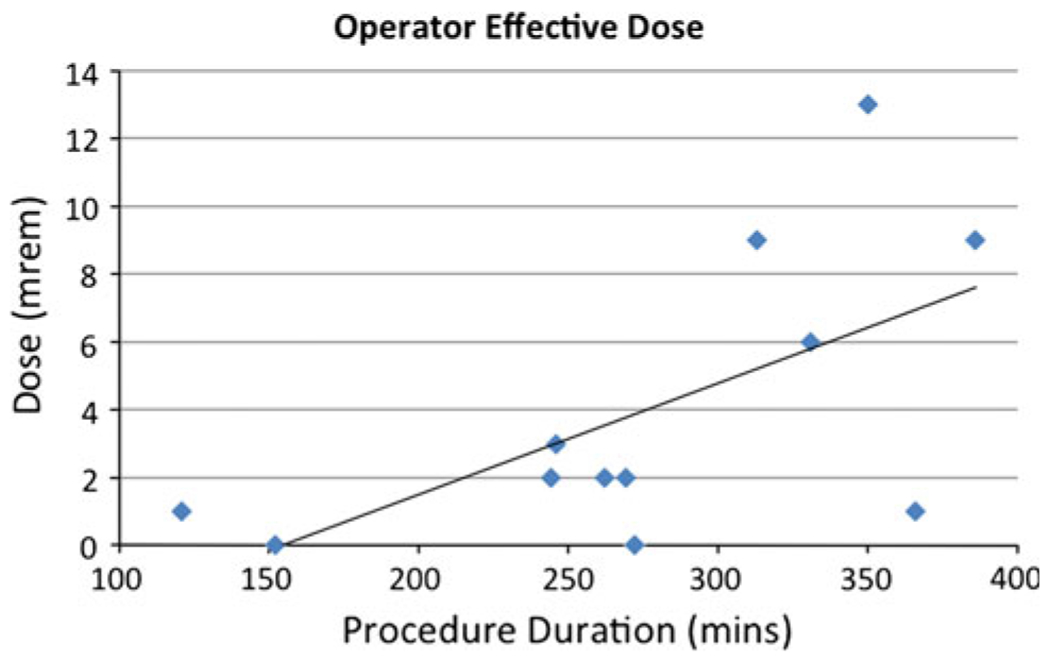
Scatter plot with trend line showing the distribution of effective doses for the primary operator plotted against individual procedure time. The trend line demonstrates a tendency to higher doses for longer procedures
Table 1.
Association between procedure duration, effective dose, and extremity dose
| Dose | Procedure duration Spearman correlation | p |
|---|---|---|
| Effective dose | 0.53 | 0.07 |
| Extremity dose equivalent | 0.54 | 0.07 |
Tested by Spearman’s rank correlation test; statistical significance was not achieved
When the operator dose was stratified by the use of in-room image guidance, the operator total body dose and extremity dose equivalent were significantly higher with the use of in-room image guidance (Figs. 3, 4). When corrected for procedure time, a stronger association was found between operator dose and the use of CT fluoroscopy (Fig. 5). This relationship was tested with the Wilcoxon rank sum test but did not achieve statistical significance as a result of the small sample size (Table 2). No relationship was observed for other staff, including technologists and anesthesiologists.
Fig. 3.
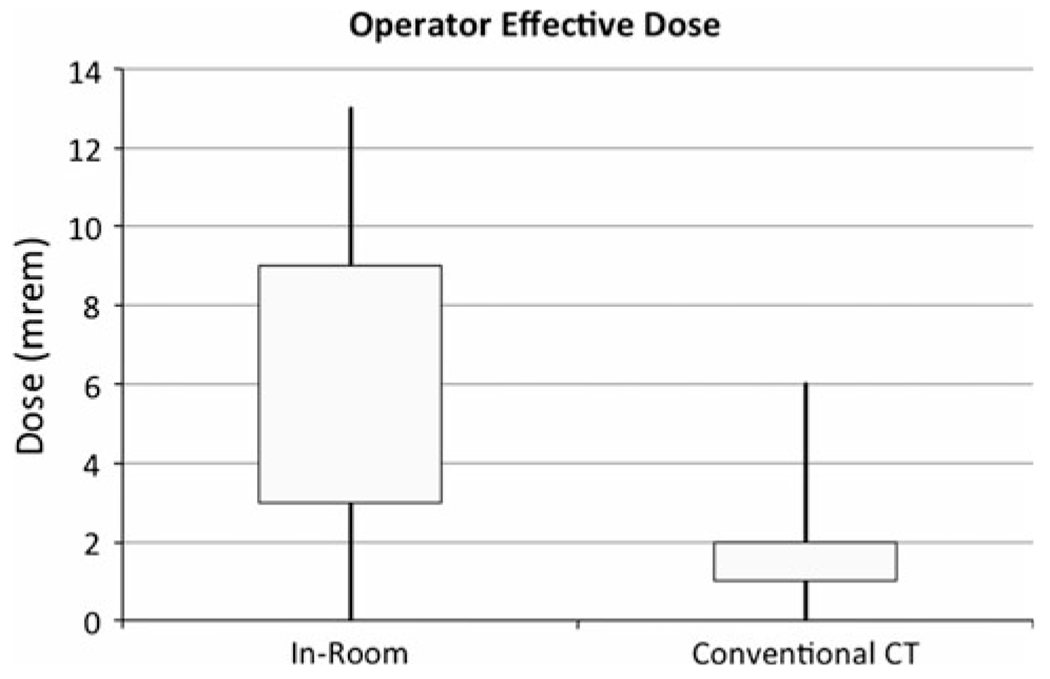
Box plots showing interquartile ranges with minima and maxima for operator total body dose for in-room image guidance and conventional CT. Operator total body doses are higher for in-room image guidance cases
Fig. 4.
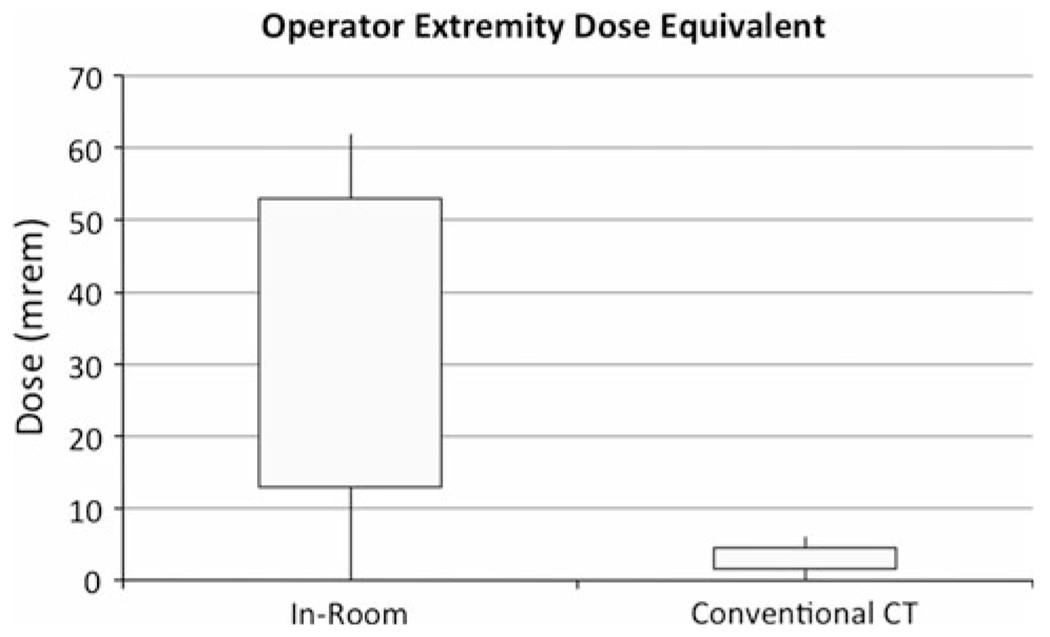
Box plots showing interquartile ranges with minima and maxima for operator extremity dose equivalent for in-room image guidance and conventional CT cases. Operator extremity dose equivalents are higher for in-room image guidance cases
Fig. 5.
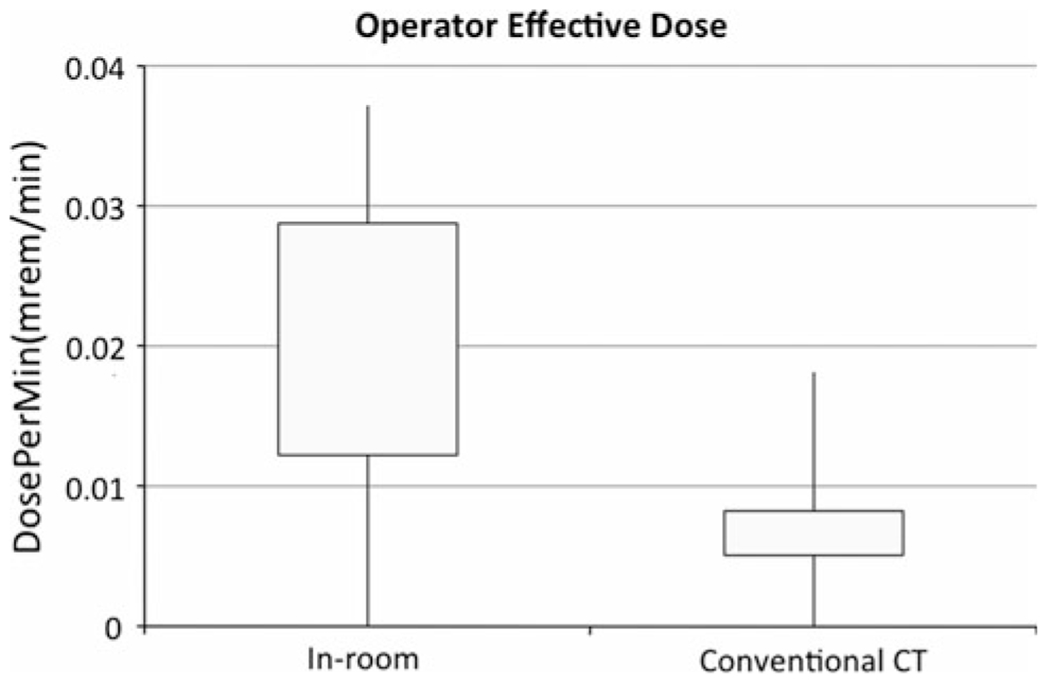
Box plots showing interquartile ranges with minima and maxima for operator effective dose rate (operator dose/procedure time) for in-room image guidance and conventional CT cases. Even when corrected for procedure duration, operator total body doses remain higher for in-room image guidance
Table 2.
Data stratified by use of in-room image guidance shows a trend toward higher effective dose, extremity dose equivalent, and dose rate with the use of in-room image guidance. These relationships did not achieve statistical significance when tested with the Wilcoxon rank sum test
| Dose | Conventional CT (n = 6) |
In-room image guidance (n = 6) |
p-valuea | ||
|---|---|---|---|---|---|
| Median | Range | Median | Range | ||
| Effective dose (mSv) | 0.015 | 0–0.06 | 0.06 | 0–0.13 | 0.12 |
| Extremity dose equivalent (mSv) | 0.03 | 0–0.06 | 0.32 | 0–0.62 | 0.06 |
| Dose rate (mSv/min) | 0.00008 | 0–0.0002 | 0.0002 | 0–0.0004 | 0.18 |
p-value is from the aWilcoxon rank sum test
Discussion
The United States Nuclear Regulatory Commission imposes annual exposure limits for radiation workers of 50 mSv for total effective dose equivalent and 500 mSv for extremity dose equivalent [14]. The estimated background radiation in the US is 6.2 mSv per year [15]. With a median radiation dose of just 0.02 mSv per case, the impact of PET/CT guidance on the annual radiation exposure of radiologists in our practice is negligible. The dose from PET/CT-guided procedures compares favorably with complex fluoroscopically guided procedures such as thoracoabdominal aortic repair with published doses up to 0.17 mSv per case [16]. An individual could perform up to 2,500 of these procedures a year before reaching the annual exposure limit.
Although the median dose from PET/CT-guided procedures is within an acceptable range for an interventional radiologist, the range of doses in this study was varied with a maximum dose of 0.13 mSv, which is greater than the median dose by a factor of 6.5. Factors that govern radiation exposure in PET/CT are different from those with which interventional radiologists are familiar. In fluoroscopic or CT-guided procedures, the operator controls the radiation dose directly by controlling the x-ray source. The radiologist can limit exposure time; increase distance from the patient when feasible; use low-dose, collimation, and anti-scatter techniques; and wear personal protective devices such as shields to limit their exposure.
PET has a photon energy of 511 keV compared to the typical x-ray photon energy in fluoroscopy of 70–120 keV. CT typically has a maximum photon energy below 140 keV. In addition, the scattered radiation photon energies for fluoroscopy and CT are in the range of about one-third of their peak keV. Personal protective devices including lead shielding, lead aprons, and lead glasses are relatively ineffective against PET radiation. For example, a 0.5 mm Pb equivalent apron will reduce the intensity from 511 keV radiation by just 18 % [11].
In PET, the source of the radiation to the operator and staff is the patient, and the radiologist can take few measures to limit the amount of radiation emitted by the patient. Time spent in the room in close contact with the patient is the single greatest factor governing the operator’s radiation exposure. As expected, our data show that longer procedures are correlated with higher radiation doses, as is the use of CT fluoroscopy or ultrasound for needle placement.
With CT fluoroscopy or ultrasound, the operator is in the room with the patient for more time, as distinct from conventional CT biopsy mode, where the operator steps out of the room between image acquisitions. When corrected for procedure duration, the impact of in-room image guidance is greater. It should be noted that the impact of CT fluoroscopy on the operator dose could not be directly measured in this study; however, published data suggest that this is in the order of 0.025 mSv per case [17]. CT fluoroscopy did not affect the dose to staff other than the operator. Other personnel such as technologists or anesthesiologists tend to step out of the room when the CT scanner is running, irrespective of the mode operation.
Renal clearance is a major mechanism for excretion of 18F-FDG. Animal models estimate that 39–45 % of the injected dose is excreted in the urine [18]. Every patient in this study voided before entering the procedure room, which helped minimize the radiation dose. After 30, 60, and 90 min, the dose rate from 18F is expected to be 91, 83, and 76 %, respectively, of the initial level as a result of radioactive decay alone [19].
In general, the quality of imaging needed for image-guided intervention is less than that for diagnosis across most modalities. For example, most CT-guided procedures can be safely completed with a tube current of 60 mA or less, whereas diagnostic-quality CT typically utilizes over 200 mA. Low-dose techniques may not be of sufficient quality to detect subtle abnormalities, but once an abnormality is documented, it can be targeted by lower-dose imaging techniques. The injected 18F-FDG activity used for patients in this study was in the same range as diagnostic PET/CT. For lesions with a high standardized uptake value on diagnostic PET, it may not be necessary to administer a diagnostic dose of 18F-FDG in order to successfully target the lesion for intervention.
In conclusion, the operator dose from PET/CT-guided procedures is not significantly different than typical doses from fluoroscopically guided procedures. The major determinant of radiation exposure to the operator from PET/CT-guided interventional procedures is time spent in close proximity to the patient. Thus, the perception of increased radiation dose to operator and staff should not limit the expansion of PET/CT as an image guidance tool for image-guided intervention. Rather, different methods to minimize radiation exposure should be emphasized during PET-guided intervention.
Footnotes
Conflict of interest The authors declare that they have no conflict of interest.
Contributor Information
E. Ronan Ryan, Department of Radiology, Memorial Sloan-Kettering Cancer Center, 1275 York Avenue, Suite H118, New York, NY 10065, USA.
Raymond Thornton, Department of Radiology, Memorial Sloan-Kettering Cancer Center, 1275 York Avenue, Suite H118, New York, NY 10065, USA.
Constantinos T. Sofocleous, Department of Radiology, Memorial Sloan-Kettering Cancer Center, 1275 York Avenue, Suite H118, New York, NY 10065, USA
Joseph P. Erinjeri, Department of Radiology, Memorial Sloan-Kettering Cancer Center, 1275 York Avenue, Suite H118, New York, NY 10065, USA
Meier Hsu, Department of Epidemiology and Biostatistics, Memorial Sloan-Kettering Cancer Center, 1275 York Avenue, New York, NY 10065, USA.
Brian Quinn, Department of Medical Physics, Memorial Sloan-Kettering Cancer Center, 1275 York Avenue, New York, NY 10065, USA.
Lawrence T. Dauer, Department of Medical Physics, Memorial Sloan-Kettering Cancer Center, 1275 York Avenue, New York, NY 10065, USA
Stephen B. Solomon, Department of Radiology, Memorial Sloan-Kettering Cancer Center, 1275 York Avenue, Suite H118, New York, NY 10065, USA
References
- 1.Ferrucci JT Jr, Wittenberg J (1978) CT biopsy of abdominal tumors: aids for lesion localization. Radiology 129:739–744 [DOI] [PubMed] [Google Scholar]
- 2.Rasmussen SN, Holm HH, Kristensen JK et al. (1972) Ultrasonically-guided liver biopsy. Br Med J 2:500–502 [DOI] [PMC free article] [PubMed] [Google Scholar]
- 3.Chambers TP, Baron RL, Lush RM et al. (1994) Hepatic CT enhancement: comparison of ionic and nonionic contrast agents in the same patients. Radiology 190:721–725 [DOI] [PubMed] [Google Scholar]
- 4.Burns PN, Wilson SR (2007) Focal liver masses: enhancement patterns on contrast-enhanced images—concordance of US scans with CT scans and MR images. Radiology 242:162–174 [DOI] [PubMed] [Google Scholar]
- 5.Sato M, Watanabe Y, Tokui K et al. (2000) CT-guided treatment of ultrasonically invisible hepatocellular carcinoma. Am J Gastroenterol 95:2102–2106 [DOI] [PubMed] [Google Scholar]
- 6.Schoellnast H, Larson SM, Nehmeh SA et al. (2011) Radiofrequency ablation of non-small-cell carcinoma of the lung under real-time FDG PET CT guidance. Cardiovasc Interv Radiol 34(suppl 2):S182–S185 [DOI] [PubMed] [Google Scholar]
- 7.Tatli S, Gerbaudo V, Feeley C et al. (2011) PET/CT-guided percutaneous biopsy of abdominal masses: initial experience. J Vasc Interv Radiol 22:507–514 [DOI] [PubMed] [Google Scholar]
- 8.Valentin J (1998) Radiation dose to patients from radiopharmaceuticals (addendum 2 to ICRP publication 53). Ann ICRP 28:1–126 [DOI] [PubMed] [Google Scholar]
- 9.Huang B, Law MWM, Khong PL (2009) Whole-body PET/CT scanning: estimation of radiation dose and cancer risk. Radiology 251:166–174 [DOI] [PubMed] [Google Scholar]
- 10.National Council on Radiation Protection and Measurements (2011) Radiation Dose Management for Fluoroscopically Guided Interventional Medical Procedures. National Council on Radiation Protection and Measurements, Bethesda [Google Scholar]
- 11.Ahmed S, Zimmer A, McDonald N et al. (2007) The effectiveness of lead aprons in reducing radiation exposures from specific radionuclides. J Nucl Med Meeting Abstr 48:470 [Google Scholar]
- 12.Krücker J, Xu S, Venkatesan A et al. (2011) Clinical utility of real-time fusion guidance for biopsy and ablation. J Vasc Interv Radiol 22:515–524 [DOI] [PMC free article] [PubMed] [Google Scholar]
- 13.Venkatesan AM, Kadoury S, Abi-Jaoudeh N et al. (2011) Real-time FDG PET guidance during biopsies and radiofrequency ablation using multimodality fusion with electromagnetic navigation. Radiology 260:848–856 [DOI] [PMC free article] [PubMed] [Google Scholar]
- 14.Khandani AH, Calvo BF, O’Neil BH et al. (2007) A pilot study of early 18F-FDG PET to evaluate the effectiveness of radiofrequency ablation of liver metastases. AJR Am J Roentgenol 189:1199–1202 [DOI] [PubMed] [Google Scholar]
- 15.United Nations Scientific Committee on the Effects of Atomic Radiation (2000) Sources and Effects of Ionizing Radiation. UNSCEAR (2000) Report to the General Assembly, with Scientific Annexes. United Nations, New York [Google Scholar]
- 16.Panuccio G, Greenberg RK, Wunderle K et al. (2011) Comparison of indirect radiation dose estimates with directly measured radiation dose for patients and operators during complex endovascular procedures. J Vasc Surg 53:885–894 [DOI] [PubMed] [Google Scholar]
- 17.Paulson EK, Sheafor DH, Enterline DS et al. (2001) CT fluoroscopy—guided interventional procedures: techniques and radiation dose to radiologists. Radiology 220:161–167 [DOI] [PubMed] [Google Scholar]
- 18.Moran JK, Lee HB, Blaufox MD (1999) Optimization of urinary FDG excretion during PET imaging. J Nucl Med 40:1352–1357 [PubMed] [Google Scholar]
- 19.Madsen MT, Anderson JA, Halama JR et al. ; AAPM Task Group 108 (2006) PET and PET/CT shielding requirements. Med Phys 33:4–15 [DOI] [PubMed] [Google Scholar]