Abstract
Improving the imaging speed of multi-parametric photoacoustic microscopy (PAM) is essential to leveraging its impact in biomedicine. However, to avoid temporal overlap, the A-line rate is limited by the acoustic speed in biological tissues to a few MHz. Moreover, to achieve high-speed PAM of the oxygen saturation of hemoglobin (sO2), the stimulated Raman scattering effect in optical fibers has been widely used to generate 558 nm from a commercial 532 nm laser for dual-wavelength excitation. However, the fiber length for effective wavelength conversion is typically short, corresponding to a small time delay that leads to a significant overlap of the A-lines acquired at the two wavelengths. Increasing the fiber length extends the time interval, but limits the pulse energy at 558 nm. In this Letter, we report a conditional generative adversarial network-based approach, which enables temporal unmixing of photoacoustic A-line signals with an interval as short as ~38 ns, breaking the physical limit on the A-line rate. Moreover, this deep learning approach allows the use of multi-spectral laser pulses for PAM excitation, addressing the insufficient energy of monochromatic laser pulses. This technique lays the foundation for ultra-high-speed multi-parametric PAM.
Capable of quantifying blood oxygenation and hemodynamics at the microscopic level via spectroscopic, statistical, and correlation analyses [1], multi-parametric photoacoustic microscopy (PAM) has found broad biomedical applications [2–4]. To further leverage its impact, recent advances have improved the A-line rate of multi-parametric PAM to more than 1 MHz, enabling real-time functional monitoring [5]. Although exciting, the ever-increasing A-line rate is approaching the physical limit imposed by the acoustic speed in biological tissues. Indeed, it takes ~1/3 μs for the light-generated ultrasonic wave to travel through 500 μm of tissue and reach the acoustic detector. To avoid temporal overlap between sequentially acquired A-lines, the maximum A-line rate is limited to ~3 MHz.
Moreover, to distinguish oxy- and deoxy-hemoglobin (i.e., HbO2 and HbR, respectively) for the quantification of blood oxygenation (i.e., sO2), a dual-wavelength excitation at 532 nm and 558 nm is typically employed in multi-parametric PAM [6–8]. Because high-repetition-rate dual-wavelength nanosecond-pulsed lasers are not commercially available for this application, the stimulated Raman scattering (SRS) effect in optical fibers has been used by us and others to partially shift the 532-nm output of commercial lasers to 558 nm for the dual-wavelength PAM excitation [7,8]. Although promising, the fiber length for the effective SRS-based wavelength conversion is typically ~10 m, which corresponds to a time delay of ~50 ns. Since the delay is much smaller than the typical length of an A-line signal (~1/3 μs for 500-μm depth recording), the A-lines successively acquired at the two wavelengths overlap with each other, which compromises the accuracy of the sO2 measurement. Multiple approaches have been developed to address this issue. For example, two lasers operating at different wavelengths can be triggered sequentially to produce the dual-wavelength pulses with a sufficient time interval [6], or an electro-optic modulator can be used to switch the laser pulses between two different optical paths (with or without SRS) for pulse-by-pulse wavelength conversion [7]. Alternatively, a long fiber can be used to significantly delay the laser pulses [9]. However, these methods either result in limited pulse energy [9] or require additional equipment [6,7]. Moreover, they cannot break the physical limit imposed by the acoustic speed in tissue. Recently, a frequency-domain approach was developed to digitally unmix temporally overlapping photoacoustic signals [10]. However, the time expense of this method is high (i.e., several hours), and the recovered microvascular sO2 is inaccurate. Besides, this approach assumes that the A-line signals acquired at different wavelengths have identical waveforms, which, however, is not necessarily true.
The past decade sees a widespread adoption of deep learning [11–13]. Although convolutional neural networks are widely used in deep learning, human interventions are often needed to design effective losses. In contrast, the conditional generative adversarial network (cGAN) automatically learns a loss that adapts to the data. Thus, it can be applied to a variety of tasks that would otherwise require the design of different loss functions, and is well suited for image-to-image translation tasks [14]. Offering these advantages, the cGAN has been applied to biomedical image analysis [15–17]. Although the training process is data-hungry and time-consuming, it takes only a single effort (i.e., once the cGAN is established, no re-training is needed and the equipment used to generate the training data can be repurposed). In this Letter, we adopt a cGAN model [14] to reliably unmix photoacoustic signals with a time delay as short as ~38 ns without any prior assumption on the signal waveform. In addition, to demonstrate the utility of this cGAN model in situations where the energy of monochromatic pulses produced by the SRS process is limited [9], we intentionally use multi-spectral pulses for PAM excitation and apply the model for spectral unmixing. Our results show that this cGAN model can quantitatively recover hemoglobin concentration (CHb), sO2, and blood flow with high accuracy in vivo.
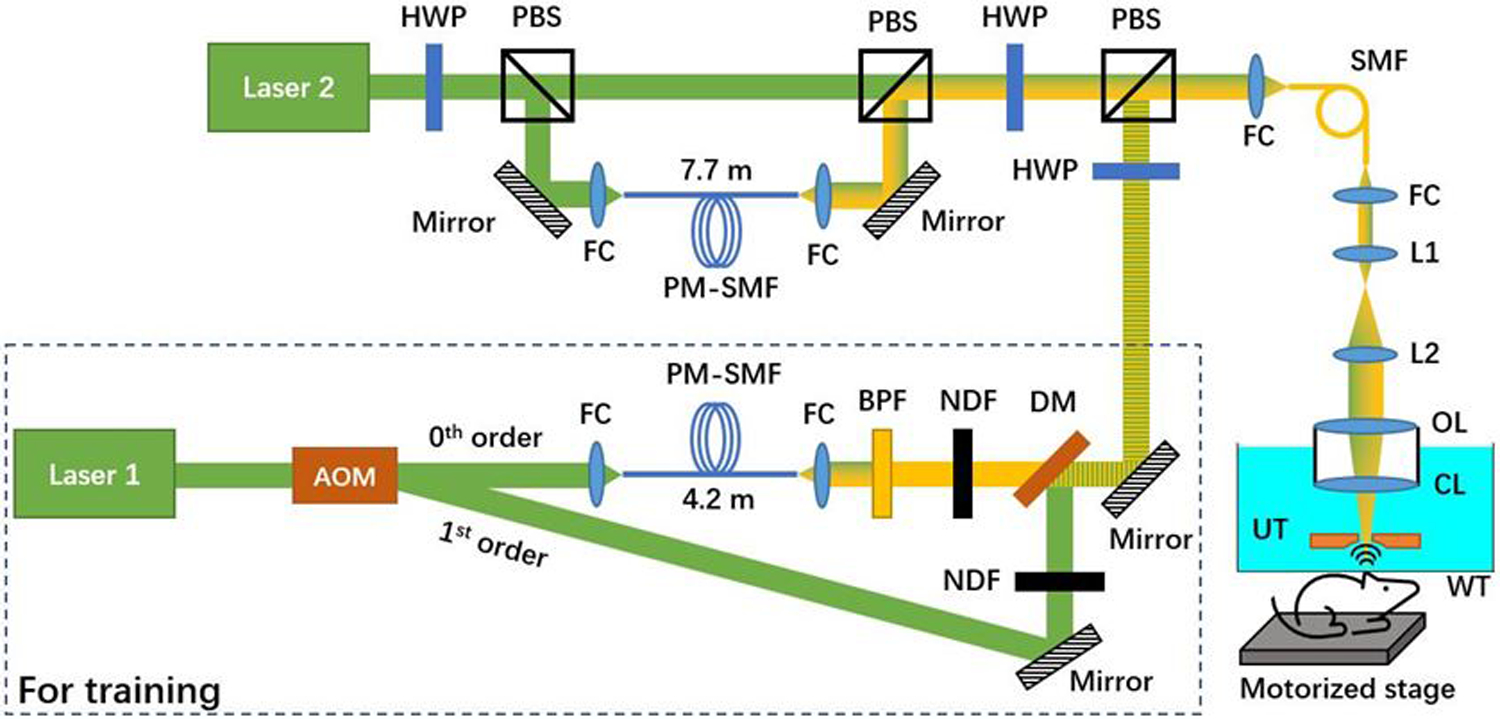
As shown in Fig. 1, the optical components in the dashed box generate 532-nm and 558-nm nanosecond pulses for conventional PAM imaging. Laser 1 (GLPM-10, IPG Photonics; wavelength: 532 nm) operates at a repetition rate of 20 kHz. Individual pulses from this laser are switched between two optical paths by an acousto-optic modulator (AOM; AOMO 3080–122, Crystal Technology). When the AOM is off, the laser light passes through it without diffraction (i.e., 0th order) and is coupled into a 4.2-m polarization-maintaining single-mode fiber (PM-SMF, HB450-SC, Fibercore) through a fiber coupler (CFC-11X-A, Thorlabs). The SRS in the PM-SMF leads to red-shifts of the laser wavelength. Then, a bandpass filter (CT560/10bp, Chroma) is used to select out the 558-nm component. When the AOM is on, ~60% of the 532-nm light is diffracted (i.e., 1st-order diffraction) into the second optical path, where no wavelength conversion is implemented. Due to the low energy, the other ~40% of the diffracted light does not undergo the SRS-based wavelength conversion and is rejected by the bandpass filter. Thus, pulse-by-pulse wavelength switching is realized by triggering the AOM at 10 kHz. Next, the 532- and 558-nm pulses are combined via a dichroic mirror (FF538-FDi01, Semrock) and coupled into a 1-m long single-mode optical fiber (SMF, P1–460Y-FC-1, Thorlabs) for conventional PAM imaging, which provides the ground truth for deep learning. Note that this part (in the dashed box) is no longer needed once the one-time training is completed. The SMF output is then collimated by a fiber coupler, magnified by a pair of lenses (L1, AC254–050-A, Thorlabs; L2, AC254–300-A, Thorlabs), and focused into the object to be imaged by an objective lens (AC254–050-A, Thorlabs), through a correction lens and the central opening of a ring-shaped ultrasonic transducer (UT; inner diameter: 1.1 mm; outer diameter: 3.0 mm; focal length: 4.4 mm; center frequency: 40 MHz; 6-dB bandwidth: 69%). The optically excited ultrasonic wave is detected by the UT, amplified by a low-noise amplifier (HD28082, HD Communications), and acquired by a high-speed data acquisition board (DAQ, ATS9350, AlazarTech) at 500 MS/s. For 2D raster scan, the object is mounted on a two-axis scanner with a pair of motorized linear stages (L-509, Physik Instrumente). For acoustic coupling, the UT and CL are immersed in the water tank. A thin layer of ultrasound gel (Aquasonic CLEAR, Parker Laboratories) is applied between the object and a piece of polyethylene membrane at the bottom of the water tank. A field-programmable gate array (PCIe-7842r, National Instruments) is programmed to synchronize the lasers, AOM, motorized stages, and DAQ during the image acquisition.
Fig. 1.

Schematic of the experimental setup. The optical components in the dashed box capture data for training the cGAN. AOM, acousto-optic modulator; FC, fiber coupler; PM-SMF, polarization-maintaining single mode optical fiber; BPF, bandpass filter; NDF, neutral density filter; DM, dichroic mirror; HWP, half-wave plate; PBS, polarizing beamsplitter; OL, objective lens; CL, correction lens; UT, ultrasonic transducer; WT, water tank.
In parallel, Laser 2 (GLPM-10-Y13, IPG Photonics; wavelength: 532 nm) operates at 10 kHz, and the pulses are split by a half-wave plate (HWP, WPH05M-532, Thorlabs) combined with a polarizing beamsplitter (PBS, PBS121, Thorlabs). The horizontally polarized component passes through the PBS, while the vertically polarized component is reflected by the PBS and coupled into a 7.7-m-long PM-SMF. With the short delay (~38 ns) induced by the PM-SMF, the A-line signals generated by the 532-nm and the multi-spectral pulses are expected to have a significant overlap. The two optical paths are combined by a PBS. The combined beam is intensity-modulated by an HWP and a PBS, before being merged with the excitation beam of the conventional PAM system and entering the scanning head through the SMF. The integration of the two PAM systems (i.e., the new cGAN-based system with overlapping A-lines and the conventional system with non-overlapping A-lines) allows concurrent acquisition of multi-parametric images over the same region of interest for supervised learning.
Besides the A-line overlap, another unique aspect of the present technique is the use of multi-spectral rather than monochromatic pulses for PAM excitation. Harnessing all wavelength components generated in the SRS process can effectively address the signal-to-noise ratio (SNR) issue in high-speed PAM where the pulse energy is limited by the fiber damage threshold [7] and in cases where the SRS is less efficient due to relatively long laser pulse durations [9]. Given that the cGAN model can reliably identify the relationship of correlated objects [14], we intentionally challenge the cGAN model with the multi-spectral pulse, mimicking situations where the 558-nm component alone cannot provide sufficient SNR. Specifically, the energy of the multi-spectral pulse (the 532, 545, and 558-nm components each occupy 13.5%, 21.1%, and 65.4%, respectively) is set to 100 nJ at the tissue surface, by adjusting the HWP.
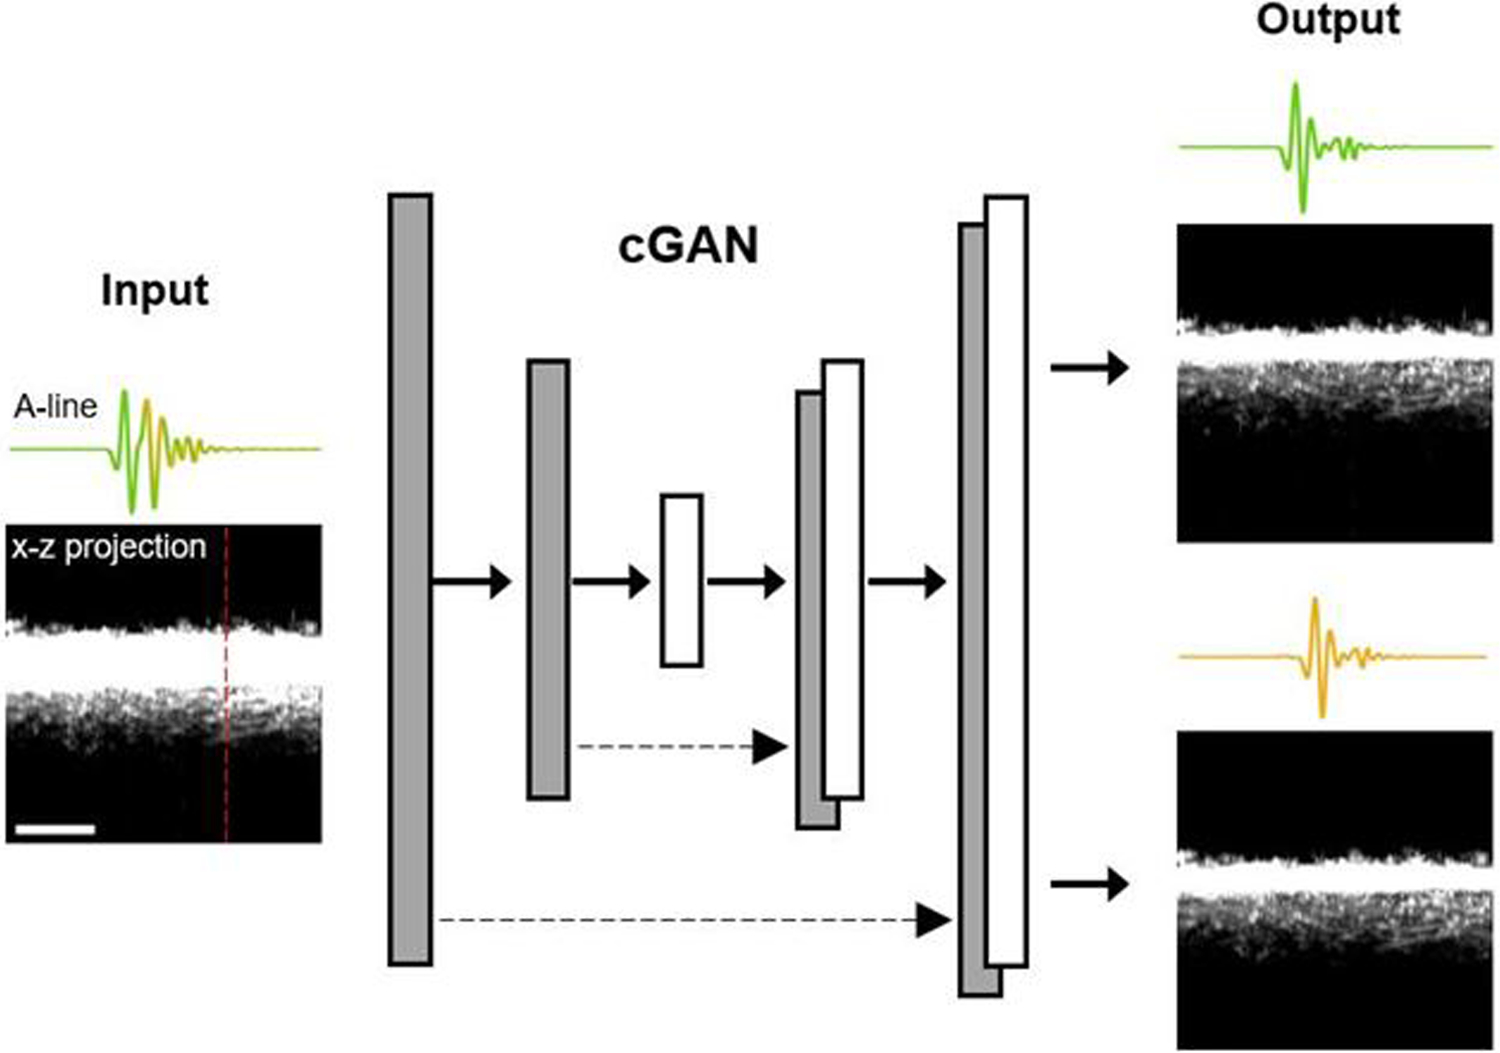
As shown in Fig. 2, the input of the cGAN is the mixed signals generated by the 532-nm and the multi-spectral pulses. The x-z projection image and a representative A-line on the left show the significant overlap of the two signals. The image data generated by the conventional PAM with widely separated 532-nm and 558-nm pulses are used as targets to train the cGAN, where the target is the desired output of the cGAN for a given input. The cGAN learns to uncover the relationship between the input (i.e., B-scan with mixed A-lines) and the target (i.e., B-scan with non-overlapping A-lines or the ground truth). Once the training is completed, the cGAN can reliably unmix the input and generate non-overlapping A-lines at 532 nm and 558 nm with high accuracy.
Fig. 2.

Schematic of the cGAN. The grayscale images are x-z projections of the three-dimensional dataset. A representative A-line, along the red dashed line, is shown above each of the x-z projection images. Scale bar: 300 μm.
The architecture of the cGAN is adopted from the original model [14], and the same set of parameters are used for both numerical simulation and in vivo test. Specifically, the number of images for training is 15,600. The image sizes of the input and output are set to 256×256×1 and 256×256×2 pixels, respectively. Both the buffer size and the batch size are set to 1. The number of epochs is set to 10. The architecture of upsample and downsample layers remains the same as in the original model [14]. The random jitter function is disabled to avoid scaling and cropping because each pixel in the image has a fixed step size. For the total generator loss, the weight of the mean absolute error between the generated image and the target image is set to 2,000.
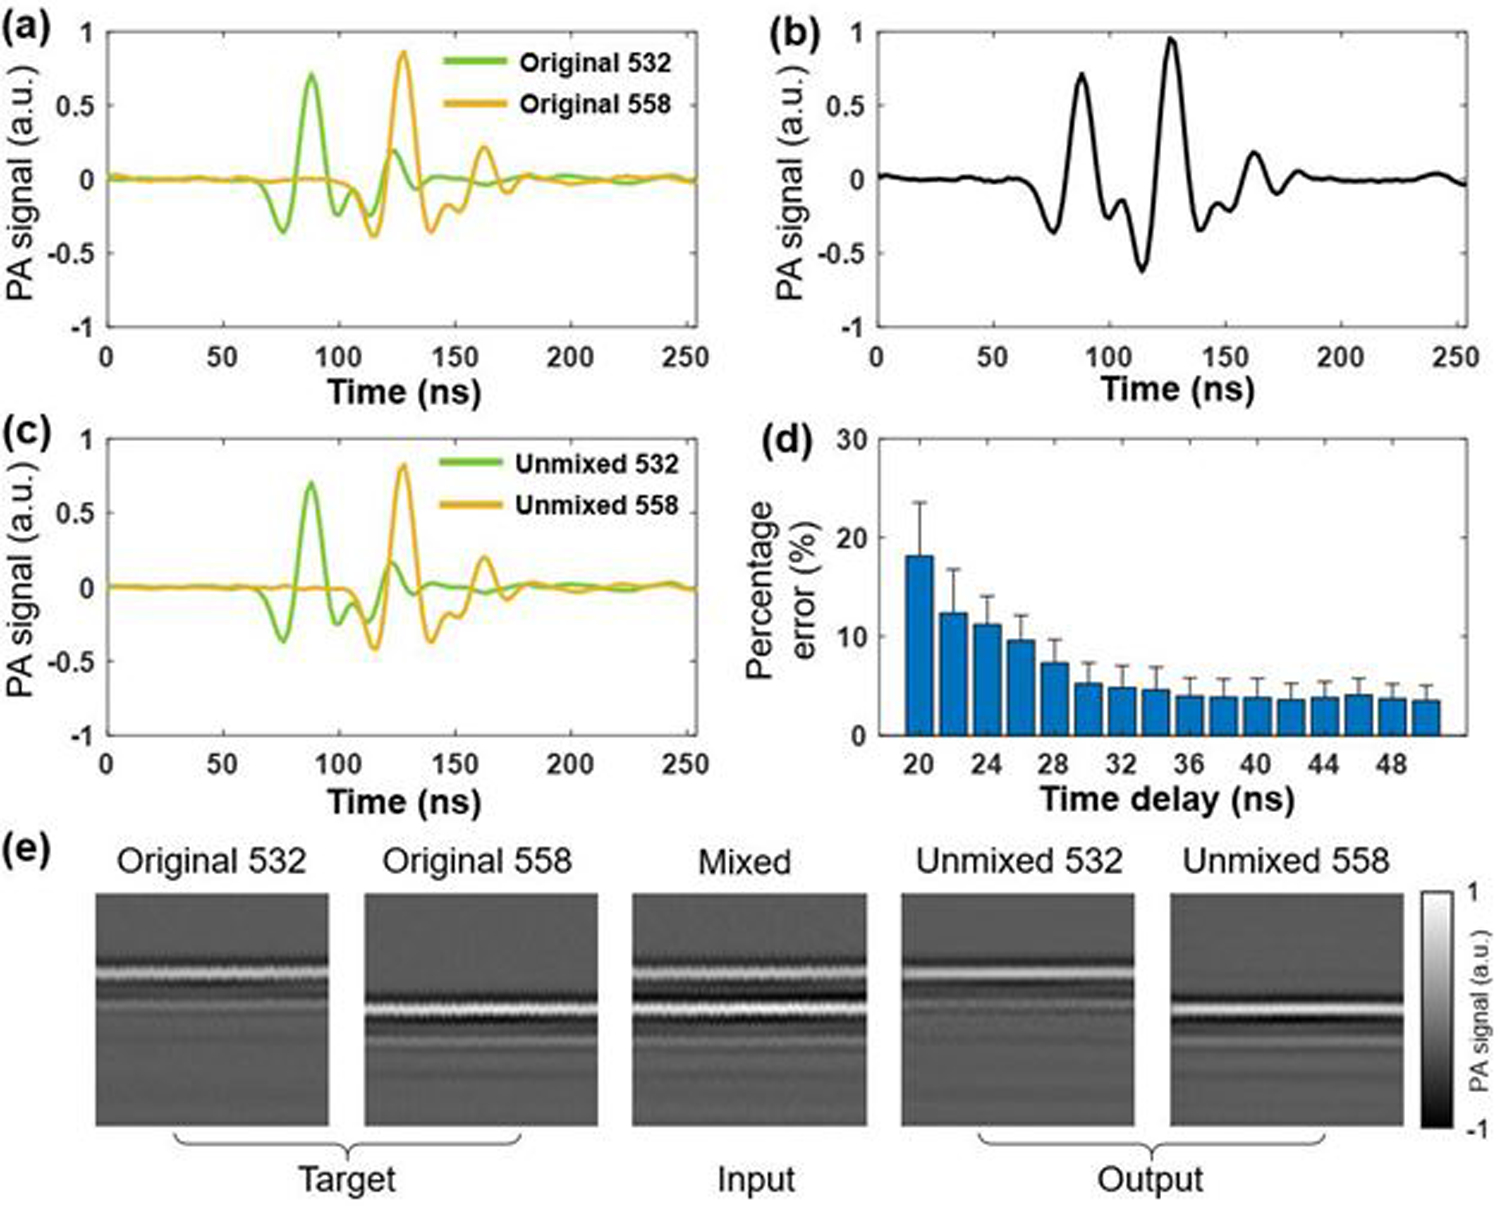
To determine the minimum delay that is separable practically, we performed a numerical simulation by digitally delaying the A-line signals. We used 10,000 non-overlapping A-line pairs acquired experimentally by conventional PAM at 532 nm and 558 nm for training and 100 pairs for testing. A graphics processing unit (GPU; GTX 1080 Ti) was used for this purpose. As illustrated in Fig. 3(a), the A-line acquired at 558 nm (the yellow waveform) was digitally shifted in the time domain to create a specific delay from the A-line acquired at 532 nm (the green waveform). Then, the two A-lines were summed up to generate a mixed A-line, as shown in Fig. 3(b). Although the two peaks are still distinguishable after the mixing, the peak of the 558-nm A-line is partially overlapped with the tail of the 532-nm A-line. As a result, the photoacoustic amplitude is changed due to the mixing, which makes the quantification of sO2 inaccurate. Indeed, the peak-to-peak amplitude value of the second signal in the mixed A-line (Fig. 3(b)) is ~27% larger than that in the 558-nm A-line (the yellow waveform in Fig. 3(a)). The cGAN uses the mixed signals as the input and the original signals as the target. The error between the output (i.e., the learning outcome) and the target is computed to update learnable parameters by the back-propagation method [14]. As shown in Fig. 3(c), after 10 epochs of training, the unmixed outputs of the cGAN model well agrees with the original A-lines (i.e., the ground truth), with an amplitude error of ~0.1%. Since the goal of the cGAN-based deep learning is to enable sO2 measurement with high accuracy, we used unmixed 532-nm and 558-nm signals to derive the sO2 values and compared them against the ground truth. As shown in Fig. 3(d), the cGAN was separately trained for different delays (20–50 ns), and the sO2 values derived by the cGAN-unmixed A-lines (100 pairs) were compared to those derived by the ground truth. Note that, as shown in Fig. 3(e), the B-scans consisting of 256 original, mixed, and cGAN-unmixed A-lines served as the target, input, and output of the cGAN, respectively. Our result suggests that the cGAN model can unmix the overlapping A-line signals with a small error (~5%) when the time delay is >30 ns. With this guidance, the 7.7-m PM-SMF was selected to introduce an ~38 ns time delay for our experimental demonstration. Shorter time delays are possible, providing more training data and a deeper network.
Fig. 3.

(a) 532-nm excited A-line (green) and digitally delayed 558-nm excited A-line (yellow). a.u., arbitrary units. (b) Digital sum of the two A-lines in (a). (c) Non-overlapping A-lines (green: 532 nm and yellow: 558 nm) generated by the cGAN. (d) Percentage error of sO2 values as a function of time delay. The error bars represent standard deviations. (e) Representative B-scans as the target, input, and output of the cGAN, consisting of 256 original, mixed, and unmixed A-lines, respectively.
In the experimental setting in vivo, the inputs to the cGAN model were photoacoustic signals successively acquired with the 532-nm and multi-spectral pulses, and the outputs were unmixed 532-nm and 558-nm signals. The pixel number of each A-line was set to 256, and each B-scan contained 9,984 A-lines. Then, each B-scan was divided into 256×256 subsets to be used as the input of the cGAN. Considering that the B-scan contained continuous vascular structures, the division was performed sequentially rather than randomly. Since the spatial interval between adjacent A-lines was ~0.2 μm, which was ~15 times finer than the optical diffraction limit, we selected a two-dimensional convolutional layer in the cGAN architecture [14] and set the kernel size of each layer to 4×4, which not only resulted in negligible loss of spatial resolution but also took adjacent A-lines into consideration to improve the accuracy. To demonstrate that our technique is generally and reliably applicable across different tissue sites and animals, two CD-1 mice (male, 8 weeks old, Charles River Laboratories) were used for this study. We first acquired the data in the ear of the first mouse in vivo to train the model, and then applied the trained model to the data acquired in the brain of the second mouse brain for testing. Both datasets were acquired over a 2×2 mm2 area. The step size along y direction is set to 5 μm. Under general anesthesia (2% isoflurane for induction and 1.5% for maintenance), a 3×3 mm2 open-skull window was created, followed by the application of ultrasound gel for acoustic coupling. The body temperature of the animal was maintained at 37°C by using a heating pad (DCT-15, Kent Scientific). All procedures were carried out in conformity with animal protocols approved by the Institutional Animal Care and Use Committee of Washington University in St. Louis.
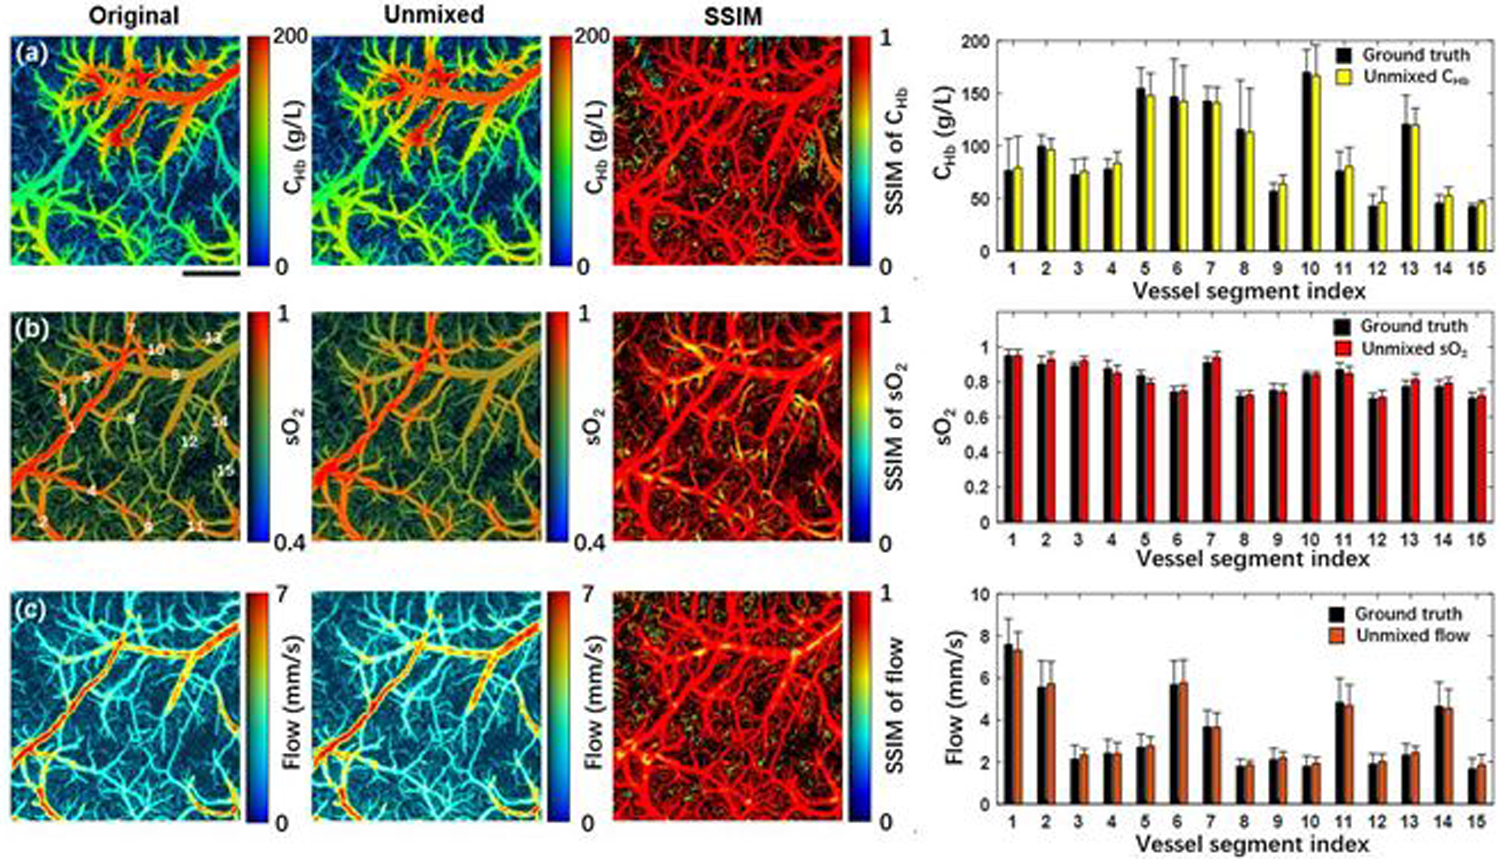
In Fig. 4, the first column on the left shows the CHb, sO2, and flow measurements acquired by the conventional PAM, which serve as the ground truth, and the second column shows the corresponding measurements acquired by the cGAN-based unmixing technique. Structural similarity index measure (SSIM) analyses of the two sets of multi-parametric measurements were performed to evaluate the accuracy of the cGAN-based unmixing technique. The SSIM value was calculated by using a built-in MATLAB function (ssim). To assess the micro-regional similarity between the two images, the SSIM value of individual image pixel was calculated within the surrounding micro-region containing 2 pixels by 50 pixels, which corresponds to 10 μm × 10 μm. In the pseudo-color SSIM maps, the RGB color and brightness of each pixel represent the SSIM value and the photoacoustic amplitude of the vessel signal, respectively. The close-to-one SSIM values throughout the field of view indicate that the multi-parametric measurements based on the temporal unmixing are nearly identical to the ground truth over the entire vascular network including the microvasculature. To further investigate the accuracy of the unmixing results, 15 vessels were manually segmented for quantitative analysis. The vessel segment indexes are labelled in Fig. 4(b). The average values and standard deviations of CHb, sO2, and flow within the 15 vessels are shown in on the right of Fig. 4. Paired t-tests using the average values of CHb, sO2, and blood flow yielded p-values of 0.42, 0.41, and 0.21, respectively—indicating that the unmixed results are not significantly different from the ground truth. It is worth noting that it only took the cGAN ~20 minutes to process the entire multi-parametric dataset, which can be further accelerated by optimizing the cGAN architecture and employing a faster GPU.
Fig. 4.

Validation of the cGAN model on a mouse brain in vivo. From left to right, (a) shows the original and the unmixed CHb, the SSIM of the two CHb, and the averaged CHb values in 15 vessel segments, where a paired t-test gives p = 0.42. (b) and (c) show values of sO2 (p = 0.41) and flow (p = 0.21), respectively. The vessel segment index is labelled in Fig. 4(b). Scale bar: 500 μm.
In conclusion, we have adopted a cGAN model to temporally and spectrally unmix photoacoustic signals for multi-parametric PAM measurements. This technique breaks the physical limit on the A-line rate, which is imposed by the acoustic speed in tissues. Also, it enables the use of multi-spectral laser pulses for PAM excitation, thereby harnessing all wavelength components generated in the SRS process to address the SNR issue associated with insufficient energy of monochromatic pulses. The cGAN model has moderate requirement on training (e.g., a single dataset with a field of view of 2×2 mm2) and is generally and reliably applicable across different tissue sites and animals (e.g., the model trained with ear data in one animal can be directly applied to the brain data in a different animal). Our follow-up studies will be focused on further shorten the time delay between individual pulses, as well as the application of this technique to increase the A-line rate to multiple MHz for ultra-high-speed multi-parametric PAM.
Acknowledgments.
The authors thank Prof. James Ballard for his close reading of the manuscript.
Funding.
National Institutes of Health (NS099261) and National Science Foundation (2023988).
Footnotes
Disclosures. The authors declare no conflicts of interest.
References
- 1.Ning B, Sun N, Cao R, Chen R, Kirk Shung K, Hossack JA, Lee J-M, Zhou Q, and Hu S, Scientific Reports 5, 18775 (2015). [DOI] [PMC free article] [PubMed] [Google Scholar]
- 2.Cao R, Li J, Kharel Y, Zhang C, Morris E, Santos WL, Lynch KR, Zuo Z, and Hu S, Theranostics 8, 6111 (2018). [DOI] [PMC free article] [PubMed] [Google Scholar]
- 3.Louveau A, Herz J, Alme MN, Salvador AF, Dong MQ, Viar KE, Herod SG, Knopp J, Setliff JC, and Lupi AL, Nature neuroscience 21, 1380 (2018). [DOI] [PMC free article] [PubMed] [Google Scholar]
- 4.Da Mesquita S, Louveau A, Vaccari A, Smirnov I, Cornelison RC, Kingsmore KM, Contarino C, Onengut-Gumuscu S, Farber E, and Raper D, Nature 560, 185 (2018). [DOI] [PMC free article] [PubMed] [Google Scholar]
- 5.Zhong F, Zhong F, Bao Y, Bao Y, Chen R, Zhou Q, Zhou Q, Hu S, and Hu S, Opt. Lett., OL 45, 2756 (2020). [DOI] [PMC free article] [PubMed] [Google Scholar]
- 6.Ning B, Kennedy MJ, Dixon AJ, Sun N, Cao R, Soetikno BT, Chen R, Zhou Q, Shung KK, Hossack JA, and Hu S, Opt. Lett., OL 40, 910 (2015). [DOI] [PubMed] [Google Scholar]
- 7.Wang T, Sun N, Cao R, Ning B, Chen R, Zhou Q, and Hu S, Neurophotonics 3, 045006 (2016). [DOI] [PMC free article] [PubMed] [Google Scholar]
- 8.Hajireza P, Forbrich A, and Zemp R, Biomedical optics express 5, 539 (2014). [DOI] [PMC free article] [PubMed] [Google Scholar]
- 9.Liang Y, Jin L, Guan B-O, and Wang L, Optics letters 42, 1452 (2017). [DOI] [PubMed] [Google Scholar]
- 10.Zhou Y, Liang S, Li M, Liu C, Lai P, and Wang L, Journal of biophotonics 13, e201960229 (2020). [DOI] [PubMed] [Google Scholar]
- 11.Krizhevsky A, Sutskever I, and Hinton GE, Advances in neural information processing systems 25, 1097 (2012). [Google Scholar]
- 12.Lee H, Pham P, Largman Y, and Ng A, Advances in neural information processing systems 22, 1096 (2009). [Google Scholar]
- 13.Young T, Hazarika D, Poria S, and Cambria E, ieee Computational intelligenCe magazine 13, 55 (2018). [Google Scholar]
- 14.Isola P, Zhu J-Y, Zhou T, and Efros AA, in Proceedings of the IEEE Conference on Computer Vision and Pattern Recognition (2017), pp. 1125–1134. [Google Scholar]
- 15.Yi X, Walia E, and Babyn P, Medical image analysis 58, 101552 (2019). [DOI] [PubMed] [Google Scholar]
- 16.Wu Y, Rivenson Y, Wang H, Luo Y, Ben-David E, Bentolila LA, Pritz C, and Ozcan A, Nature methods 16, 1323 (2019). [DOI] [PubMed] [Google Scholar]
- 17.Wang H, Rivenson Y, Jin Y, Wei Z, Gao R, Günaydın H, Bentolila LA, Kural C, and Ozcan A, Nature methods 16, 103 (2019). [DOI] [PMC free article] [PubMed] [Google Scholar]


