

Abstract
High temporal resolution images acquired using 1000fps HSAngio can be used to visualize blood flow patterns and derive flow velocities during neurointerventional procedures. In this work we use this technology to quantify the changes in the blood flow velocities inside a cerebral aneurysm after treatment with three different stents with varying degrees of metal coverage density; stent A : <2%, stent B: 23% and stent C: 40%.
A 3D printed in-vitro model of internal carotid artery aneurysm was connected to a flow loop (60% water, 40% glycerol solution used as circulation fluid, circulation flow rate 8 L/s). An automatic programmable injector (KD Scientific Legato 110) was used to inject iodine contrast agent at a rate of 88 mL/min in 3secs. 1000 fps HSAngio sequences of the contrast injection were acquired using an Aries single photon counting detector (Direct Conversion Inc., Stockholm). From these images blood flow velocities were calculated using an optical flow algorithm.
As expected the biggest reduction in blood flow velocity inside the aneurysm was 32.4% after deployment of stent C. However, the velocity profile distribution indicated there was still a significant inflow jet into the aneurysm which could be caused by a endoluminal leak between the stent and the vessel wall. The average reduction was only 14% after placement of stent B and 3% after placement of stent A.
Blood velocity distribution maps derived using 1000fps HSAngiography technology can be used to evaluate the quality of flow diversion within the aneurysm after placement of stent. Critical information such as endo luminal leakage which can cause treatment failure can also be detected.
INTRODUCTION
Flow diversion is an increasingly popular endovascular surgical procedure for treating cerebrovascular aneurysms. During these procedures typically catheters are inserted into the femoral artery near the patient groin and guided to the diseased vascular area under x-ray imaging. Then a flow-diverter stent such as a pipeline embolization device (PED) is deployed covering the neck of the aneurysm [1,2]. Figure 1 shows the different stages of PED deployment acquired using the high resolution HiDef mode of the infinix c-arm from Canon Medical systems, USA [3].
Figure 1:
Different stages of pipeline embolization device deployment visualized using the Hi-Def mode of the biplane imaging suite from Canon medical systems corporation.
During these procedures Digital Subtraction Angiography (DSA) at typical frame rates of 3 – 15 fps using iodine contrast agent are performed to evaluate the flow of blood in the aneurysm region and the parent vessel during different stages of the treatment procedure. Figure 2 shows the images from DSA performed during different stages of the PED deployment shown in figure 1.
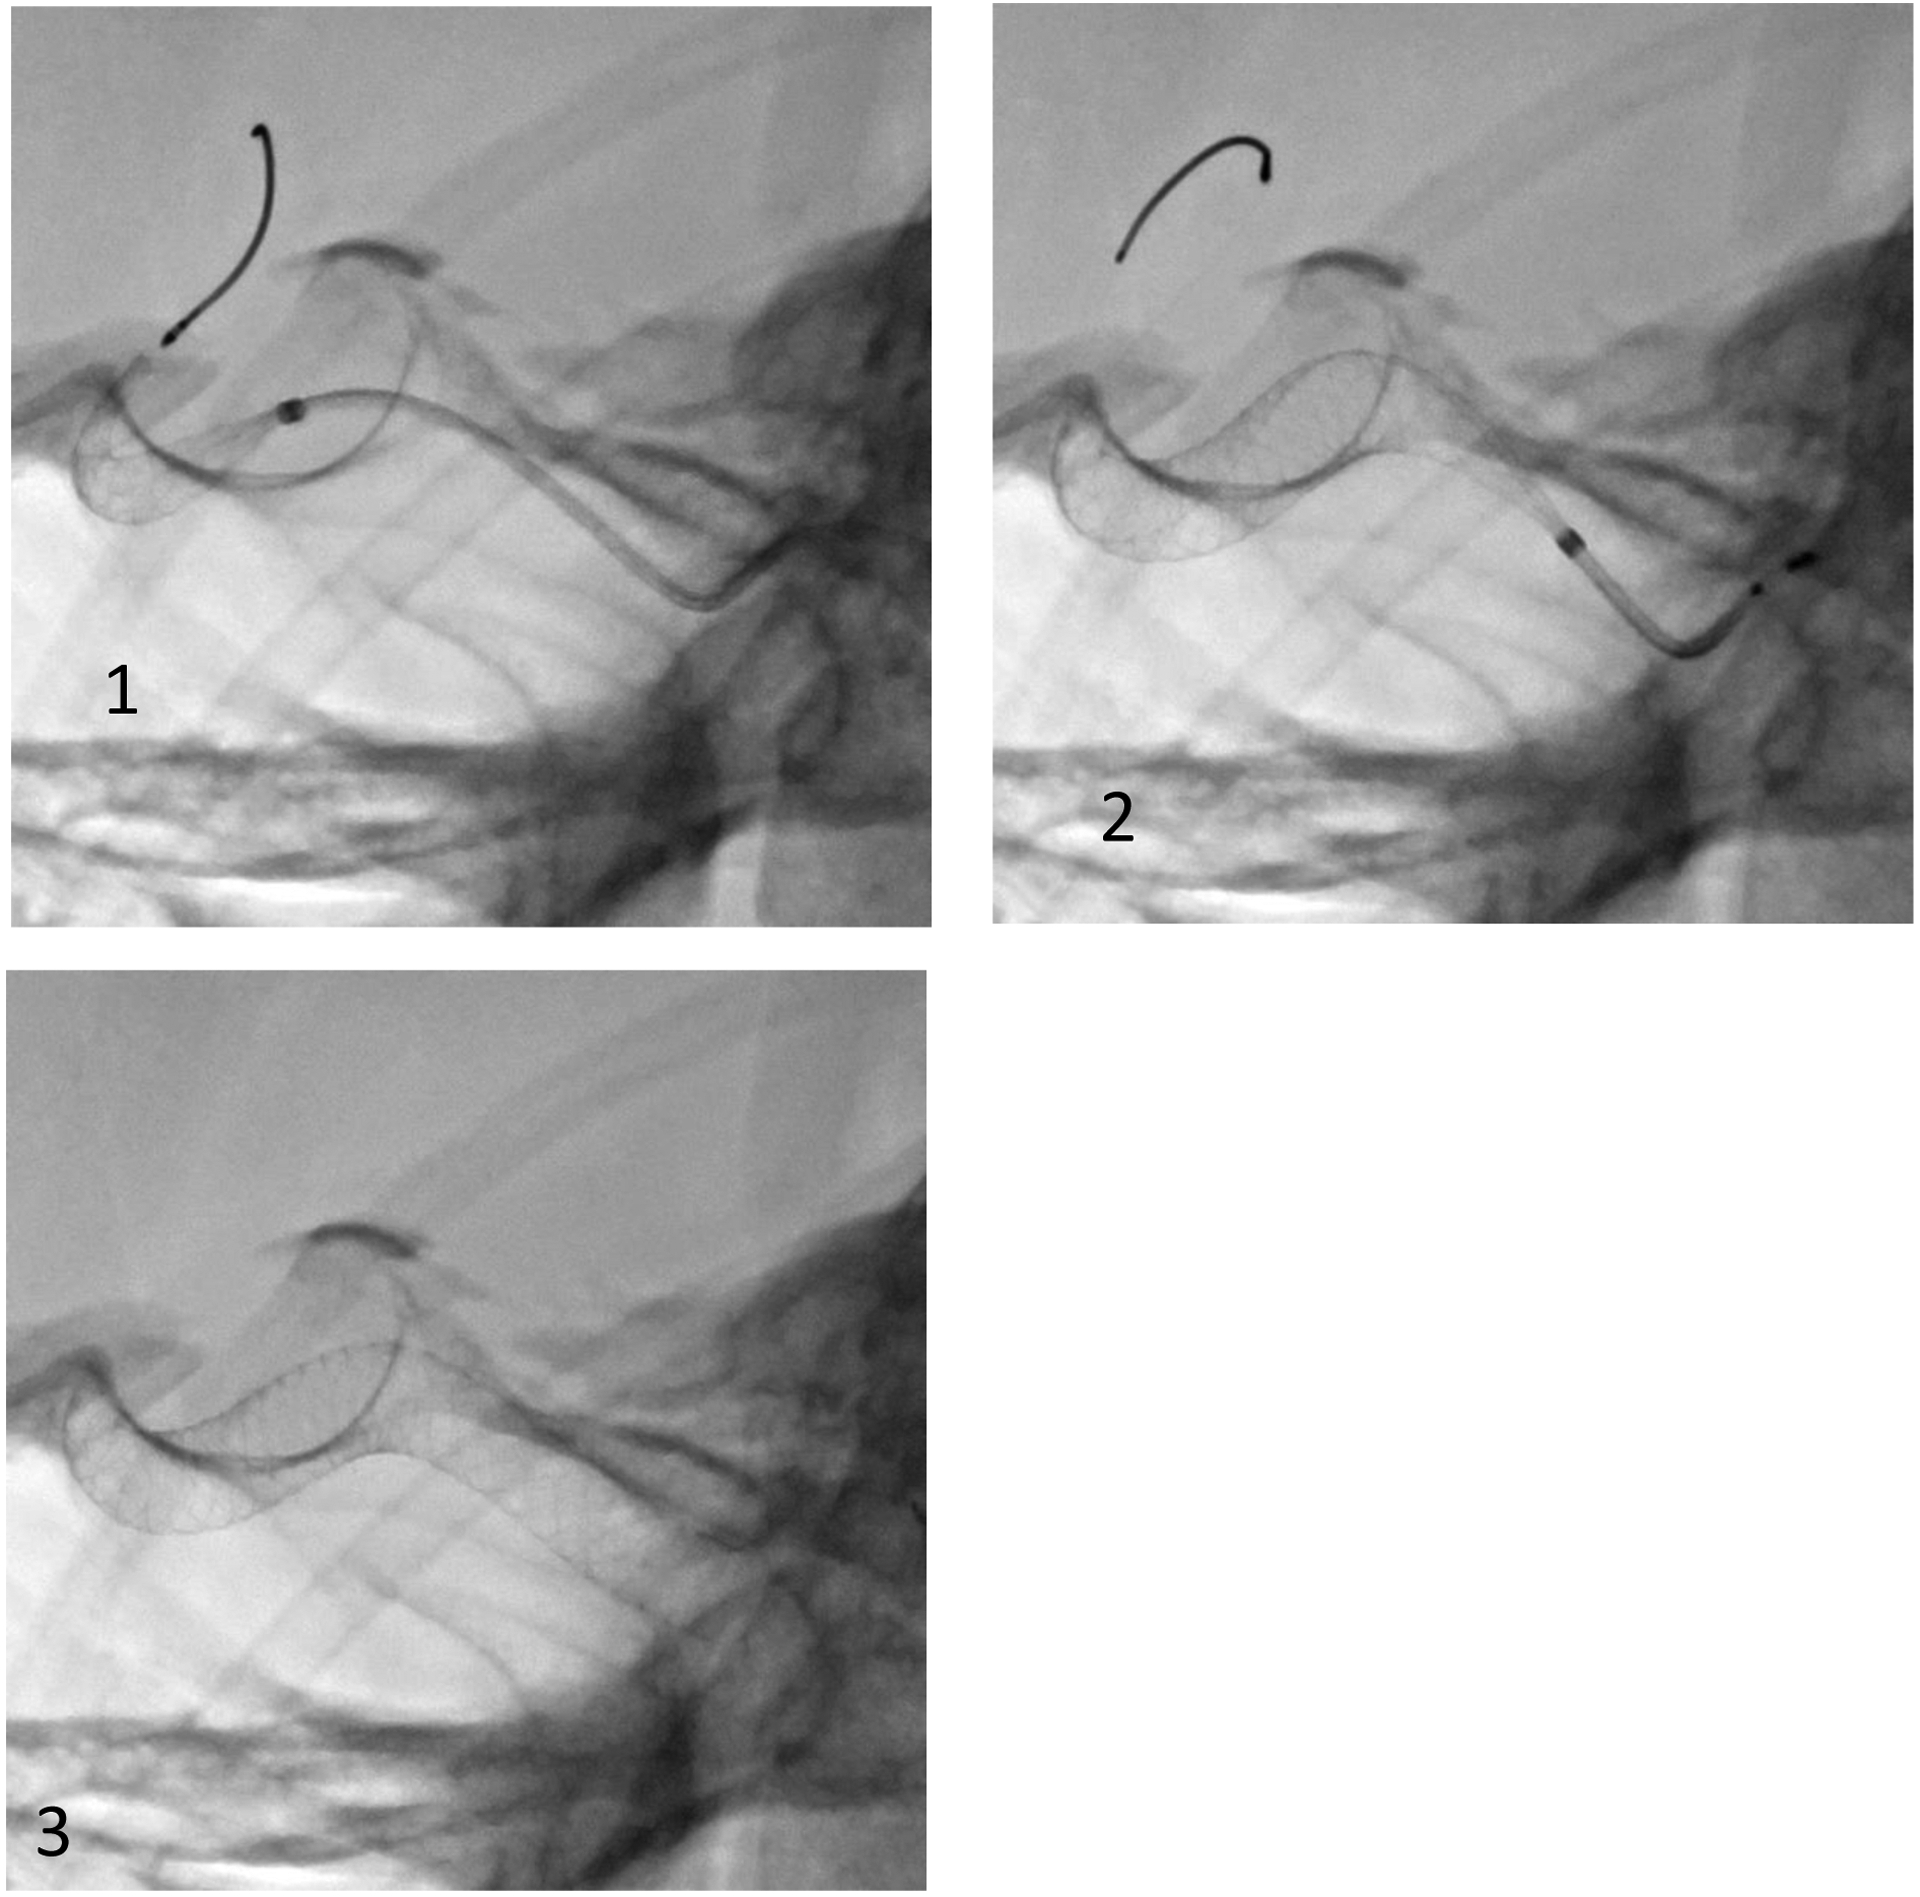
Figure 2:

3fps DSA performed at different stages of the procedure.
1: DSA performed prior to deployment of PED device. The white arrow indicates the aneurysm in the internal carotid artery.
2: DSA performed after deployment of PED device, in the parent vessel covering the neck of the aneurysm. The image is from an earlier time step of the sequence.
3: DSA performed after deployment of PED device, in the parent vessel covering the neck of the aneurysm. Image is from a later time step of the sequence, following the image shown in figure 2:2.
Images acquired at such low frame rates do not have the necessary temporal resolution to accurately capture the patterns present in blood flow, such as streamlines and vortices. This can be evidenced in figure 2, comparing the DSA images prior to (Figure 2A) and after deployment of the stent (Figure 2B) it can be erroneously concluded that the treatment failed or succeeded. High-speed 1000-fps x-ray angiography images can be used to accurately visualize such blood-flow patterns [4]. Using these images critical flow information such as flow velocity patterns [5] and wall sheer stress (WSS) can be calculated. Such information can be used by clinicians to evaluate the success and failure of the treatment.
In this work we investigate the use of 1000fps high speed angiography (HSAngio) technology to quantify the changes in the blood flow velocities inside a cerebral aneurysm after treatment with three different stents with varying degrees of metal coverage density; stent A : <2%, stent B: 23% and stent C: 40%.
METHODS AND MATERIALS
Testbench setup: A 3D printed model of the internal carotid artery with an aneurysm was connected to a flow loop. A solution of 40% glycerol and 60% water was used as the circulation fluid. CardioFlow 5000 MR, Shelley Medical Imaging Technologies, Canada was used as the circulation pump [6]. The pump can be programmed to operate under different flow conditions. For this study we set the pump to
Continuous Flow: Flow rate was set at 8 L/s.
Pulsatile Flow simulating human blood flow conditions with repeatable systolic and diastolic phases of the cardiac cycle. The maximum circulation flow rate for this mode was kept at 25 L/s. Figure 3 shows a waveform showing the flow rates at different phases of blood flow in one cardiac cycle. The pump also outputs a waveform at a preprogrammed time point of the cardiac cycle for synchronization purposes. For this study the pump was programmed to output a synchronization pulse at the beginning of the systolic cycle
Figure 3:

Waveform used by the circulation pump to output the circulation fluid at different velocities at different time points within a cardiac cycle. The arrow indicates the reference point for the pump to output a TTL logic level electrical signal for synchronization.
Contrast injection: Two computer controlled automatic injectors (Legato-110 from KD Scientific, figure 4) were connected to the proximal end of the intermediate catheter, to inject iodine contrast agent[7]. The injection rate on each was set at 88 ml/min. Both the injectors were setup to inject simultaneously upon triggering.
Figure 4:

Computer controlled injector for injecting iodine contrast into the circulation system.
HSAngio Image Acquisition: Aries (Direct Conversion, Stockholm), a single photon counting direct conversion detector capable of acquiring x-ray images at 1000fps was used to capture the flow details. A Canon (formerly Toshiba) Mobile C-Arm was used as the x-ray source generator. The exposure was kept at 70kV, 200mA for a duration of 2 seconds.
Synchronization for pulsatile flow conditions: The objective of this step is to ensure the start of the imaging for every acquisition corresponds to the start of a systolic cycle. During every acquisition cycle first the initialization and pre-acquisition setup process of the Aries detector is completed. Then the contrast injector is initialized to inject contrast at the set rate followed by the x-ray exposure. Following this the detector acquisitions starts when the next synchronization pulse from the circulation pump arrives. Figure 5 shows the functional flow diagram for synchronization of different components.
Figure 5:

Single 1000fps HSA Acquisition cycle for pulsatile flow conditions
Device deployment procedure: First a generic 7F guide catheter was placed at the proximal region of the aneurysm model. Then an intermediate catheter was inserted into the guide catheter and placed proximal to the aneurysm area. A generic micro catheter was inserted into the intermediate catheter and guided past the aneurysm. The stent was then inserted into the microcatheter and partially deployed at the site of the aneurysm covering the neck region.
Study Design:
Continuous circulation flow:Three stents with varying metal coverage density, Stent A <2%, Stent B ~ 23% and Stent C ~40%, were deployed separately to divert the flow away from the aneurysm.
Pulsatile circulation flow: Stent C with a metal coverage density of more than 40% was deployed in two different configurations separately to divert the flow away from the aneurysm.
1000fps HSAngio sequences of contrast injection prior to the placement of the stents and after the placement of the stents were acquired. Using these images velocity profiles were calculated using the Optical Flow Algorithm.
RESULTS
Continuous Flow Circulation:
Figure 6 shows example images from the HSAngio acquired prior to and after deployment of stent A. The velocity and stream line profiles within the aneurysm prior to and after deployment of the stent A is shown in figure 7. After placement of stent A the average velocity within the aneurysm was reduced by 3%.
Figure 6:

HSAngio (subtracted) images acquired at 1000fps
a,b: Prior to placement of stent A. Image B is acquired 500ms after Image A
c,d: After placement of stent A. Image D is acquired 500ms after Image C
Stent A has the least metal cover density. Comparing pre and post images it can be seen that the stent does not divert the flow away from the aneurysm
Figure 7:

Flow streamlines (left) and velocity (right) profiles within the aneurysm before and after placement of stent A, derived using HSAngio images
Figure 8 shows example images from the HSAngio acquired prior to and after deployment of stent B. The velocity and streamline profiles within the aneurysm prior to and after deployment of the stent B is shown in figure 9. After placement of stent B the average velocity within the aneurysm was reduced by 14%.
Figure 8:

HSAngio (subtracted) images acquired at 1000fps
a,b: Prior to placement of stent B. Image B is acquired 500ms after Image A
c,d: After placement of stent B. Image D is acquired 500ms after Image C
Stent B has the more metal cover density than stent A. Comparing pre and post images it can be seen that the stent does minimally divert the flow away from the aneurysm. This can be evidenced by lack of flow vortices within the aneurysm in figure D compared to figure C
Figure 9:

Flow streamlines (left) and velocity (right) profiles within the aneurysm before and after placement of stent B, derived using HSAngio images
Figure 10 shows example images from the HSAngio acquired prior to and after deployment of stent C. The velocity and stream line profiles within the aneurysm prior to and after deployment of the stent C is shown in figure 11. As expected the biggest reduction in blood flow velocity inside the aneurysm was 32.4% after deployment of stent C.
Figure 10:

HSAngio (subtracted) images acquired at 1000fps
a,b: Prior to placement of stent C. Image B is acquired 500ms after Image A
c,d: After placement of stent C. Image D is acquired 500ms after Image C
Stent C has the highest metal cover density compared to stent A and B. Comparing pre and post images it can be seen that the stent does divert the flow away from the aneurysm. This can be evidenced by the lack of contrast filling within the aneurysm in figure D compared to figure C. However the presence of inflow jet even after the deployment of the stent indicates that there is a endo luminal leak which if uncorrected can prevent the aneurysm from thrombosing.
Figure 11:
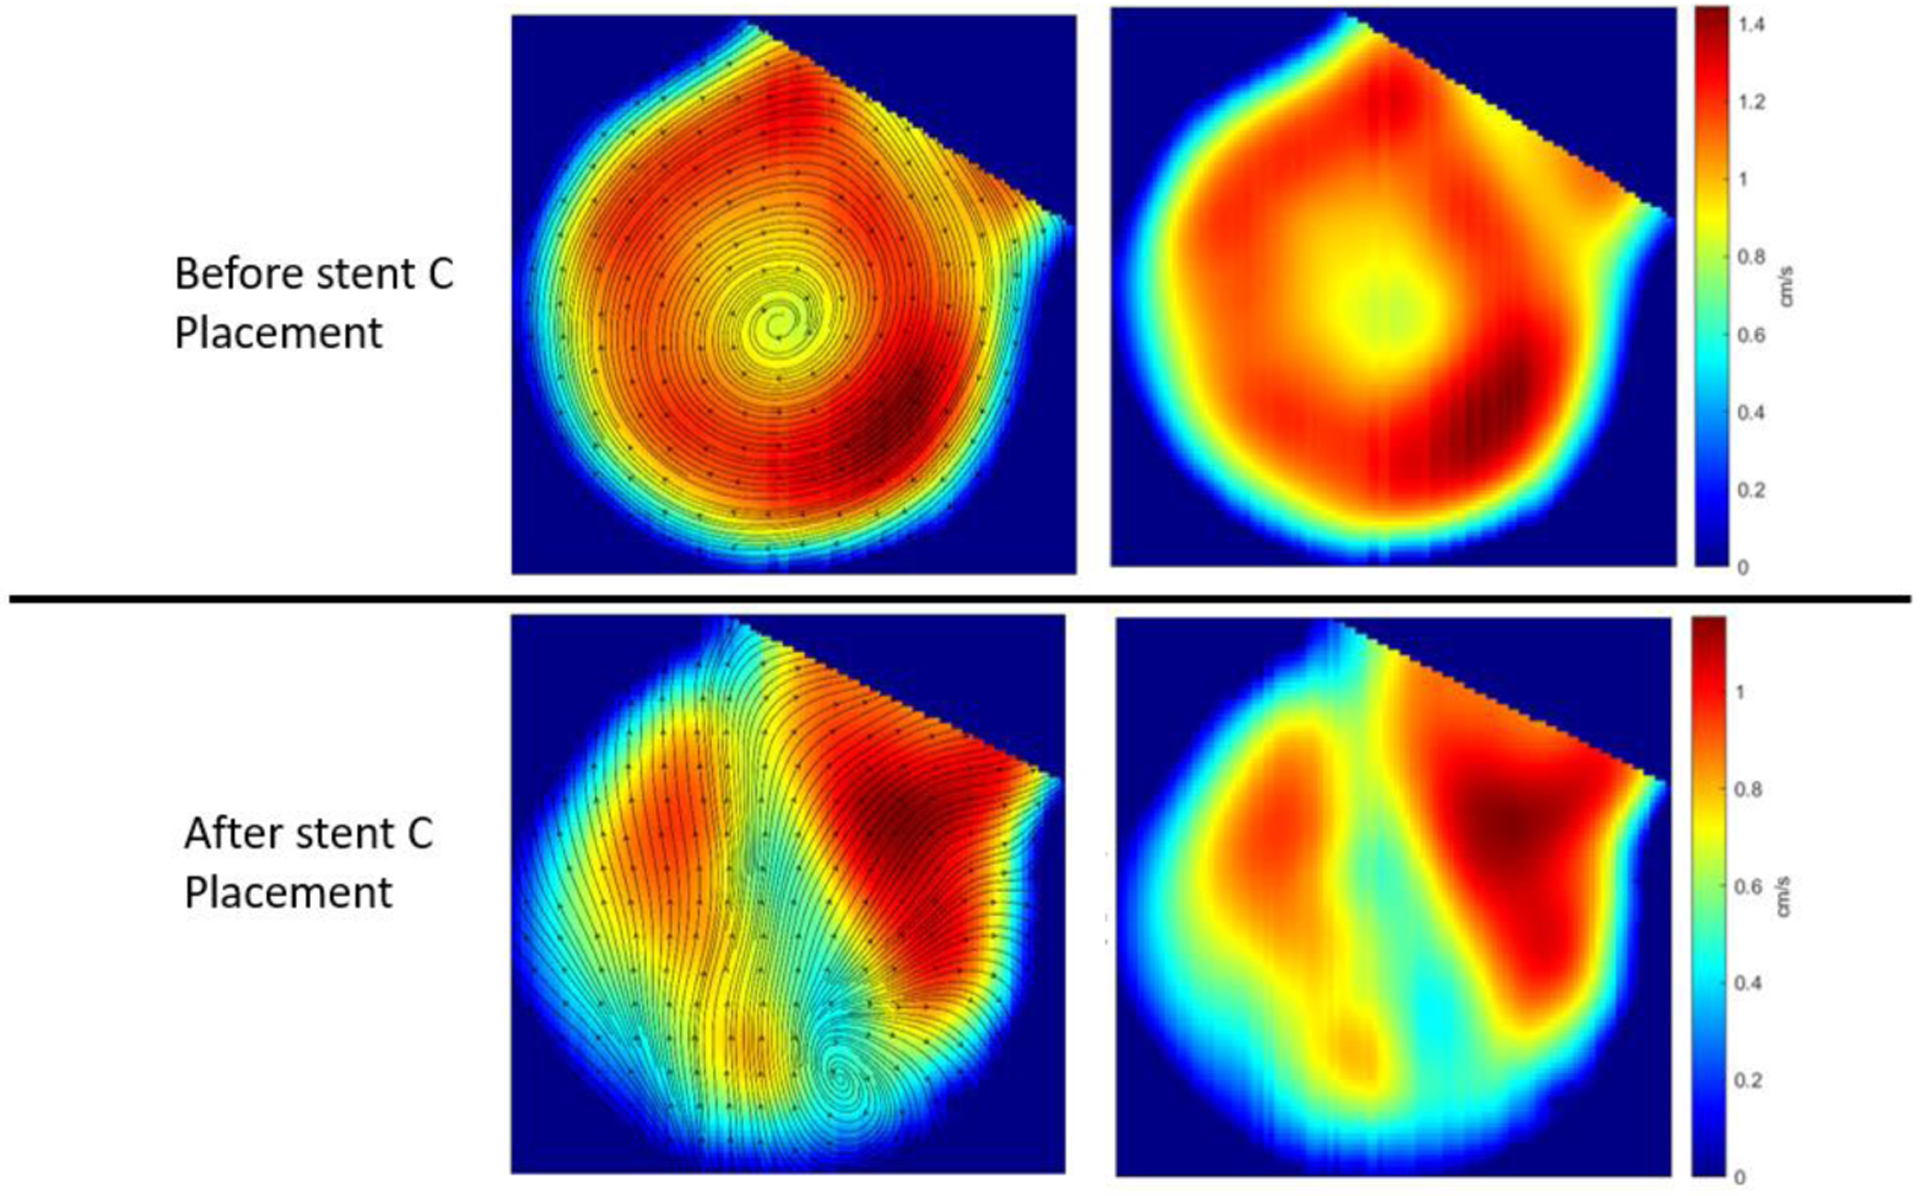
Flow streamlines (left) and velocity (right) profiles within the aneurysm before and after placement of stent C, derived using HSAngio images
Comparing pre and post images it can be seen that the stent C does divert the flow away from the aneurysm. This can be evidenced by the lack of contrast filling within the aneurysm in figure 10 c, d as well as changes in velocity distribution as shown by figure 11. However the presence of inflow jet even after the deployment of the stent C indicates that there is a endoluminal leak which if uncorrected can prevent the aneurysm from thrombosing.
Pulsatile Flow Circulation:
To demonstrate the use of 1000 fps during deployment of flow diverter stents, Stent C was deployed across the aneurysm separately in two different configurations, each under simulated human blood flow conditions with repeatable systolic and diastolic phases of the cardiac cycle as shown in figure 3.
Configuration 1: Fully apposed to the vessel wall near the aneurysm neck region: Figure 12 shows example images from the HSAngio acquired prior to (figure 12 a,b) and after deployment (figure 12c,d) of stent C. The stent profile after deployment in shown in figure 12 e. Comparing pre and post images it can be seen that the stent does divert the flow away from the aneurysm.
Configuration 2: Partially apposed to the vessel wall near the aneurysm neck region: Figure 13 shows example images from the HSAngio acquired prior to (figure 13 a,b) and after deployment (figure 13 c,d) of stent C. The stent profile after deployment in shown in figure 13 e.
Figure 12:

a,b: HSAngio images(Subtracted) acquired at 1000fps prior to deployment of stent C
c,d: HSAngio images (Subtracted) acquired at 1000fps after deployment of stent C
e: Unsubtracted Image of the stent after deployment across the aneurysm. The arrow indicates the part of the stent covering the neck of the aneurysm
Comparing pre and post images it can be seen that the stent does divert the flow away from the aneurysm.
Figure 13:

a,b: HSAngio images (Subtracted) acquired at 1000fps prior to deployment of stent C
c,d: HSAngio images acquired at 1000fps after deployment of stent C
e: Unsubtracted Image of the stent after deployment across the aneurysm. The arrow indicates the part of the stent covering the neck of the aneurysm. On close observation, compared to Figure 12E it can be seen that the stent is not fully open at the neck of the aneurysm. This causes endo luminal leak of contrast (blood) into the aneurysm region. This can delay or even prevent thrombosis.
On close observation, comparing Figure 13e to Figure 12e it can be seen that the stent is not fully open at the neck of the aneurysm. This causes endoluminal leak of contrast (blood) into the aneurysm region. This can delay or even prevent thrombosis. This is reflected in the velocity maps shown in Figure 14.
Figure 14:

Velocity profiles calculated from the 1000fps HSA images.
a: Prior to placement of stent C.
b: After deployment of stent C as shown in figure 12E. Due to lack of contrast within the aneurysm region, velocities using optical flow algorithm cannot be calculated.
c: After deployment of stent C as shown in figure 13E. The velocity maps are focused to the region shown in figure 14A.
From the maps it can be seen that when the stent fully covers the neck of the aneurysm there is minimal flow into the aneurysm. This can be further evidenced by lack of contrast flow as shown in figure 12c,d. However when there is mal apposition it could result in endo luminal leak which can reduce the flow diversion effect.
CONCLUSION
Use of 1000fps HSAngio technology allows the interventionalist to visualize detailed blood flow patterns in real-time while performing the procedures. From these images, blood-velocity-distribution maps can derived. The velocity maps can be used to evaluate changes in blood flow within the aneurysm before and after placement of a treatment device such as a stent. Critical information such as an endo luminal leak which can cause treatment failure can also be detected.
ACKNOWLEDGEMENTS
NIH GRANT # R01EB030092, Stratasys, LTD. Canon Medical Systems Corporation, USA
REFERENCES
- [1].Möhlenbruch MA, Herweh C, Jestaedt L, Stampfl S, Schönenberger S, Ringleb PA, Bendszus M, Pham M. The FRED flow-diverter stent for intracranial aneurysms: clinical study to assess safety and efficacy. AJNR Am J Neuroradiol. 2015. Jun;36(6):1155–61. doi: 10.3174/ajnr.A4251. Epub 2015 Feb 26. [DOI] [PMC free article] [PubMed] [Google Scholar]
- [2].Dumont TM, Mokin M, Snyder KV, Siddiqui AH, Levy EI, Hopkins LN 3rd. A paradigm-shifting technology for the treatment of cerebral aneurysms: the pipeline embolization device. World Neurosurg. 2013. Dec;80(6):800–3. doi: 10.1016/j.wneu.2013.01.051. Epub 2013 Jan 17.. [DOI] [PubMed] [Google Scholar]
- [3].Setlur Nagesh SV, Vakharia K, Waqas M, Munich SA, Bednarek DR, Davies JM, Snyder KV, Mokin M, Rudin S, Levy EI, and Siddiqui AH, “Single-center experience of using high definition (Hi-Def) imaging during neurointervention treatment of intracranial aneurysms using flow diverters,” Journal of NeuroInterventional Surgery, vol. 12, no. 9, pp. 897–901, 2020, doi: 10.1136/neurintsurg-2019-015551. [DOI] [PubMed] [Google Scholar]
- [4].Krebs JM, Shankar A, Setlur Nagesh SV, Davies JM, Snyder KV, Levy EI, Hopkins LN, Mokin M, Bednarek DR, Siddiqui AH, Rudin S. Flow-Pattern Details in an Aneurysm Model Using High-Speed 1000-Frames-per-Second Angiography. AJNR Am J Neuroradiol. 2019. Jul;40(7):1197–1200. doi: 10.3174/ajnr.A6090. Epub 2019 Jun 6.. [DOI] [PMC free article] [PubMed] [Google Scholar]
- [5].Shields A, Nagesh SVS, Ionita C, Bednarek DR, Rudin S. Evaluation of methods to derive blood flow velocity from 1000 fps high-speed angiographic sequences (HSA) using optical flow (OF) and computational fluid dynamics (CFD). Proc SPIE Int Soc Opt Eng. 2021. Feb;11595:115950T. doi: 10.1117/12.2580881. Epub 2021 Feb 15.. [DOI] [PMC free article] [PubMed] [Google Scholar]
- [6].http://www.simutec.com/Products/ppfp.html, Last accessed: Jan 12 2021.
- [7].https://www.kdscientific.com/legato-110-syringe-pump.html, Last accessed: Jan 12 2021.