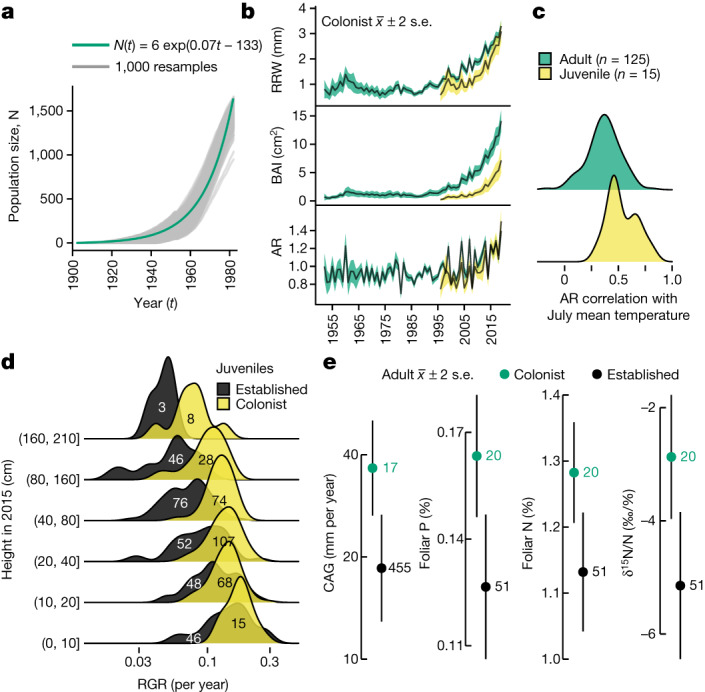
Fig. 3. Colonists grow faster than individuals at treelines.

a, Population exponential growth from 1900 to 1980. Monte Carlo simulations (n = 1,000) of colonists in the central rectangle in Extended Data Fig. 1a are shown as grey lines. The green exponential curve corresponds to the mean of 1,000 runs. Details in Supplementary Information section 4. b, Colonist tree-ring (Extended Data Fig. 4) chronologies for adults (≥30 years, green, n = 125) and juveniles (<30 years, yellow, n = 15) determined with RRW, BAI and AR shown as mean ± 2 standard error (s.e.). Chronologies support five or more series. Details in Supplementary Information sections 7.1–7.7. c, Distributions (Gaussian kernel) of Pearson’s correlation between AR and 1989–2019 July Kotzebue temperature for adult (green, n = 125) and juvenile (yellow, n = 15) colonists. Statistics in Supplementary Information sections 7.8–7.11. d, Juvenile RGR of colonists (yellow) and individuals at established treelines (black) by size class. Colonist sample sizes are in black text (n = 300) while those for individuals at established treelines are in white text (n = 271). Wald test t = 4.46 for population–height interaction in 2015 using linear mixed-effects models; m = 24 sites as random effect. Statistics in Supplementary Information section 6. e, Adult CAG and foliar P and N concentrations for colonists (green) and individuals at established treelines (black). Colonist sample size is in green while that for individuals at established treelines is in black. Circles with error bars give the mean ± 2 s.e. Wald tests for fixed effect: CAG, t = 3.69 (n = 17 colonists and 455 individuals at established treelines); P, t = 3.62; N, t = 3.34; δ15N/N, t = 3.50 (n = 20 colonists and 51 individuals at established treelines). m = 18 levels for watershed as random factor. Statistics in Supplementary Information section 5. Because of the unbalanced design in all linear mixed models, P values were not calculated.
