

Abstract
Background
Metabolic reprogramming is one of the essential features of tumorigenesis. Herein, this study aimed to develop a novel metabolism‐related gene signature for head and neck squamous cell carcinoma (HNSCC) patients.
Methods
The transcriptomic and clinical data of HNSCC samples were collected from The Cancer Genome Atlas (TCGA) and GSE65858 datasets. The metabolism‐related gene‐based prognostic signature (MRGPS) was constructed by the Least Absolute Shrinkage and Selection Operator (LASSO) regression model. The time‐dependent receiver operating characteristic (ROC) and Kaplan‐Meier (K‐M) survival curves were plotted for evaluating its predicting performance. At the same time, univariate along with multivariate analysis was carried out to explore its correlation with clinicopathologic factors. Furthermore, GSEA analysis was performed to explore the signaling pathways affected by MRGPS. We also analyzed the associations of MRGPS with the tumor immune microenvironment (TIME), as well as identified potential compounds via Connectivity Map (CMap) and molecular docking.
Results
A total of 12 differentially expressed metabolism‐related genes were identified and selected to construct the MRGPS. Notably, this signature performed well in predicting HNSCC patients’ survival and could serve as an independent prognostic factor in multiple datasets. In addition to the metabolism‐related pathway, this signature could also affect some immune‐related pathways. The results indicated that MRGPS is correlated with immune cells infiltration and anti‐cancer immune response. Furthermore, we identified cephaeline as a potential therapeutic compound for HNSCC.
Conclusion
Taken together, we established an MRGs‐based signature that has the potential to predict the clinical outcome and immune microenvironment, which help to search for potential combination immunotherapy compounds and provide a promising therapeutic strategy for treating HNSCC patients.
Keywords: head and neck squamous cell carcinoma, metabolic reprogramming, metabolism‐related genes, prognostic signature, tumor immune microenvironment
In this research, by comprehensively analyzing transcriptomic and clinical data of HNSC samples, a metabolism‐related gene‐based prognostic signature (MRGPS) was established and sufficiently validated in multiple datasets. Also, this study explored the association of MRGPS with multiple clinicopathologic factors and constructed a prognostic nomogram. Interestingly, our GSEA analysis found that MRGPS was closely related to the immune‐related pathways. Furthermore, we explored the relationships between MRGPS and tumor immune microenvironment (TIME), as well as immunotherapy response.

1. INTRODUCTION
Head and neck squamous cell carcinoma (HNSCC) represents a frequently occurring malignant tumor globally. Due to its complex and diverse anatomical parts, involving appearance and various essential physiological functions, it seriously affects patients’ life quality. According to the WHO statistics, there are 830,000 new cases along with 430,000 deaths across the world in 2018. 1 Furthermore, more than 70% of HNSCC patients have already been at the moderate and advanced stages when they are diagnosed, with a low 5‐year survival rate of <40%. 2 Thus, it is urgently needed to develop a novel predicting approach in order to enhance the prognostic outcome of HNSCC patients.
Metabolic reprogramming is extensively regarded as a hallmark of cancer, which contributes to tumorigenesis in HNSCC. 3 Numerous studies have demonstrated that it is possible to use metabolic phenotypes for imaging tumors, providing prognosis data, and treating tumors. 4 Targeting specific metabolic pathways can be an effective cancer treatment strategy. For example, both 5‐fluorouracil (5‐FU, pyrimidine analog) and cytarabine (antimetabolite nucleoside analog) exhibit favorable antitumor effects. 5 , 6 Noteworthily, it has been previously revealed that HNSCC progression is closely related to several metabolic pathways, and energy metabolism may become a promising therapeutic target for HNSCC patients. 3 , 7 Nonetheless, for metabolism‐related genes (MRGs) that mediate metabolic reprogramming, their expression patterns and clinical values in HNSCC remain unclear. Therefore, systematically analyzing the characteristics and clinical significance of MRGs may be crucial for treating HNSCC.
In this study, by comprehensively analyzing the transcriptomic and clinical data of HNSCC samples, a metabolism‐related gene‐based prognostic signature (MRGPS) was formed and sufficiently validated in a variety of data sets. Afterward, this study explored the association of MRGPS with multiple clinicopathologic factors and constructed a prognostic nomogram. Interestingly, our gene set enrichment analysis (GSEA) concluded that MRGPS was tightly associated with the immune‐related pathways. Hence, we explored the relationships between MRGPS and tumor immune microenvironment (TIME) as well as anticancer immune response. Besides, we identified the potential compound specific to MRGPS. Figure 1 summarizes the experimental technical roadmap.
FIGURE 1.

Experimental technical roadmap. The whole process is divided into five steps: data collection, signature construction, verification of predictive potential, correlation analysis, and identification of potential compounds
2. METHODS
2.1. Collection of HNSCC sample information and MRGs
The Cancer Genome Atlas (TCGA) cohort (n = 502) from TCGA data portal and the GSE65858 cohort (n = 270) from Gene Expression Omnibus (GEO) were selected and used for collecting transcriptomic and clinical data of HNSCC samples. 8 , 9 Thereafter, at a random order, the entire TCGA cohort was subdivided into the TCGA training set (n = 251) and TCGA validation set (n = 251). The entire TCGA cohort and GSE65858 cohort were also applied as the internal testing set and external testing set, respectively. In the TCGA cohort, there were 413 human papillomaviruses (HPV) negative cases and 70 HPV‐positive cases, with 19 cases of unlabeled HPV status. Among the GSE65858 cohort, there were 196 HPV‐negative cases and 73 HPV‐positive cases, with 1 case of unlabeled HPV status. Table Figure S1 displayed patient demographics and clinical features of the included data sets. Furthermore, 1454 specifical MRGs involved in 69 metabolism‐related pathways were obtained from c2.cp.kegg.v7.2.symbols.gmt at the GSEA website. 10
2.2. Identification of DEMRGs
Using the thresholds of |log2(Fold Change)| >1 and p < 0.05, differentially expressed genes (DEGs) were identified between 502 HNSCC samples and 44 noncarcinoma samples with the use of R package “limma”. 11 Moreover, the differentially expressed metabolism‐related genes (DEMRGs) were subsequently extracted from all DEGs. The volcano plot and Venn diagram of DEMRGs were drawn with the use of the R package “ggplot2” 12 and an online tool (http://bioinformatics.psb.ugent.be/webtools/Venn/), respectively.
2.3. Construction of MRGs‐based prognostic signature (MRGPS) and functional enrichment analysis
The associations of DEMRGs with overall survival (OS) were analyzed using the univariate Cox proportional hazard regression model in the TCGA training set, followed by the identification of prognosis‐related DEMRGs with the cutoff of p < 0.05. Thereafter, the most optimal gene set was selected using the Least Absolute Shrinkage and Selection Operator (LASSO) penalized Cox proportional hazards regression through R package “glmnet.” Thereinto, the optimal gene set was used to construct the MRGPS, and the MRGs incorporated into the MRGPS were regarded as hub MRGs. In addition, differential expression of these hub MRGs was also confirmed through the Oncomine database. 13 Ultimately, the risk score of each HNSCC patient was determined by the following: risk score = [Gene 1 expression level × coefficient] + [Gene 2 expression level × coefficient] + … + [Gene n expression level × coefficient]. Later, all HNSCC patients were categorized as the low‐ or high‐risk group on the basis of the median risk score.
Besides, this study carried out the functional enrichment analysis with the purpose of investigating the biological roles of these hub MRGs, including Gene Ontology (GO) and Kyoto Encyclopedia of Genes and Genomes (KEGG) through the Database for Annotation, Visualization, and Integrated Discovery (DAVID) 6.8. Therefore, the GO terms consist of biological process (BP), molecular function (MF), and cellular component (CC). Using p < 0.05 as the screening criterion, the R package “ggplot2” was adopted for enriching and visualizing the GO terms and KEGG pathways.
2.4. Evaluation of MRGPS‐predictive capability
In order to evaluate the predictive capability of MRGPS, the Kaplan–Meier (K–M) survival curves of the low‐risk and high‐risk groups were plotted by R package “survival”. 14 In addition, the time‐dependent receiver‐operating characteristic (ROC) curves (containing 1‐, 3‐, and 5‐year survival) were plotted via R package “survival ROC,” aiming to determine the specificity and sensitivity of MRGPS. 15
2.5. Associations between MRGPS and clinicopathologic variables
In the entire TCGA and GSE65858 cohorts, R package “survival” was utilized for univariate and multivariate analyses of MRGPS and clinicopathologic variables on OS. 14 Besides, the relationships between MRGPS and clinicopathological variables were evaluated by independent t‐tests. Combining these clinicopathological variables with MRGPS, this study attempted to construct a prognostic nomogram via R package “rms,” aiming to quantitatively assess individual HNSCC patients’ survival probability. 16
2.6. Gene set enrichment analysis
GSEA has been developed as the calculation approach to determining the significant and consistent differences in a previously defined gene set between two distinct biological states (such as phenotypes). With the cutoff of FDR <0.25, GSEA analysis was performed to elucidate the enriched BPs, CCs, and MFs, together with the related KEGG pathways in the low‐ or high‐risk group.
2.7. Analysis of immune cell infiltration and immunotherapy efficacy
To analyze the association between MRGPS and immune cell infiltration, we adopted CIBERSORT to estimate the infiltration levels of 22 immune cell subtypes in the low‐ and high‐risk groups. 17 Meanwhile, the correlations of hub MRGs with immune cell infiltration were analyzed. In addition, the survival analysis was conducted to explore the relationship between the infiltration levels of 22 immune cell subtypes and the prognosis of HNSCC patients. Immunotherapy is a promising treatment strategy for HNSCC patients, which can be conceptualized as seven‐step anticancer immune responses via the TIP database (http://biocc.hrbmu.edu.cn/TIP/). 18 Therefore, we performed a correlation analysis between anticancer immune responses and MRGPS. Moreover, immune checkpoint inhibitor (ICI) is an essential component of immunotherapy, so we explored the differences in expressing several prominent immune checkpoints in both groups.
2.8. Connectivity map analysis
To identify the candidate compounds that target MRGPS, connectivity map (CMap) (https://portals.broadinstitute.org/cmap/), an online tool used to predict the compounds that activate or inhibit a previously defined gene signature in diverse cell lines, was adopted in this study. 19 With the pattern‐matching algorithms, a positive score represents the promoting effect of the compounds on the query signature, whereas a negative score indicates the inhibiting effect. Furthermore, the mechanism of actions (MoAs) information of these compounds was collected from the CMap tool “repurposing” (https://clue.io/repurposing‐app) in order to explore their shared MoAs.
2.9. Construction of the PPI network and molecular docking
With the purpose of screening the key target, all MRGPS‐related genes were mapped to the STRING database (https://string‐db.org/) to construct a protein–protein interaction (PPI) network, 20 followed by the topological analysis based on the Network Analyzer plug‐in contained in Cytoscape. Besides, molecular docking was carried out to screen candidate compounds. Schrodinger’s Glide module was applied for molecular docking, and MM‐GBSA analysis was applied to calculate the relative binding free energy of candidate compounds with the key target. 21
2.10. Statistical analysis
The R package “survival” was used for univariate and multivariate Cox regression analyses. 14 The hazard ratios together with the corresponding 95% confidence intervals were collected. In addition, an independent t test was adopted for comparing the heterogeneities among diverse clinical factors. A difference of p < 0.05 was regarded to present statistical significance.
3. RESULTS
3.1. Construction of MRGPS
By comparing HNSCC samples and normal samples, we obtained 4788 DEGs. Meanwhile, we acquired 1454 MRGs via the GSEA website. Ultimately, altogether 261 DEMRGs were extracted, among which, 146 showed upregulation, whereas 115 presented downregulation (Figure 2A,B).
FIGURE 2.

Establishment of MRGPS and enrichment analysis of hub MRGs. (A) Volcano plot regarding the DEMRGs in HNSCC samples versus normal samples. (B) Venn diagram visualizing the intersections of DEGs with MRGs. (C) LASSO coefficient profiles in LASSO Cox regression analysis. (D) Screening of the tuning parameter (lambda) from the LASSO model through 10‐fold cross‐validation according to the minimal OS threshold. (E) Established coefficient of hub MRGs used for MRGPS. (F) GO enrichment analysis for the 12 identified hub MRGs. The green, blue, and orange modules stand for BP, CC, and MF terms, separately. (G) KEGG enrichment analysis of 12 hub MRGs. BP, biological process; CC, cellular component; DEGs, differentially expressed genes; DEMRGs, differentially expressed metabolism‐related genes; GO, Gene Ontology; HNSCC, head and neck squamous cell carcinoma; LASSO, Least Absolute Shrinkage and Selection Operator; MF, molecular function; MRGPS, metabolism‐related gene‐based prognostic signature; MRGs, metabolism‐related genes; OS, overall survival
There were 38 DEMRGs in the TCGA training set significantly associated with OS of HNSCC cases (p < 0.05, Table S2). The most appropriate tuning parameter (lambda) from the LASSO model was chosen to prevent overfitting (Figure 2C,D), which contributed to the production of the optimal model. In total, 12 genes were selected to as hub MRGs, including PIP5K1B (Phosphatidylinositol‐4‐phosphate 5‐kinase type‐1 beta), ADA (adenosine deaminase), KYNU (Kynureninase), P4HA1 (Prolyl 4‐hydroxylase subunit alpha‐1), MTHFD2 (Methylenetetrahydrofolate dehydrogenase 2), HPRT1 (hypoxanthine phosphoribosyltransferase 1), ALG3 (alpha‐1,3‐ mannosyltransferase), PYGL (Glycogen phosphorylase L), DNMT1 (DNA methyltransferase 1), POLE2 (DNA polymerase epsilon 2), PDE6G (phosphodiesterase 6G), and CYP2D6 (cytochrome P450 family 2 subfamily D member 6) (Figure 2E). Their expression was markedly upregulated in diverse tumor tissues compared with that in noncarcinoma tissues (Figure S1). Afterward, the MRGPS was established based on these 12 hub MRGs expression profiles and their Cox regression coefficients as follows: risk score = [PIP5K1B expression level × 0.033363] + [ADA expression level × 0.024469] + [KYNU expression level × 0.013974] + [P4HA1 expression level × 0.012453] + [MTHFD2 expression level × 0.010309] + [HPRT1 expression level × 0.010282] + [ALG3 expression level × 0.005389] + [PYGL expression level × 0.004299] + [DNMT1 expression level × (−0.014064)] + [POLE2 expression level × (−0.077976)] + [PDE6G expression level × (− 0.081091)] + [CYP2D6 expression level × (−0.160250)].
In the functional enrichment analysis of these 12 hub MRGs, the most significantly enriched term in the aspect of BP, CC, and MF was “hypoxanthine salvage,” “cytosol,” and “pyridoxal phosphate binding,” respectively (Figure 2F), whereas the significantly enriched KEGG pathways were “metabolic pathways” and “purine metabolism” (Figure 2G).
3.2. Evaluation of the MRGPS predicting ability in different data sets
Based on the established MRGPS, we calculated the risk score for each HNSCC patient and classified all HNSCC patients into the low‐ or high‐risk group in accordance with the median risk score (0.049) (Figure 3A). According to our results, the low‐risk group presented favorable survival in comparison with the high‐risk group in multiple data sets (Figure 3B, p < 0.05). Furthermore, the time‐dependent ROC curves were plotted to evaluate the predicted performance of MRGPS (Figure 3C). It was calculated that the area under the curve values for 1‐, 3‐, and 5‐year survival were 0.697, 0.727, and 0.679, separately, in the TCGA training set, indicating that MRGPS performed well in monitoring survival. In the meanwhile, MRGPS was highly accurate in predicting survival of TCGA validation set, entire TCGA cohort, and GSE65858 cohort.
FIGURE 3.

MRGPS accurately predicts the survival of HNSCC patients. Distribution of risk scores, survival status, as well as expression levels of 12 hub MRGs for HNSCC patients in low‐ and high‐risk groups (A), KM survival (B), and time‐dependent ROC curve (C) analyses of the TCGA training set, TCGA validation set, entire TCGA cohort, and GSE65858 cohort. HNSCC, head and neck squamous cell carcinoma; MRGPS, metabolism‐related gene‐based prognostic signature; MRGs, metabolism‐related genes; ROC, receiver‐operating characteristic; TCGA, The Cancer Genome Atlas
3.3. Relationships of MRGPS with patient prognosis and clinicopathologic variables
To explore the association of MRGPS and clinicopathologic variables with OS, we carried out Cox proportional hazards regression analysis on the entire TCGA cohort and the GSE65858 cohort. It was illustrated from Figure 4A,B that MRGPS was obviously related to OS in both univariate and multivariate analyses (p < 0.001), which showed that MRGPS might play the role of a factor in independently predicting the prognosis in the entire TCGA cohort along with GSE65858 cohort. Noteworthily, HPV status was also significantly correlated with OS in the GSE65858 cohort (Figure 4B). In addition, we explored the potential associations of MRGPS with multiple clinicopathologic variables. The risk score markedly increased in cases at advanced tumor status, T grade, and pathological stage in the entire TCGA cohort (p < 0.05, Figure 4C). Besides, the elderly cases, HPV‐negative cases, and those at advanced T stage in the GSE65858 cohort generally had high‐risk scores (p < 0.05, Figure 4D). According to the above results, MRGPS showed a significant correlation with several clinicopathologic variables.
FIGURE 4.
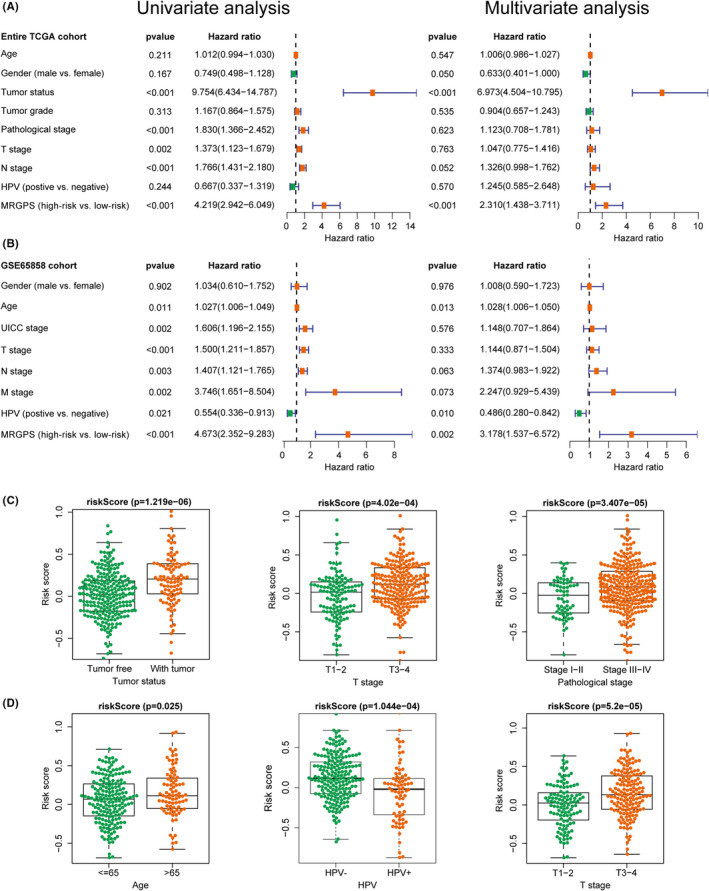
MRGPS is an independent prognostic indicator for HNSCC patients. Forest plot for univariate and multivariate Cox regression analyses of MRGPS and multiple clinicopathological variables in the entire TCGA cohort (A) and GSE65858 cohort (B). The correlations between the MRGPS and multiple clinicopathological variables in the entire TCGA cohort (C) and GSE65858 cohort (D). HNSCC, head and neck squamous cell carcinoma; MRGPS, metabolism‐related gene‐based prognostic signature; TCGA, The Cancer Genome Atlas
Furthermore, we constructed a prognostic nomogram based on MRGPS and multiple clinicopathological variables, with the purpose of quantitatively estimating the survival probability among individual cases (Figure S2A). Typically, the calibration curves of our constructed prognostic nomogram were well consistent between the predicted and measured 1‐, 3‐, and 5‐year survivals in the entire TCGA cohort (Figure S2B–D).
3.4. Functional enrichment analysis by GSEA
To further study the underlying mechanism related to MRGPS, functional enrichment analysis was performed between high‐ and low‐risk groups via GSEA. The most significantly enriched BP in the high‐risk group was the “glycolytic process through fructose‐6‐phosphate” (Figure 5A). Intriguingly, in the low‐risk group, enriched BPs were closely correlated with immune response, such as “CD4 positive T cell activation,” “CD4 positive T cell differentiation,” and “T cell activation involved in immune response” (Figure 5A). In terms of CC (Figure 5B), the “T cell receptor complex” was the most obviously enriched component in the low‐risk group, further demonstrating that MRGPS was tightly related to immune response. In terms of MF, metabolism‐related terms were significantly enriched, including “acylglycerol 3 phosphate o acyltransferase activity,” “protein serine‐threonine kinase inhibitor activity,” and “steroid hydroxylase activity” (Figure 5C). Besides, GSEA‐enriched results of KEGG pathways revealed that several metabolism‐associated pathways were enriched in the high‐risk group, such as the “pentose phosphate pathway,” “galactose metabolism,” and “purine metabolism” (Figure 5D). In the low‐risk group, except for “arachidonic acid metabolism,” several immune‐related pathways were enriched, such as “T cell receptor and B cell receptor signaling pathways”, also indicating that MRGPS might be significantly associated with the immune response (Figure 5D).
FIGURE 5.

The enriched GO terms and KEGG pathways detected by GSEA. The representative GO terms of BP (A), CC (B), and MF (C) enriched in the high‐ and low‐risk group. (D) The representative KEGG pathways enriched in the high‐ and low‐risk groups. BP, biological process; CC, cellular component; GO, Gene Ontology; GSEA, gene set enrichment analysis; KEGG, Kyoto Encyclopedia of Genes and Genomes; MF, molecular function
3.5. Relationships of MRGPS with immune cells infiltration and immunotherapy
To further explore the relevance of MRGPS to immune response, the infiltration levels of 22 immune cell subtypes in all HNSCC samples were assessed by CIBERSORT. As shown in Figure 6A, the relative abundances of naive B cells, plasma cells, CD8 T cells, activated memory CD4 T cells, follicular helper T cells, and resting mast cells were significantly negatively correlated with a risk score, whereas those of resting NK cells, M0 and M2 macrophages were significantly positively correlated with risk score (p < 0.05). In addition, the prognostic value of these 22 immune cell subtypes was also analyzed. As a result, the infiltration levels of B cells, plasma cells, resting mast cells, as well as activated mast cells were markedly associated with survival rate (p < 0.05, Figure 6B). The increased infiltration levels of naive B cells, plasma cells, and resting mast cells predicted favorable OS, whereas that of activated mast cells predicted dismal OS. Besides, we explored the correlation between HPV status and immune cell infiltration, finding that HPV+ patients have more immune cell infiltration and better prognosis than HPV‐ patients (Figure S3).
FIGURE 6.

Relationship of MRGPS with tumor immune microenvironment. (A) Association between MRGPS and immune cell infiltration. The green and orange violins represented the low‐ and high‐risk groups, respectively. The white points inside the violin indicated median values. (B) Association of OS with naive B cells, plasma cells, resting mast cells, and activated mast cells. (C) Correlation matrix regarding MRGPS with the anticancer immune responses, where the red and blue dots represent positive and negative correlations, respectively. (D) The relationships between MRGPS and the expression of several major immune checkpoints. *, **, and *** represent p < 0.05, p < 0.01, and p < 0.001, respectively. MRGPS, metabolism‐related gene‐based prognostic signature; OS, overall survival
The status of anticancer immune responses is an important part of the complex tumor immunophenotype underlying the tumor microenvironment. Therefore, we further analyzed the correlation between MRGPS and anticancer immune responses. It was illustrated from Figure 6C that MRGPS exhibited a negative correlation with T cell recruiting, CD4 T cell recruiting, Th22 cell recruiting, as well as priming and activation of immune (p < 0.05). Besides, ICI was a key component of immunotherapy. Therefore, we further investigated the associations between MRGPS and certain key immune checkpoints’ expression. As a result, the low‐risk group had higher levels of CTLA‐4, PD‐1, LAG‐3, and TIGIT compared with the high‐risk group (Figure 6D). Above all, MRGPS is correlated with immune cells infiltration and anticancer immune response to some extent.
3.6. Potential compounds targeting MRGPS
In order to find out the potential compounds that target MRGPS, CMap analysis was conducted. According to the obtained results, a total of 34 compounds have the potential to reverse MRGPS (Figure 7A). Moreover, we constructed a PPI network using the genes associated with the signature and identified HPRT1 as a key target (Figure 7B and Table S3). For this key target, 34 candidate compounds were adopted for molecular docking with it. As shown in Figure 7C, we found the top 10 compounds among which cephaeline ranked first. The interaction diagram of cephaeline at the active site of HRPT1 showed hydrogen bonds’ formation with the key residues ASP‐43 and TYR‐80 (Figure 7D). Meanwhile, pi–pi stacking interactions with ARG‐86 and TRY‐80 also made contributions to stabilizing the ligand at the active sites. Apart from that, the relative binding free energy of cephaeline to the key target HPRT1 was also the lowest, indicating that their binding was stable. Therefore, we believe that cephaeline may be a potential therapeutic compound for HNSCC, which is worthy of further study.
FIGURE 7.

Screening of potential compounds. (A) Enrichment score of each potential compound from the Connectivity Map analysis. (B) The PPI network of MRGPS. (C) Top 10 compounds binding to key target HPRT1 based on molecular docking. (D) Structure and orthogonal view of the binding pocket between cephaeline and key target HPRT1. HPRT1, hypoxanthine phosphoribosyltransferase 1; MRGPS, metabolism‐related gene‐based prognostic signature; PPI, protein–protein interaction
4. DISCUSSION
Extensive studies have shown that cancer cells have abnormal metabolic behaviors such as the Warburg effect. 22 Metabolic reprogramming is a vital hallmark in the development of cancer, which can facilitate cancer cell proliferation and invasion. 23 Enhanced glycolysis is one of the characteristic features of HNSCC, and thus [18F]‐fluorodeoxyglucose‐positron emission tomography (FDG‐PET) that can reflect the glucose uptake is often used for clinical diagnosis and evaluation of HNSCC patients. 24 Besides, frequent mutation of P53 was found in HNSCC, which regulates the glycolysis pathway by inhibiting glucose intake, glycolysis flow, pentose phosphate pathway, and other pathways. 3 Given the above, targeting energetic metabolism as an anticancer therapy is promising for HNSCC treatment.
In the present study, the expression of MRGs, together with their prognostic significance in HNSCC cases, was analyzed based on transcriptomic data. As a result, 12 MRGs were identified as hub MRGs and adopted for constructing MRGPS. Therefore, P4HA1 was upregulated and significantly relevant to the clinical features of HNSCC. 25 Besides, ALG3 may play a key role in the oncogene expression in HNSCC, and its combined overexpression with PPFIA1 is significantly associated with poor survival outcomes. 26 Some genes, such as CYP2D6, 27 POLE2, 28 DNMT1, 29 , 30 MTHFD2, 31 , 32 and PYGL, 33 have also been suggested to present significant associations with cancer prognostic outcomes. Although the other five genes have not been explored in HNSCC, their biological roles in HNSCC need to be further explored. Based on the median risk score (0.049), we classified HNSCC cases into the low‐ or high‐risk group. The obtained findings demonstrated that low‐risk patients had superior survival to high‐risk patients. Time‐dependent ROC curves revealed that MRGPS had a high potential for predicting survival. Besides, univariate or multivariate analysis indicated that MRGPS was an independent prognostic indicator.
Among the pathogenic factors of HNSCC, HPV infection is another crucial risk factor in addition to smoking and alcohol consumption. It is reported that HPV+ HNSCC patients tend to be slightly younger, male, and primarily non‐smokers. 34 In addition, HPV+ HNSCC patients were often regarded as closely associated with improved prognosis than HPV− patients. 35 Consistent with these reports, in the present study, HPV status was also significantly correlated with OS in the GSE65858 cohort in both univariate and multivariate analyses. Besides, HPV‐negative cases generally had higher risk scores than HPV‐positive cases. Therefore, HPV status was also included in the nomogram, which helps to predict patients’ survival better.
GSEA is a powerful tool for exploring the potential molecular mechanisms between different samples. By performing GSEA analysis, some metabolism‐associated pathways, such as “pentose phosphate pathway” and “purine metabolism,” were found to be enriched in the high‐risk group, whereas “arachidonic acid metabolism” was enriched in the low‐risk group. Notably, purine metabolism has been suggested to be associated with cancer progression, and purine nucleotides play crucial roles in providing cellular energy and intracellular signaling. 36 Additionally, regulating the metabolism of arachidonic acid helps to regulate the occurrence of active inflammatory mediators. Noteworthily, low‐risk patients were associated with some immune pathways, which suggested that MRGPS might have an important connection with immune response. In recent years, numerous landmark studies have found that changes in metabolism may exert a vital part in immune regulation. 37 , 38 The abnormal metabolism of cancer cells can profoundly influence the tumor microenvironment that is commonly acidic, hypoxic, and depleted of essential nutrients necessary for immune cells. 39 Furthermore, aerobic glycolysis within cancer cells assists in shaping the immune system through upregulating cytokine transcription while suppressing monocytes’ differentiation to dendritic cells. 40 In addition, for immune cells themselves, metabolism is also a crucial determinant of viability and functions. As a result, metabolism is closely related to immunity, and the establishment of a metabolism‐related prognostic signature may contribute to predicting the state of the immune response.
To better explore the association of the MRGPS with immunity, this study compared TIME in the high‐risk group with that in the low‐risk group. As a result, the infiltration levels of a majority of immune cell subtypes, such as naive B cells, CD8 T cells, and activated memory CD4 T cells, enhanced in the low‐risk group in comparison with those in the high‐risk group. In further analyses, it could be discovered that the higher infiltration levels of naive B cells, plasma cells, and resting mast cells were associated with better OS, whereas the increased infiltration level of activated mass cells predicted dismal OS. These results were consistent with previous reports, pointing out that the metabolically active tumor cells created a detrimental microenvironment for immune cells. 41 The anticancer immune response is another vital part of the complex tumor immunophenotype underlying the TIME. The abnormal metabolism possibly results in a diverse prognosis through altering immune cell state within TIME. This conforms to the report that targeted metabolism can be conducive to regulating the antitumor immune response.
Some strengths should be noted in the present work. First of all, this is the first constructed signature based on metabolic reprogramming that can reflect the prognosis and TIME of HNSCC patients. Second, multiple data sets were adopted for validating and evaluating the predictive performance of our constructed signature. Third, we identified the potential compound that targeted our constructed signature. Nevertheless, further prospective cohort studies should be conducted to assess the clinical value of this prognostic signature. Meanwhile, the potential compound needs to be further explored in the future.
5. CONCLUSIONS
In summary, we conducted a comprehensive analysis of the expression patterns of MRGs in HNSCC patients and established an MRGs‐based signature that has the potential to predict the clinical outcome and immune microenvironment. As an effective tool, this signature may help to search for potential combination immunotherapy compounds and provide a promising therapeutic strategy for treating HNSCC patients.
CONFLICT OF INTEREST
The authors declare that they have no competing interests.
AUTHOR CONTRIBUTIONS
Weijie Qiang, Yifei Dai, and Xiaobo Sun conceived the study; Weijie Qiang and Yifei Dai designed and performed the experiments; Weijie Qiang wrote the manuscript; Yifei Dai and Xiaoyan Xing edited the manuscript; all authors read and gave final approval to submit the manuscript.
ETHICAL APPROVAL STATEMENT
All analyses were based on previously published studies, thus no ethical approval and patient consent are required.
Supporting information
Figure S1
Figure S2
Figure S3
Table S1
Table S2
Table S3
ACKNOWLEDGMENTS
This study was supported by the Major Program of the National Natural Science Foundation of China (Nos. 81891012 and U1812403‐5‐3) and CAMS Innovation Fund for Medical Sciences (CIFMS) (No. 2021‐I2M‐1‐031).
Qiang W, Dai Y, Xing X, Sun X. Identification of a metabolic reprogramming‐related signature associated with prognosis and immune microenvironment of head and neck squamous cell carcinoma by in silico analysis. Cancer Med. 2022;11:3168–3181. doi: 10.1002/cam4.4670
DATA AVAILABILITY STATEMENT
The data used to support the findings of this study are available from the TCGA (https://portal.gdc.cancer.gov/) and GEO data sets (https://www.ncbi.nlm.nih.gov/gds/).
REFERENCES
- 1. Bray F, Ferlay J, Soerjomataram I, Siegel RL, Torre LA, Jemal A. Global cancer statistics 2018: GLOBOCAN estimates of incidence and mortality worldwide for 36 cancers in 185 countries. CA Cancer J Clin. 2018;68:394‐424. doi: 10.3322/caac.21492 [DOI] [PubMed] [Google Scholar]
- 2. Jou A, Hess J. Epidemiology and molecular biology of head and neck cancer. Oncol Res Treat. 2017;40:328‐332. doi: 10.1159/000477127 [DOI] [PubMed] [Google Scholar]
- 3. Yamamoto M, Inohara H, Nakagawa T. Targeting metabolic pathways for head and neck cancers therapeutics. Cancer Metastasis Rev. 2017;36:503‐514. doi: 10.1007/s10555-017-9691-z [DOI] [PubMed] [Google Scholar]
- 4. Vander Heiden MG, DeBerardinis RJ. Understanding the intersections between metabolism and cancer biology. Cell. 2017;168:657‐669. doi: 10.1016/j.cell.2016.12.039 [DOI] [PMC free article] [PubMed] [Google Scholar]
- 5. Hemaiswarya S, Doble M. Combination of phenylpropanoids with 5‐fluorouracil as anti‐cancer agents against human cervical cancer (HeLa) cell line. Phytomedicine. 2013;20:151‐158. doi: 10.1016/j.phymed.2012.10.009 [DOI] [PubMed] [Google Scholar]
- 6. Lin JM, Li B, Rimmer E, VanRoey M, Jooss K. Enhancement of the anti‐tumor efficacy of a GM‐CSF‐secreting tumor cell immunotherapy in preclinical models by cytosine arabinoside. Exp Hematol. 2008;36:319‐328. doi: 10.1016/j.exphem.2007.11.005 [DOI] [PubMed] [Google Scholar]
- 7. Cruz‐Gregorio A, Martínez‐Ramírez I, Pedraza‐Chaverri J, Lizano M. Reprogramming of energy metabolism in response to radiotherapy in head and neck squamous cell carcinoma. Cancers (Basel). 2019;11:182. doi: 10.3390/cancers11020182 [DOI] [PMC free article] [PubMed] [Google Scholar]
- 8. Weinstein JN, Collisson EA, Mills GB, et al. The cancer genome atlas pan‐cancer analysis project. Nat Genet. 2013;45:1113‐1120. doi: 10.1038/ng.2764 [DOI] [PMC free article] [PubMed] [Google Scholar]
- 9. Wang Y, Gao B, Tan PY, et al. Genome‐wide CRISPR knockout screens identify NCAPG as an essential oncogene for hepatocellular carcinoma tumor growth. FASEB J. 2019;33:8759‐8770. doi: 10.1096/fj.201802213RR [DOI] [PMC free article] [PubMed] [Google Scholar]
- 10. Subramanian A, Tamayo P, Mootha VK, et al. Gene set enrichment analysis: a knowledge‐based approach for interpreting genome‐wide expression profiles. Proc Natl Acad Sci USA. 2005;102:15545‐15550. doi: 10.1073/pnas.0506580102 [DOI] [PMC free article] [PubMed] [Google Scholar]
- 11. Ritchie ME, Phipson B, Wu D, et al. Limma powers differential expression analyses for RNA‐sequencing and microarray studies. Nucleic Acids Res. 2015;43:e47. doi: 10.1093/nar/gkv007 [DOI] [PMC free article] [PubMed] [Google Scholar]
- 12. Ginestet C. ggplot2: elegant graphics for data analysis. J R Stat Soc Ser A. 2011;174:245‐246. doi: 10.1111/j.1467-985x.2010.00676_9.x [DOI] [Google Scholar]
- 13. Rhodes DR, Yu J, Shanker K, et al. ONCOMINE: a cancer microarray database and integrated data‐mining platform. Neoplasia. 2004;6:1‐6. doi: 10.1016/s1476-5586(04)80047-2 [DOI] [PMC free article] [PubMed] [Google Scholar]
- 14. Therneau TM. A package for survival analysis in S. Version 2.38. CRAN website. 2015. http://cran.r-project.org/package=survival. Accessed December 2021.
- 15. Heagerty PJ, Lumley T, Pepe MS. Time‐dependent ROC curves for censored survival data and a diagnostic marker. Biometrics. 2000;56:337‐344. doi: 10.1111/j.0006-341X.2000.00337.x [DOI] [PubMed] [Google Scholar]
- 16. Harrell FE Jr rms: regression modeling strategies. R package version 5.0‐0. CRAN. 2016.
- 17. Newman AM, Liu CL, Green MR, et al. Robust enumeration of cell subsets from tissue expression profiles. Nat Methods. 2015;12:453‐457. doi: 10.1038/nmeth.3337 [DOI] [PMC free article] [PubMed] [Google Scholar]
- 18. Xu L, Deng C, Pang B, et al. Tip: a web server for resolving tumor immunophenotype profiling. Cancer Res. 2018;78:6575‐6580. doi: 10.1158/0008-5472.CAN-18-0689 [DOI] [PubMed] [Google Scholar]
- 19. Lamb J, Crawford ED, Peck D, et al. The connectivity map: using gene‐expression signatures to connect small molecules, genes, and disease. Science. 2006;313:1929‐1935. doi: 10.1126/science.1132939 [DOI] [PubMed] [Google Scholar]
- 20. Szklarczyk D, Gable AL, Lyon D, et al. STRING v11: protein‐protein association networks with increased coverage, supporting functional discovery in genome‐wide experimental datasets. Nucleic Acids Res. 2019;47:D607‐D613. doi: 10.1093/nar/gky1131 [DOI] [PMC free article] [PubMed] [Google Scholar]
- 21. Friesner RA, Murphy RB, Repasky MP, et al. Extra precision glide: docking and scoring incorporating a model of hydrophobic enclosure for protein‐ligand complexes. J Med Chem. 2006;49:6177‐6196. doi: 10.1021/jm051256o [DOI] [PubMed] [Google Scholar]
- 22. Heiden MGV, Cantley LC, Thompson CB. Understanding the warburg effect: the metabolic requirements of cell proliferation. Science. 2009;324:1029‐1033. doi: 10.1126/science.1160809 [DOI] [PMC free article] [PubMed] [Google Scholar]
- 23. Peltanova B, Raudenska M, Masarik M. Effect of tumor microenvironment on pathogenesis of the head and neck squamous cell carcinoma: a systematic review. Mol Cancer. 2019;18:63. doi: 10.1186/s12943-019-0983-5 [DOI] [PMC free article] [PubMed] [Google Scholar]
- 24. Cammaroto G, Quartuccio N, Sindoni A, et al. The role of PET/CT in the management of patients affected by head and neck tumors: a review of the literature. Eur Arch Otorhinolaryngol. 2016;273:1961‐1973. [DOI] [PubMed] [Google Scholar]
- 25. Li M, Wu F, Zheng Q, Wu Y, Wu Y'. Identification of potential diagnostic and prognostic values of P4HA1 expression in lung cancer, breast cancer, and head and neck cancer. DNA Cell Biol. 2020;39:909‐917. doi: 10.1089/dna.2019.5170 [DOI] [PubMed] [Google Scholar]
- 26. Zhou H, Cao T, Li WP, Wu G. Combined expression and prognostic significance of PPFIA1 and ALG3 in head and neck squamous cell carcinoma. Mol Biol Rep. 2019;46:2693‐2701. doi: 10.1007/s11033-019-04712-y [DOI] [PubMed] [Google Scholar]
- 27. He W, Grassmann F, Eriksson M, et al. CYP2D6 genotype predicts tamoxifen discontinuation and prognosis in patients with breast cancer. J Clin Oncol. 2020;38:548‐557. doi: 10.1200/JCO.19.01535 [DOI] [PMC free article] [PubMed] [Google Scholar]
- 28. Wu Z, Wang YM, Dai Y, Chen LA. POLE2 serves as a prognostic biomarker and is associated with immune infiltration in squamous cell lung cancer. Med Sci Monit. 2020;26:e921430. doi: 10.12659/MSM.921430 [DOI] [PMC free article] [PubMed] [Google Scholar]
- 29. Ma T, Li H, Sun M, Yuan Y, Sun LP. DNMT1 overexpression predicting gastric carcinogenesis, subsequent progression and prognosis: a meta and bioinformatic analysis. Oncotarget. 2017;8:96396‐96408. doi: 10.18632/oncotarget.21480 [DOI] [PMC free article] [PubMed] [Google Scholar]
- 30. Maric H, Supic G, Kandolf‐Sekulovic L, et al. DNMT1 and DNMT3B genetic polymorphisms affect the clinical course and outcome of melanoma patients. Melanoma Res. 2019;29:596‐602. doi: 10.1097/CMR.0000000000000612 [DOI] [PubMed] [Google Scholar]
- 31. Liu F, Liu Y, He C, et al. Increased MTHFD2 expression is associated with poor prognosis in breast cancer. Tumour Biol. 2014;35:8685‐8690. doi: 10.1007/s13277-014-2111-x [DOI] [PubMed] [Google Scholar]
- 32. Wang J, Luo J, Sun Z, Sun F, Kong Z, Yu J. Identification of MTHFD2 as a novel prognosis biomarker in esophageal carcinoma patients based on transcriptomic data and methylation profiling. Medicine (Baltimore). 2020;99:e22194. doi: 10.1097/MD.0000000000022194 [DOI] [PMC free article] [PubMed] [Google Scholar]
- 33. Chen J, Cao S, Situ B, et al. Metabolic reprogramming‐based characterization of circulating tumor cells in prostate cancer. J Exp Clin Cancer Res. 2018;37:127. [DOI] [PMC free article] [PubMed] [Google Scholar]
- 34. Koneva LA, Zhang Y, Virani S, et al. HPV integration in HNSCC correlates with survival outcomes, immune response signatures, and candidate drivers. Mol Cancer Res. 2018;16:90‐102. doi: 10.1158/1541-7786.MCR-17-0153 [DOI] [PMC free article] [PubMed] [Google Scholar]
- 35. Solomon B, Young RJ, Rischin D. Head and neck squamous cell carcinoma: genomics and emerging biomarkers for immunomodulatory cancer treatments. Semin Cancer Biol. 2018;52:228‐240. [DOI] [PubMed] [Google Scholar]
- 36. Pedley AM, Benkovic SJ. A new view into the regulation of purine metabolism: the purinosome. Trends Biochem Sci. 2017;42:141‐154. doi: 10.1016/j.tibs.2016.09.009 [DOI] [PMC free article] [PubMed] [Google Scholar]
- 37. Kishton RJ, Sukumar M, Restifo NP. Metabolic regulation of T cell longevity and function in tumor immunotherapy. Cell Metab. 2017;26:94‐109. doi: 10.1016/j.cmet.2017.06.016 [DOI] [PMC free article] [PubMed] [Google Scholar]
- 38. Loftus RM, Finlay DK. Immunometabolism: cellular metabolism turns immune regulator. J Biol Chem. 2016;291:1‐10. doi: 10.1074/jbc.R115.693903 [DOI] [PMC free article] [PubMed] [Google Scholar]
- 39. Leone RD, Powell JD. Metabolism of immune cells in cancer. Nat Rev Cancer. 2020;20:516‐531. doi: 10.1038/s41568-020-0273-y [DOI] [PMC free article] [PubMed] [Google Scholar]
- 40. Ghesquière B, Wong BW, Kuchnio A, Carmeliet P. Metabolism of stromal and immune cells in health and disease. Nature. 2014;511:167‐176. doi: 10.1038/nature13312 [DOI] [PubMed] [Google Scholar]
- 41. Cerezo M, Rocchi S. Cancer cell metabolic reprogramming: a keystone for the response to immunotherapy. Cell Death Dis. 2020;11:964. doi: 10.1038/s41419-020-03175-5 [DOI] [PMC free article] [PubMed] [Google Scholar]
Associated Data
This section collects any data citations, data availability statements, or supplementary materials included in this article.
Supplementary Materials
Figure S1
Figure S2
Figure S3
Table S1
Table S2
Table S3
Data Availability Statement
The data used to support the findings of this study are available from the TCGA (https://portal.gdc.cancer.gov/) and GEO data sets (https://www.ncbi.nlm.nih.gov/gds/).